
llms-full.md 3.3 MB
TRANSLATED CONTENT: ===== PAGE: https://docs.tigerdata.com/getting-started/try-key-features-timescale-products/ =====
Try the key features in Tiger Data products
Tiger Cloud offers managed database services that provide a stable and reliable environment for your applications.
Each Tiger Cloud service is a single optimised Postgres instance extended with innovations such as TimescaleDB in the database engine, in a cloud infrastructure that delivers speed without sacrifice. A radically faster Postgres for transactional, analytical, and agentic workloads at scale.
Tiger Cloud scales Postgres to ingest and query vast amounts of live data. Tiger Cloud provides a range of features and optimizations that supercharge your queries while keeping the costs down. For example:
- The hypercore row-columnar engine in TimescaleDB makes queries up to 350x faster, ingests 44% faster, and reduces storage by 90%.
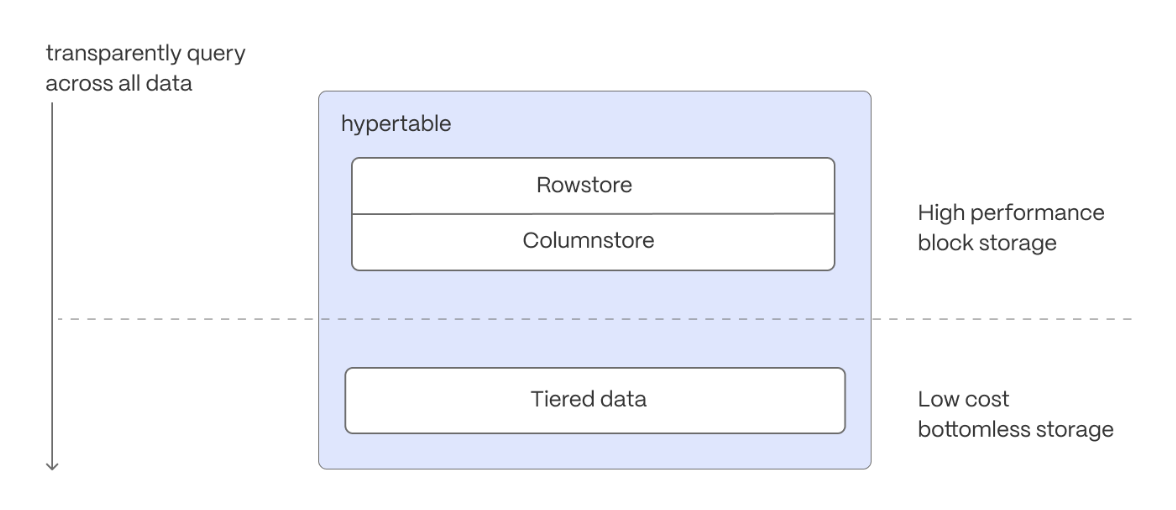
- Tiered storage in Tiger Cloud seamlessly moves your data from high performance storage for frequently accessed data to low cost bottomless storage for rarely accessed data.
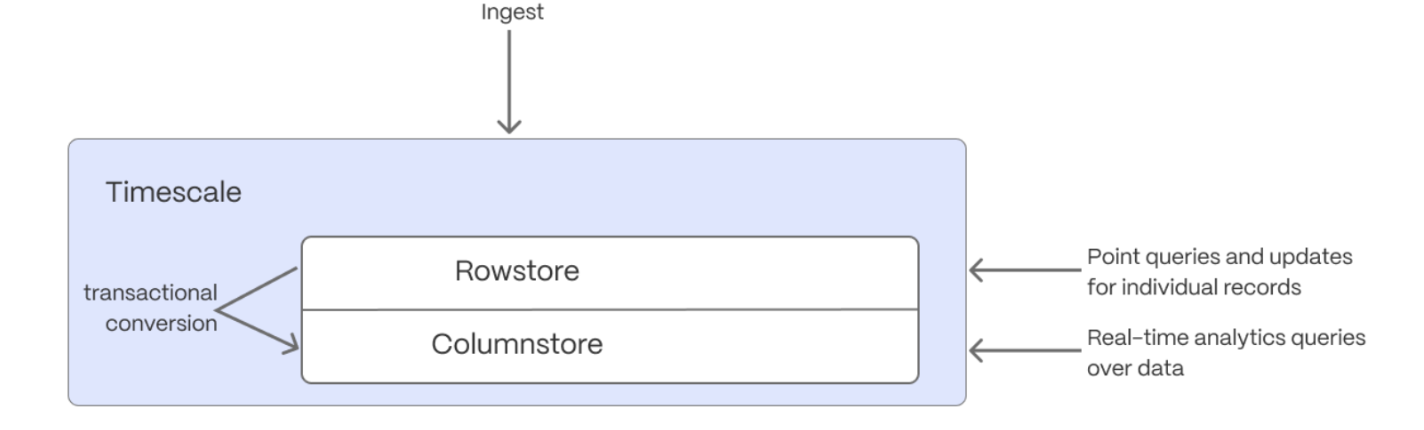
The following figure shows how TimescaleDB optimizes your data for superfast real-time analytics:
This page shows you how to rapidly implement the features in Tiger Cloud that enable you to ingest and query data faster while keeping the costs low.
Prerequisites
To follow the steps on this page:
- Create a target Tiger Cloud service with the Real-time analytics capability.
You need your connection details. This procedure also works for self-hosted TimescaleDB.
Optimize time-series data in hypertables with hypercore
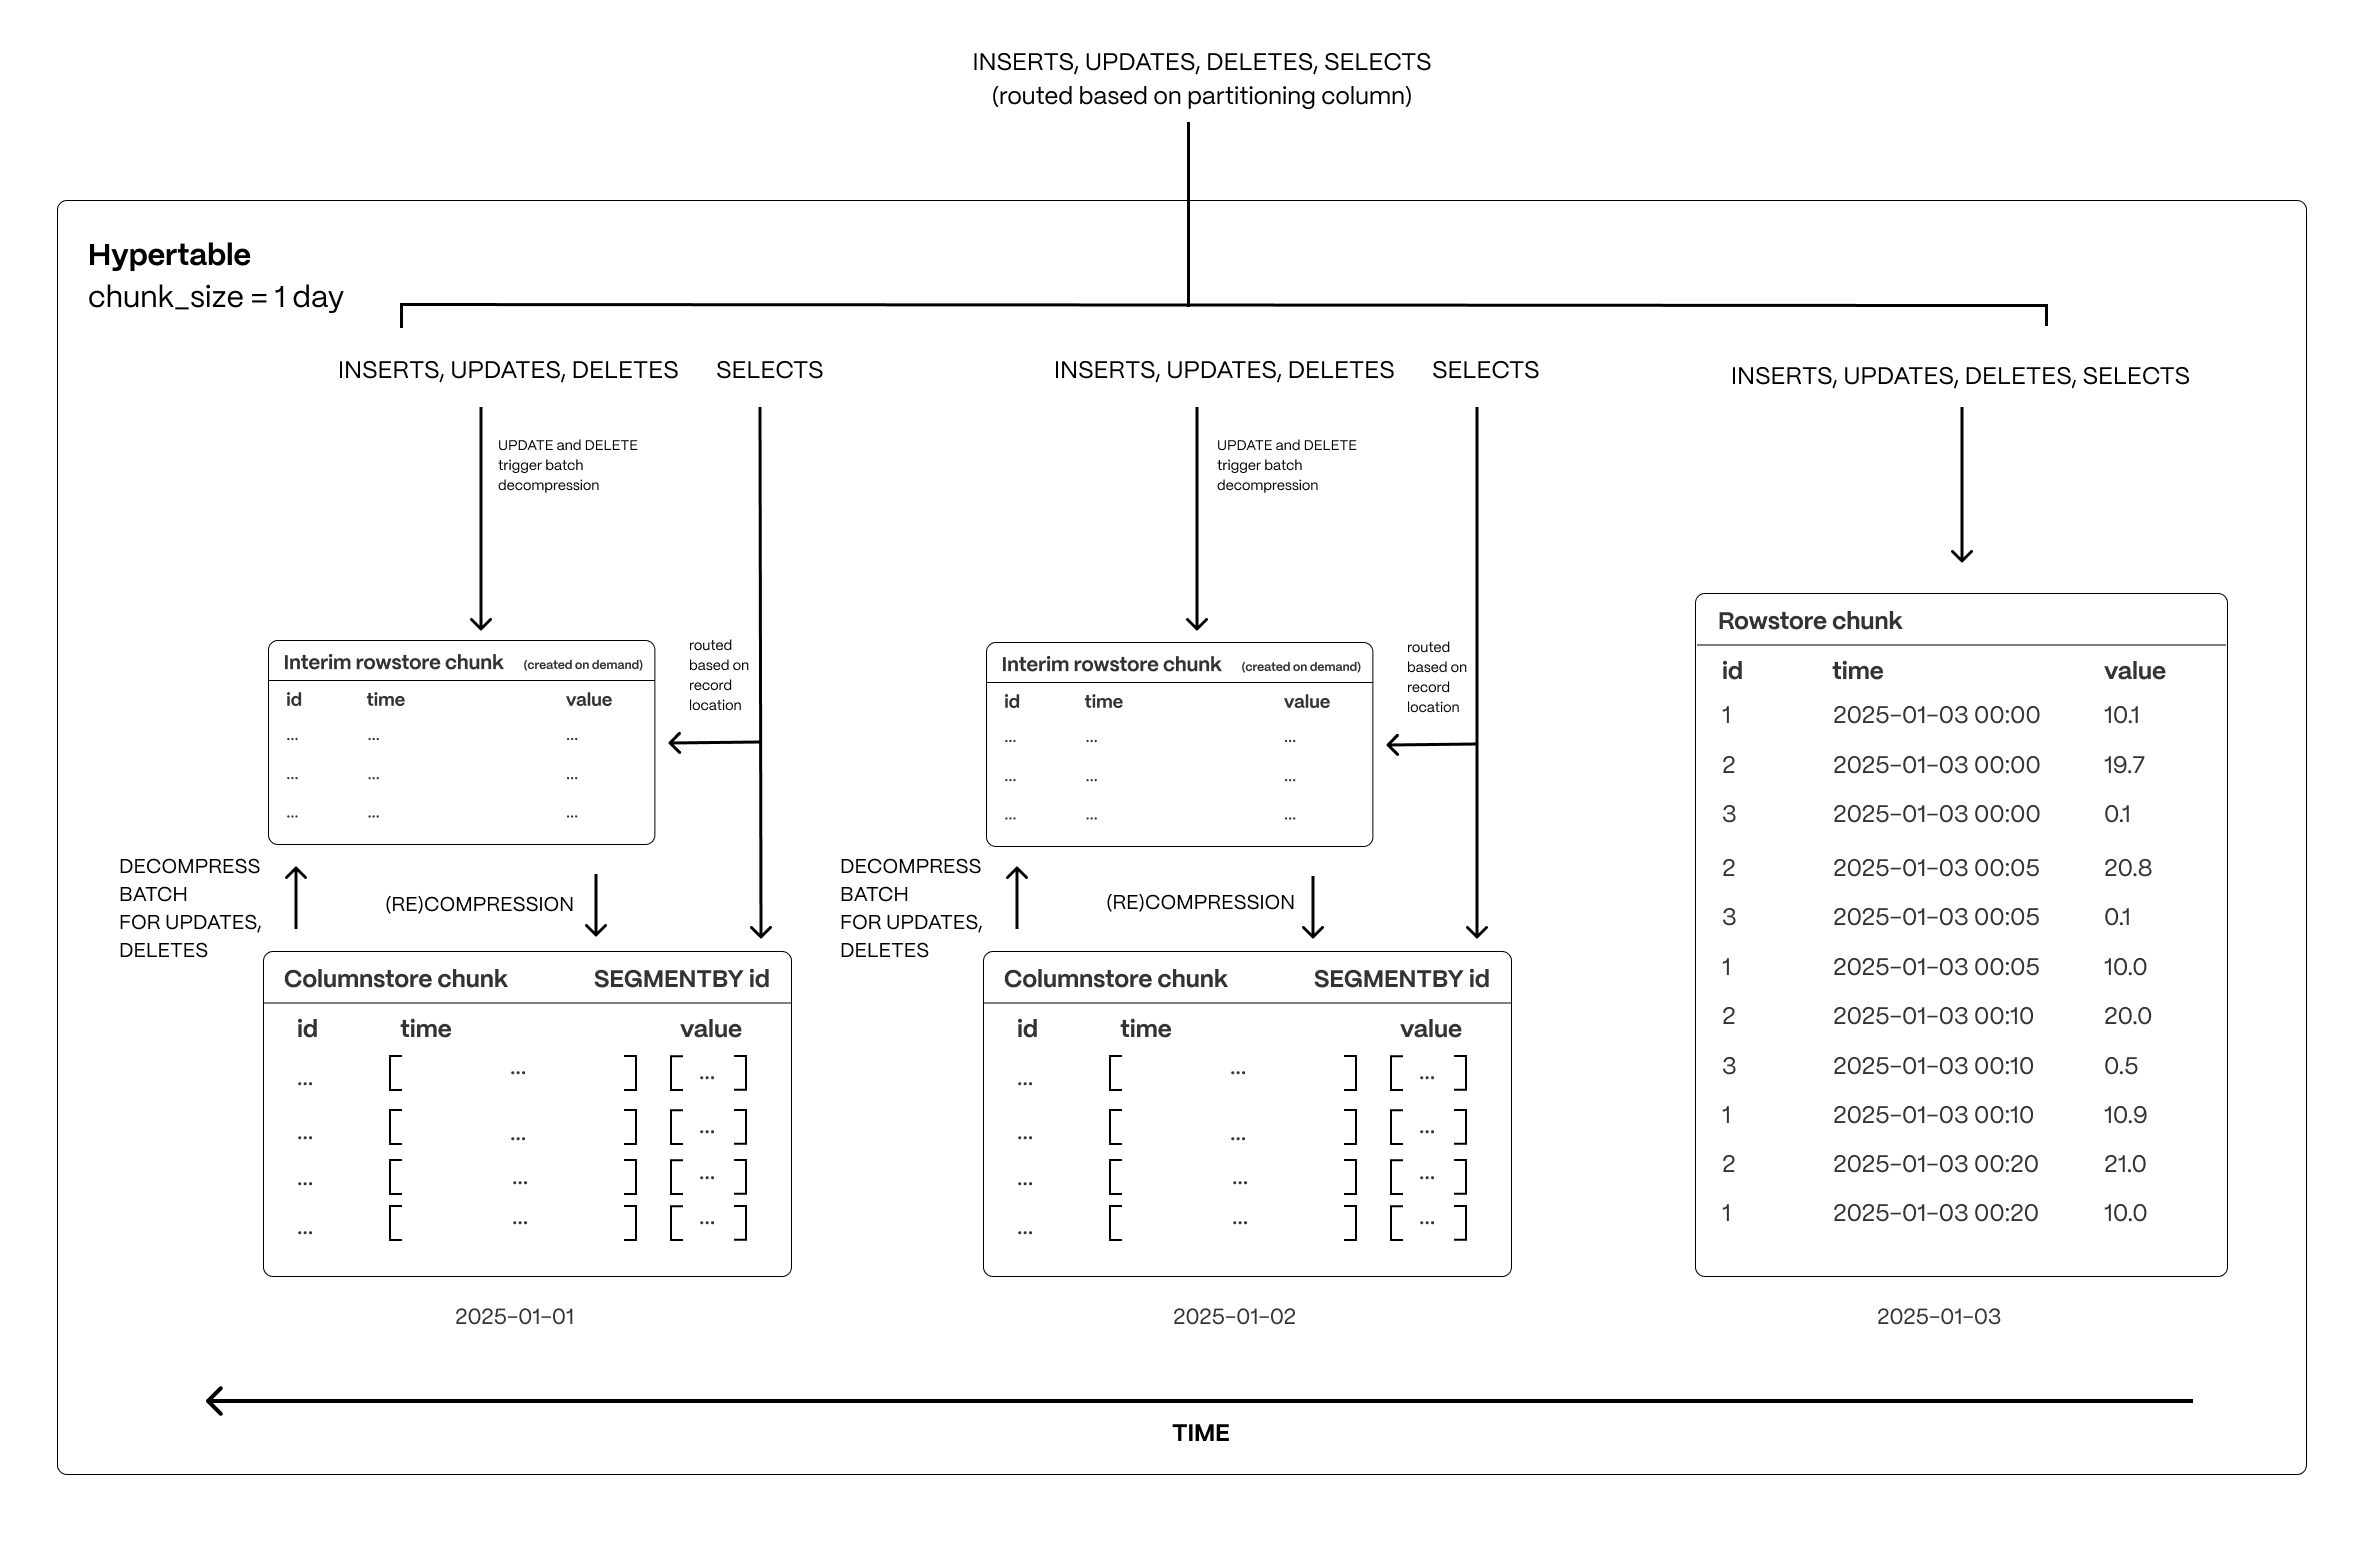
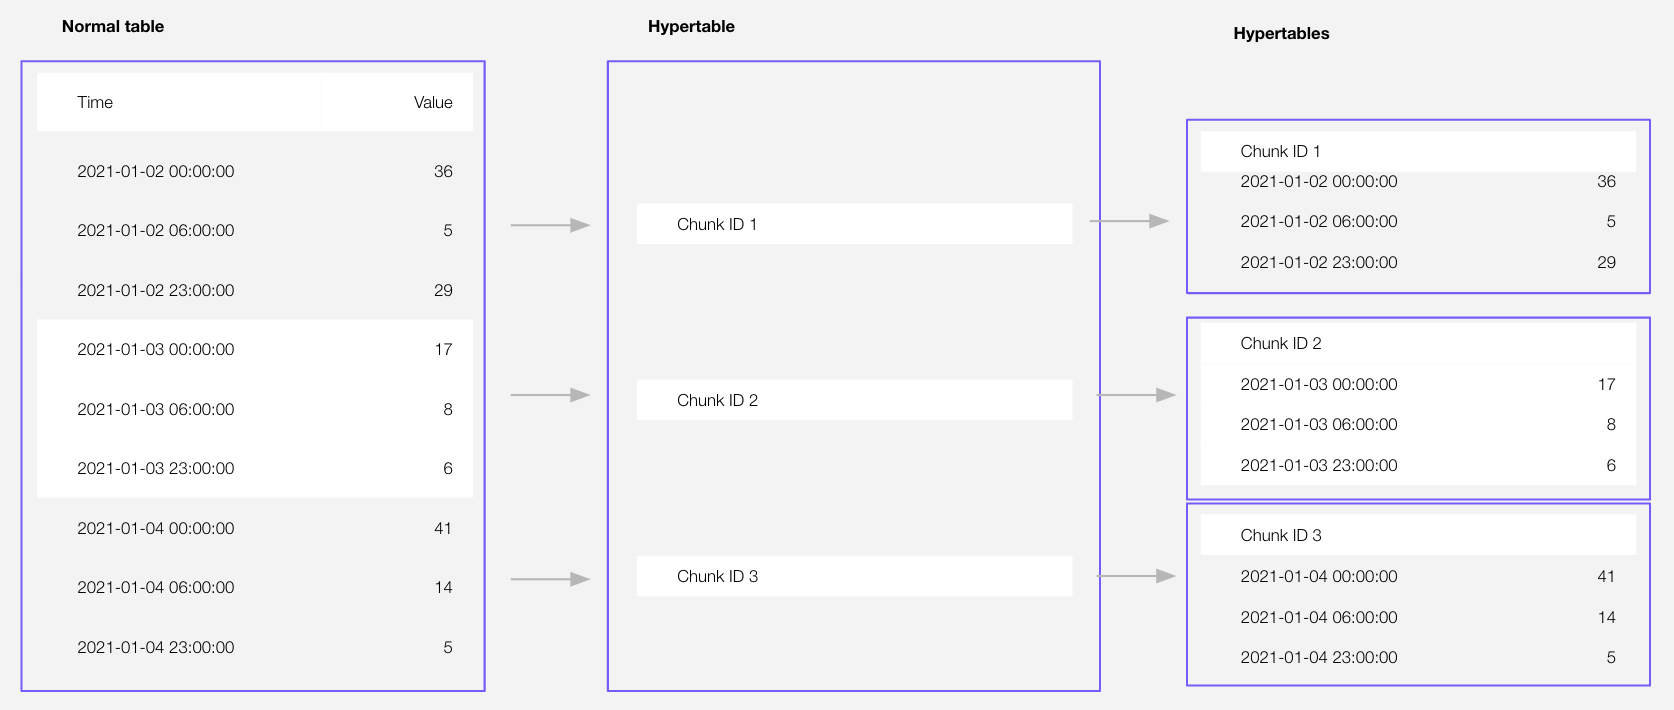
Time-series data represents the way a system, process, or behavior changes over time. Hypertables are Postgres tables that help you improve insert and query performance by automatically partitioning your data by time. Each hypertable is made up of child tables called chunks. Each chunk is assigned a range of time, and only contains data from that range. When you run a query, TimescaleDB identifies the correct chunk and runs the query on it, instead of going through the entire table. You can also tune hypertables to increase performance even more.
Hypercore is the hybrid row-columnar storage engine in TimescaleDB used by hypertables. Traditional databases force a trade-off between fast inserts (row-based storage) and efficient analytics (columnar storage). Hypercore eliminates this trade-off, allowing real-time analytics without sacrificing transactional capabilities.
Hypercore dynamically stores data in the most efficient format for its lifecycle:
- Row-based storage for recent data: the most recent chunk (and possibly more) is always stored in the rowstore, ensuring fast inserts, updates, and low-latency single record queries. Additionally, row-based storage is used as a writethrough for inserts and updates to columnar storage.
- Columnar storage for analytical performance: chunks are automatically compressed into the columnstore, optimizing storage efficiency and accelerating analytical queries.
Unlike traditional columnar databases, hypercore allows data to be inserted or modified at any stage, making it a flexible solution for both high-ingest transactional workloads and real-time analytics—within a single database.
Hypertables exist alongside regular Postgres tables. You use regular Postgres tables for relational data, and interact with hypertables and regular Postgres tables in the same way.
This section shows you how to create regular tables and hypertables, and import relational and time-series data from external files.
Import some time-series data into hypertables
- Unzip crypto_sample.zip to a
<local folder>.
This test dataset contains:
 - Second-by-second data for the most-traded crypto-assets. This time-series data is best suited for
   optimization in a [hypertable][hypertables-section].
 - A list of asset symbols and company names. This is best suited for a regular relational table.
To import up to 100 GB of data directly from your current Postgres-based database, migrate with downtime using native Postgres tooling. To seamlessly import 100GB-10TB+ of data, use the live migration tooling supplied by Tiger Data. To add data from non-Postgres data sources, see Import and ingest data.
- Upload data into a hypertable:
To more fully understand how to create a hypertable, how hypertables work, and how to optimize them for performance by tuning chunk intervals and enabling chunk skipping, see the hypertables documentation.
  The Tiger Cloud Console data upload creates hypertables and relational tables from the data you are uploading:
  1. In [Tiger Cloud Console][portal-ops-mode], select the service to add data to, then click `Actions` > `Import data` > `Upload .CSV`.
  1. Click to browse, or drag and drop `<local folder>/tutorial_sample_tick.csv` to upload.
  1. Leave the default settings for the delimiter, skipping the header, and creating a new table.
  1. In `Table`, provide `crypto_ticks` as the new table name.
  1. Enable `hypertable partition` for the `time` column and click `Process CSV file`.

      The upload wizard creates a hypertable containing the data from the CSV file.
  1. When the data is uploaded, close `Upload .CSV`.

      If you want to  have a quick look at your data, press `Run` .
  1. Repeat the process with `<local folder>/tutorial_sample_assets.csv` and rename to `crypto_assets`.

      There is no time-series data in this table, so you don't see the  `hypertable partition` option.
In Terminal, navigate to
<local folder>and connect to your service.psql -d "postgres://<username>:<password>@<host>:<port>/<database-name>"You use your connection details to fill in this Postgres connection string.
Create tables for the data to import:
For the time-series data:
In your sql client, create a hypertable:
Create a hypertable for your time-series data using CREATE TABLE. For efficient queries, remember to
segmentbythe column you will use most often to filter your data. For example:CREATE TABLE crypto_ticks ( "time" TIMESTAMPTZ, symbol TEXT, price DOUBLE PRECISION, day_volume NUMERIC ) WITH ( tsdb.hypertable, tsdb.partition_column='time', tsdb.segmentby = 'symbol' );If you are self-hosting TimescaleDB v2.19.3 and below, create a Postgres relational table, then convert it using create_hypertable. You then enable hypercore with a call to ALTER TABLE.
For the relational data:
In your sql client, create a normal Postgres table:
 CREATE TABLE crypto_assets (
  symbol TEXT NOT NULL,
  name TEXT NOT NULL
 );
Speed up data ingestion:
When you set
timescaledb.enable_direct_compress_copyyour data gets compressed in memory during ingestion withCOPYstatements. By writing the compressed batches immediately in the columnstore, the IO footprint is significantly lower. Also, the columnstore policy you set is less important,INSERTalready produces compressed chunks.
- Unzip crypto_sample.zip to a
Please note that this feature is a tech preview and not production-ready. Using this feature could lead to regressed query performance and/or storage ratio, if the ingested batches are not correctly ordered or are of too high cardinality.
To enable in-memory data compression during ingestion:
SET timescaledb.enable_direct_compress_copy=on;
Important facts
- High cardinality use cases do not produce good batches and lead to degreaded query performance.
- The columnstore is optimized to store 1000 records per batch, which is the optimal format for ingestion per segment by.
- WAL records are written for the compressed batches rather than the individual tuples.
- Currently only
COPYis support,INSERTwill eventually follow. - Best results are achieved for batch ingestion with 1000 records or more, upper boundary is 10.000 records.
Continous Aggregates are not supported at the moment.
Upload the dataset to your service:
\COPY crypto_ticks from './tutorial_sample_tick.csv' DELIMITER ',' CSV HEADER;\COPY crypto_assets from './tutorial_sample_assets.csv' DELIMITER ',' CSV HEADER;
Have a quick look at your data
You query hypertables in exactly the same way as you would a relational Postgres table. Use one of the following SQL editors to run a query and see the data you uploaded:
- Data mode: write queries, visualize data, and share your results in Tiger Cloud Console for all your Tiger Cloud services. This feature is not available under the Free pricing plan.
- SQL editor: write, fix, and organize SQL faster and more accurately in Tiger Cloud Console for a Tiger Cloud service.
- psql: easily run queries on your Tiger Cloud services or self-hosted TimescaleDB deployment from Terminal.
Enhance query performance for analytics
Hypercore is the TimescaleDB hybrid row-columnar storage engine, designed specifically for real-time analytics and powered by time-series data. The advantage of hypercore is its ability to seamlessly switch between row-oriented and column-oriented storage. This flexibility enables TimescaleDB to deliver the best of both worlds, solving the key challenges in real-time analytics.
When TimescaleDB converts chunks from the rowstore to the columnstore, multiple records are grouped into a single row. The columns of this row hold an array-like structure that stores all the data. Because a single row takes up less disk space, you can reduce your chunk size by up to 98%, and can also speed up your queries. This helps you save on storage costs, and keeps your queries operating at lightning speed.
hypercore is enabled by default when you call CREATE TABLE. Best practice is to compress data that is no longer needed for highest performance queries, but is still accessed regularly in the columnstore. For example, yesterday's market data.
- Add a policy to convert chunks to the columnstore at a specific time interval
For example, yesterday's data:
CALL add_columnstore_policy('crypto_ticks', after => INTERVAL '1d');
If you have not configured a segmentby column, TimescaleDB chooses one for you based on the data in your
hypertable. For more information on how to tune your hypertables for the best performance, see
efficient queries.
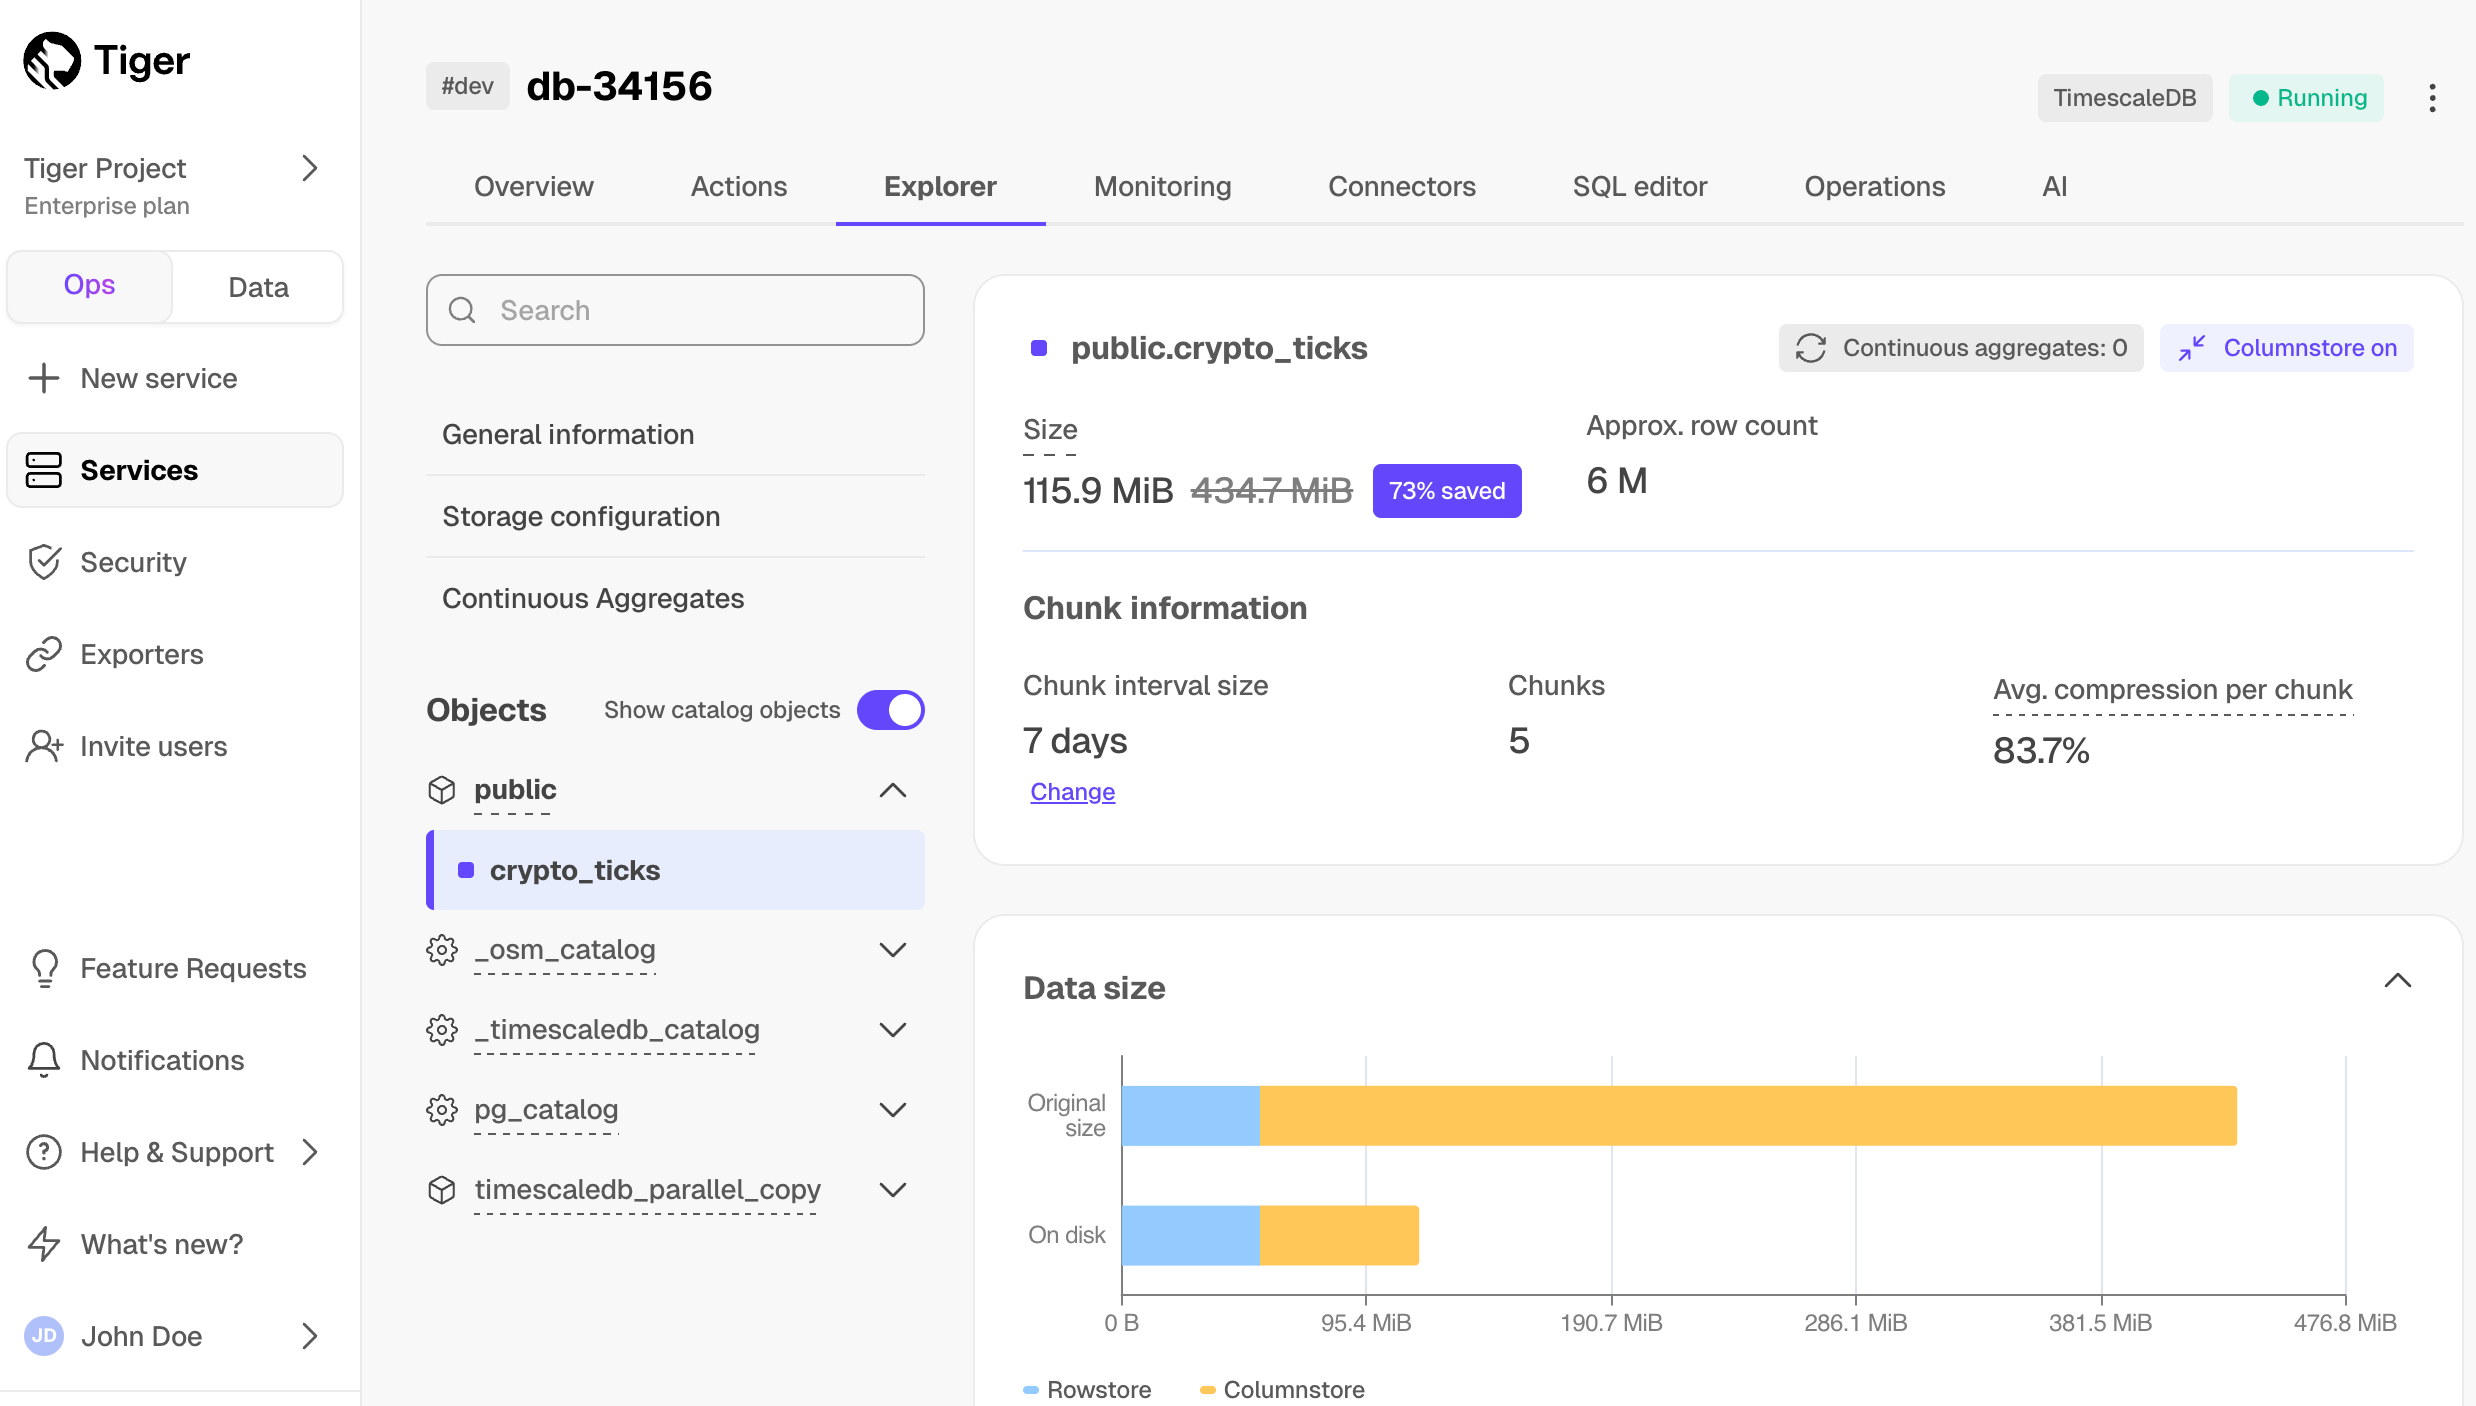
- View your data space saving
When you convert data to the columnstore, as well as being optimized for analytics, it is compressed by more than
90%. This helps you save on storage costs and keeps your queries operating at lightning speed. To see the amount of space
saved, click Explorer > public > crypto_ticks.
Write fast and efficient analytical queries
Aggregation is a way of combing data to get insights from it. Average, sum, and count are all examples of simple aggregates. However, with large amounts of data, aggregation slows things down, quickly. Continuous aggregates are a kind of hypertable that is refreshed automatically in the background as new data is added, or old data is modified. Changes to your dataset are tracked, and the hypertable behind the continuous aggregate is automatically updated in the background.
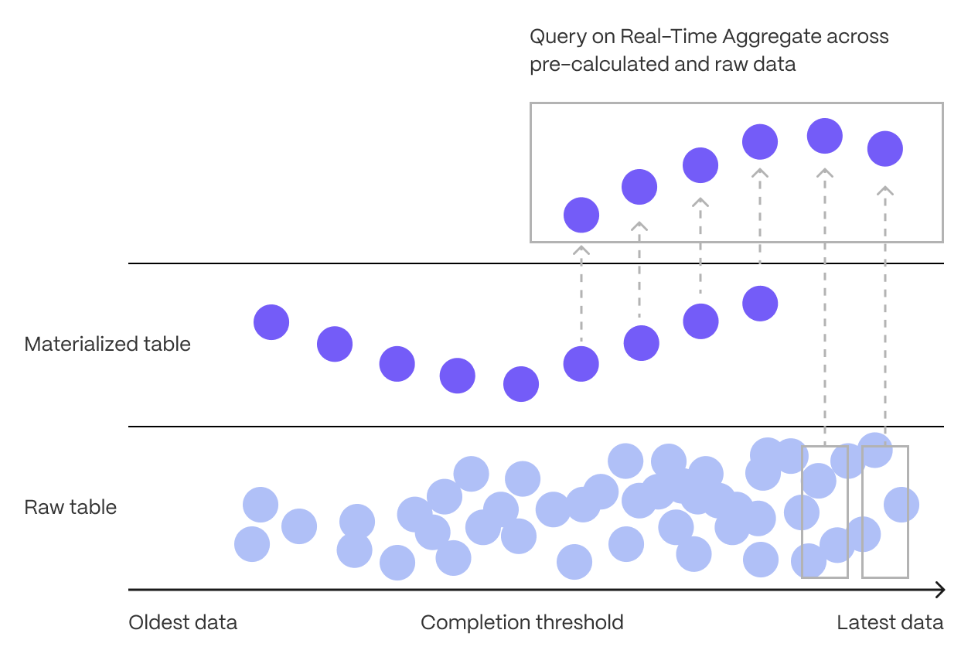
You create continuous aggregates on uncompressed data in high-performance storage. They continue to work on data in the columnstore and rarely accessed data in tiered storage. You can even create continuous aggregates on top of your continuous aggregates.
You use time buckets to create a continuous aggregate. Time buckets aggregate data in hypertables by time interval. For example, a 5-minute, 1-hour, or 3-day bucket. The data grouped in a time bucket uses a single timestamp. Continuous aggregates minimize the number of records that you need to look up to perform your query.
This section shows you how to run fast analytical queries using time buckets and continuous aggregate in Tiger Cloud Console. You can also do this using psql.
This feature is not available under the Free pricing plan.
Connect to your service
In Tiger Cloud Console, select your service in the connection drop-down in the top right.
Create a continuous aggregate
For a continuous aggregate, data grouped using a time bucket is stored in a Postgres
MATERIALIZED VIEWin a hypertable.timescaledb.continuousensures that this data is always up to date. In data mode, use the following code to create a continuous aggregate on the real-time data in thecrypto_tickstable:CREATE MATERIALIZED VIEW assets_candlestick_daily WITH (timescaledb.continuous) AS SELECT time_bucket('1 day', "time") AS day, symbol, max(price) AS high, first(price, time) AS open, last(price, time) AS close, min(price) AS low FROM crypto_ticks srt GROUP BY day, symbol;This continuous aggregate creates the candlestick chart data you use to visualize the price change of an asset.
Create a policy to refresh the view every hour
SELECT add_continuous_aggregate_policy('assets_candlestick_daily',
start_offset => INTERVAL '3 weeks',
end_offset => INTERVAL '24 hours',
schedule_interval => INTERVAL '3 hours');
Have a quick look at your data
You query continuous aggregates exactly the same way as your other tables. To query the
assets_candlestick_dailycontinuous aggregate for all assets:In Tiger Cloud Console, select the service you uploaded data to
Click
Explorer>Continuous Aggregates>Create a Continuous Aggregatenext to thecrypto_tickshypertableCreate a view called
assets_candlestick_dailyon thetimecolumn with an interval of1 day, then clickNext step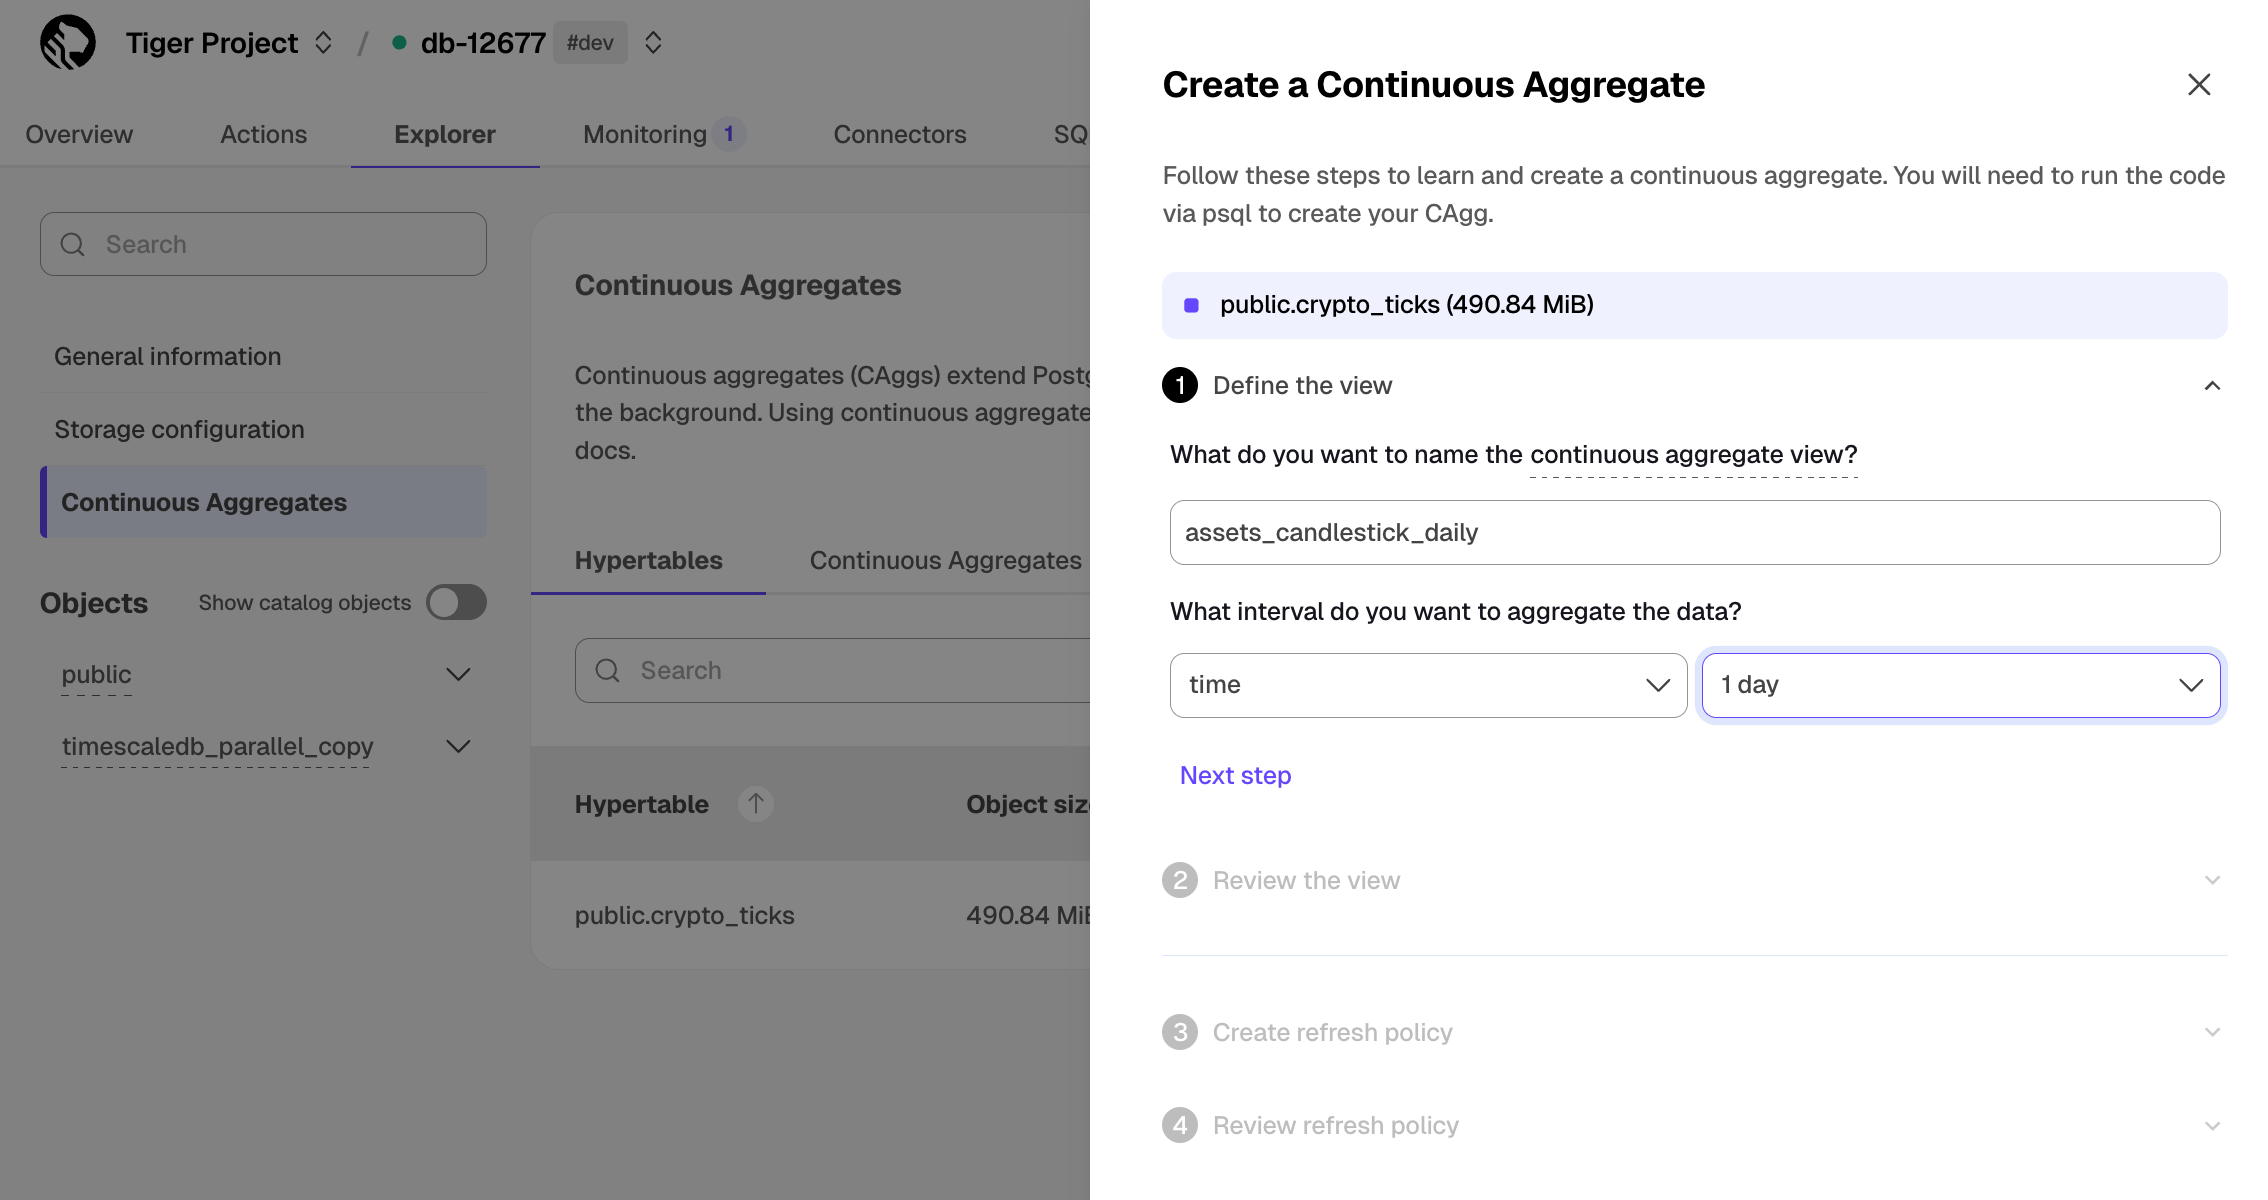
Update the view SQL with the following functions, then click
RunCREATE MATERIALIZED VIEW assets_candlestick_daily WITH (timescaledb.continuous) AS SELECT time_bucket('1 day', "time") AS bucket, symbol, max(price) AS high, first(price, time) AS open, last(price, time) AS close, min(price) AS low FROM "public"."crypto_ticks" srt GROUP BY bucket, symbol;When the view is created, click
Next stepDefine a refresh policy with the following values:
How far back do you want to materialize?:3 weeksWhat recent data to exclude?:24 hoursHow often do you want the job to run?:3 hours
Click
Next step, then clickRun
Tiger Cloud creates the continuous aggregate and displays the aggregate ID in Tiger Cloud Console. Click DONE to close the wizard.
To see the change in terms of query time and data returned between a regular query and
a continuous aggregate, run the query part of the continuous aggregate
( SELECT ...GROUP BY day, symbol; ) and compare the results.
Slash storage charges
In the previous sections, you used continuous aggregates to make fast analytical queries, and hypercore to reduce storage costs on frequently accessed data. To reduce storage costs even more, you create tiering policies to move rarely accessed data to the object store. The object store is low-cost bottomless data storage built on Amazon S3. However, no matter the tier, you can query your data when you need. Tiger Cloud seamlessly accesses the correct storage tier and generates the response.
To set up data tiering:
Enable data tiering
In Tiger Cloud Console, select the service to modify.
In
Explorer, clickStorage configuration>Tiering storage, then clickEnable tiered storage.
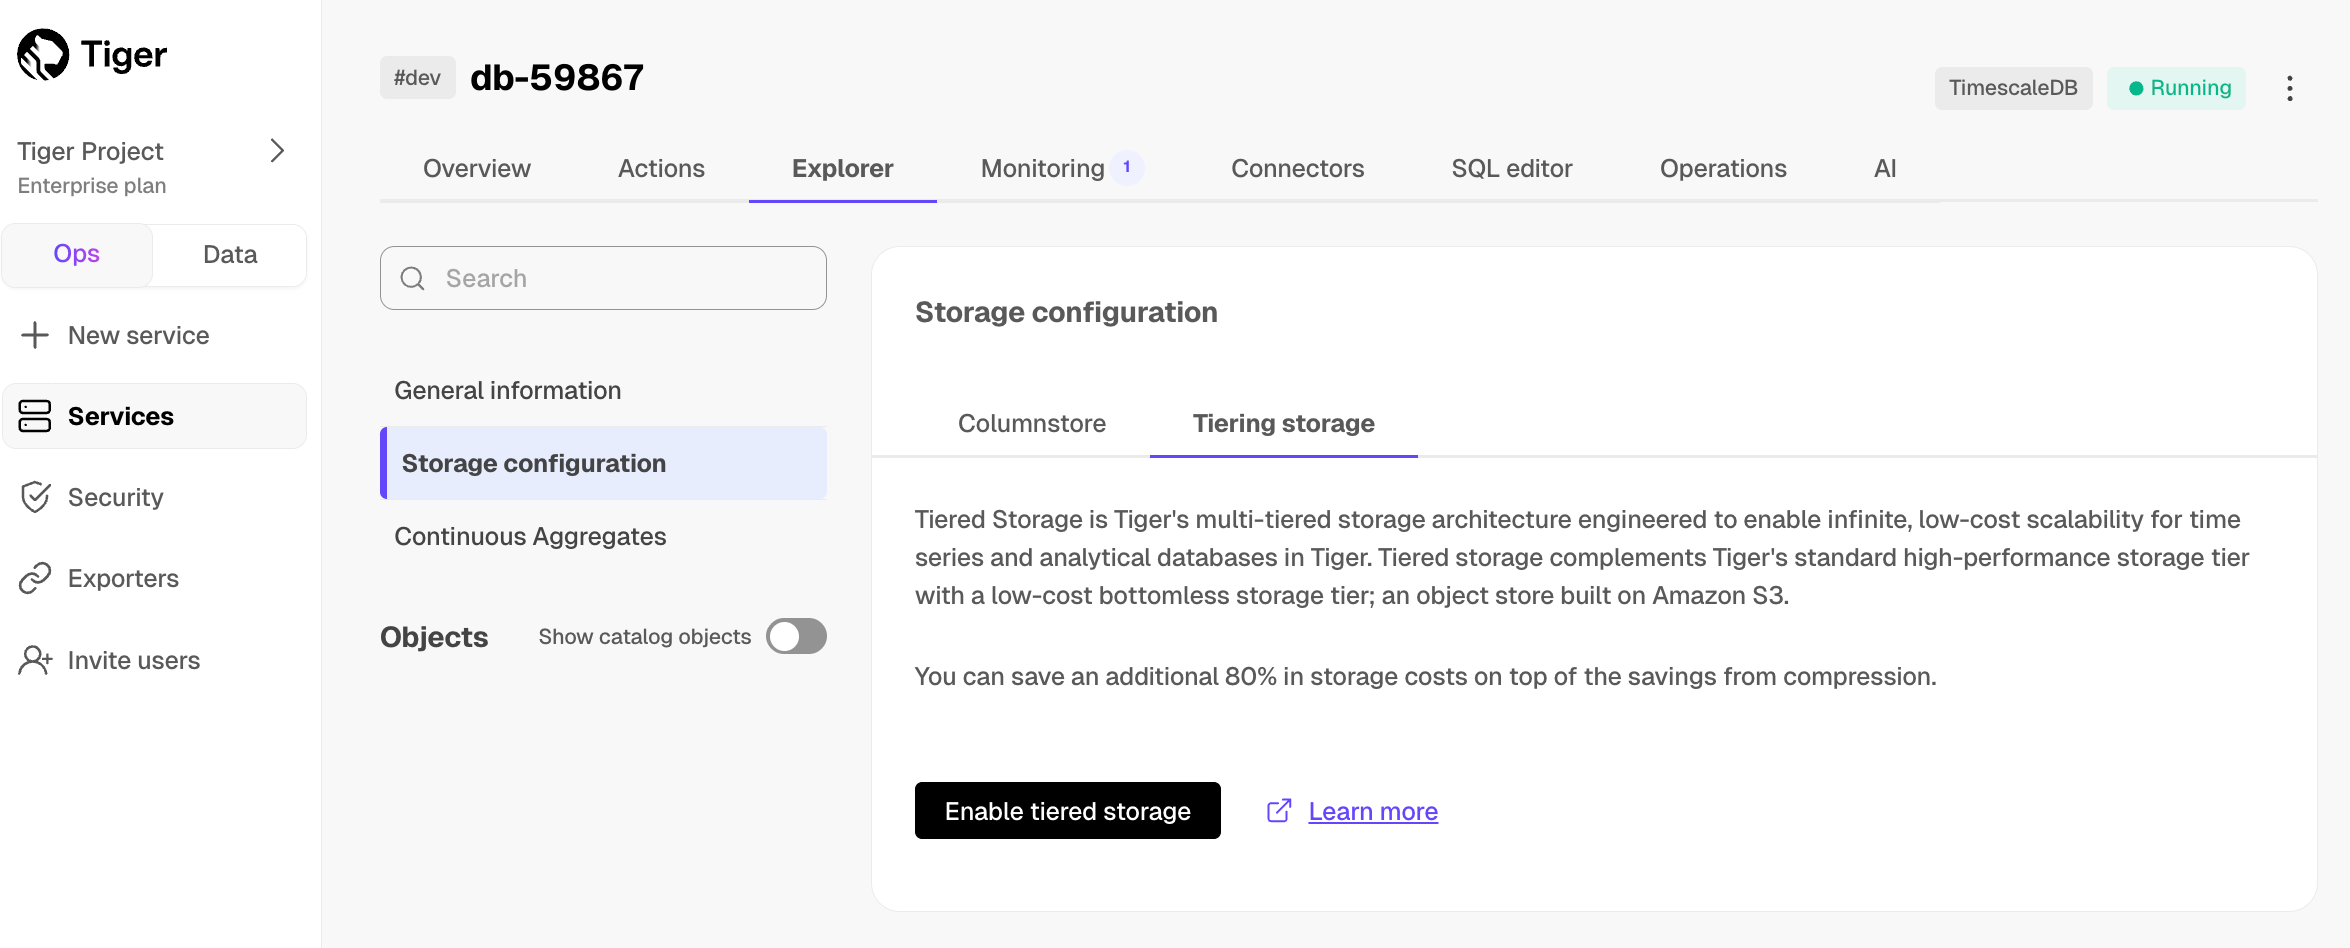
When tiered storage is enabled, you see the amount of data in the tiered object storage.
Set the time interval when data is tiered
In Tiger Cloud Console, click
Datato switch to the data mode, then enable data tiering on a hypertable with the following query:SELECT add_tiering_policy('assets_candlestick_daily', INTERVAL '3 weeks');Query tiered data
You enable reads from tiered data for each query, for a session or for all future sessions. To run a single query on tiered data:
Enable reads on tiered data:
set timescaledb.enable_tiered_reads = trueQuery the data:
SELECT * FROM crypto_ticks srt LIMIT 10Disable reads on tiered data:
set timescaledb.enable_tiered_reads = false;For more information, see Querying tiered data.
Reduce the risk of downtime and data loss
By default, all Tiger Cloud services have rapid recovery enabled. However, if your app has very low tolerance for downtime, Tiger Cloud offers high-availability replicas. HA replicas are exact, up-to-date copies of your database hosted in multiple AWS availability zones (AZ) within the same region as your primary node. HA replicas automatically take over operations if the original primary data node becomes unavailable. The primary node streams its write-ahead log (WAL) to the replicas to minimize the chances of data loss during failover.
- In Tiger Cloud Console, select the service to enable replication for.
- Click
Operations, then selectHigh availability. Choose your replication strategy, then click
Change configuration.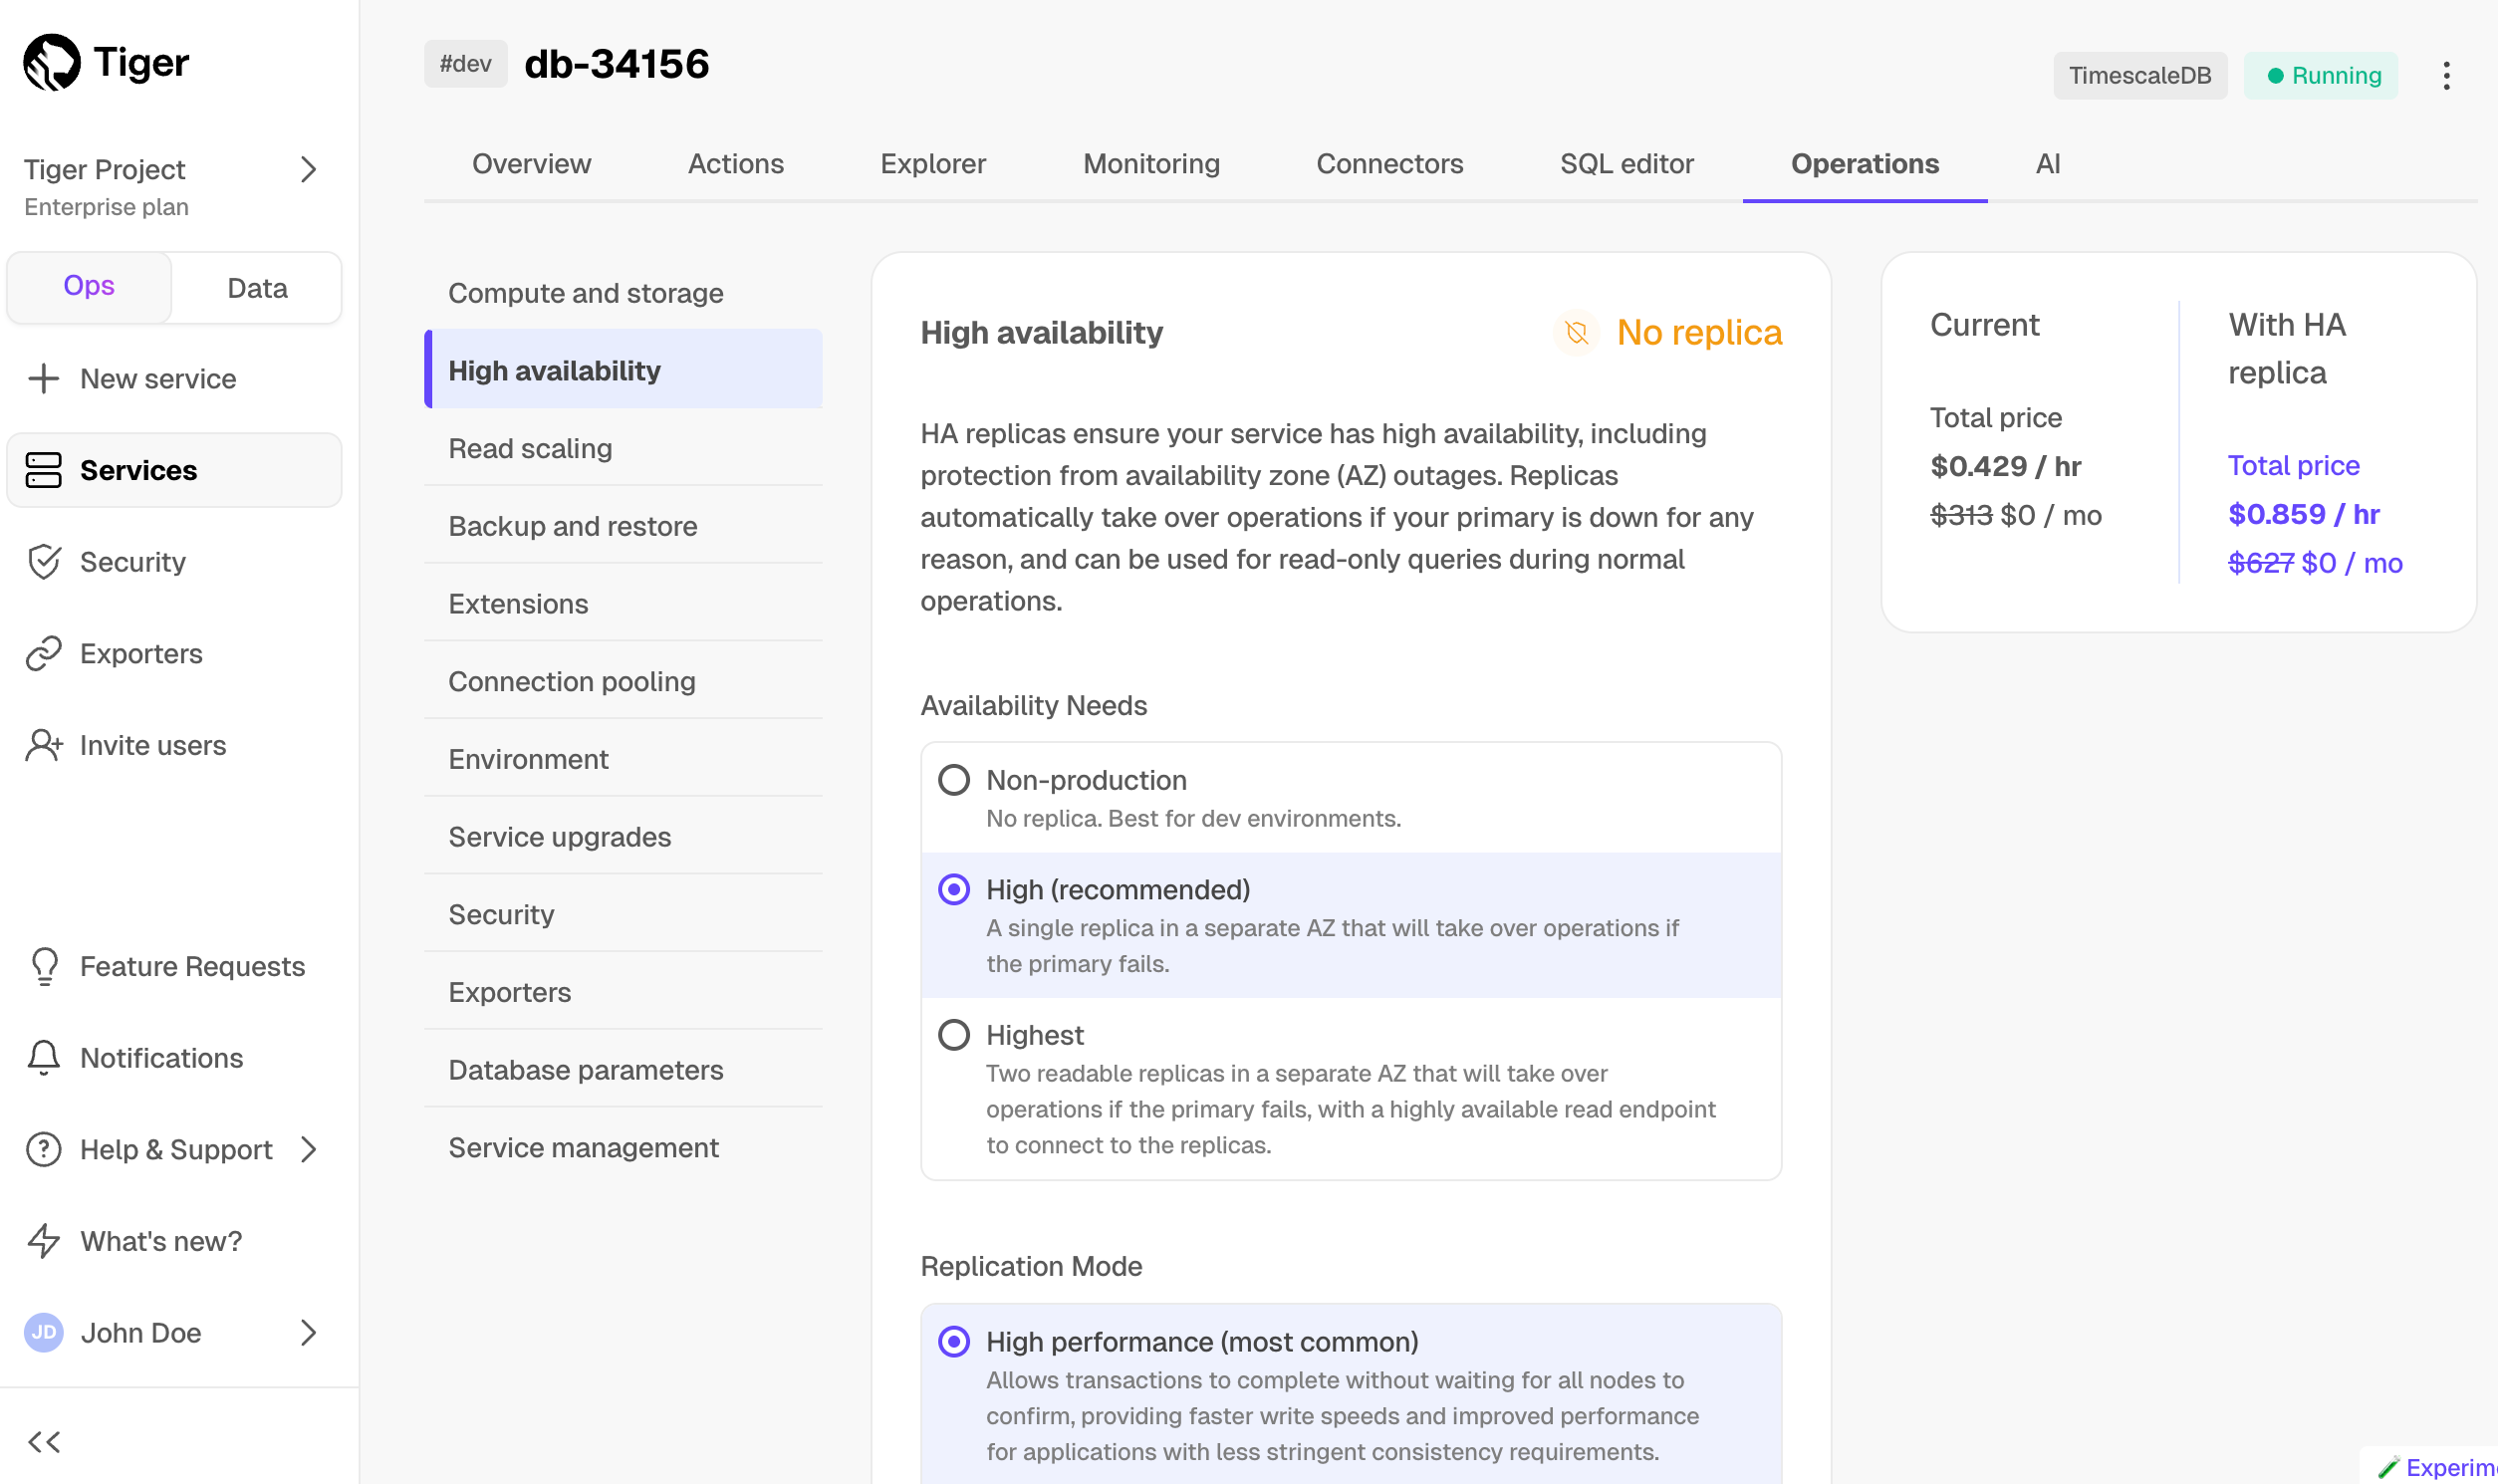
In
Change high availability configuration, clickChange config.
For more information, see High availability.
What next? See the use case tutorials, interact with the data in your Tiger Cloud service using your favorite programming language, integrate your Tiger Cloud service with a range of third-party tools, plain old Use Tiger Data products, or dive into the API.
===== PAGE: https://docs.tigerdata.com/getting-started/start-coding-with-timescale/ =====
Start coding with Tiger Data
Easily integrate your app with Tiger Cloud or self-hosted TimescaleDB. Use your favorite programming language to connect to your Tiger Cloud service, create and manage hypertables, then ingest and query data.
"Quick Start: Ruby and TimescaleDB"
Prerequisites
To follow the steps on this page:
- Create a target Tiger Cloud service with the Real-time analytics capability.
You need your connection details. This procedure also works for self-hosted TimescaleDB.
- Install Rails.
Connect a Rails app to your service
Every Tiger Cloud service is a 100% Postgres database hosted in Tiger Cloud with Tiger Data extensions such as TimescaleDB. You connect to your Tiger Cloud service from a standard Rails app configured for Postgres.
Create a new Rails app configured for Postgres
Rails creates and bundles your app, then installs the standard Postgres Gems.
rails new my_app -d=postgresql
cd my_app
Install the TimescaleDB gem
Open
Gemfile, add the following line, then save your changes:gem 'timescaledb'In Terminal, run the following command:
bundle install
Connect your app to your Tiger Cloud service
In
<my_app_home>/config/database.ymlupdate the configuration to read securely connect to your Tiger Cloud service by addingurl: <%= ENV['DATABASE_URL'] %>to the default configuration:default: &default adapter: postgresql encoding: unicode pool: <%= ENV.fetch("RAILS_MAX_THREADS") { 5 } %> url: <%= ENV['DATABASE_URL'] %>Set the environment variable for
DATABASE_URLto the value ofService URLfrom your connection detailsexport DATABASE_URL="value of Service URL"Create the database:
- Tiger Cloud: nothing to do. The database is part of your Tiger Cloud service.
Self-hosted TimescaleDB, create the database for the project:
rails db:create
Run migrations:
rails db:migrateVerify the connection from your app to your Tiger Cloud service:
echo "\dx" | rails dbconsole
The result shows the list of extensions in your Tiger Cloud service
| Name | Version | Schema | Description | | -- | -- | -- | -- | | pg_buffercache | 1.5 | public | examine the shared buffer cache| | pg_stat_statements | 1.11 | public | track planning and execution statistics of all SQL statements executed| | plpgsql | 1.0 | pg_catalog | PL/pgSQL procedural language| | postgres_fdw | 1.1 | public | foreign-data wrapper for remote Postgres servers| | timescaledb | 2.18.1 | public | Enables scalable inserts and complex queries for time-series data (Community Edition)| | timescaledb_toolkit | 1.19.0 | public | Library of analytical hyperfunctions, time-series pipelining, and other SQL utilities|
Optimize time-series data in hypertables
Hypertables are Postgres tables designed to simplify and accelerate data analysis. Anything you can do with regular Postgres tables, you can do with hypertables - but much faster and more conveniently.
In this section, you use the helpers in the TimescaleDB gem to create and manage a hypertable.
Generate a migration to create the page loads table
rails generate migration create_page_loads
This creates the <my_app_home>/db/migrate/<migration-datetime>_create_page_loads.rb migration file.
- Add hypertable options
Replace the contents of <my_app_home>/db/migrate/<migration-datetime>_create_page_loads.rb
with the following:
```ruby
class CreatePageLoads < ActiveRecord::Migration[8.0]
  def change
    hypertable_options = {
      time_column: 'created_at',
      chunk_time_interval: '1 day',
      compress_segmentby: 'path',
      compress_orderby: 'created_at',
      compress_after: '7 days',
      drop_after: '30 days'
    }

    create_table :page_loads, id: false, primary_key: [:created_at, :user_agent, :path], hypertable: hypertable_options do |t|
      t.timestamptz :created_at, null: false
      t.string :user_agent
      t.string :path
      t.float :performance
    end
  end
end
```

The `id` column is not included in the table. This is because TimescaleDB requires that any `UNIQUE` or `PRIMARY KEY`
indexes on the table include all partitioning columns. In this case, this is the time column. A new
Rails model includes a `PRIMARY KEY` index for id by default: either remove the column or make sure that the index
includes time as part of a "composite key."
For more information, check the Roby docs around composite primary keys.
Create a
PageLoadmodelCreate a new file called
<my_app_home>/app/models/page_load.rband add the following code:class PageLoad < ApplicationRecord extend Timescaledb::ActsAsHypertable include Timescaledb::ContinuousAggregatesHelper acts_as_hypertable time_column: "created_at", segment_by: "path", value_column: "performance" scope :chrome_users, -> { where("user_agent LIKE ?", "%Chrome%") } scope :firefox_users, -> { where("user_agent LIKE ?", "%Firefox%") } scope :safari_users, -> { where("user_agent LIKE ?", "%Safari%") } scope :performance_stats, -> { select("stats_agg(#{value_column}) as stats_agg") } scope :slow_requests, -> { where("performance > ?", 1.0) } scope :fast_requests, -> { where("performance < ?", 0.1) } continuous_aggregates scopes: [:performance_stats], timeframes: [:minute, :hour, :day], refresh_policy: { minute: { start_offset: '3 minute', end_offset: '1 minute', schedule_interval: '1 minute' }, hour: { start_offset: '3 hours', end_offset: '1 hour', schedule_interval: '1 minute' }, day: { start_offset: '3 day', end_offset: '1 day', schedule_interval: '1 minute' } } endRun the migration
rails db:migrate
Insert data your service
The TimescaleDB gem provides efficient ways to insert data into hypertables. This section shows you how to ingest test data into your hypertable.
Create a controller to handle page loads
Create a new file called
<my_app_home>/app/controllers/application_controller.rband add the following code:class ApplicationController < ActionController::Base around_action :track_page_load private def track_page_load start_time = Time.current yield end_time = Time.current PageLoad.create( path: request.path, user_agent: request.user_agent, performance: (end_time - start_time) ) end endGenerate some test data
Use
bin/consoleto join a Rails console session and run the following code to define some random page load access data:def generate_sample_page_loads(total: 1000) time = 1.month.ago paths = %w[/ /about /contact /products /blog] browsers = [ "Mozilla/5.0 (Macintosh; Intel Mac OS X 10_15_7) AppleWebKit/537.36 (KHTML, like Gecko) Chrome/91.0.4472.114 Safari/537.36", "Mozilla/5.0 (Macintosh; Intel Mac OS X 10.15; rv:89.0) Gecko/20100101 Firefox/89.0", "Mozilla/5.0 (Macintosh; Intel Mac OS X 10_15_7) AppleWebKit/605.1.15 (KHTML, like Gecko) Version/14.1.1 Safari/605.1.15" ] total.times.map do time = time + rand(60).seconds { path: paths.sample, user_agent: browsers.sample, performance: rand(0.1..2.0), created_at: time, updated_at: time } end endInsert the generated data into your Tiger Cloud service
PageLoad.insert_all(generate_sample_page_loads, returning: false)Validate the test data in your Tiger Cloud service
PageLoad.count
PageLoad.first
Reference
This section lists the most common tasks you might perform with the TimescaleDB gem.
Query scopes
The TimescaleDB gem provides several convenient scopes for querying your time-series data.
Built-in time-based scopes:
PageLoad.last_hour.count
PageLoad.today.count
PageLoad.this_week.count
PageLoad.this_month.count
Browser-specific scopes:
PageLoad.chrome_users.last_hour.count
PageLoad.firefox_users.last_hour.count
PageLoad.safari_users.last_hour.count

PageLoad.slow_requests.last_hour.count
PageLoad.fast_requests.last_hour.count
Query continuous aggregates:
This query fetches the average and standard deviation from the performance stats for the /products path over the last day.
```ruby
PageLoad::PerformanceStatsPerMinute.last_hour
PageLoad::PerformanceStatsPerHour.last_day
PageLoad::PerformanceStatsPerDay.last_month

stats = PageLoad::PerformanceStatsPerHour.last_day.where(path: '/products').select("average(stats_agg) as average, stddev(stats_agg) as stddev").first
puts "Average: #{stats.average}"
puts "Standard Deviation: #{stats.stddev}"
```
TimescaleDB features
The TimescaleDB gem provides utility methods to access hypertable and chunk information. Every model that uses
the acts_as_hypertable method has access to these methods.
Access hypertable and chunk information
View chunk or hypertable information:
PageLoad.chunks.count
PageLoad.hypertable.detailed_size
Compress/Decompress chunks:
PageLoad.chunks.uncompressed.first.compress!  # Compress the first uncompressed chunk
PageLoad.chunks.compressed.first.decompress!  # Decompress the oldest chunk
PageLoad.hypertable.compression_stats # View compression stats
Access hypertable stats
You collect hypertable stats using methods that provide insights into your hypertable's structure, size, and compression status:
Get basic hypertable information:
hypertable = PageLoad.hypertable
hypertable.hypertable_name  # The name of your hypertable
hypertable.schema_name      # The schema where the hypertable is located
Get detailed size information:
hypertable.detailed_size # Get detailed size information for the hypertable
hypertable.compression_stats # Get compression statistics
hypertable.chunks_detailed_size # Get chunk information
hypertable.approximate_row_count # Get approximate row count
hypertable.dimensions.map(&:column_name) # Get dimension information
hypertable.continuous_aggregates.map(&:view_name) # Get continuous aggregate view names
Continuous aggregates
The continuous_aggregates method generates a class for each continuous aggregate.
Get all the continuous aggregate classes:
PageLoad.descendants # Get all continuous aggregate classesManually refresh a continuous aggregate:
PageLoad.refresh_aggregatesCreate or drop a continuous aggregate:
Create or drop all the continuous aggregates in the proper order to build them hierarchically. See more about how it works in this blog post.
   PageLoad.create_continuous_aggregates
   PageLoad.drop_continuous_aggregates
Next steps
Now that you have integrated the ruby gem into your app:
- Learn more about the TimescaleDB gem.
- Check out the official docs.
- Follow the LTTB, Open AI long-term storage, and candlesticks tutorials.
Prerequisites
To follow the steps on this page:
- Create a target Tiger Cloud service with the Real-time analytics capability.
You need your connection details. This procedure also works for self-hosted TimescaleDB.
- Install the
psycopg2library.
For more information, see the psycopg2 documentation.
- Create a Python virtual environment. [](#)
Connect to TimescaleDB
In this section, you create a connection to TimescaleDB using the psycopg2
library. This library is one of the most popular Postgres libraries for
Python. It allows you to execute raw SQL queries efficiently and safely, and
prevents common attacks such as SQL injection.
Import the psycogpg2 library:
import psycopg2Locate your TimescaleDB credentials and use them to compose a connection string for
psycopg2.You'll need:
- password
- username
- host URL
- port
- database name
Compose your connection string variable as a libpq connection string, using this format:
CONNECTION = "postgres://username:password@host:port/dbname"If you're using a hosted version of TimescaleDB, or generally require an SSL connection, use this version instead:
CONNECTION = "postgres://username:password@host:port/dbname?sslmode=require"Alternatively you can specify each parameter in the connection string as follows
CONNECTION = "dbname=tsdb user=tsdbadmin password=secret host=host.com port=5432 sslmode=require"This method of composing a connection string is for test or development purposes only. For production, use environment variables for sensitive details like your password, hostname, and port number.
Use the
psycopg2connect function to create a new database session and create a new cursor object to interact with the database.In your
mainfunction, add these lines:CONNECTION = "postgres://username:password@host:port/dbname" with psycopg2.connect(CONNECTION) as conn: cursor = conn.cursor() # use the cursor to interact with your database # cursor.execute("SELECT * FROM table")Alternatively, you can create a connection object and pass the object around as needed, like opening a cursor to perform database operations:
CONNECTION = "postgres://username:password@host:port/dbname"
conn = psycopg2.connect(CONNECTION)
cursor = conn.cursor()
# use the cursor to interact with your database
cursor.execute("SELECT 'hello world'")
print(cursor.fetchone())
Create a relational table
In this section, you create a table called sensors which holds the ID, type,
and location of your fictional sensors. Additionally, you create a hypertable
called sensor_data which holds the measurements of those sensors. The
measurements contain the time, sensor_id, temperature reading, and CPU
percentage of the sensors.
Compose a string which contains the SQL statement to create a relational table. This example creates a table called
sensors, with columnsid,typeandlocation:query_create_sensors_table = """CREATE TABLE sensors ( id SERIAL PRIMARY KEY, type VARCHAR(50), location VARCHAR(50) ); """Open a cursor, execute the query you created in the previous step, and commit the query to make the changes persistent. Afterward, close the cursor to clean up:
cursor = conn.cursor()
# see definition in Step 1
cursor.execute(query_create_sensors_table)
conn.commit()
cursor.close()
Create a hypertable
When you have created the relational table, you can create a hypertable. Creating tables and indexes, altering tables, inserting data, selecting data, and most other tasks are executed on the hypertable.
Create a string variable that contains the
CREATE TABLESQL statement for your hypertable. Notice how the hypertable has the compulsory time column:# create sensor data hypertable query_create_sensordata_table = """CREATE TABLE sensor_data ( time TIMESTAMPTZ NOT NULL, sensor_id INTEGER, temperature DOUBLE PRECISION, cpu DOUBLE PRECISION, FOREIGN KEY (sensor_id) REFERENCES sensors (id) ); """Formulate a
SELECTstatement that converts thesensor_datatable to a hypertable. You must specify the table name to convert to a hypertable, and the name of the time column as the two arguments. For more information, see thecreate_hypertabledocs:query_create_sensordata_hypertable = "SELECT create_hypertable('sensor_data', by_range('time'));"The
by_rangedimension builder is an addition to TimescaleDB 2.13.Open a cursor with the connection, execute the statements from the previous steps, commit your changes, and close the cursor:
cursor = conn.cursor()
cursor.execute(query_create_sensordata_table)
cursor.execute(query_create_sensordata_hypertable)
# commit changes to the database to make changes persistent
conn.commit()
cursor.close()
Insert rows of data
You can insert data into your hypertables in several different ways. In this
section, you can use psycopg2 with prepared statements, or you can use
pgcopy for a faster insert.
This example inserts a list of tuples, or relational data, called
sensors, into the relational table namedsensors. Open a cursor with a connection to the database, use prepared statements to formulate theINSERTSQL statement, and then execute that statement:sensors = [('a', 'floor'), ('a', 'ceiling'), ('b', 'floor'), ('b', 'ceiling')] cursor = conn.cursor() for sensor in sensors: try: cursor.execute("INSERT INTO sensors (type, location) VALUES (%s, %s);", (sensor[0], sensor[1])) except (Exception, psycopg2.Error) as error: print(error.pgerror) conn.commit()[](#)Alternatively, you can pass variables to the
cursor.executefunction and separate the formulation of the SQL statement,SQL, from the data being passed with it into the prepared statement,data:SQL = "INSERT INTO sensors (type, location) VALUES (%s, %s);" sensors = [('a', 'floor'), ('a', 'ceiling'), ('b', 'floor'), ('b', 'ceiling')] cursor = conn.cursor() for sensor in sensors: try: data = (sensor[0], sensor[1]) cursor.execute(SQL, data) except (Exception, psycopg2.Error) as error: print(error.pgerror) conn.commit()
If you choose to use pgcopy instead, install the pgcopy package
using pip, and then add this line to your list of
import statements:
from pgcopy import CopyManager
Generate some random sensor data using the
generate_seriesfunction provided by Postgres. This example inserts a total of 480 rows of data (4 readings, every 5 minutes, for 24 hours). In your application, this would be the query that saves your time-series data into the hypertable:# for sensors with ids 1-4 for id in range(1, 4, 1): data = (id,) # create random data simulate_query = """SELECT generate_series(now() - interval '24 hour', now(), interval '5 minute') AS time, %s as sensor_id, random()*100 AS temperature, random() AS cpu; """ cursor.execute(simulate_query, data) values = cursor.fetchall()Define the column names of the table you want to insert data into. This example uses the
sensor_datahypertable created earlier. This hypertable consists of columns namedtime,sensor_id,temperatureandcpu. The column names are defined in a list of strings calledcols:cols = ['time', 'sensor_id', 'temperature', 'cpu']Create an instance of the
pgcopyCopyManager,mgr, and pass the connection variable, hypertable name, and list of column names. Then use thecopyfunction of the CopyManager to insert the data into the database quickly usingpgcopy.mgr = CopyManager(conn, 'sensor_data', cols) mgr.copy(values)Commit to persist changes:
conn.commit()[](#)The full sample code to insert data into TimescaleDB using
pgcopy, using the example of sensor data from four sensors:# insert using pgcopy def fast_insert(conn): cursor = conn.cursor() # for sensors with ids 1-4 for id in range(1, 4, 1): data = (id,) # create random data simulate_query = """SELECT generate_series(now() - interval '24 hour', now(), interval '5 minute') AS time, %s as sensor_id, random()*100 AS temperature, random() AS cpu; """ cursor.execute(simulate_query, data) values = cursor.fetchall() # column names of the table you're inserting into cols = ['time', 'sensor_id', 'temperature', 'cpu'] # create copy manager with the target table and insert mgr = CopyManager(conn, 'sensor_data', cols) mgr.copy(values) # commit after all sensor data is inserted # could also commit after each sensor insert is done conn.commit()[](#)You can also check if the insertion worked:
cursor.execute("SELECT * FROM sensor_data LIMIT 5;")
print(cursor.fetchall())
Execute a query
This section covers how to execute queries against your database.
The first procedure shows a simple SELECT * query. For more complex queries,
you can use prepared statements to ensure queries are executed safely against
the database.
For more information about properly using placeholders in psycopg2, see the
basic module usage document.
For more information about how to execute more complex queries in psycopg2,
see the psycopg2 documentation.
Execute a query
Define the SQL query you'd like to run on the database. This example is a simple
SELECTstatement querying each row from the previously createdsensor_datatable.query = "SELECT * FROM sensor_data;"Open a cursor from the existing database connection,
conn, and then execute the query you defined:cursor = conn.cursor() query = "SELECT * FROM sensor_data;" cursor.execute(query)To access all resulting rows returned by your query, use one of
pyscopg2's results retrieval methods, such asfetchall()orfetchmany(). This example prints the results of the query, row by row. Note that the result offetchall()is a list of tuples, so you can handle them accordingly:cursor = conn.cursor() query = "SELECT * FROM sensor_data;" cursor.execute(query) for row in cursor.fetchall(): print(row) cursor.close()[](#)If you want a list of dictionaries instead, you can define the cursor using
DictCursor:cursor = conn.cursor(cursor_factory=psycopg2.extras.DictCursor)Using this cursor,
cursor.fetchall()returns a list of dictionary-like objects.
For more complex queries, you can use prepared statements to ensure queries are executed safely against the database.
Execute queries using prepared statements
Write the query using prepared statements:
# query with placeholders
cursor = conn.cursor()
query = """
           SELECT time_bucket('5 minutes', time) AS five_min, avg(cpu)
           FROM sensor_data
           JOIN sensors ON sensors.id = sensor_data.sensor_id
           WHERE sensors.location = %s AND sensors.type = %s
           GROUP BY five_min
           ORDER BY five_min DESC;
           """
location = "floor"
sensor_type = "a"
data = (location, sensor_type)
cursor.execute(query, data)
results = cursor.fetchall()
Prerequisites
To follow the steps on this page:
- Create a target Tiger Cloud service with the Real-time analytics capability.
You need your connection details. This procedure also works for self-hosted TimescaleDB.
Connect to TimescaleDB
In this section, you create a connection to TimescaleDB with a common Node.js ORM (object relational mapper) called Sequelize.
At the command prompt, initialize a new Node.js app:
npm init -yThis creates a
package.jsonfile in your directory, which contains all of the dependencies for your project. It looks something like this:{ "name": "node-sample", "version": "1.0.0", "description": "", "main": "index.js", "scripts": { "test": "echo \"Error: no test specified\" && exit 1" }, "keywords": [], "author": "", "license": "ISC" }Install Express.js:
npm install expressCreate a simple web page to check the connection. Create a new file called
index.js, with this content:const express = require('express') const app = express() const port = 3000; app.use(express.json()); app.get('/', (req, res) => res.send('Hello World!')) app.listen(port, () => console.log(`Example app listening at http://localhost:${port}`))Test your connection by starting the application:
node index.js
In your web browser, navigate to http://localhost:3000. If the connection
is successful, it shows "Hello World!"
Add Sequelize to your project:
npm install sequelize sequelize-cli pg pg-hstoreLocate your TimescaleDB credentials and use them to compose a connection string for Sequelize.
You'll need:
- password
- username
- host URL
- port
- database name
Compose your connection string variable, using this format:
'postgres://<user>:<password>@<host>:<port>/<dbname>'Open the
index.jsfile you created. Require Sequelize in the application, and declare the connection string:const Sequelize = require('sequelize') const sequelize = new Sequelize('postgres://<user>:<password>@<host>:<port>/<dbname>', { dialect: 'postgres', protocol: 'postgres', dialectOptions: { ssl: { require: true, rejectUnauthorized: false } } })Make sure you add the SSL settings in the
dialectOptionssections. You can't connect to TimescaleDB using SSL without them.You can test the connection by adding these lines to
index.jsafter theapp.getstatement:sequelize.authenticate().then(() => { console.log('Connection has been established successfully.'); }).catch(err => { console.error('Unable to connect to the database:', err); });Start the application on the command line:
node index.jsIf the connection is successful, you'll get output like this:
Example app listening at http://localhost:3000
Executing (default): SELECT 1+1 AS result
Connection has been established successfully.
Create a relational table
In this section, you create a relational table called page_loads.
Use the Sequelize command line tool to create a table and model called
page_loads:npx sequelize model:generate --name page_loads \ --attributes userAgent:string,time:dateThe output looks similar to this:
Sequelize CLI [Node: 12.16.2, CLI: 5.5.1, ORM: 5.21.11]

New model was created at <PATH>.
New migration was created at <PATH>.
Edit the migration file so that it sets up a migration key:
'use strict';
module.exports = {
  up: async (queryInterface, Sequelize) => {
    await queryInterface.createTable('page_loads', {
      userAgent: {
        primaryKey: true,
        type: Sequelize.STRING
      },
      time: {
        primaryKey: true,
        type: Sequelize.DATE
      }
    });
  },
  down: async (queryInterface, Sequelize) => {
    await queryInterface.dropTable('page_loads');
  }
};
Migrate the change and make sure that it is reflected in the database:
npx sequelize db:migrateThe output looks similar to this:
Sequelize CLI [Node: 12.16.2, CLI: 5.5.1, ORM: 5.21.11]

Loaded configuration file "config/config.json".
Using environment "development".
== 20200528195725-create-page-loads: migrating =======
== 20200528195725-create-page-loads: migrated (0.443s)
Create the
PageLoadsmodel in your code. In theindex.jsfile, above theapp.usestatement, add these lines:let PageLoads = sequelize.define('page_loads', { userAgent: {type: Sequelize.STRING, primaryKey: true }, time: {type: Sequelize.DATE, primaryKey: true } }, { timestamps: false });Instantiate a
PageLoadsobject and save it to the database.
Create a hypertable
When you have created the relational table, you can create a hypertable. Creating tables and indexes, altering tables, inserting data, selecting data, and most other tasks are executed on the hypertable.
Create a migration to modify the
page_loadsrelational table, and change it to a hypertable by first running the following command:npx sequelize migration:generate --name add_hypertableThe output looks similar to this:
Sequelize CLI [Node: 12.16.2, CLI: 5.5.1, ORM: 5.21.11]

migrations folder at <PATH> already exists.
New migration was created at <PATH>/20200601202912-add_hypertable.js .
In the
migrationsfolder, there is now a new file. Open the file, and add this content:'use strict'; module.exports = { up: (queryInterface, Sequelize) => { return queryInterface.sequelize.query("SELECT create_hypertable('page_loads', by_range('time'));"); }, down: (queryInterface, Sequelize) => { } };The
by_rangedimension builder is an addition to TimescaleDB 2.13.At the command prompt, run the migration command:
npx sequelize db:migrateThe output looks similar to this:
Sequelize CLI [Node: 12.16.2, CLI: 5.5.1, ORM: 5.21.11]

Loaded configuration file "config/config.json".
Using environment "development".
== 20200601202912-add_hypertable: migrating =======
== 20200601202912-add_hypertable: migrated (0.426s)
Insert rows of data
This section covers how to insert data into your hypertables.
In the
index.jsfile, modify the/route to get theuser-agentfrom the request object (req) and the current timestamp. Then, call thecreatemethod onPageLoadsmodel, supplying the user agent and timestamp parameters. Thecreatecall executes anINSERTon the database:app.get('/', async (req, res) => { // get the user agent and current time const userAgent = req.get('user-agent'); const time = new Date().getTime(); try { // insert the record await PageLoads.create({ userAgent, time }); // send response res.send('Inserted!'); } catch (e) { console.log('Error inserting data', e) } })
Execute a query
This section covers how to execute queries against your database. In this example, every time the page is reloaded, all information currently in the table is displayed.
Modify the
/route in theindex.jsfile to call the SequelizefindAllfunction and retrieve all data from thepage_loadstable using thePageLoadsmodel:app.get('/', async (req, res) => { // get the user agent and current time const userAgent = req.get('user-agent'); const time = new Date().getTime(); try { // insert the record await PageLoads.create({ userAgent, time }); // now display everything in the table const messages = await PageLoads.findAll(); res.send(messages); } catch (e) { console.log('Error inserting data', e) } })
Now, when you reload the page, you should see all of the rows currently in the
page_loads table.
Prerequisites
To follow the steps on this page:
- Create a target Tiger Cloud service with the Real-time analytics capability.
You need your connection details. This procedure also works for self-hosted TimescaleDB.
- Install Go.
- Install the PGX driver for Go.
Connect to your Tiger Cloud service
In this section, you create a connection to Tiger Cloud using the PGX driver. PGX is a toolkit designed to help Go developers work directly with Postgres. You can use it to help your Go application interact directly with TimescaleDB.
Locate your TimescaleDB credentials and use them to compose a connection string for PGX.
You'll need:
- password
- username
- host URL
- port number
- database name
Compose your connection string variable as a libpq connection string, using this format:
connStr := "postgres://username:password@host:port/dbname"If you're using a hosted version of TimescaleDB, or if you need an SSL connection, use this format instead:
connStr := "postgres://username:password@host:port/dbname?sslmode=require"[](#)You can check that you're connected to your database with this hello world program:
package main

import (
    "context"
    "fmt"
    "os"

    "github.com/jackc/pgx/v5"
)

//connect to database using a single connection
func main() {
    /***********************************************/
    /* Single Connection to TimescaleDB/ PostgreSQL */
    /***********************************************/
    ctx := context.Background()
    connStr := "yourConnectionStringHere"
    conn, err := pgx.Connect(ctx, connStr)
    if err != nil {
        fmt.Fprintf(os.Stderr, "Unable to connect to database: %v\n", err)
        os.Exit(1)
    }
    defer conn.Close(ctx)

    //run a simple query to check our connection
    var greeting string
    err = conn.QueryRow(ctx, "select 'Hello, Timescale!'").Scan(&greeting)
    if err != nil {
        fmt.Fprintf(os.Stderr, "QueryRow failed: %v\n", err)
        os.Exit(1)
    }
    fmt.Println(greeting)
}
If you'd like to specify your connection string as an environment variable, you can use this syntax to access it in place of the
connStrvariable:os.Getenv("DATABASE_CONNECTION_STRING")
Alternatively, you can connect to TimescaleDB using a connection pool. Connection pooling is useful to conserve computing resources, and can also result in faster database queries:
To create a connection pool that can be used for concurrent connections to your database, use the
pgxpool.New()function instead ofpgx.Connect(). Also note that this script importsgithub.com/jackc/pgx/v5/pgxpool, instead ofpgx/v5which was used to create a single connection:package main import ( "context" "fmt" "os" "github.com/jackc/pgx/v5/pgxpool" ) func main() { ctx := context.Background() connStr := "yourConnectionStringHere" dbpool, err := pgxpool.New(ctx, connStr) if err != nil { fmt.Fprintf(os.Stderr, "Unable to connect to database: %v\n", err) os.Exit(1) } defer dbpool.Close() //run a simple query to check our connection var greeting string err = dbpool.QueryRow(ctx, "select 'Hello, Tiger Data (but concurrently)'").Scan(&greeting) if err != nil { fmt.Fprintf(os.Stderr, "QueryRow failed: %v\n", err) os.Exit(1) } fmt.Println(greeting) }
Create a relational table
In this section, you create a table called sensors which holds the ID, type,
and location of your fictional sensors. Additionally, you create a hypertable
called sensor_data which holds the measurements of those sensors. The
measurements contain the time, sensor_id, temperature reading, and CPU
percentage of the sensors.
Compose a string that contains the SQL statement to create a relational table. This example creates a table called
sensors, with columns for ID, type, and location:queryCreateTable := `CREATE TABLE sensors (id SERIAL PRIMARY KEY, type VARCHAR(50), location VARCHAR(50));`Execute the
CREATE TABLEstatement with theExec()function on thedbpoolobject, using the arguments of the current context and the statement string you created:package main import ( "context" "fmt" "os" "github.com/jackc/pgx/v5/pgxpool" ) func main() { ctx := context.Background() connStr := "yourConnectionStringHere" dbpool, err := pgxpool.New(ctx, connStr) if err != nil { fmt.Fprintf(os.Stderr, "Unable to connect to database: %v\n", err) os.Exit(1) } defer dbpool.Close() /********************************************/ /* Create relational table */ /********************************************/ //Create relational table called sensors queryCreateTable := `CREATE TABLE sensors (id SERIAL PRIMARY KEY, type VARCHAR(50), location VARCHAR(50));` _, err = dbpool.Exec(ctx, queryCreateTable) if err != nil { fmt.Fprintf(os.Stderr, "Unable to create SENSORS table: %v\n", err) os.Exit(1) } fmt.Println("Successfully created relational table SENSORS") }
Generate a hypertable
When you have created the relational table, you can create a hypertable. Creating tables and indexes, altering tables, inserting data, selecting data, and most other tasks are executed on the hypertable.
Create a variable for the
CREATE TABLE SQLstatement for your hypertable. Notice how the hypertable has the compulsory time column:queryCreateTable := `CREATE TABLE sensor_data ( time TIMESTAMPTZ NOT NULL, sensor_id INTEGER, temperature DOUBLE PRECISION, cpu DOUBLE PRECISION, FOREIGN KEY (sensor_id) REFERENCES sensors (id)); `Formulate the
SELECTstatement to convert the table into a hypertable. You must specify the table name to convert to a hypertable, and its time column name as the second argument. For more information, see thecreate_hypertabledocs:queryCreateHypertable := `SELECT create_hypertable('sensor_data', by_range('time'));`The
by_rangedimension builder is an addition to TimescaleDB 2.13.Execute the
CREATE TABLEstatement andSELECTstatement which converts the table into a hypertable. You can do this by calling theExec()function on thedbpoolobject, using the arguments of the current context, and thequeryCreateTableandqueryCreateHypertablestatement strings:package main import ( "context" "fmt" "os" "github.com/jackc/pgx/v5/pgxpool" ) func main() { ctx := context.Background() connStr := "yourConnectionStringHere" dbpool, err := pgxpool.New(ctx, connStr) if err != nil { fmt.Fprintf(os.Stderr, "Unable to connect to database: %v\n", err) os.Exit(1) } defer dbpool.Close() /********************************************/ /* Create Hypertable */ /********************************************/ // Create hypertable of time-series data called sensor_data queryCreateTable := `CREATE TABLE sensor_data ( time TIMESTAMPTZ NOT NULL, sensor_id INTEGER, temperature DOUBLE PRECISION, cpu DOUBLE PRECISION, FOREIGN KEY (sensor_id) REFERENCES sensors (id)); ` queryCreateHypertable := `SELECT create_hypertable('sensor_data', by_range('time'));` //execute statement _, err = dbpool.Exec(ctx, queryCreateTable+queryCreateHypertable) if err != nil { fmt.Fprintf(os.Stderr, "Unable to create the `sensor_data` hypertable: %v\n", err) os.Exit(1) } fmt.Println("Successfully created hypertable `sensor_data`") }
Insert rows of data
You can insert rows into your database in a couple of different
ways. Each of these example inserts the data from the two arrays, sensorTypes and
sensorLocations, into the relational table named sensors.
The first example inserts a single row of data at a time. The second example inserts multiple rows of data. The third example uses batch inserts to speed up the process.
Open a connection pool to the database, then use the prepared statements to formulate an
INSERTSQL statement, and execute it:package main import ( "context" "fmt" "os" "github.com/jackc/pgx/v5/pgxpool" ) func main() { ctx := context.Background() connStr := "yourConnectionStringHere" dbpool, err := pgxpool.New(ctx, connStr) if err != nil { fmt.Fprintf(os.Stderr, "Unable to connect to database: %v\n", err) os.Exit(1) } defer dbpool.Close() /********************************************/ /* INSERT into relational table */ /********************************************/ //Insert data into relational table // Slices of sample data to insert // observation i has type sensorTypes[i] and location sensorLocations[i] sensorTypes := []string{"a", "a", "b", "b"} sensorLocations := []string{"floor", "ceiling", "floor", "ceiling"} for i := range sensorTypes { //INSERT statement in SQL queryInsertMetadata := `INSERT INTO sensors (type, location) VALUES ($1, $2);` //Execute INSERT command _, err := dbpool.Exec(ctx, queryInsertMetadata, sensorTypes[i], sensorLocations[i]) if err != nil { fmt.Fprintf(os.Stderr, "Unable to insert data into database: %v\n", err) os.Exit(1) } fmt.Printf("Inserted sensor (%s, %s) into database \n", sensorTypes[i], sensorLocations[i]) } fmt.Println("Successfully inserted all sensors into database") }
Instead of inserting a single row of data at a time, you can use this procedure to insert multiple rows of data, instead:
This example uses Postgres to generate some sample time-series to insert into the
sensor_datahypertable. Define the SQL statement to generate the data, calledqueryDataGeneration. Then use the.Query()function to execute the statement and return the sample data. The data returned by the query is stored inresults, a slice of structs, which is then used as a source to insert data into the hypertable:package main import ( "context" "fmt" "os" "time" "github.com/jackc/pgx/v5/pgxpool" ) func main() { ctx := context.Background() connStr := "yourConnectionStringHere" dbpool, err := pgxpool.New(ctx, connStr) if err != nil { fmt.Fprintf(os.Stderr, "Unable to connect to database: %v\n", err) os.Exit(1) } defer dbpool.Close() // Generate data to insert //SQL query to generate sample data queryDataGeneration := ` SELECT generate_series(now() - interval '24 hour', now(), interval '5 minute') AS time, floor(random() * (3) + 1)::int as sensor_id, random()*100 AS temperature, random() AS cpu ` //Execute query to generate samples for sensor_data hypertable rows, err := dbpool.Query(ctx, queryDataGeneration) if err != nil { fmt.Fprintf(os.Stderr, "Unable to generate sensor data: %v\n", err) os.Exit(1) } defer rows.Close() fmt.Println("Successfully generated sensor data") //Store data generated in slice results type result struct { Time time.Time SensorId int Temperature float64 CPU float64 } var results []result for rows.Next() { var r result err = rows.Scan(&r.Time, &r.SensorId, &r.Temperature, &r.CPU) if err != nil { fmt.Fprintf(os.Stderr, "Unable to scan %v\n", err) os.Exit(1) } results = append(results, r) } // Any errors encountered by rows.Next or rows.Scan are returned here if rows.Err() != nil { fmt.Fprintf(os.Stderr, "rows Error: %v\n", rows.Err()) os.Exit(1) } // Check contents of results slice fmt.Println("Contents of RESULTS slice") for i := range results { var r result r = results[i] fmt.Printf("Time: %s | ID: %d | Temperature: %f | CPU: %f |\n", &r.Time, r.SensorId, r.Temperature, r.CPU) } }Formulate an SQL insert statement for the
sensor_datahypertable://SQL query to generate sample data queryInsertTimeseriesData := ` INSERT INTO sensor_data (time, sensor_id, temperature, cpu) VALUES ($1, $2, $3, $4); `Execute the SQL statement for each sample in the results slice:
//Insert contents of results slice into TimescaleDB
for i := range results {
    var r result
    r = results[i]
    _, err := dbpool.Exec(ctx, queryInsertTimeseriesData, r.Time, r.SensorId, r.Temperature, r.CPU)
    if err != nil {
        fmt.Fprintf(os.Stderr, "Unable to insert sample into TimescaleDB %v\n", err)
        os.Exit(1)
    }
    defer rows.Close()
}
fmt.Println("Successfully inserted samples into sensor_data hypertable")
[](#)This example
main.gogenerates sample data and inserts it into thesensor_datahypertable:package main import ( "context" "fmt" "os" "time" "github.com/jackc/pgx/v5/pgxpool" ) func main() { /********************************************/ /* Connect using Connection Pool */ /********************************************/ ctx := context.Background() connStr := "yourConnectionStringHere" dbpool, err := pgxpool.New(ctx, connStr) if err != nil { fmt.Fprintf(os.Stderr, "Unable to connect to database: %v\n", err) os.Exit(1) } defer dbpool.Close() /********************************************/ /* Insert data into hypertable */ /********************************************/ // Generate data to insert //SQL query to generate sample data queryDataGeneration := ` SELECT generate_series(now() - interval '24 hour', now(), interval '5 minute') AS time, floor(random() * (3) + 1)::int as sensor_id, random()*100 AS temperature, random() AS cpu ` //Execute query to generate samples for sensor_data hypertable rows, err := dbpool.Query(ctx, queryDataGeneration) if err != nil { fmt.Fprintf(os.Stderr, "Unable to generate sensor data: %v\n", err) os.Exit(1) } defer rows.Close() fmt.Println("Successfully generated sensor data") //Store data generated in slice results type result struct { Time time.Time SensorId int Temperature float64 CPU float64 } var results []result for rows.Next() { var r result err = rows.Scan(&r.Time, &r.SensorId, &r.Temperature, &r.CPU) if err != nil { fmt.Fprintf(os.Stderr, "Unable to scan %v\n", err) os.Exit(1) } results = append(results, r) } // Any errors encountered by rows.Next or rows.Scan are returned here if rows.Err() != nil { fmt.Fprintf(os.Stderr, "rows Error: %v\n", rows.Err()) os.Exit(1) } // Check contents of results slice fmt.Println("Contents of RESULTS slice") for i := range results { var r result r = results[i] fmt.Printf("Time: %s | ID: %d | Temperature: %f | CPU: %f |\n", &r.Time, r.SensorId, r.Temperature, r.CPU) } //Insert contents of results slice into TimescaleDB //SQL query to generate sample data queryInsertTimeseriesData := ` INSERT INTO sensor_data (time, sensor_id, temperature, cpu) VALUES ($1, $2, $3, $4); ` //Insert contents of results slice into TimescaleDB for i := range results { var r result r = results[i] _, err := dbpool.Exec(ctx, queryInsertTimeseriesData, r.Time, r.SensorId, r.Temperature, r.CPU) if err != nil { fmt.Fprintf(os.Stderr, "Unable to insert sample into TimescaleDB %v\n", err) os.Exit(1) } defer rows.Close() } fmt.Println("Successfully inserted samples into sensor_data hypertable") }
Inserting multiple rows of data using this method executes as many insert
statements as there are samples to be inserted. This can make ingestion of data
slow. To speed up ingestion, you can batch insert data instead.
Here's a sample pattern for how to do so, using the sample data you generated in
the previous procedure. It uses the pgx Batch object:
This example batch inserts data into the database:
package main

import (
    "context"
    "fmt"
    "os"
    "time"

    "github.com/jackc/pgx/v5"
    "github.com/jackc/pgx/v5/pgxpool"
)

func main() {
    /********************************************/
    /* Connect using Connection Pool            */
    /********************************************/
    ctx := context.Background()
    connStr := "yourConnectionStringHere"
    dbpool, err := pgxpool.New(ctx, connStr)
    if err != nil {
        fmt.Fprintf(os.Stderr, "Unable to connect to database: %v\n", err)
        os.Exit(1)
    }
    defer dbpool.Close()

    // Generate data to insert

    //SQL query to generate sample data
    queryDataGeneration := `
        SELECT generate_series(now() - interval '24 hour', now(), interval '5 minute') AS time,
        floor(random() * (3) + 1)::int as sensor_id,
        random()*100 AS temperature,
        random() AS cpu
        `

    //Execute query to generate samples for sensor_data hypertable
    rows, err := dbpool.Query(ctx, queryDataGeneration)
    if err != nil {
        fmt.Fprintf(os.Stderr, "Unable to generate sensor data: %v\n", err)
        os.Exit(1)
    }
    defer rows.Close()

    fmt.Println("Successfully generated sensor data")

    //Store data generated in slice results
    type result struct {
        Time        time.Time
        SensorId    int
        Temperature float64
        CPU         float64
    }
    var results []result
    for rows.Next() {
        var r result
        err = rows.Scan(&r.Time, &r.SensorId, &r.Temperature, &r.CPU)
        if err != nil {
            fmt.Fprintf(os.Stderr, "Unable to scan %v\n", err)
            os.Exit(1)
        }
        results = append(results, r)
    }
    // Any errors encountered by rows.Next or rows.Scan are returned here
    if rows.Err() != nil {
        fmt.Fprintf(os.Stderr, "rows Error: %v\n", rows.Err())
        os.Exit(1)
    }

    // Check contents of results slice
    /*fmt.Println("Contents of RESULTS slice")
    for i := range results {
        var r result
        r = results[i]
        fmt.Printf("Time: %s | ID: %d | Temperature: %f | CPU: %f |\n", &r.Time, r.SensorId, r.Temperature, r.CPU)
    }*/

    //Insert contents of results slice into TimescaleDB
    //SQL query to generate sample data
    queryInsertTimeseriesData := `
        INSERT INTO sensor_data (time, sensor_id, temperature, cpu) VALUES ($1, $2, $3, $4);
        `

    /********************************************/
    /* Batch Insert into TimescaleDB            */
    /********************************************/
    //create batch
    batch := &pgx.Batch{}
    //load insert statements into batch queue
    for i := range results {
        var r result
        r = results[i]
        batch.Queue(queryInsertTimeseriesData, r.Time, r.SensorId, r.Temperature, r.CPU)
    }
    batch.Queue("select count(*) from sensor_data")

    //send batch to connection pool
    br := dbpool.SendBatch(ctx, batch)
    //execute statements in batch queue
    _, err = br.Exec()
    if err != nil {
        fmt.Fprintf(os.Stderr, "Unable to execute statement in batch queue %v\n", err)
        os.Exit(1)
    }
    fmt.Println("Successfully batch inserted data")

    //Compare length of results slice to size of table
    fmt.Printf("size of results: %d\n", len(results))
    //check size of table for number of rows inserted
    // result of last SELECT statement
    var rowsInserted int
    err = br.QueryRow().Scan(&rowsInserted)
    fmt.Printf("size of table: %d\n", rowsInserted)

    err = br.Close()
    if err != nil {
        fmt.Fprintf(os.Stderr, "Unable to closer batch %v\n", err)
        os.Exit(1)
    }
}
Execute a query
This section covers how to execute queries against your database.
Define the SQL query you'd like to run on the database. This example uses a SQL query that combines time-series and relational data. It returns the average CPU values for every 5 minute interval, for sensors located on location
ceilingand of typea:// Formulate query in SQL // Note the use of prepared statement placeholders $1 and $2 queryTimebucketFiveMin := ` SELECT time_bucket('5 minutes', time) AS five_min, avg(cpu) FROM sensor_data JOIN sensors ON sensors.id = sensor_data.sensor_id WHERE sensors.location = $1 AND sensors.type = $2 GROUP BY five_min ORDER BY five_min DESC; `Use the
.Query()function to execute the query string. Make sure you specify the relevant placeholders://Execute query on TimescaleDB rows, err := dbpool.Query(ctx, queryTimebucketFiveMin, "ceiling", "a") if err != nil { fmt.Fprintf(os.Stderr, "Unable to execute query %v\n", err) os.Exit(1) } defer rows.Close() fmt.Println("Successfully executed query")Access the rows returned by
.Query(). Create a struct with fields representing the columns that you expect to be returned, then use therows.Next()function to iterate through the rows returned and fillresultswith the array of structs. This uses therows.Scan()function, passing in pointers to the fields that you want to scan for results.This example prints out the results returned from the query, but you might want to use those results for some other purpose. Once you've scanned through all the rows returned you can then use the results array however you like.
//Do something with the results of query
// Struct for results
type result2 struct {
    Bucket time.Time
    Avg    float64
}

// Print rows returned and fill up results slice for later use
var results []result2
for rows.Next() {
    var r result2
    err = rows.Scan(&r.Bucket, &r.Avg)
    if err != nil {
        fmt.Fprintf(os.Stderr, "Unable to scan %v\n", err)
        os.Exit(1)
    }
    results = append(results, r)
    fmt.Printf("Time bucket: %s | Avg: %f\n", &r.Bucket, r.Avg)
}

// Any errors encountered by rows.Next or rows.Scan are returned here
if rows.Err() != nil {
    fmt.Fprintf(os.Stderr, "rows Error: %v\n", rows.Err())
    os.Exit(1)
}

// use results here…
[](#)This example program runs a query, and accesses the results of that query:
package main

import (
    "context"
    "fmt"
    "os"
    "time"

    "github.com/jackc/pgx/v5/pgxpool"
)

func main() {
    ctx := context.Background()
    connStr := "yourConnectionStringHere"
    dbpool, err := pgxpool.New(ctx, connStr)
    if err != nil {
        fmt.Fprintf(os.Stderr, "Unable to connect to database: %v\n", err)
        os.Exit(1)
    }
    defer dbpool.Close()

    /********************************************/
    /* Execute a query                          */
    /********************************************/

    // Formulate query in SQL
    // Note the use of prepared statement placeholders $1 and $2
    queryTimebucketFiveMin := `
        SELECT time_bucket('5 minutes', time) AS five_min, avg(cpu)
        FROM sensor_data
        JOIN sensors ON sensors.id = sensor_data.sensor_id
        WHERE sensors.location = $1 AND sensors.type = $2
        GROUP BY five_min
        ORDER BY five_min DESC;
        `

    //Execute query on TimescaleDB
    rows, err := dbpool.Query(ctx, queryTimebucketFiveMin, "ceiling", "a")
    if err != nil {
        fmt.Fprintf(os.Stderr, "Unable to execute query %v\n", err)
        os.Exit(1)
    }
    defer rows.Close()

    fmt.Println("Successfully executed query")

    //Do something with the results of query
    // Struct for results
    type result2 struct {
        Bucket time.Time
        Avg    float64
    }

    // Print rows returned and fill up results slice for later use
    var results []result2
    for rows.Next() {
        var r result2
        err = rows.Scan(&r.Bucket, &r.Avg)
        if err != nil {
            fmt.Fprintf(os.Stderr, "Unable to scan %v\n", err)
            os.Exit(1)
        }
        results = append(results, r)
        fmt.Printf("Time bucket: %s | Avg: %f\n", &r.Bucket, r.Avg)
    }
    // Any errors encountered by rows.Next or rows.Scan are returned here
    if rows.Err() != nil {
        fmt.Fprintf(os.Stderr, "rows Error: %v\n", rows.Err())
        os.Exit(1)
    }
}
Next steps
Now that you're able to connect, read, and write to a TimescaleDB instance from your Go application, be sure to check out these advanced TimescaleDB tutorials:
- Refer to the pgx documentation for more information about pgx.
- Get up and running with TimescaleDB with the Getting Started tutorial.
- Want fast inserts on CSV data? Check out TimescaleDB parallel copy, a tool for fast inserts, written in Go.
Prerequisites
To follow the steps on this page:
- Create a target Tiger Cloud service with the Real-time analytics capability.
You need your connection details. This procedure also works for self-hosted TimescaleDB.
- Install the Java Development Kit (JDK).
- Install the PostgreSQL JDBC driver.
All code in this quick start is for Java 16 and later. If you are working with older JDK versions, use legacy coding techniques.
Connect to your Tiger Cloud service
In this section, you create a connection to your service using an application in
a single file. You can use any of your favorite build tools, including gradle
or maven.
Create a directory containing a text file called
Main.java, with this content:package com.timescale.java; public class Main { public static void main(String... args) { System.out.println("Hello, World!"); } }From the command line in the current directory, run the application:
java Main.javaIf the command is successful,
Hello, World!line output is printed to your console.Import the PostgreSQL JDBC driver. If you are using a dependency manager, include the PostgreSQL JDBC Driver as a dependency.
Download the JAR artifact of the JDBC Driver and save it with the
Main.javafile.Import the
JDBC Driverinto the Java application and display a list of available drivers for the check:package com.timescale.java; import java.sql.DriverManager; public class Main { public static void main(String... args) { DriverManager.drivers().forEach(System.out::println); } }Run all the examples:
java -cp *.jar Main.java
If the command is successful, a string similar to
org.postgresql.Driver@7f77e91b is printed to your console. This means that you
are ready to connect to TimescaleDB from Java.
Locate your TimescaleDB credentials and use them to compose a connection string for JDBC.
You'll need:
- password
- username
- host URL
- port
- database name
Compose your connection string variable, using this format:
var connUrl = "jdbc:postgresql://<HOSTNAME>:<PORT>/<DATABASE_NAME>?user=<USERNAME>&password=<PASSWORD>";For more information about creating connection strings, see the JDBC documentation.
This method of composing a connection string is for test or development purposes only. For production, use environment variables for sensitive details like your password, hostname, and port number.
package com.timescale.java;

import java.sql.DriverManager;
import java.sql.SQLException;

public class Main {

    public static void main(String... args) throws SQLException {
        var connUrl = "jdbc:postgresql://<HOSTNAME>:<PORT>/<DATABASE_NAME>?user=<USERNAME>&password=<PASSWORD>";
        var conn = DriverManager.getConnection(connUrl);
        System.out.println(conn.getClientInfo());
    }
}
Run the code:
java -cp *.jar Main.javaIf the command is successful, a string similar to
{ApplicationName=PostgreSQL JDBC Driver}is printed to your console.
Create a relational table
In this section, you create a table called sensors which holds the ID, type,
and location of your fictional sensors. Additionally, you create a hypertable
called sensor_data which holds the measurements of those sensors. The
measurements contain the time, sensor_id, temperature reading, and CPU
percentage of the sensors.
Compose a string which contains the SQL statement to create a relational table. This example creates a table called
sensors, with columnsid,typeandlocation:CREATE TABLE sensors ( id SERIAL PRIMARY KEY, type TEXT NOT NULL, location TEXT NOT NULL );Create a statement, execute the query you created in the previous step, and check that the table was created successfully:
package com.timescale.java;

import java.sql.DriverManager;
import java.sql.SQLException;

public class Main {

    public static void main(String... args) throws SQLException {
        var connUrl = "jdbc:postgresql://<HOSTNAME>:<PORT>/<DATABASE_NAME>?user=<USERNAME>&password=<PASSWORD>";
        var conn = DriverManager.getConnection(connUrl);

        var createSensorTableQuery = """
                CREATE TABLE sensors (
                    id SERIAL PRIMARY KEY,
                    type TEXT NOT NULL,
                    location TEXT NOT NULL
                )
                """;
        try (var stmt = conn.createStatement()) {
            stmt.execute(createSensorTableQuery);
        }

        var showAllTablesQuery = "SELECT tablename FROM pg_catalog.pg_tables WHERE schemaname = 'public'";
        try (var stmt = conn.createStatement();
             var rs = stmt.executeQuery(showAllTablesQuery)) {
            System.out.println("Tables in the current database: ");
            while (rs.next()) {
                System.out.println(rs.getString("tablename"));
            }
        }
    }
}
Create a hypertable
When you have created the relational table, you can create a hypertable. Creating tables and indexes, altering tables, inserting data, selecting data, and most other tasks are executed on the hypertable.
Create a
CREATE TABLESQL statement for your hypertable. Notice how the hypertable has the compulsory time column:CREATE TABLE sensor_data ( time TIMESTAMPTZ NOT NULL, sensor_id INTEGER REFERENCES sensors (id), value DOUBLE PRECISION );Create a statement, execute the query you created in the previous step:
SELECT create_hypertable('sensor_data', by_range('time'));The
by_rangeandby_hashdimension builder is an addition to TimescaleDB 2.13.Execute the two statements you created, and commit your changes to the database:
package com.timescale.java;

import java.sql.Connection;
import java.sql.DriverManager;
import java.sql.SQLException;
import java.util.List;

public class Main {

    public static void main(String... args) {
        final var connUrl = "jdbc:postgresql://<HOSTNAME>:<PORT>/<DATABASE_NAME>?user=<USERNAME>&password=<PASSWORD>";
        try (var conn = DriverManager.getConnection(connUrl)) {
            createSchema(conn);
            insertData(conn);
        } catch (SQLException ex) {
            System.err.println(ex.getMessage());
        }
    }

    private static void createSchema(final Connection conn) throws SQLException {
        try (var stmt = conn.createStatement()) {
            stmt.execute("""
                    CREATE TABLE sensors (
                        id SERIAL PRIMARY KEY,
                        type TEXT NOT NULL,
                        location TEXT NOT NULL
                    )
                    """);
        }

        try (var stmt = conn.createStatement()) {
            stmt.execute("""
                    CREATE TABLE sensor_data (
                        time TIMESTAMPTZ NOT NULL,
                        sensor_id INTEGER REFERENCES sensors (id),
                        value DOUBLE PRECISION
                    )
                    """);
        }

        try (var stmt = conn.createStatement()) {
            stmt.execute("SELECT create_hypertable('sensor_data', by_range('time'))");
        }
    }
}
Insert data
You can insert data into your hypertables in several different ways. In this section, you can insert single rows, or insert by batches of rows.
Open a connection to the database, use prepared statements to formulate the
INSERTSQL statement, then execute the statement:final List<Sensor> sensors = List.of( new Sensor("temperature", "bedroom"), new Sensor("temperature", "living room"), new Sensor("temperature", "outside"), new Sensor("humidity", "kitchen"), new Sensor("humidity", "outside")); for (final var sensor : sensors) { try (var stmt = conn.prepareStatement("INSERT INTO sensors (type, location) VALUES (?, ?)")) { stmt.setString(1, sensor.type()); stmt.setString(2, sensor.location()); stmt.executeUpdate(); } }
If you want to insert a batch of rows by using a batching mechanism. In this
example, you generate some sample time-series data to insert into the
sensor_data hypertable:
Insert batches of rows:
final var sensorDataCount = 100; final var insertBatchSize = 10; try (var stmt = conn.prepareStatement(""" INSERT INTO sensor_data (time, sensor_id, value) VALUES ( generate_series(now() - INTERVAL '24 hours', now(), INTERVAL '5 minutes'), floor(random() * 4 + 1)::INTEGER, random() ) """)) { for (int i = 0; i < sensorDataCount; i++) { stmt.addBatch(); if ((i > 0 && i % insertBatchSize == 0) || i == sensorDataCount - 1) { stmt.executeBatch(); } } }
Execute a query
This section covers how to execute queries against your database.
Execute queries on TimescaleDB
Define the SQL query you'd like to run on the database. This example combines time-series and relational data. It returns the average values for every 15 minute interval for sensors with specific type and location.
SELECT time_bucket('15 minutes', time) AS bucket, avg(value) FROM sensor_data JOIN sensors ON sensors.id = sensor_data.sensor_id WHERE sensors.type = ? AND sensors.location = ? GROUP BY bucket ORDER BY bucket DESC;Execute the query with the prepared statement and read out the result set for all
a-type sensors located on thefloor:try (var stmt = conn.prepareStatement(""" SELECT time_bucket('15 minutes', time) AS bucket, avg(value) FROM sensor_data JOIN sensors ON sensors.id = sensor_data.sensor_id WHERE sensors.type = ? AND sensors.location = ? GROUP BY bucket ORDER BY bucket DESC """)) { stmt.setString(1, "temperature"); stmt.setString(2, "living room"); try (var rs = stmt.executeQuery()) { while (rs.next()) { System.out.printf("%s: %f%n", rs.getTimestamp(1), rs.getDouble(2)); } } }If the command is successful, you'll see output like this:
2021-05-12 23:30:00.0: 0,508649 2021-05-12 23:15:00.0: 0,477852 2021-05-12 23:00:00.0: 0,462298 2021-05-12 22:45:00.0: 0,457006 2021-05-12 22:30:00.0: 0,568744 ...
Next steps
Now that you're able to connect, read, and write to a TimescaleDB instance from your Java application, and generate the scaffolding necessary to build a new application from an existing TimescaleDB instance, be sure to check out these advanced TimescaleDB tutorials:
Complete code samples
This section contains complete code samples.
Complete code sample
package com.timescale.java;
import java.sql.Connection;
import java.sql.DriverManager;
import java.sql.SQLException;
import java.util.List;
public class Main {
public static void main(String... args) {
final var connUrl = "jdbc:postgresql://<HOSTNAME>:<PORT>/<DATABASE_NAME>?user=<USERNAME>&password=<PASSWORD>";
try (var conn = DriverManager.getConnection(connUrl)) {
createSchema(conn);
insertData(conn);
} catch (SQLException ex) {
System.err.println(ex.getMessage());
}
}
private static void createSchema(final Connection conn) throws SQLException {
try (var stmt = conn.createStatement()) {
stmt.execute("""
CREATE TABLE sensors (
id SERIAL PRIMARY KEY,
type TEXT NOT NULL,
location TEXT NOT NULL
)
""");
}
try (var stmt = conn.createStatement()) {
stmt.execute("""
CREATE TABLE sensor_data (
time TIMESTAMPTZ NOT NULL,
sensor_id INTEGER REFERENCES sensors (id),
value DOUBLE PRECISION
)
""");
}
try (var stmt = conn.createStatement()) {
stmt.execute("SELECT create_hypertable('sensor_data', by_range('time'))");
}
}
private static void insertData(final Connection conn) throws SQLException {
final List<Sensor> sensors = List.of(
        new Sensor("temperature", "bedroom"),
        new Sensor("temperature", "living room"),
        new Sensor("temperature", "outside"),
        new Sensor("humidity", "kitchen"),
        new Sensor("humidity", "outside"));
for (final var sensor : sensors) {
    try (var stmt = conn.prepareStatement("INSERT INTO sensors (type, location) VALUES (?, ?)")) {
        stmt.setString(1, sensor.type());
        stmt.setString(2, sensor.location());
        stmt.executeUpdate();
    }
}
final var sensorDataCount = 100;
final var insertBatchSize = 10;
try (var stmt = conn.prepareStatement("""
        INSERT INTO sensor_data (time, sensor_id, value)
        VALUES (
            generate_series(now() - INTERVAL '24 hours', now(), INTERVAL '5 minutes'),
            floor(random() * 4 + 1)::INTEGER,
            random()
        )
        """)) {
    for (int i = 0; i < sensorDataCount; i++) {
        stmt.addBatch();

        if ((i > 0 && i % insertBatchSize == 0) || i == sensorDataCount - 1) {
            stmt.executeBatch();
        }
    }
}
}
private record Sensor(String type, String location) {
}
}
Execute more complex queries
package com.timescale.java;
import java.sql.Connection;
import java.sql.DriverManager;
import java.sql.SQLException;
import java.util.List;
public class Main {
public static void main(String... args) {
final var connUrl = "jdbc:postgresql://<HOSTNAME>:<PORT>/<DATABASE_NAME>?user=<USERNAME>&password=<PASSWORD>";
try (var conn = DriverManager.getConnection(connUrl)) {
createSchema(conn);
insertData(conn);
executeQueries(conn);
} catch (SQLException ex) {
System.err.println(ex.getMessage());
}
}
private static void createSchema(final Connection conn) throws SQLException {
try (var stmt = conn.createStatement()) {
stmt.execute("""
CREATE TABLE sensors (
id SERIAL PRIMARY KEY,
type TEXT NOT NULL,
location TEXT NOT NULL
)
""");
}
try (var stmt = conn.createStatement()) {
stmt.execute("""
CREATE TABLE sensor_data (
time TIMESTAMPTZ NOT NULL,
sensor_id INTEGER REFERENCES sensors (id),
value DOUBLE PRECISION
)
""");
}
try (var stmt = conn.createStatement()) {
stmt.execute("SELECT create_hypertable('sensor_data', by_range('time'))");
}
}
private static void insertData(final Connection conn) throws SQLException {
final List<Sensor> sensors = List.of(
new Sensor("temperature", "bedroom"),
new Sensor("temperature", "living room"),
new Sensor("temperature", "outside"),
new Sensor("humidity", "kitchen"),
new Sensor("humidity", "outside"));
for (final var sensor : sensors) {
try (var stmt = conn.prepareStatement("INSERT INTO sensors (type, location) VALUES (?, ?)")) {
stmt.setString(1, sensor.type());
stmt.setString(2, sensor.location());
stmt.executeUpdate();
}
}
final var sensorDataCount = 100;
final var insertBatchSize = 10;
try (var stmt = conn.prepareStatement("""
INSERT INTO sensor_data (time, sensor_id, value)
VALUES (
generate_series(now() - INTERVAL '24 hours', now(), INTERVAL '5 minutes'),
floor(random() * 4 + 1)::INTEGER,
random()
)
""")) {
for (int i = 0; i < sensorDataCount; i++) {
stmt.addBatch();
if ((i > 0 && i % insertBatchSize == 0) || i == sensorDataCount - 1) {
stmt.executeBatch();
}
}
}
}
private static void executeQueries(final Connection conn) throws SQLException {
try (var stmt = conn.prepareStatement("""
SELECT time_bucket('15 minutes', time) AS bucket, avg(value)
FROM sensor_data
JOIN sensors ON sensors.id = sensor_data.sensor_id
WHERE sensors.type = ? AND sensors.location = ?
GROUP BY bucket
ORDER BY bucket DESC
""")) {
stmt.setString(1, "temperature");
stmt.setString(2, "living room");
try (var rs = stmt.executeQuery()) {
while (rs.next()) {
System.out.printf("%s: %f%n", rs.getTimestamp(1), rs.getDouble(2));
}
}
}
}
private record Sensor(String type, String location) {
}
}
You are not limited to these languages. Tiger Cloud is based on Postgres, you can interface with TimescaleDB and Tiger Cloud using any Postgres client driver.
===== PAGE: https://docs.tigerdata.com/getting-started/services/ =====
Create your first Tiger Cloud service
Tiger Cloud is the modern Postgres data platform for all your applications. It enhances Postgres to handle time series, events, real-time analytics, and vector search—all in a single database alongside transactional workloads.
You get one system that handles live data ingestion, late and out-of-order updates, and low latency queries, with the performance, reliability, and scalability your app needs. Ideal for IoT, crypto, finance, SaaS, and a myriad other domains, Tiger Cloud allows you to build data-heavy, mission-critical apps while retaining the familiarity and reliability of Postgres.
What is a Tiger Cloud service?
A Tiger Cloud service is a single optimised Postgres instance extended with innovations in the database engine and cloud infrastructure to deliver speed without sacrifice. A Tiger Cloud service is 10-1000x faster at scale! It is ideal for applications requiring strong data consistency, complex relationships, and advanced querying capabilities. Get ACID compliance, extensive SQL support, JSON handling, and extensibility through custom functions, data types, and extensions.
Each service is associated with a project in Tiger Cloud. Each project can have multiple services. Each user is a member of one or more projects.
You create free and standard services in Tiger Cloud Console, depending on your pricing plan. A free service comes at zero cost and gives you limited resources to get to know Tiger Cloud. Once you are ready to try out more advanced features, you can switch to a paid plan and convert your free service to a standard one.

The Free pricing plan and services are currently in beta.
To the Postgres you know and love, Tiger Cloud adds the following capabilities:
Standard services:
- Real-time analytics: store and query time-series data at scale for real-time analytics and other use cases. Get faster time-based queries with hypertables, continuous aggregates, and columnar storage. Save money by compressing data into the columnstore, moving cold data to low-cost bottomless storage in Amazon S3, and deleting old data with automated policies.
- AI-focused: build AI applications from start to scale. Get fast and accurate similarity search with the pgvector and pgvectorscale extensions.
- Hybrid applications: get a full set of tools to develop applications that combine time-based data and AI.
All standard Tiger Cloud services include the tooling you expect for production and developer environments: live migration, automatic backups and PITR, high availability, read replicas, data forking, connection pooling, tiered storage, usage-based storage, secure in-Tiger Cloud Console SQL editing, service metrics and insights, streamlined maintenance, and much more. Tiger Cloud continuously monitors your services and prevents common Postgres out-of-memory crashes.
- Free services:
Postgres with TimescaleDB and vector extensions
Free services offer limited resources and a basic feature scope, perfect to get to know Tiger Cloud in a development environment.
You manage your Tiger Cloud services and interact with your data in Tiger Cloud Console using the following modes:
| Ops mode | Data mode |
|---|---|
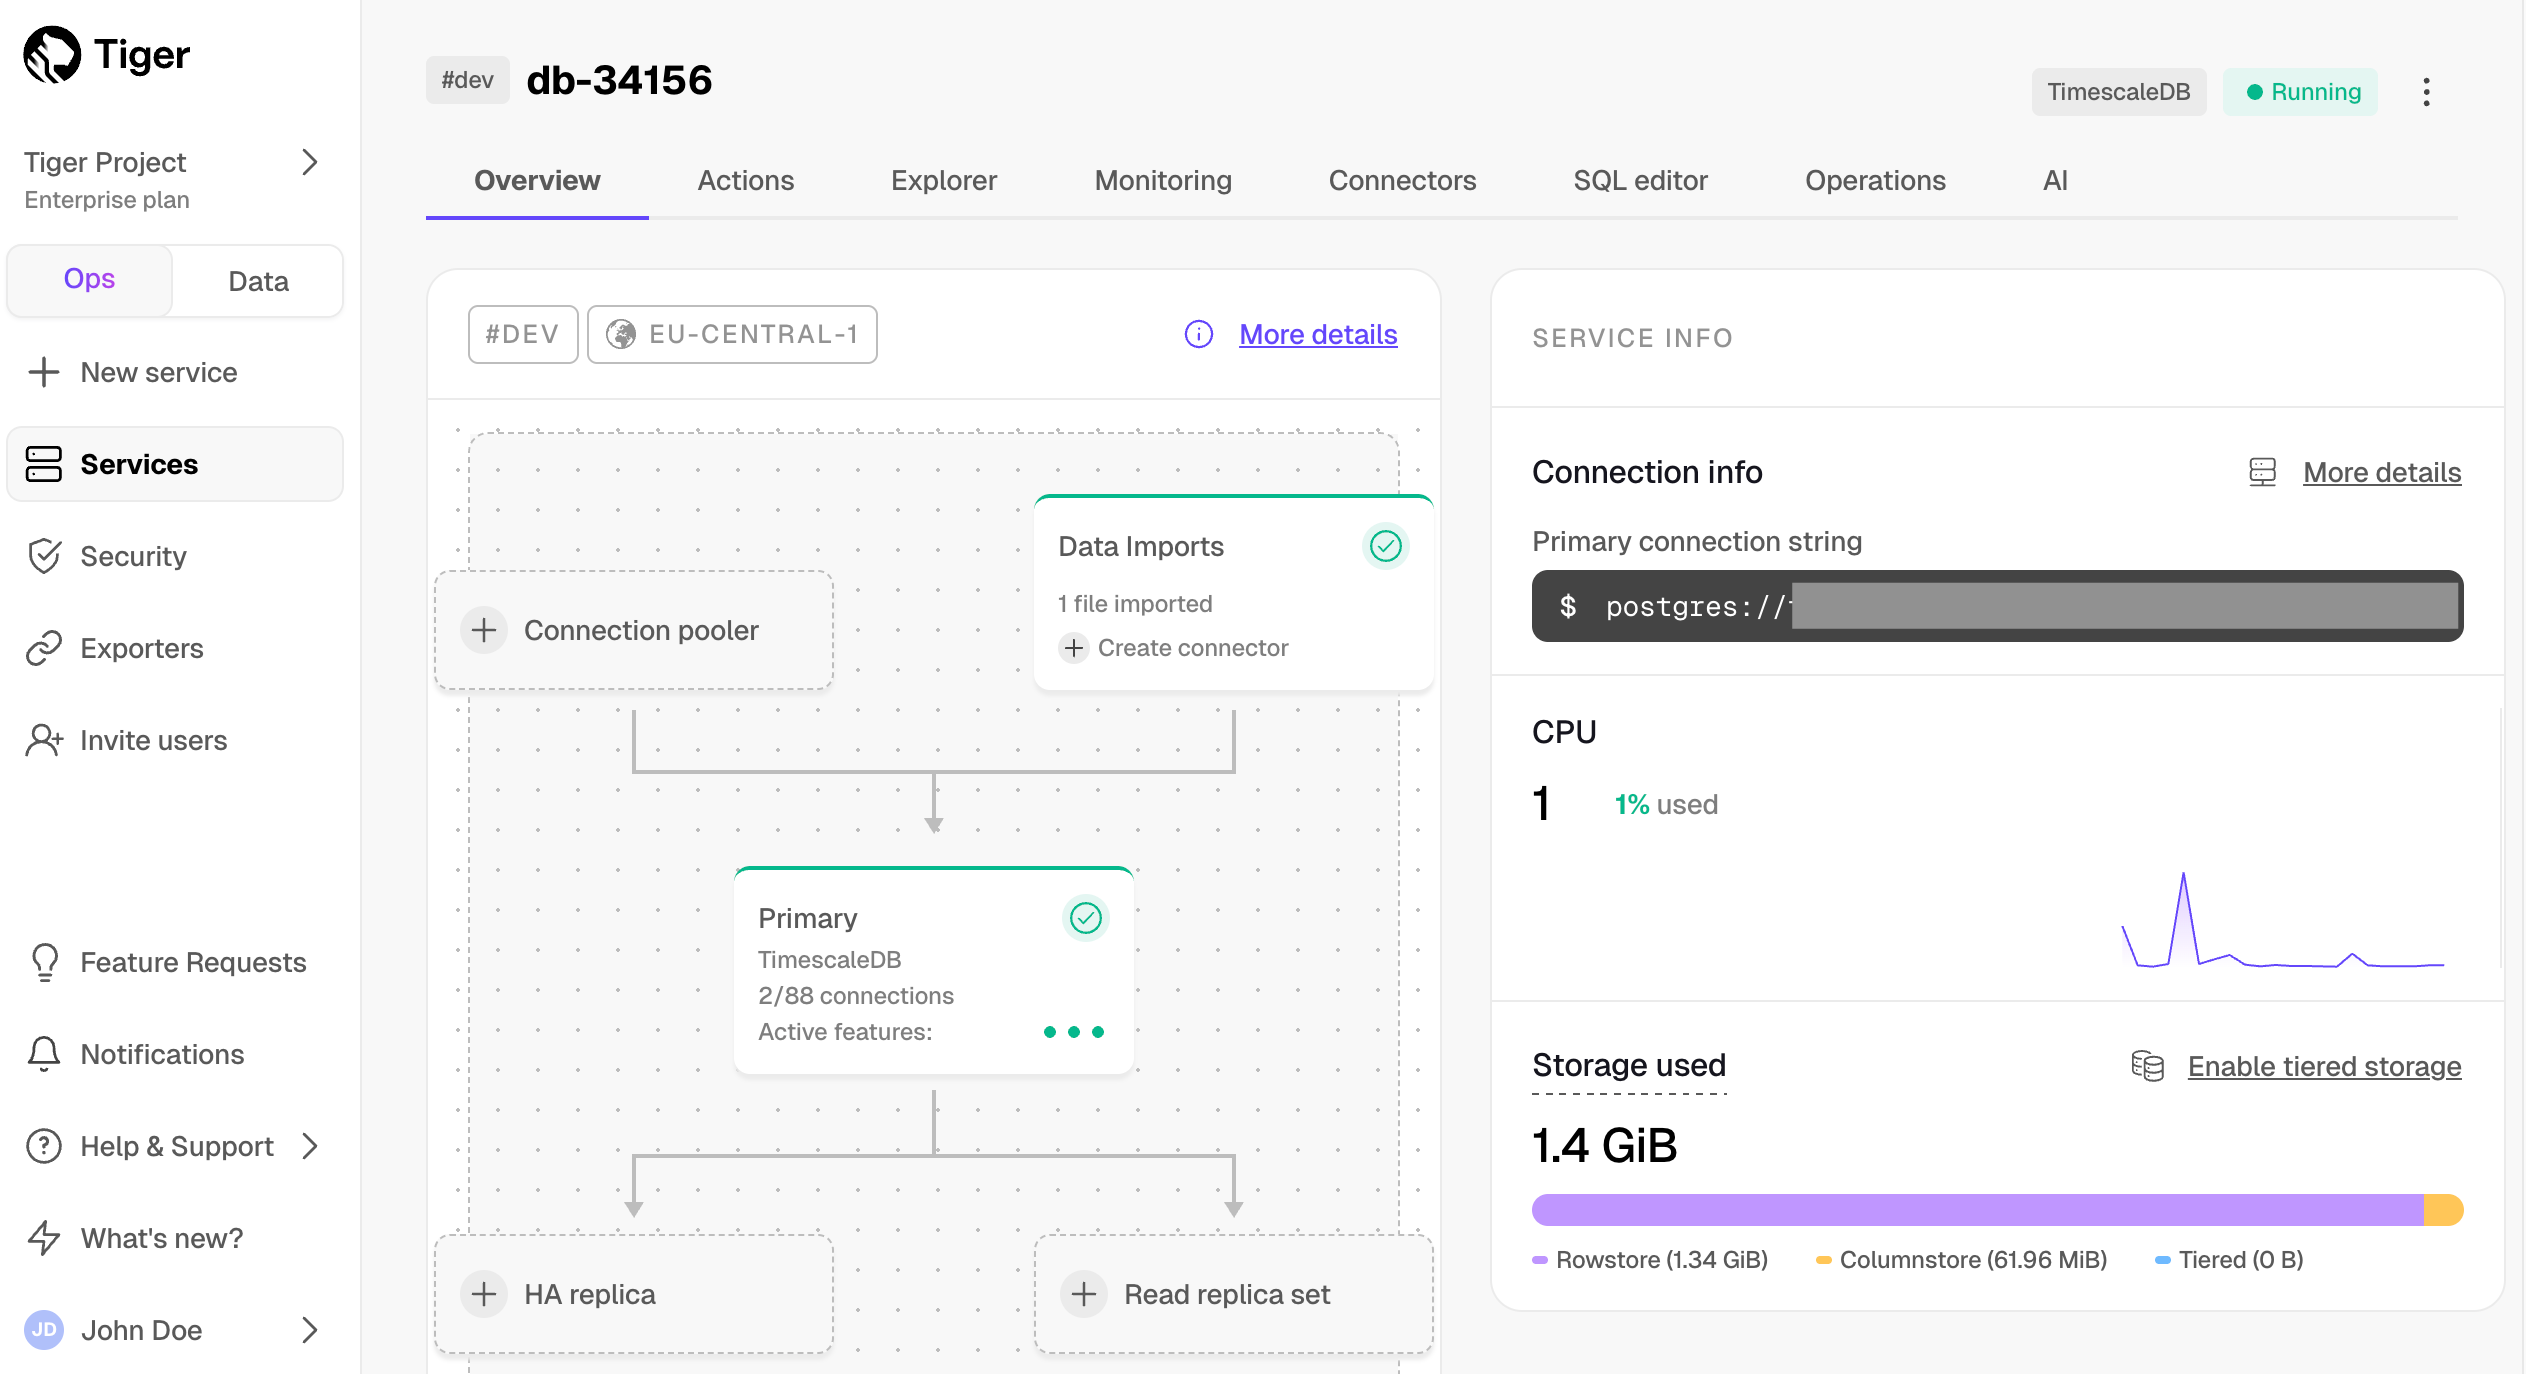 |
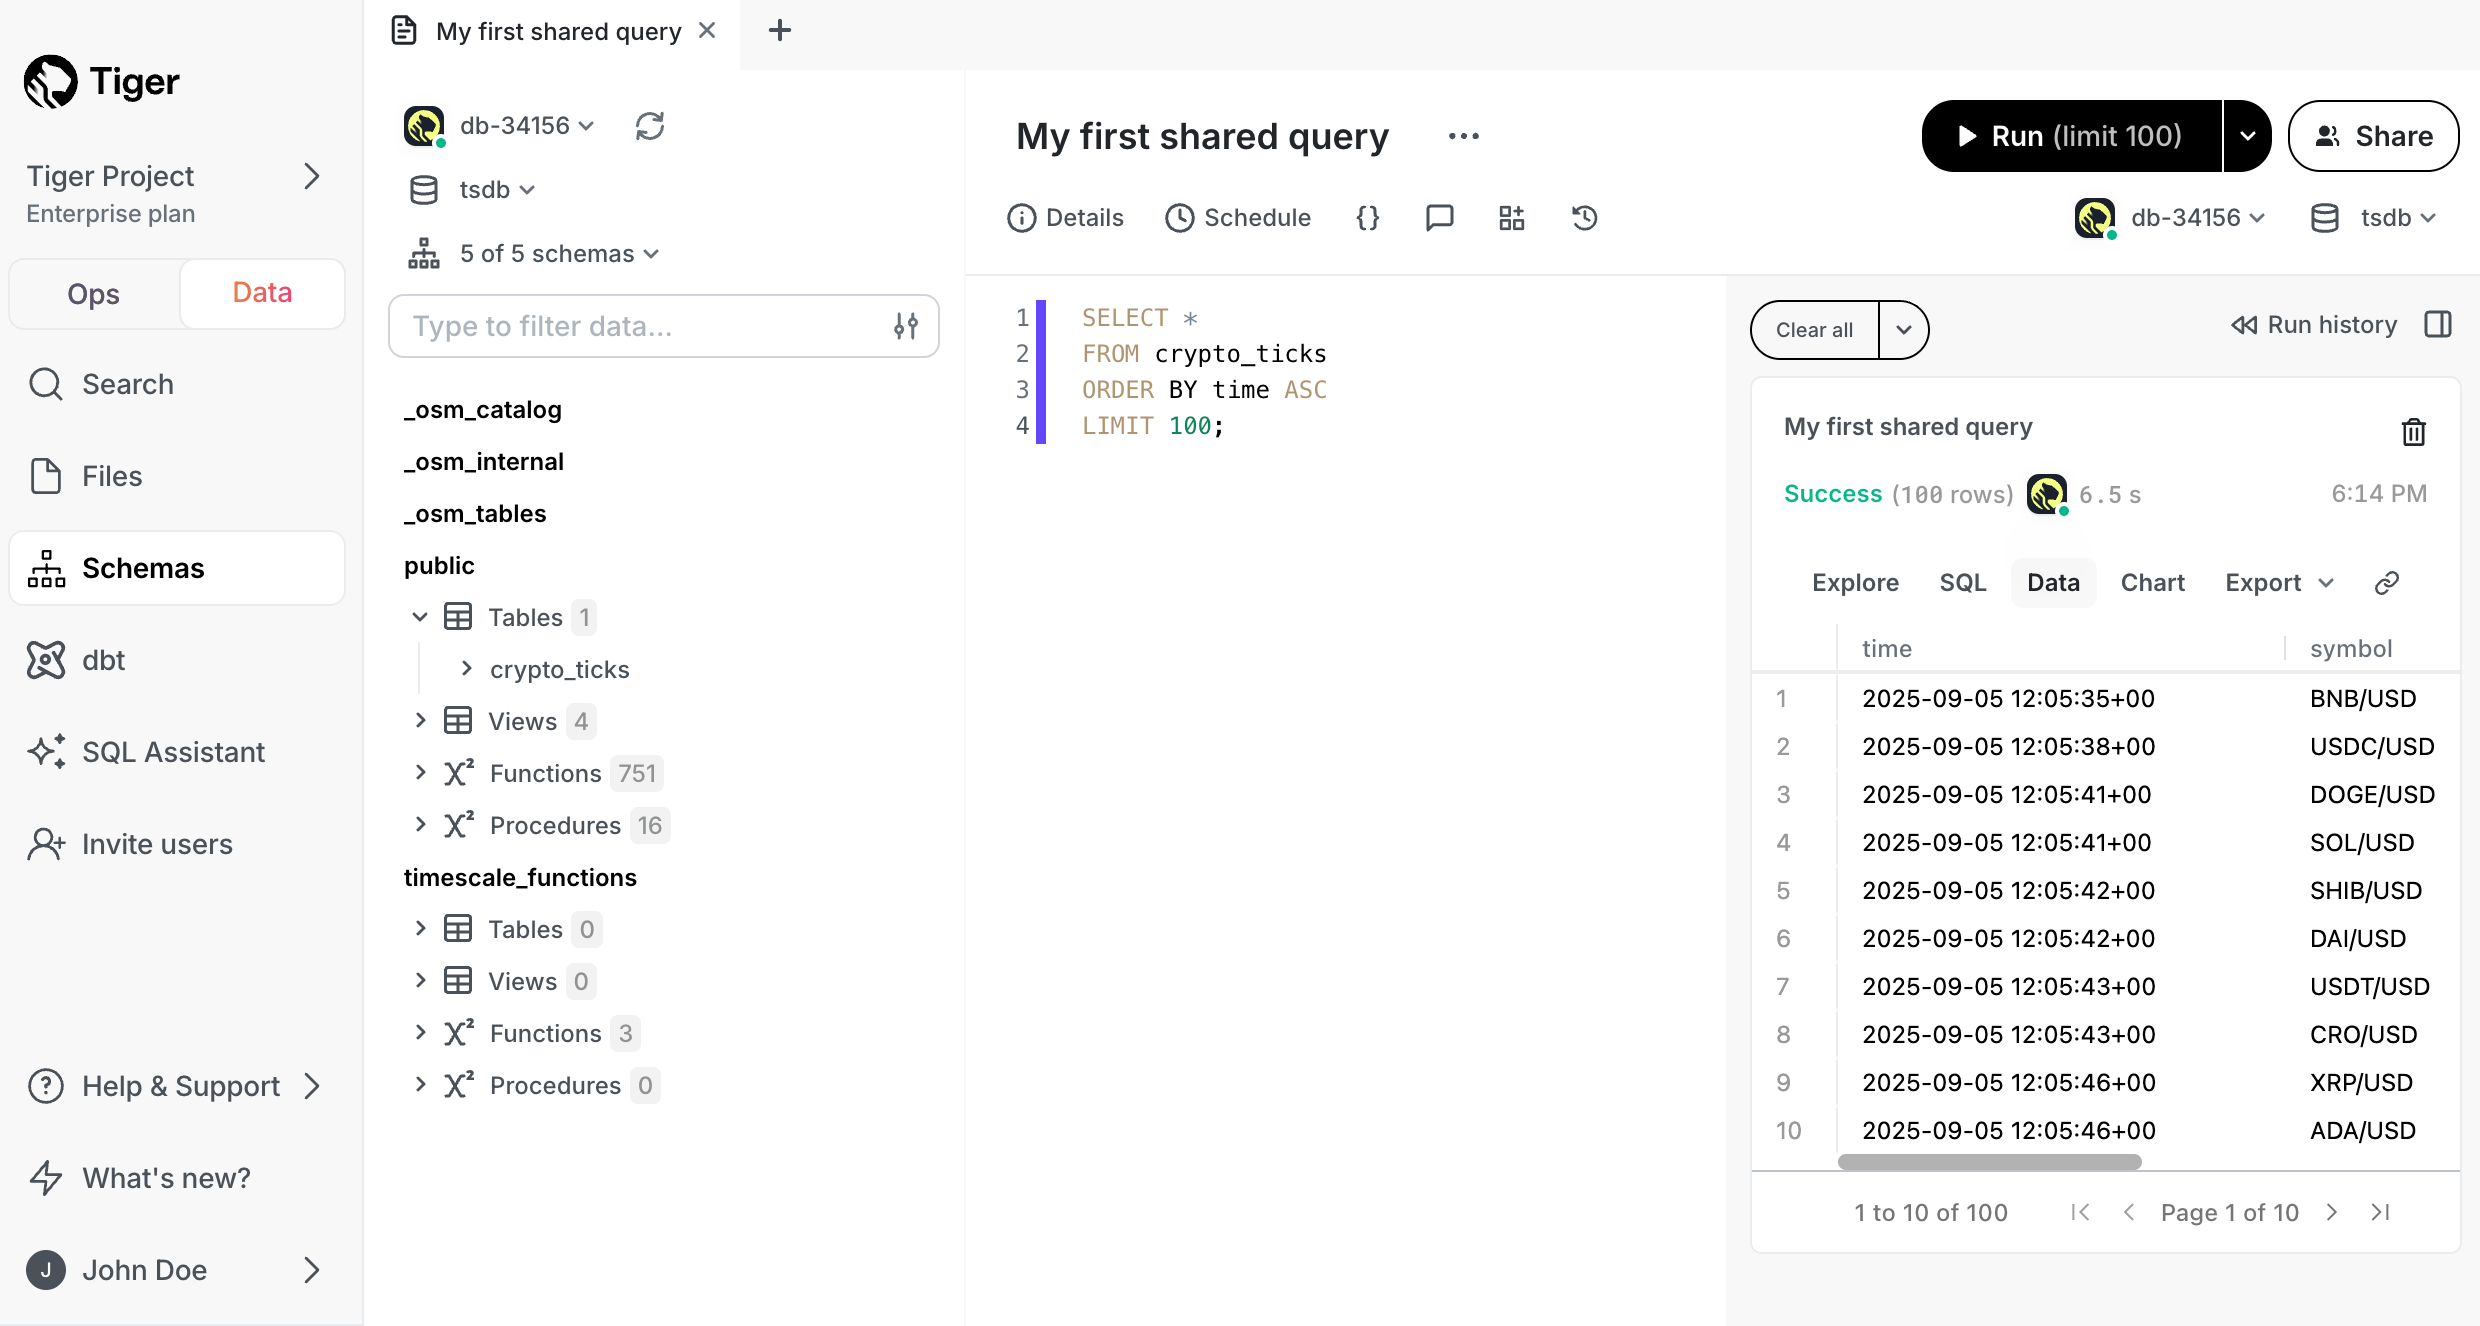 |
You use the ops mode to:
|
Powered by PopSQL, you use the data mode to:
|
To start using Tiger Cloud for your data:
- Create a Tiger Data account: register to get access to Tiger Cloud Console as a centralized point to administer and interact with your data.
- Create a Tiger Cloud service: that is, a Postgres database instance, powered by TimescaleDB, built for production, and extended with cloud features like transparent data tiering to object storage.
- Connect to your Tiger Cloud service: to run queries, add and migrate your data from other sources.
Create a Tiger Data account
You create a Tiger Data account to manage your services and data in a centralized and efficient manner in Tiger Cloud Console. From there, you can create and delete services, run queries, manage access and billing, integrate other services, contact support, and more.
You create a standalone account to manage Tiger Cloud as a separate unit in your infrastructure, which includes separate billing and invoicing.
To set up Tiger Cloud:
- Sign up for a 30-day free trial
Open Sign up for Tiger Cloud and add your details, then click Start your free trial. You receive a confirmation email in your inbox.
Confirm your email address
In the confirmation email, click the link supplied.
Select the pricing plan
You are now logged into Tiger Cloud Console. You can change the pricing plan to better accommodate your growing needs on the Billing page.
To have Tiger Cloud as a part of your AWS infrastructure, you create a Tiger Data account through AWS Marketplace. In this case, Tiger Cloud is a line item in your AWS invoice.
To set up Tiger Cloud via AWS:
- Open AWS Marketplace and search for
Tiger Cloud
You see two pricing options, pay-as-you-go and annual commit.
Select the pricing option that suits you and click
View purchase optionsReview and configure the purchase details, then click
SubscribeClick
Set up your accountat the top of the page
You are redirected to Tiger Cloud Console.
- Sign up for a 30-day free trial
Add your details, then click Start your free trial. If you want to link an existing Tiger Data account to AWS, log in with your existing credentials.
- Select the pricing plan
You are now logged into Tiger Cloud Console. You can change the pricing plan later to better accommodate your growing needs on the Billing page.
In
Confirm AWS Marketplace connection, clickConnectYour Tiger Cloud and AWS accounts are now connected.
Create a Tiger Cloud service
Now that you have an active Tiger Data account, you create and manage your services in Tiger Cloud Console. When you create a service, you effectively create a blank Postgres database with additional Tiger Cloud features available under your pricing plan. You then add or migrate your data into this database.
To create a free or standard service:
- In the service creation page, click
+ New service.
Follow the wizard to configure your service depending on its type.
- Click
Create service.
Your service is constructed and ready to use in a few seconds.
- Click
Download the configand store the configuration information you need to connect to this service in a secure location.
This file contains the passwords and configuration information you need to connect to your service using the Tiger Cloud Console data mode, from the command line, or using third-party database administration tools.
If you choose to go directly to the service overview, Connect to your service shows you how to connect.
Connect to your service
To run queries and perform other operations, connect to your service:
- Check your service is running correctly
In Tiger Cloud Console, check that your service is marked as Running.
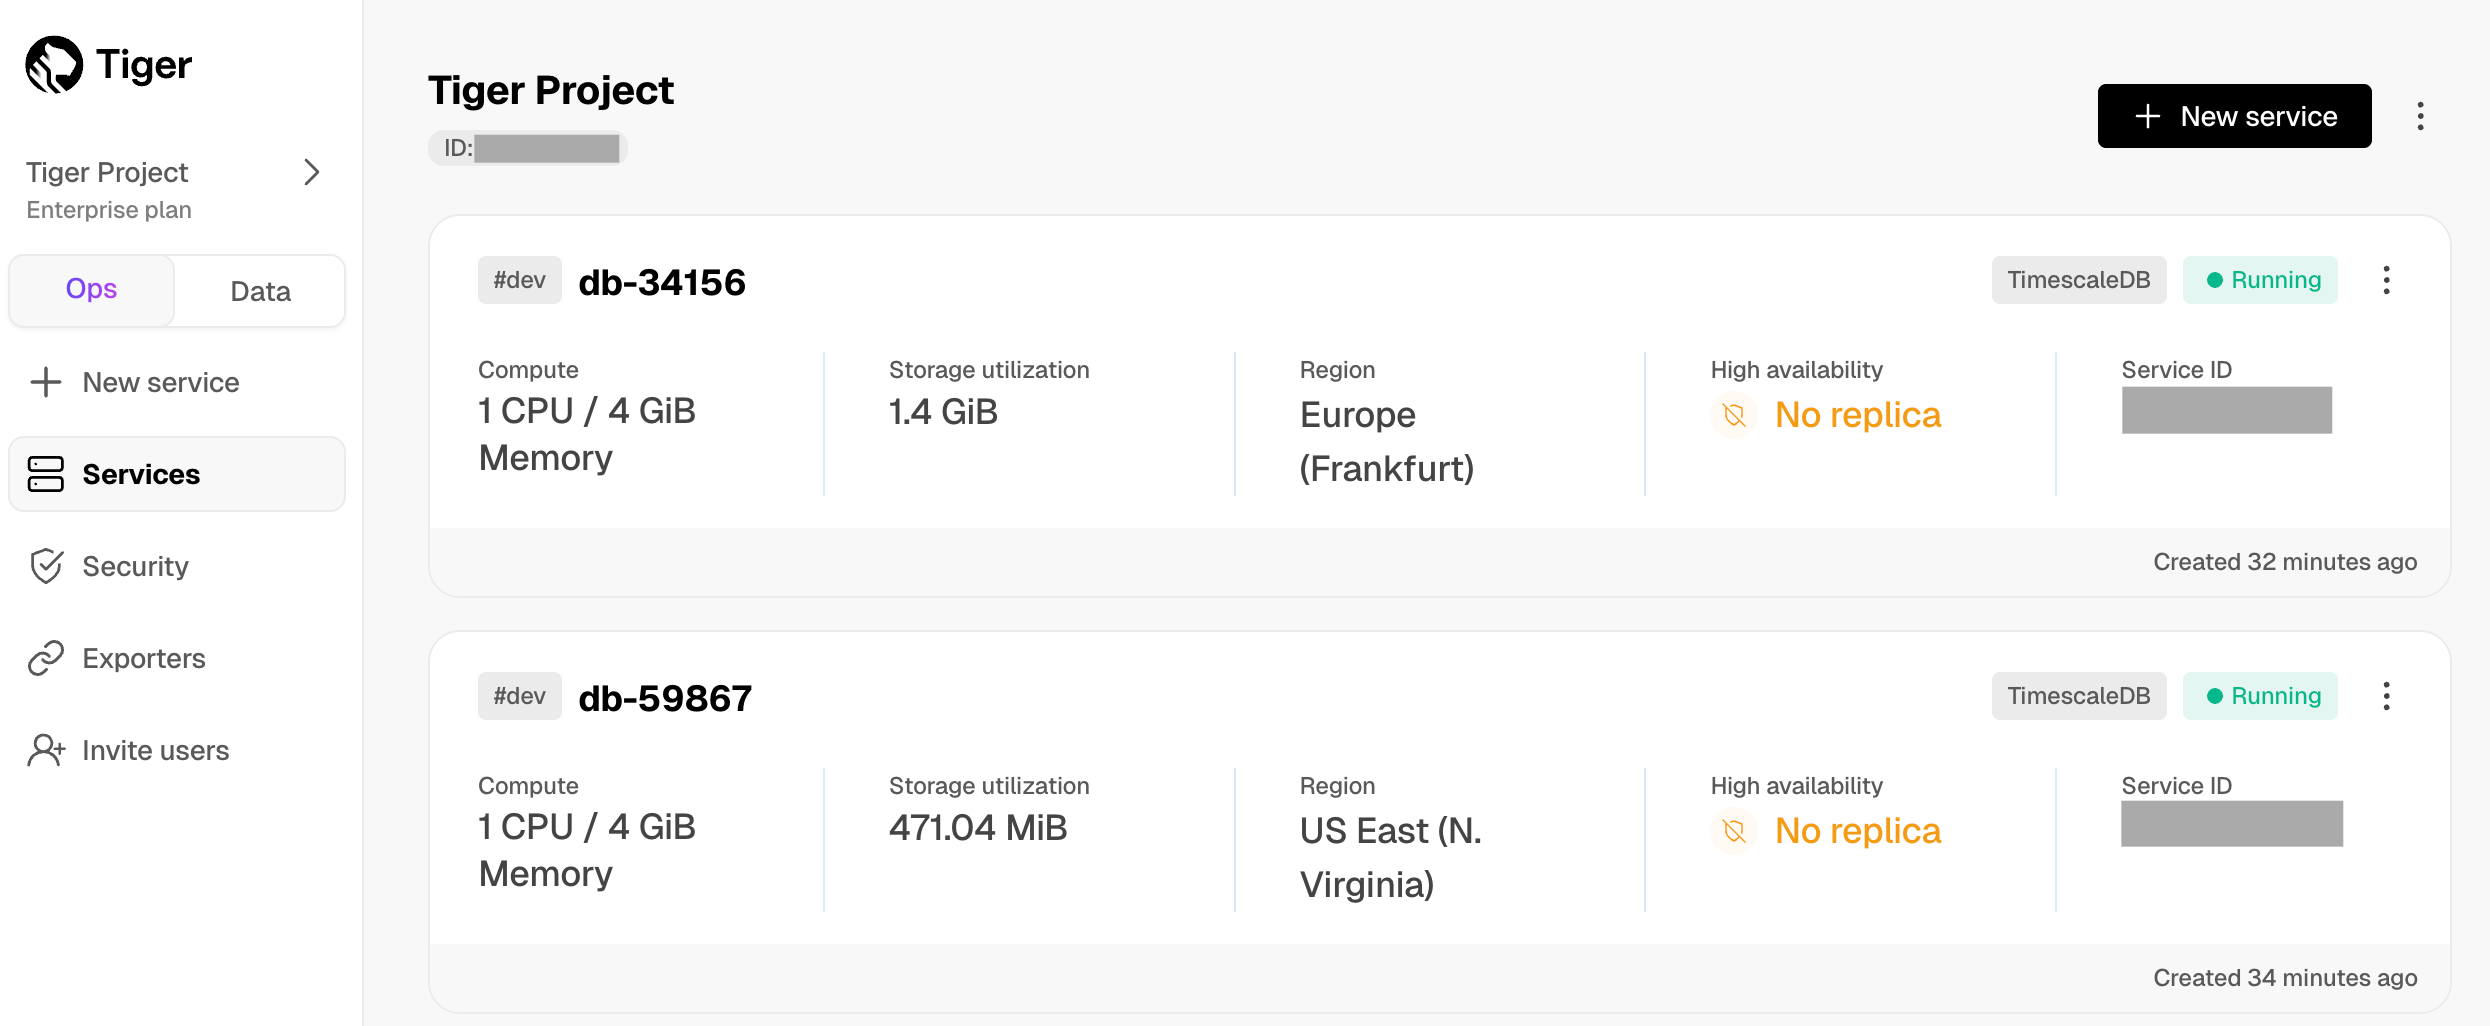
- Connect to your service
Connect using data mode or SQL editor in Tiger Cloud Console, or psql in the command line:
This feature is not available under the Free pricing plan.
In Tiger Cloud Console, toggle
Data.Select your service in the connection drop-down in the top right.
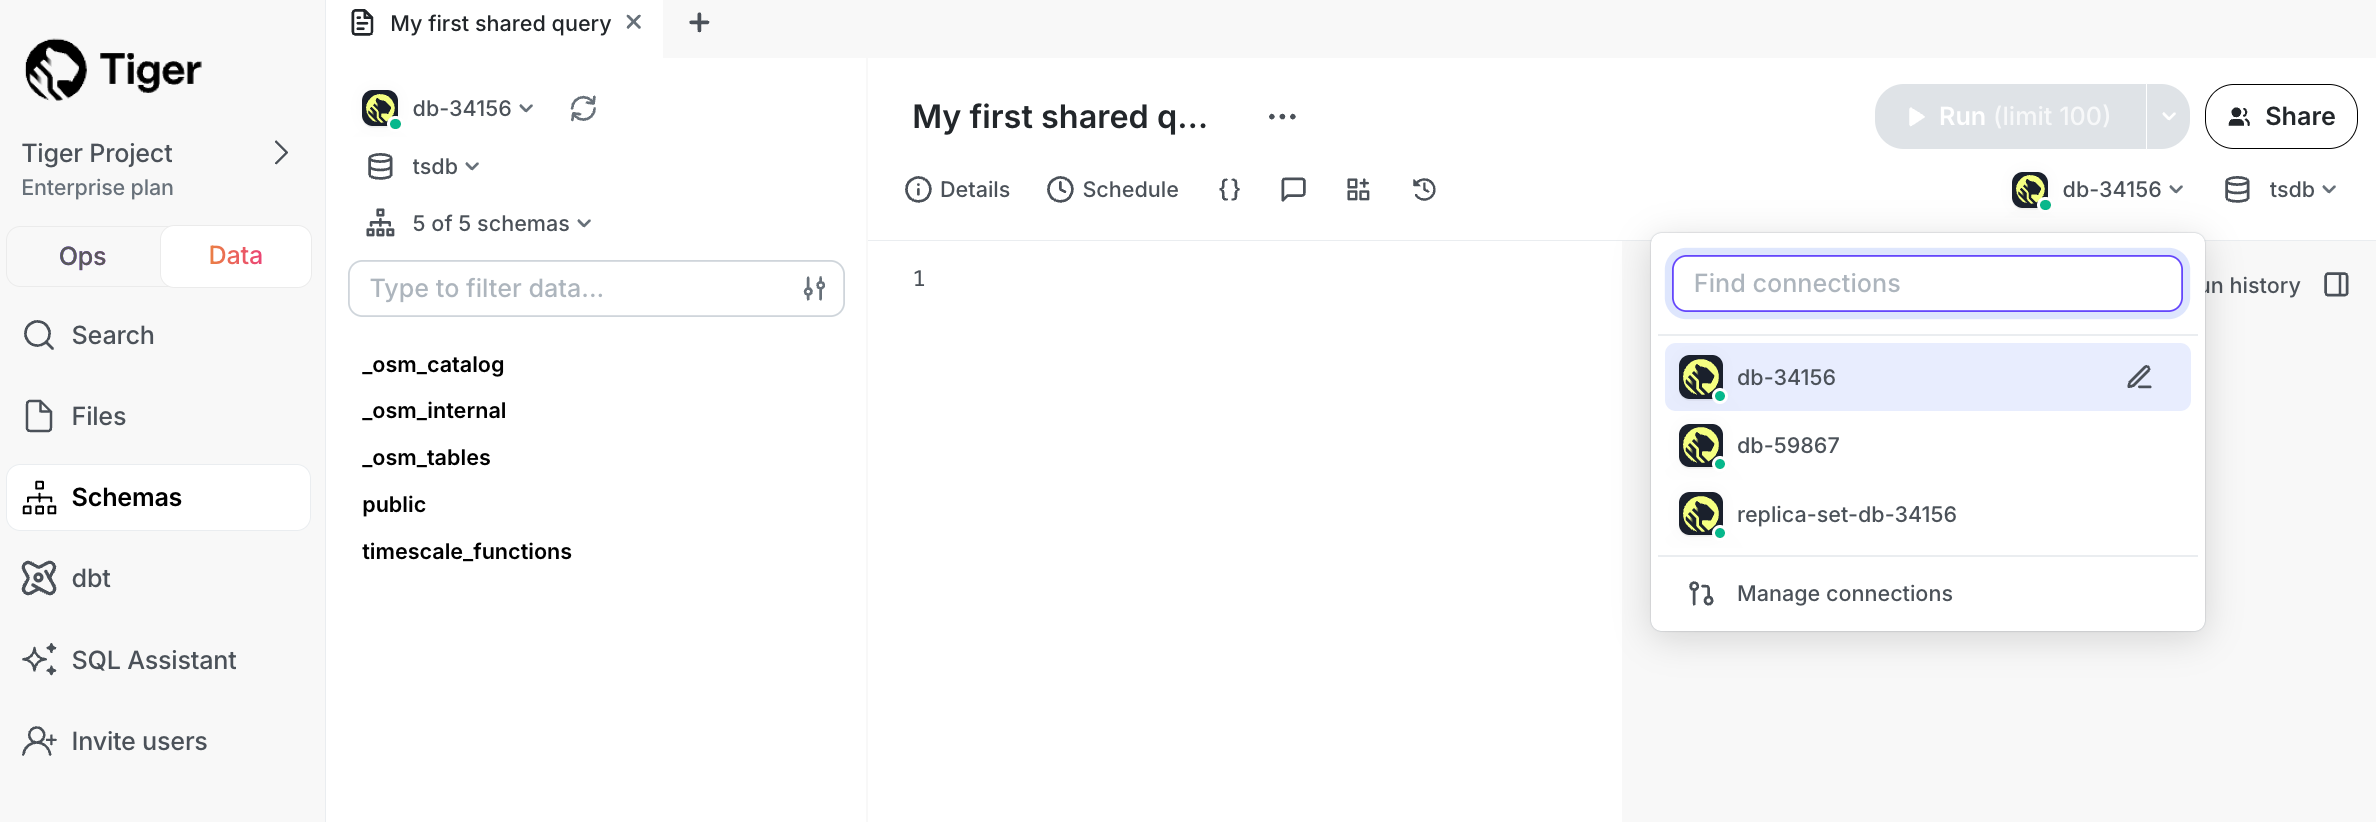
Run a test query:
SELECT CURRENT_DATE;This query gives you the current date, you have successfully connected to your service.
And that is it, you are up and running. Enjoy developing with Tiger Data.
In Tiger Cloud Console, select your service.
Click
SQL editor.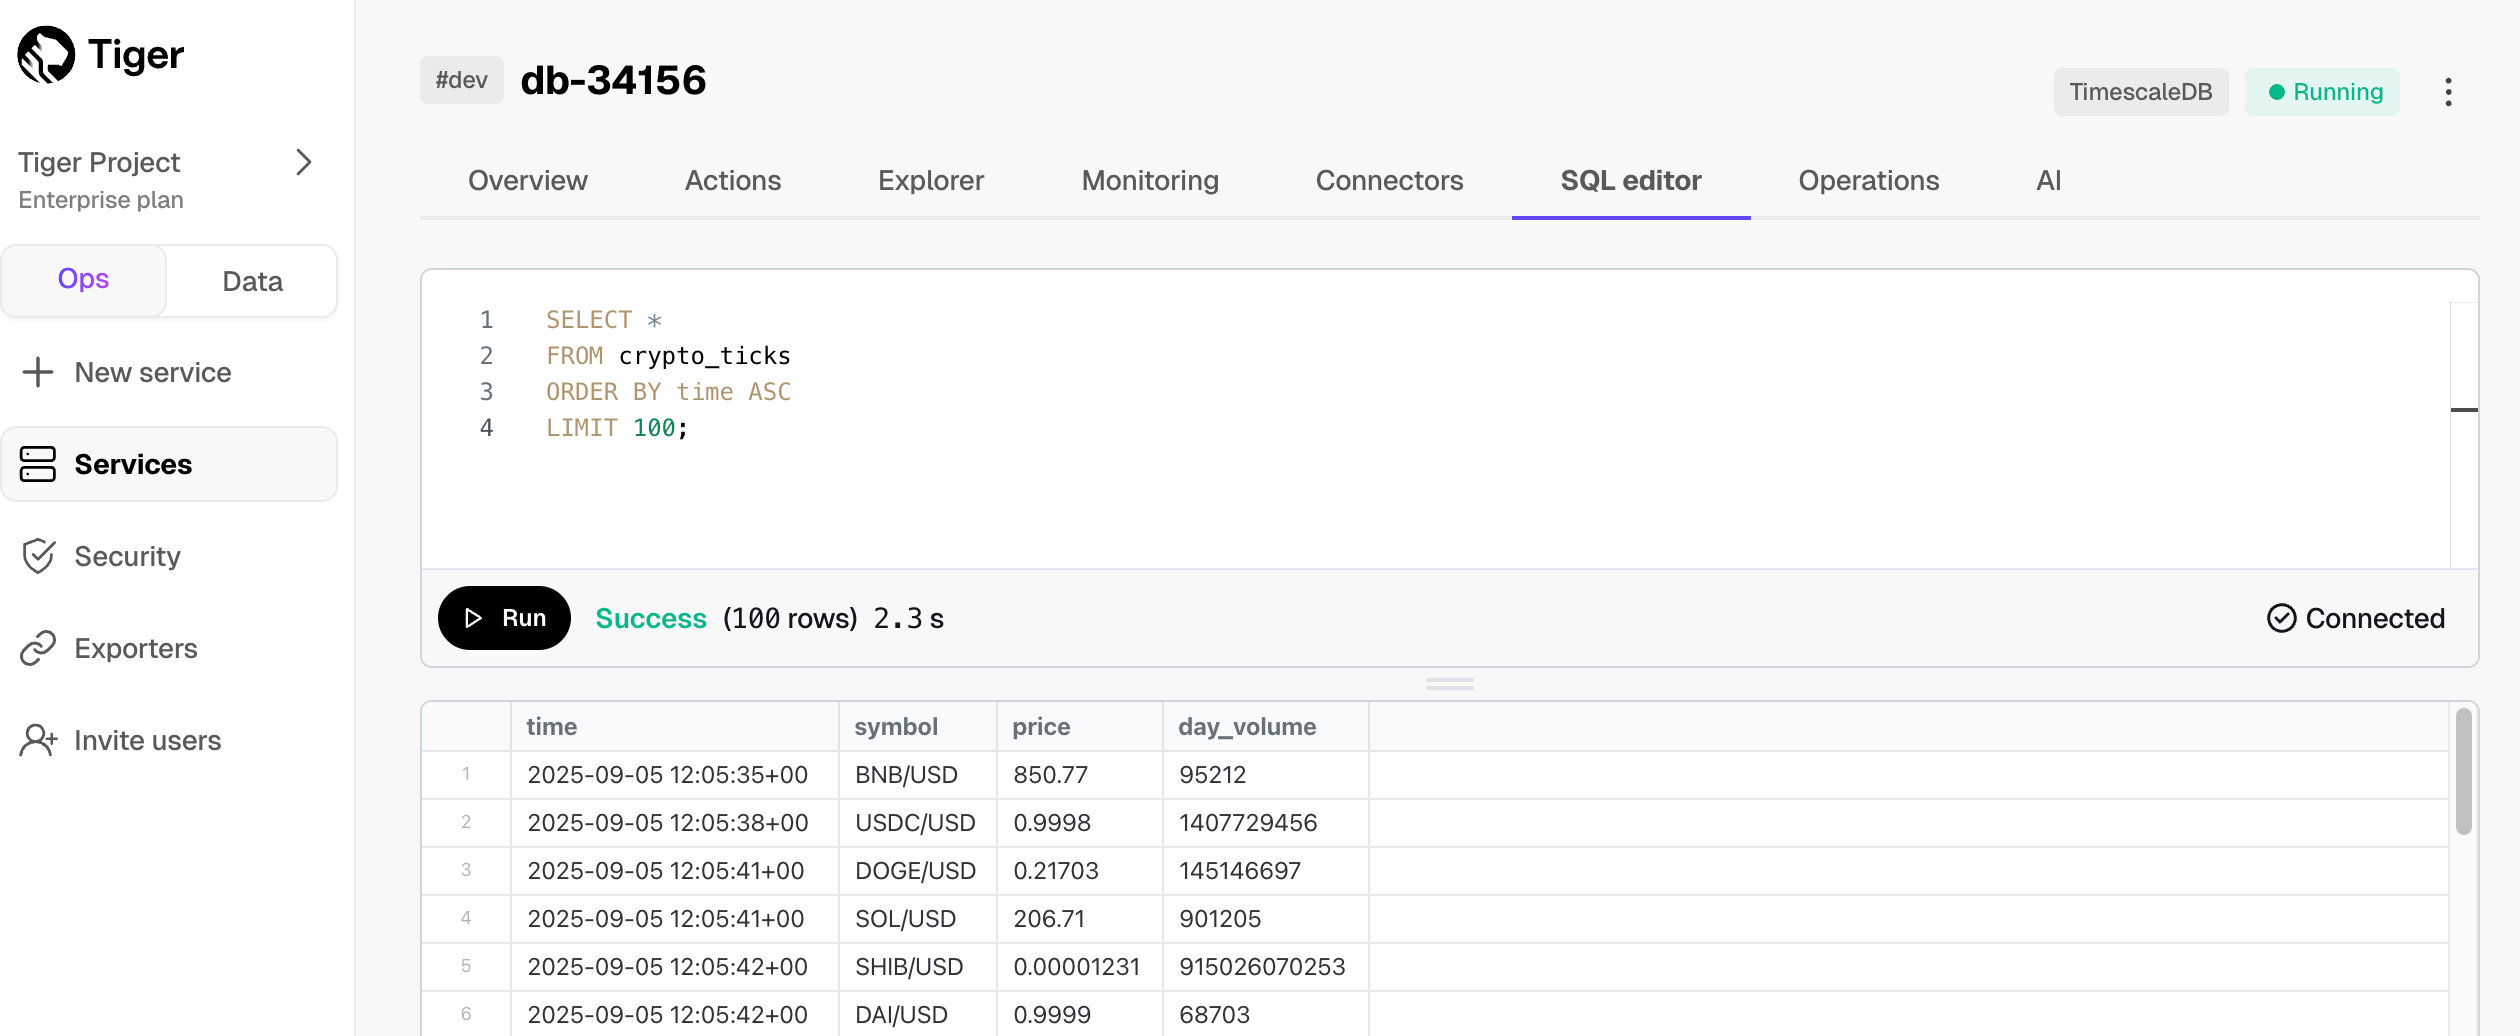
Run a test query:
SELECT CURRENT_DATE;This query gives you the current date, you have successfully connected to your service.
And that is it, you are up and running. Enjoy developing with Tiger Data.
Install psql.
Run the following command in the terminal using the service URL from the config file you have saved during service creation:
psql "<your-service-url>"Run a test query:
SELECT CURRENT_DATE;This query returns the current date. You have successfully connected to your service.
And that is it, you are up and running. Enjoy developing with Tiger Data.
Quick recap. You:
- Manage your services in the ops mode in Tiger Cloud Console: add read replicas and enable high availability, compress data into the columnstore, change parameters, and so on.
- Analyze your data in the data mode in Tiger Cloud Console: write queries with autocomplete, save them in folders, share them, create charts/dashboards, and much more.
- Store configuration and security information in your config file.
What next? Try the key features offered by Tiger Data, see the tutorials, interact with the data in your Tiger Cloud service using your favorite programming language, integrate your Tiger Cloud service with a range of third-party tools, plain old Use Tiger Data products, or dive into the API reference.
===== PAGE: https://docs.tigerdata.com/getting-started/get-started-devops-as-code/ =====
"DevOps as code with Tiger"
Tiger Data supplies a clean, programmatic control layer for Tiger Cloud. This includes RESTful APIs and CLI commands that enable humans, machines, and AI agents easily provision, configure, and manage Tiger Cloud services programmatically.
Tiger CLI is a command-line interface that you use to manage Tiger Cloud resources including VPCs, services, read replicas, and related infrastructure. Tiger CLI calls Tiger REST API to communicate with Tiger Cloud.
This page shows you how to install and set up secure authentication for Tiger CLI, then create your first service.
Prerequisites
To follow the steps on this page:
- Create a target Tiger Data account.
Install and configure Tiger CLI
- Install Tiger CLI
Use the terminal to install the CLI:
```shell
curl -s https://packagecloud.io/install/repositories/timescale/tiger-cli/script.deb.sh | sudo os=any dist=any bash
sudo apt-get install tiger-cli
```
```shell
curl -s https://packagecloud.io/install/repositories/timescale/tiger-cli/script.deb.sh | sudo os=any dist=any bash
sudo apt-get install tiger-cli
```
```shell
curl -s https://packagecloud.io/install/repositories/timescale/tiger-cli/script.rpm.sh | sudo os=rpm_any dist=rpm_any bash
sudo yum install tiger-cli
```
```shell
curl -s https://packagecloud.io/install/repositories/timescale/tiger-cli/script.rpm.sh | sudo os=rpm_any dist=rpm_any bash
sudo yum install tiger-cli
```
```shell
brew install --cask timescale/tap/tiger-cli
```
```shell
curl -fsSL https://cli.tigerdata.com | sh
```
Set up API credentials
Log Tiger CLI into your Tiger Data account:
tiger auth login
Tiger CLI opens Console in your browser. Log in, then click
Authorize.You can have a maximum of 10 active client credentials. If you get an error, open credentials and delete an unused credential.
Select a Tiger Cloud project:
Auth URL is: https://console.cloud.timescale.com/oauth/authorize?client_id=lotsOfURLstuff Opening browser for authentication... Select a project: > 1. Tiger Project (tgrproject) 2. YourCompany (Company wide project) (cpnproject) 3. YourCompany Department (dptproject) Use ↑/↓ arrows or number keys to navigate, enter to select, q to quit
If only one project is associated with your account, this step is not shown.
Where possible, Tiger CLI stores your authentication information in the system keychain/credential manager. If that fails, the credentials are stored in
~/.config/tiger/credentialswith restricted file permissions (600). By default, Tiger CLI stores your configuration in~/.config/tiger/config.yaml.Test your authenticated connection to Tiger Cloud by listing services
tiger service list
This call returns something like:
- No services:
```terminaloutput
🏜️ No services found! Your project is looking a bit empty.
🚀 Ready to get started? Create your first service with: tiger service create
```
- One or more services:
```terminaloutput
┌────────────┬─────────────────────┬────────┬─────────────┬──────────────┬──────────────────┐
│ SERVICE ID │ NAME │ STATUS │ TYPE │ REGION │ CREATED │
├────────────┼─────────────────────┼────────┼─────────────┼──────────────┼──────────────────┤
│ tgrservice │ tiger-agent-service │ READY │ TIMESCALEDB │ eu-central-1 │ 2025-09-25 16:09 │
└────────────┴─────────────────────┴────────┴─────────────┴──────────────┴──────────────────┘
```
Create your first Tiger Cloud service
Create a new Tiger Cloud service using Tiger CLI:
- Submit a service creation request
By default, Tiger CLI creates a service for you that matches your pricing plan:
- Free plan: shared CPU/memory and the
time-seriesandaicapabilities Paid plan: 0.5 CPU and 2 GB memory with the
time-seriescapabilitytiger service createTiger Cloud creates a Development environment for you. That is, no delete protection, high-availability, spooling or read replication. You see something like:
🚀 Creating service 'db-11111' (auto-generated name)... ✅ Service creation request accepted! 📋 Service ID: tgrservice 🔐 Password saved to system keyring for automatic authentication 🎯 Set service 'tgrservice' as default service. ⏳ Waiting for service to be ready (wait timeout: 30m0s)... 🎉 Service is ready and running! 🔌 Run 'tiger db connect' to connect to your new service ┌───────────────────┬──────────────────────────────────────────────────────────────────────────────────────────────────┐ │ PROPERTY │ VALUE │ ├───────────────────┼──────────────────────────────────────────────────────────────────────────────────────────────────┤ │ Service ID │ tgrservice │ │ Name │ db-11111 │ │ Status │ READY │ │ Type │ TIMESCALEDB │ │ Region │ us-east-1 │ │ CPU │ 0.5 cores (500m) │ │ Memory │ 2 GB │ │ Direct Endpoint │ tgrservice.tgrproject.tsdb.cloud.timescale.com:39004 │ │ Created │ 2025-10-20 20:33:46 UTC │ │ Connection String │ postgresql://tsdbadmin@tgrservice.tgrproject.tsdb.cloud.timescale.com:0007/tsdb?sslmode=require │ │ Console URL │ https://console.cloud.timescale.com/dashboard/services/tgrservice │ └───────────────────┴──────────────────────────────────────────────────────────────────────────────────────────────────┘This service is set as default by the CLI.
Check the CLI configuration
tiger config showYou see something like:
api_url: https://console.cloud.timescale.com/public/api/v1 console_url: https://console.cloud.timescale.com gateway_url: https://console.cloud.timescale.com/api docs_mcp: true docs_mcp_url: https://mcp.tigerdata.com/docs project_id: tgrproject service_id: tgrservice output: table analytics: true password_storage: keyring debug: false config_dir: /Users/<username>/.config/tiger
And that is it, you are ready to use Tiger CLI to manage your services in Tiger Cloud.
Commands
You can use the following commands with Tiger CLI. For more information on each command, use the -h flag. For example:
tiger auth login -h
| Command | Subcommand | Description |
|---|---|---|
| auth | Manage authentication and credentials for your Tiger Data account | |
| login | Create an authenticated connection to your Tiger Data account | |
| logout | Remove the credentials used to create authenticated connections to Tiger Cloud | |
| status | Show your current authentication status and project ID | |
| version | Show information about the currently installed version of Tiger CLI | |
| config | Manage your Tiger CLI configuration | |
| show | Show the current configuration | |
set <key> <value> |
Set a specific value in your configuration. For example, tiger config set debug true |
|
unset <key> |
Clear the value of a configuration parameter. For example, tiger config unset debug |
|
| reset | Reset the configuration to the defaults. This also logs you out from the current Tiger Cloud project | |
| service | Manage the Tiger Cloud services in this project | |
| create | Create a new service in this project. Possible flags are:
Possible cpu-memory combinations are:
|
|
delete <service-id> |
Delete a service from this project. This operation is irreversible and requires confirmation by typing the service ID | |
fork <service-id> |
Fork an existing service to create a new independent copy. Key features are:
|
|
get <service-id> (aliases: describe, show) |
Show detailed information about a specific service in this project | |
| list | List all the services in this project | |
update-password <service-id> |
Update the master password for a service | |
| db | Database operations and management | |
connect <service-id> |
Connect to a service | |
connection-string <service-id> |
Retrieve the connection string for a service | |
save-password <service-id> |
Save the password for a service | |
test-connection <service-id> |
Test the connectivity to a service | |
| mcp | Manage the Tiger Model Context Protocol Server for AI Assistant integration | |
install [client] |
Install and configure Tiger Model Context Protocol Server for a specific client (claude-code, cursor, windsurf, or other). If no client is specified, you'll be prompted to select one interactively |
|
| start | Start the Tiger Model Context Protocol Server. This is the same as tiger mcp start stdio |
|
| start stdio | Start the Tiger Model Context Protocol Server with stdio transport (default) | |
| start http | Start the Tiger Model Context Protocol Server with HTTP transport. Includes flags: --port (default: 8080), --host (default: localhost) |
Global flags
You can use the following global flags with Tiger CLI:
| Flag | Default | Description |
|---|---|---|
--analytics |
true |
Set to false to disable usage analytics |
--color |
true |
Set to false to disable colored output |
--config-dir string |
.config/tiger |
Set the directory that holds config.yaml |
--debug |
No debugging | Enable debug logging |
--help |
- | Print help about the current command. For example, tiger service --help |
--password-storage string |
keyring | Set the password storage method. Options are keyring, pgpass, or none |
--service-id string |
- | Set the Tiger Cloud service to manage |
--skip-update-check |
- | Do not check if a new version of Tiger CLI is available |
Configuration parameters
By default, Tiger CLI stores your configuration in ~/.config/tiger/config.yaml. The name of these
variables matches the flags you use to update them. However, you can override them using the following
environmental variables:
Configuration parameters
TIGER_CONFIG_DIR: path to configuration directory (default:~/.config/tiger)TIGER_API_URL: Tiger REST API base endpoint (default: https://console.cloud.timescale.com/public/api/v1)TIGER_CONSOLE_URL: URL to Tiger Cloud Console (default: https://console.cloud.timescale.com)TIGER_GATEWAY_URL: URL to the Tiger Cloud Console gateway (default: https://console.cloud.timescale.com/api)TIGER_DOCS_MCP: enable/disable docs MCP proxy (default:true)TIGER_DOCS_MCP_URL: URL to the Tiger MCP Server for Tiger Data docs (default: https://mcp.tigerdata.com/docs)TIGER_SERVICE_ID: ID for the service updated when you call CLI commandsTIGER_ANALYTICS: enable or disable analytics (default:true)TIGER_PASSWORD_STORAGE: password storage method (keyring, pgpass, or none)TIGER_DEBUG: enable/disable debug logging (default:false)TIGER_COLOR: set tofalseto disable colored output (default:true)
Authentication parameters
To authenticate without using the interactive login, either:
Set the following parameters with your client credentials, then
login:TIGER_PUBLIC_KEY=<public_key> TIGER_SECRET_KEY=<secret_key> TIGER_PROJECT_ID=<project_id>\ tiger auth loginAdd your client credentials to the
logincommand:tiger auth login --public-key=<public_key> --secret-key=<secret-key> --project-id=<project_id>
Tiger REST API is a comprehensive RESTful API you use to manage Tiger Cloud resources including VPCs, services, and read replicas.
This page shows you how to set up secure authentication for the Tiger REST API and create your first service.
Prerequisites
To follow the steps on this page:
Create a target Tiger Data account.
Install curl.
Configure secure authentication
Tiger REST API uses HTTP Basic Authentication with access keys and secret keys. All API requests must include proper authentication headers.
Set up API credentials
In Tiger Cloud Console copy your project ID and store it securely using an environment variable:
export TIGERDATA_PROJECT_ID="your-project-id"In Tiger Cloud Console create your client credentials and store them securely using environment variables:
export TIGERDATA_ACCESS_KEY="Public key" export TIGERDATA_SECRET_KEY="Secret key"
Configure the API endpoint
Set the base URL in your environment:
```bash
export API_BASE_URL="https://console.cloud.timescale.com/public/api/v1"
```
Test your authenticated connection to Tiger REST API by listing the services in the current Tiger Cloud project
curl -X GET "${API_BASE_URL}/projects/${TIGERDATA_PROJECT_ID}/services" \ -u "${TIGERDATA_ACCESS_KEY}:${TIGERDATA_SECRET_KEY}" \ -H "Content-Type: application/json"
This call returns something like:
- No services:
```terminaloutput
[]%
```
- One or more services:
```terminaloutput
[{"service_id":"tgrservice","project_id":"tgrproject","name":"tiger-eon",
"region_code":"us-east-1","service_type":"TIMESCALEDB",
"created":"2025-10-20T12:21:28.216172Z","paused":false,"status":"READY",
"resources":[{"id":"104977","spec":{"cpu_millis":500,"memory_gbs":2,"volume_type":""}}],
"metadata":{"environment":"DEV"},
"endpoint":{"host":"tgrservice.tgrproject.tsdb.cloud.timescale.com","port":11111}}]
```
Create your first Tiger Cloud service
Create a new service using the Tiger REST API:
Create a service using the POST endpoint
curl -X POST "${API_BASE_URL}/projects/${TIGERDATA_PROJECT_ID}/services" \ -u "${TIGERDATA_ACCESS_KEY}:${TIGERDATA_SECRET_KEY}" \ -H "Content-Type: application/json" \ -d '{ "name": "my-first-service", "addons": ["time-series"], "region_code": "us-east-1", "replica_count": 1, "cpu_millis": "1000", "memory_gbs": "4" }'Tiger Cloud creates a Development environment for you. That is, no delete protection, high-availability, spooling or read replication. You see something like:
{"service_id":"tgrservice","project_id":"tgrproject","name":"my-first-service", "region_code":"us-east-1","service_type":"TIMESCALEDB", "created":"2025-10-20T22:29:33.052075713Z","paused":false,"status":"QUEUED", "resources":[{"id":"105120","spec":{"cpu_millis":1000,"memory_gbs":4,"volume_type":""}}], "metadata":{"environment":"PROD"}, "endpoint":{"host":"tgrservice.tgrproject.tsdb.cloud.timescale.com","port":00001}, "initial_password":"notTellingYou", "ha_replicas":{"sync_replica_count":0,"replica_count":1}}Save
service_idfrom the response to a variable:# Extract service_id from the JSON response export SERVICE_ID="service_id-from-response"Check the configuration for the service
curl -X GET "${API_BASE_URL}/projects/${TIGERDATA_PROJECT_ID}/services/${SERVICE_ID}" \ -u "${TIGERDATA_ACCESS_KEY}:${TIGERDATA_SECRET_KEY}" \ -H "Content-Type: application/json"
You see something like:
{"service_id":"tgrservice","project_id":"tgrproject","name":"my-first-service",
"region_code":"us-east-1","service_type":"TIMESCALEDB",
"created":"2025-10-20T22:29:33.052075Z","paused":false,"status":"READY",
"resources":[{"id":"105120","spec":{"cpu_millis":1000,"memory_gbs":4,"volume_type":""}}],
"metadata":{"environment":"DEV"},
"endpoint":{"host":"tgrservice.tgrproject.tsdb.cloud.timescale.com","port":11111},
"ha_replicas":{"sync_replica_count":0,"replica_count":1}}
And that is it, you are ready to use the Tiger REST API to manage your services in Tiger Cloud.
Security best practices
Follow these security guidelines when working with the Tiger REST API:
Credential management
- Store API credentials as environment variables, not in code
- Use credential rotation policies for production environments
- Never commit credentials to version control systems
Network security
- Use HTTPS endpoints exclusively for API communication
- Implement proper certificate validation in your HTTP clients
Data protection
- Use secure storage for service connection strings and passwords
- Implement proper backup and recovery procedures for created services
- Follow data residency requirements for your region
===== PAGE: https://docs.tigerdata.com/getting-started/run-queries-from-console/ =====
Run your queries from Tiger Cloud Console
As Tiger Cloud is based on Postgres, you can use lots of different tools to connect to your service and interact with your data.
In Tiger Cloud Console you can use the following ways to run SQL queries against your service:
Data mode: a rich experience powered by PopSQL. You can write queries with autocomplete, save them in folders, share them, create charts/dashboards, and much more.
SQL Assistant in the data mode: write, fix, and organize SQL faster and more accurately.
SQL editor in the ops mode: a simple SQL editor in the ops mode that lets you run ad-hoc ephemeral queries. This is useful for quick one-off tasks like creating an index on a small table or inspecting
pg_stat_statements.
If you prefer the command line to the ops mode SQL editor in Tiger Cloud Console, use psql.
Data mode
You use the data mode in Tiger Cloud Console to write queries, visualize data, and share your results.
This feature is not available under the Free pricing plan.
Available features are:
- Real-time collaboration: work with your team directly in the data mode query editor with live presence and multiple cursors.
- Schema browser: understand the structure of your service and see usage data on tables and columns.
- SQL Assistant: write, fix, and organize SQL faster and more accurately using AI.
- Autocomplete: get suggestions as you type your queries.
- Version history: access previous versions of a query from the built-in revision history, or connect to a git repo.
- Charts: visualize data from inside the UI rather than switch to Sheets or Excel.
- Schedules: automatically refresh queries and dashboards to create push alerts.
- Query variables: use Liquid to parameterize your queries or use
ifstatements. - Cross-platform support: work from Tiger Cloud Console or download the desktop app for macOS, Windows, and Linux.
- Easy connection: connect to Tiger Cloud, Postgres, Redshift, Snowflake, BigQuery, MySQL, SQL Server, and more.
Connect to your Tiger Cloud service in the data mode
To connect to a service:
- Check your service is running correctly
In Tiger Cloud Console, check that your service is marked as Running:
- Connect to your service
In the data mode in Tiger Cloud Console, select a service in the connection drop-down:
- Run a test query
Type SELECT CURRENT_DATE; in Scratchpad and click Run:
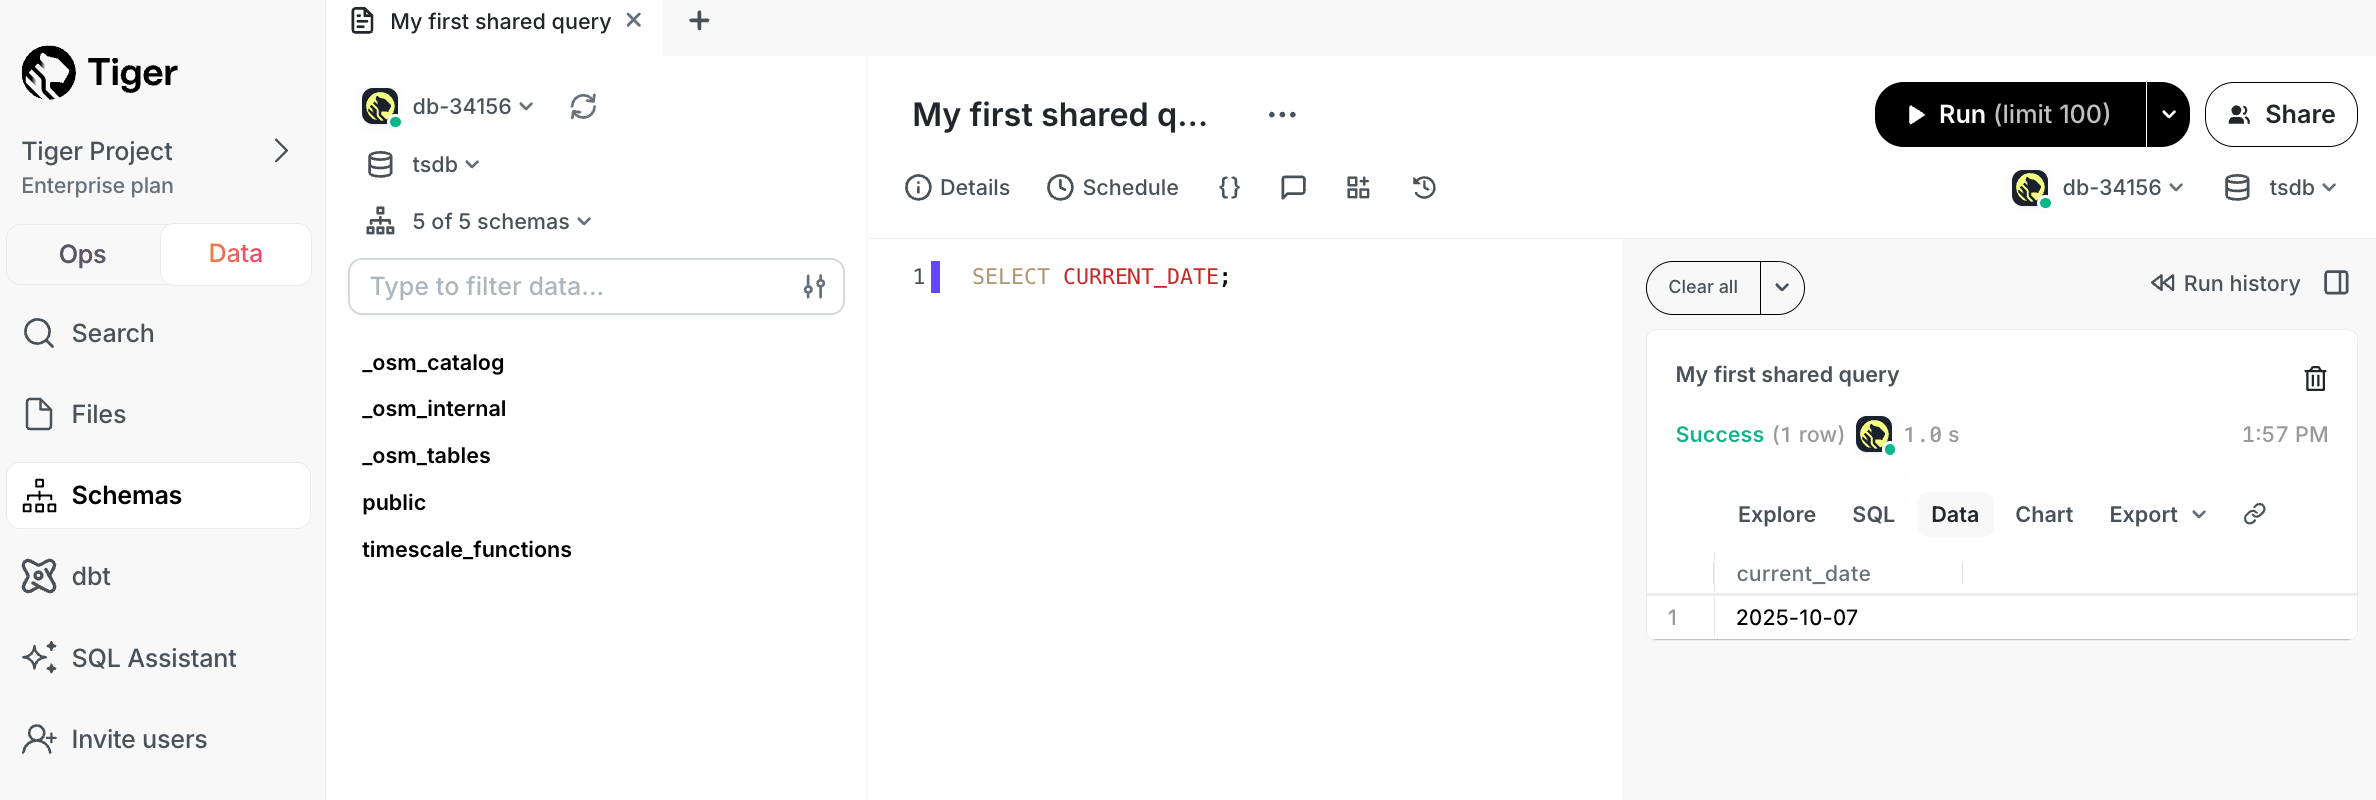
Quick recap. You:
- Manage your services in the ops mode in Tiger Cloud Console
- Manage your data in the data mode in Tiger Cloud Console
- Store configuration and security information in your config file.
Now you have used the data mode in Tiger Cloud Console, see how to easily do the following:
- Write a query
- Share a query with your teammates
- Create a chart from your data
- Create a dashboard of multiple query results
- Create schedules for your queries
Data mode FAQ
What if my service is within a vpc?
If your Tiger Cloud service runs inside a VPC, do one of the following to enable access for the PopSQL desktop app:
- Use PopSQL's bridge connector.
- Use an SSH tunnel: when you configure the connection in PopSQL, under
Advanced OptionsenableConnect over SSH. - Add PopSQL's static IPs (
23.20.131.72, 54.211.234.135) to your allowlist.
What happens if another member of my Tiger Cloud project uses the data mode?
The number of data mode seats you are allocated depends on your pricing plan.
Will using the data mode affect the performance of my Tiger Cloud service?
There are a few factors to consider:
- What instance size is your service?
- How many users are running queries?
- How computationally intensive are the queries?
If you have a small number of users running performant SQL queries against a service with sufficient resources, then there should be no degradation to performance. However, if you have a large number of users running queries, or if the queries are computationally expensive, best practice is to create a read replica and send analytical queries there.
If you'd like to prevent write operations such as insert or update, instead
of using the tsdbadmin user, create a read-only user for your service and
use that in the data mode.
SQL Assistant
SQL Assistant in Tiger Cloud Console is a chat-like interface that harnesses the power of AI to help you write, fix, and organize SQL faster and more accurately. Ask SQL Assistant to change existing queries, write new ones from scratch, debug error messages, optimize for query performance, add comments, improve readability—and really, get answers to any questions you can think of.
This feature is not available under the Free pricing plan.
Key capabilities
SQL Assistant offers a range of features to improve your SQL workflow, including:
Real-time help: SQL Assistant provides in-context help for writing and understanding SQL. Use it to:
- Understand functions: need to know how functions like
LAG()orROW_NUMBER()work? SQL Assistant explains it with examples. - Interpret complex queries: SQL Assistant breaks down dense queries, giving you a clear view of each part.
- Understand functions: need to know how functions like
Error resolution: SQL Assistant diagnoses errors as they happen, you can resolve issues without leaving your editor. Features include:
- Error debugging: if your query fails, SQL Assistant identifies the issue and suggests a fix.
- Performance tuning: for slow queries, SQL Assistant provides optimization suggestions to improve performance immediately.
Query organization: to keep your query library organized, and help your team understand the purpose of each query, SQL Assistant automatically adds titles and summaries to your queries.
Agent mode: to get results with minimal involvement from you, SQL Assistant autopilots through complex tasks and troubleshoots its own problems. No need to go step by step, analyze errors, and try out solutions. Simply turn on the agent mode in the LLM picker and watch SQL Assistant do all the work for you. Recommended for use when your database connection is configured with read-only credentials.
Supported LLMs
SQL Assistant supports a large number of LLMs, including:
- GPT-4o mini
- GPT-4o
- GPT-4.1 nano
- GPT-4.1 mini
- GPT-4.1
- o4-mini (low)
- o4-mini
- o4-mini (high)
- o3 (low)
- o3
- o3 (high)
- Claude 3.5 Haiku
- Claud 3.7 Sonnet
- Claud 3.7 Sonnet (extended thinking)
- Llama 3.3 70B Versatile
- Llama 3.3 70B Instruct
- Llama 3.1 405B Instruct
- Llama 4 Scout
- Llama 4 Maverick
- DeepSeek R1 Distill - Llama 3.3. 70B
- DeepSeek R1
- Gemini 2.0 Flash
- Sonnet 4
- Sonnet 4 (extended thinking)
- Opus 4
- Opus 4 (extended thinking)
Choose the LLM based on the particular task at hand. For simpler tasks, try the smaller and faster models like Gemini Flash, Haiku, or o4-mini. For more complex tasks, try the larger reasoning models like Claude Sonnet, Gemini Pro, or o3. We provide a description of each model to help you decide.
Limitations to keep in mind
For best results with SQL Assistant:
- Schema awareness: SQL Assistant references schema data but may need extra context in complex environments. Specify tables, columns, or joins as needed.
- Business logic: SQL Assistant does not inherently know specific business terms such as active user. Define these terms clearly to improve results.
Security, privacy, and data usage
Security and privacy is prioritized in Tiger Cloud Console. In data mode, project members
manage SQL Assistant settings under User name > Settings > SQL Assistant.

SQL Assistant settings are:
- Opt-in features: all AI features are off by default. Only members of your Tiger Cloud project can enable them.
- Data protection: your data remains private as SQL Assistant operates with strict security protocols. To provide AI support, Tiger Cloud Console may share your currently open SQL document, some basic metadata about your database, and portions of your database schema. By default, Tiger Cloud Console does not include any data from query results, but you can opt in to include this context to improve the results.
- Sample data: to give the LLM more context so you have better SQL suggestions, enable sample data sharing in the SQL Assistant preferences.
- Telemetry: to improve SQL Assistant, Tiger Data collects telemetry and usage data, including prompts, responses, and query metadata.
Ops mode SQL editor
SQL editor is an integrated secure UI that you use to run queries and see the results for a Tiger Cloud service.
To enable or disable SQL editor in your service, click Operations > Service management, then
update the setting for SQL editor.
To use SQL editor:
Open SQL editor from Tiger Cloud Console
In the ops mode in Tiger Cloud Console, select a service, then click
SQL editor.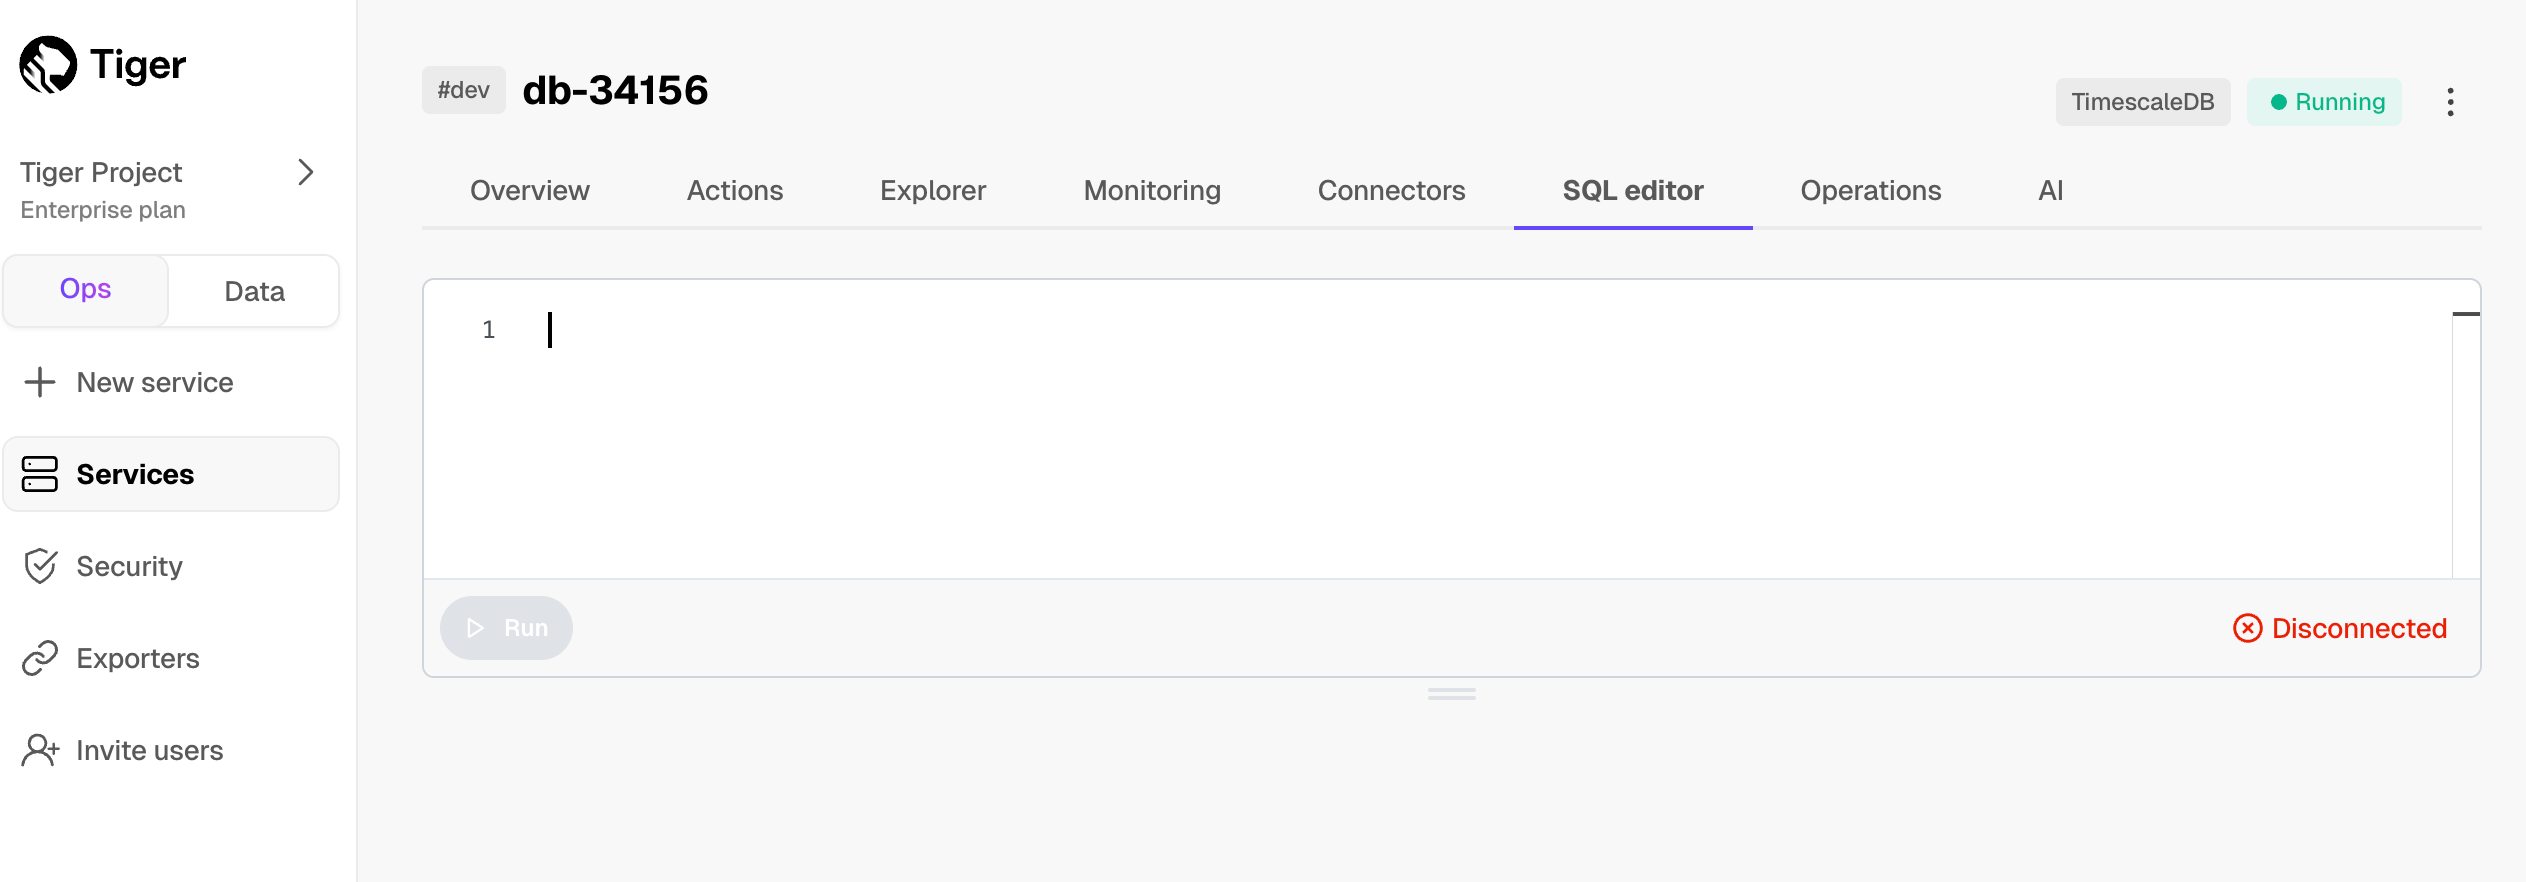
Run a test query
Type
SELECT CURRENT_DATE;in the UI and clickRun. The results appear in the lower window: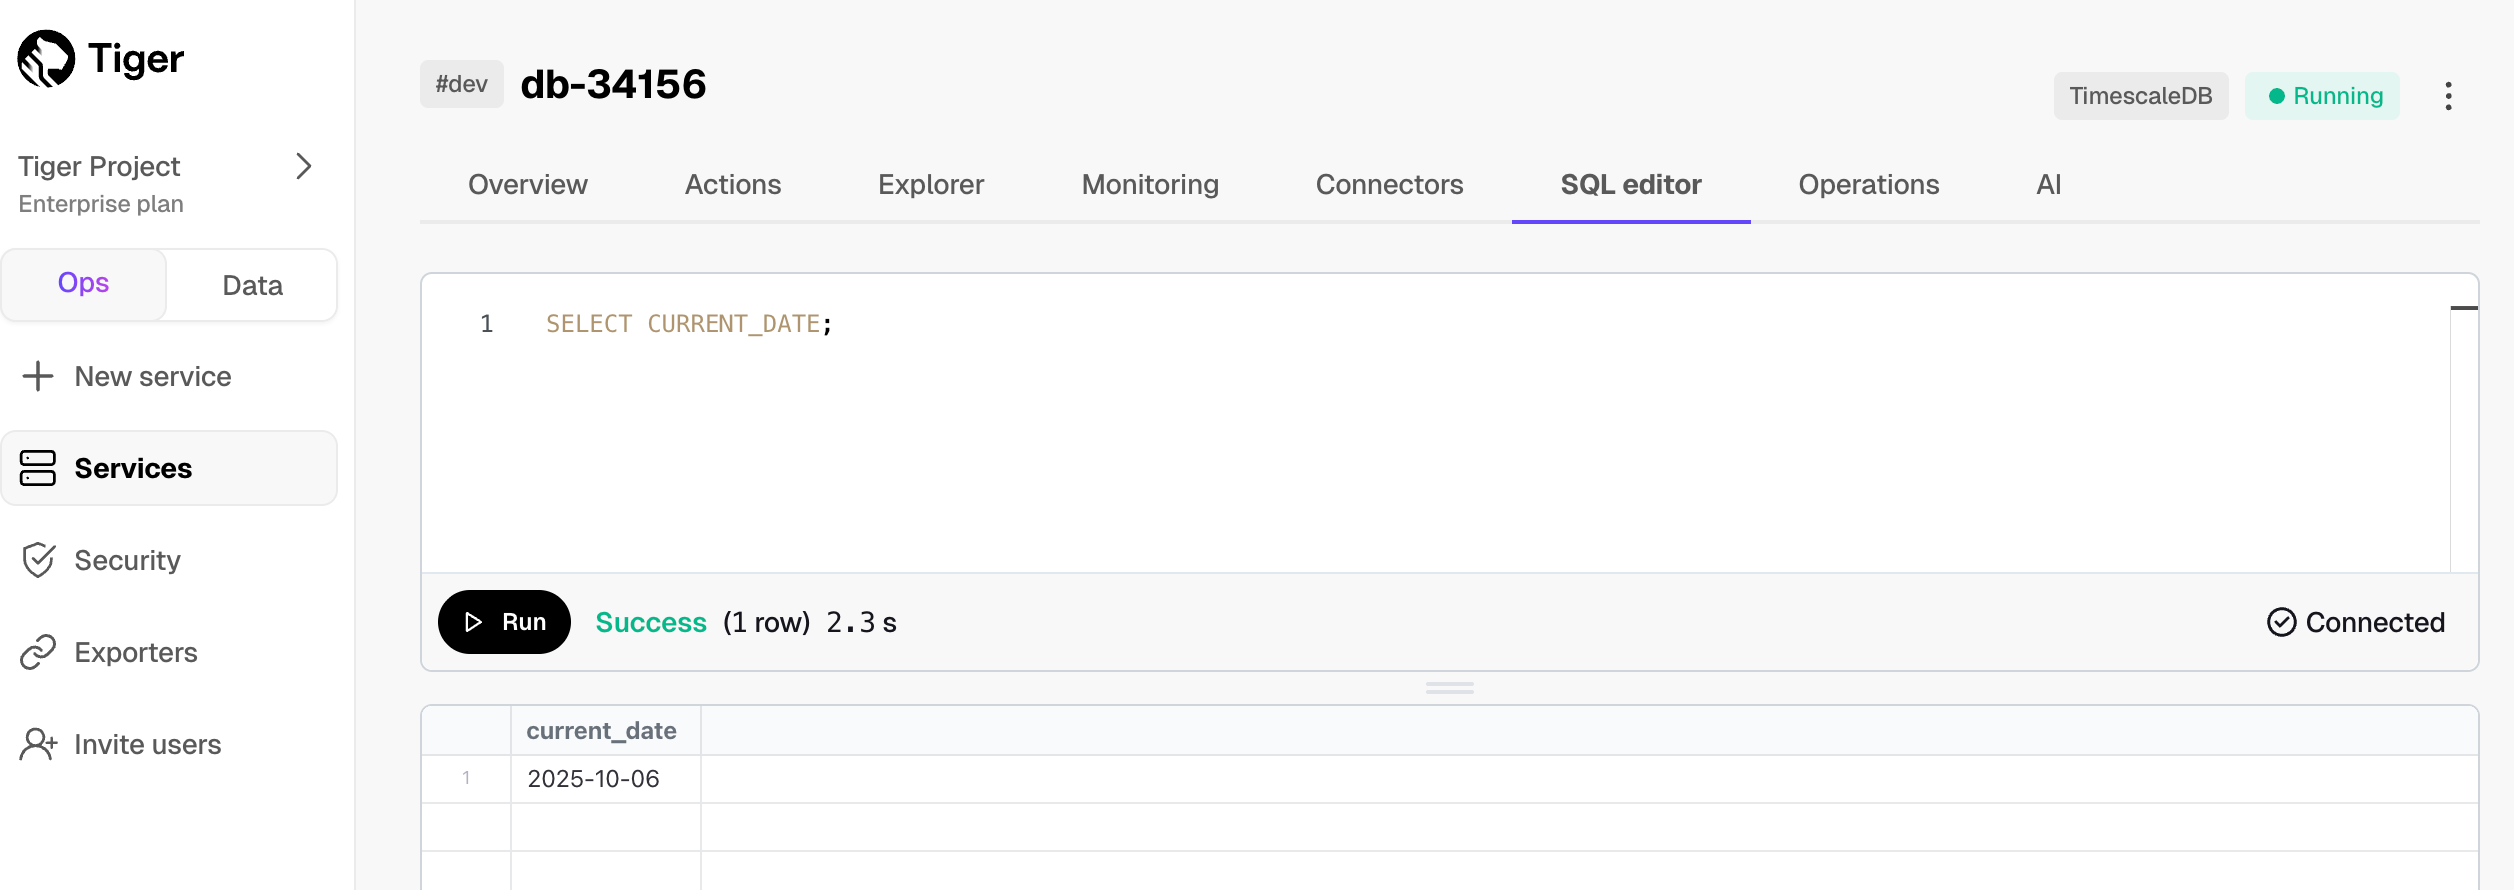
Cloud SQL editor licenses
- SQL editor in the ops mode: free for anyone with a Tiger Data account.
- Data mode: the number of seats you are allocated depends on your pricing plan.
SQL Assistant is currently free for all users. In the future, limits or paid options may be introduced as we work to build the best experience.
- PopSQL standalone: there is a free plan available to everyone, as well as paid plans. See PopSQL Pricing for full details.
What next? Try the key features offered by Tiger Data, see the tutorials, interact with the data in your Tiger Cloud service using your favorite programming language, integrate your Tiger Cloud service with a range of third-party tools, plain old Use Tiger Data products, or dive into the API reference.
===== PAGE: https://docs.tigerdata.com/use-timescale/hypertables/ =====
Hypertables
Tiger Cloud supercharges your real-time analytics by letting you run complex queries continuously, with near-zero latency. Under the hood, this is achieved by using hypertables—Postgres tables that automatically partition your time-series data by time and optionally by other dimensions. When you run a query, Tiger Cloud identifies the correct partition, called chunk, and runs the query on it, instead of going through the entire table.
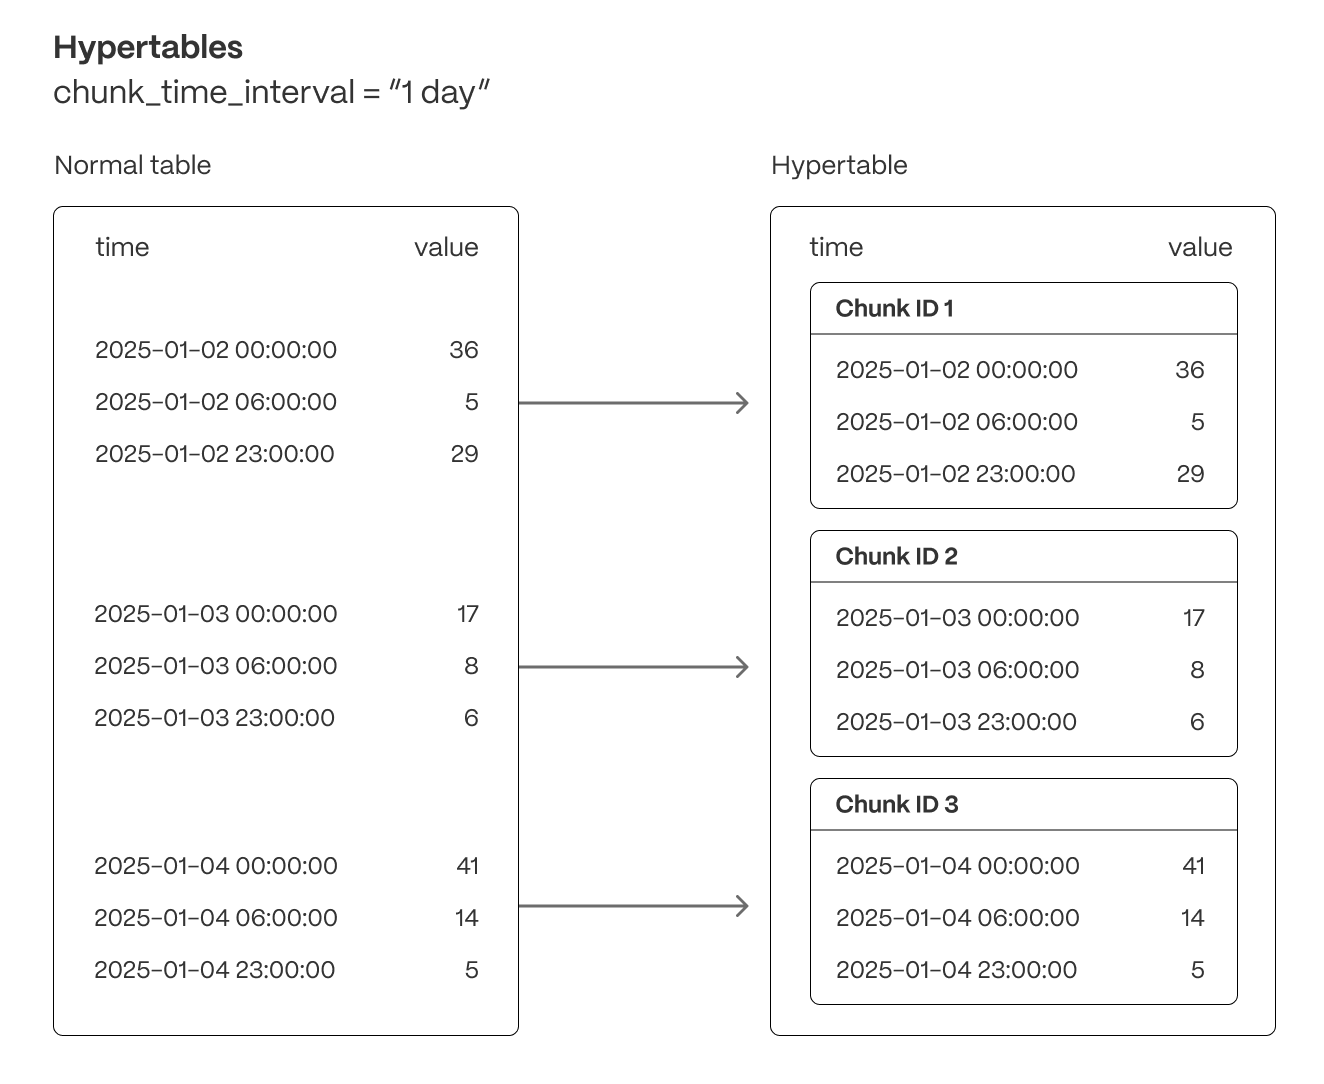
Hypertables offer the following benefits:
Efficient data management with automated partitioning by time: Tiger Cloud splits your data into chunks that hold data from a specific time range. For example, one day or one week. You can configure this range to better suit your needs.
Better performance with strategic indexing: an index on time in the descending order is automatically created when you create a hypertable. More indexes are created on the chunk level, to optimize performance. You can create additional indexes, including unique indexes, on the columns you need.
Faster queries with chunk skipping: Tiger Cloud skips the chunks that are irrelevant in the context of your query, dramatically reducing the time and resources needed to fetch results. Even more—you can enable chunk skipping on non-partitioning columns.
Advanced data analysis with hyperfunctions: Tiger Cloud enables you to efficiently process, aggregate, and analyze significant volumes of data while maintaining high performance.
To top it all, there is no added complexity—you interact with hypertables in the same way as you would with regular Postgres tables. All the optimization magic happens behind the scenes.
Inheritance is not supported for hypertables and may lead to unexpected behavior.
Partition by time
Each hypertable is partitioned into child hypertables called chunks. Each chunk is assigned a range of time, and only contains data from that range.
Time partitioning
Typically, you partition hypertables on columns that hold time values.
Best practice is to use timestamptz column type. However, you can also partition on
date, integer, timestamp and UUIDv7 types.
By default, each hypertable chunk holds data for 7 days. You can change this to better suit your
needs. For example, if you set chunk_interval to 1 day, each chunk stores data for a single day.
TimescaleDB divides time into potential chunk ranges, based on the chunk_interval. Each hypertable chunk holds
data for a specific time range only. When you insert data from a time range that doesn't yet have a chunk, TimescaleDB
automatically creates a chunk to store it.
In practice, this means that the start time of your earliest chunk does not necessarily equal the earliest timestamp in your hypertable. Instead, there might be a time gap between the start time and the earliest timestamp. This doesn't affect your usual interactions with your hypertable, but might affect the number of chunks you see when inspecting it.
Best practices for scaling and partitioning
Best practices for maintaining a high performance when scaling include:
- Limit the number of hypertables in your service; having tens of thousands of hypertables is not recommended.
- Choose a strategic chunk size.
Chunk size affects insert and query performance. You want a chunk small enough to fit into memory so you can insert and query recent data without reading from disk. However, having too many small and sparsely filled chunks can affect query planning time and compression. The more chunks in the system, the slower that process becomes, even more so when all those chunks are part of a single hypertable.
Postgres builds the index on the fly during ingestion. That means that to build a new entry on the index, a significant portion of the index needs to be traversed during every row insertion. When the index does not fit into memory, it is constantly flushed to disk and read back. This wastes IO resources which would otherwise be used for writing the heap/WAL data to disk.
The default chunk interval is 7 days. However, best practice is to set chunk_interval so that prior to processing,
the indexes for chunks currently being ingested into fit within 25% of main memory. For example, on a system with 64
GB of memory, if index growth is approximately 2 GB per day, a 1-week chunk interval is appropriate. If index growth is
around 10 GB per day, use a 1-day interval.
You set chunk_interval when you create a hypertable, or by calling
set_chunk_time_interval on an existing hypertable.
For a detailed analysis of how to optimize your chunk sizes, see the blog post on chunk time intervals. To learn how to view and set your chunk time intervals, see Optimize hypertable chunk intervals.
Hypertable indexes
By default, indexes are automatically created when you create a hypertable. The default index is on time, descending.
You can prevent index creation by setting the create_default_indexes option to false.
Hypertables have some restrictions on unique constraints and indexes. If you want a unique index on a hypertable, it must include all the partitioning columns for the table. To learn more, see Enforce constraints with unique indexes on hypertables.
You can prevent index creation by setting the create_default_indexes option to false.
Partition by dimension
Partitioning on time is the most common use case for hypertable, but it may not be enough for your needs. For example, you may need to scan for the latest readings that match a certain condition without locking a critical hypertable.
The use case for a partitioning dimension is a multi-tenant setup. You isolate the tenants using the tenant_id space
partition. However, you must perform extensive testing to ensure this works as expected, and there is a strong risk of
partition explosion.
You add a partitioning dimension at the same time as you create the hypertable, when the table is empty. The good news
is that although you select the number of partitions at creation time, as your data grows you can change the number of
partitions later and improve query performance. Changing the number of partitions only affects chunks created after the
change, not existing chunks. To set the number of partitions for a partitioning dimension, call set_number_partitions.
For example:
Create the hypertable with the 1-day interval chunk interval
CREATE TABLE conditions( "time" timestamptz not null, device_id integer, temperature float ) WITH( timescaledb.hypertable, timescaledb.partition_column='time', timescaledb.chunk_interval='1 day' );Add a hash partition on a non-time column
select * from add_dimension('conditions', by_hash('device_id', 3));
Now use your hypertable as usual, but you can also ingest and query efficiently by the device_id column.
Change the number of partitions as you data grows
select set_number_partitions('conditions', 5, 'device_id');
===== PAGE: https://docs.tigerdata.com/use-timescale/hypercore/ =====
Hypercore
Hypercore is a hybrid row-columnar storage engine in TimescaleDB. It is designed specifically for real-time analytics and powered by time-series data. The advantage of hypercore is its ability to seamlessly switch between row-oriented and column-oriented storage, delivering the best of both worlds:
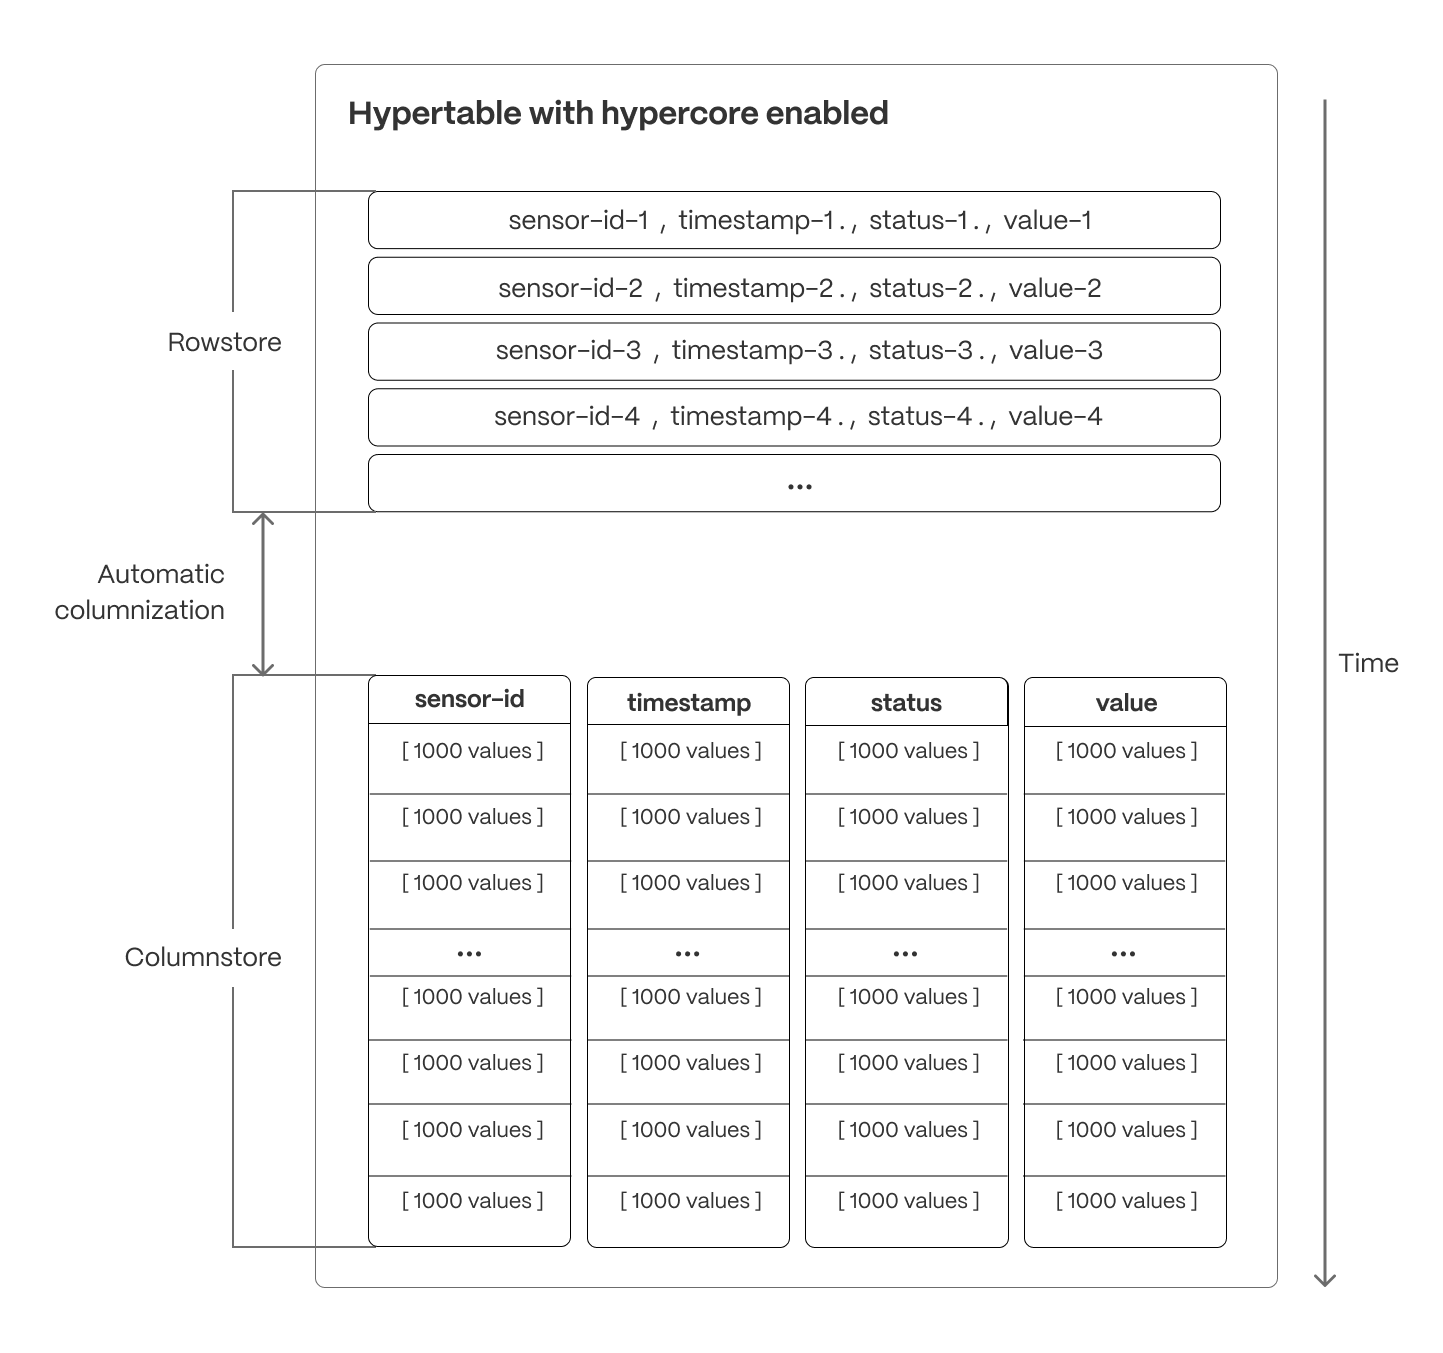
Hypercore solves the key challenges in real-time analytics:
- High ingest throughput
- Low-latency ingestion
- Fast query performance
- Efficient handling of data updates and late-arriving data
- Streamlined data management
Hypercore’s hybrid approach combines the benefits of row-oriented and column-oriented formats:
Fast ingest with rowstore: new data is initially written to the rowstore, which is optimized for high-speed inserts and updates. This process ensures that real-time applications easily handle rapid streams of incoming data. Mutability—upserts, updates, and deletes happen seamlessly.
Efficient analytics with columnstore: as the data cools and becomes more suited for analytics, it is automatically converted to the columnstore. This columnar format enables fast scanning and aggregation, optimizing performance for analytical workloads while also saving significant storage space.
Faster queries on compressed data in columnstore: in the columnstore conversion, hypertable chunks are compressed by up to 98%, and organized for efficient, large-scale queries. Combined with chunk skipping, this helps you save on storage costs and keeps your queries operating at lightning speed.
Fast modification of compressed data in columnstore: just use SQL to add or modify data in the columnstore. TimescaleDB is optimized for superfast INSERT and UPSERT performance.
Full mutability with transactional semantics: regardless of where data is stored, hypercore provides full ACID support. Like in a vanilla Postgres database, inserts and updates to the rowstore and columnstore are always consistent, and available to queries as soon as they are completed.
For an in-depth explanation of how hypertables and hypercore work, see the Data model.
This section shows the following:
- Optimize your data for real-time analytics
- Improve query and upsert performance using secondary indexes
- Compression methods in hypercore
- Troubleshooting
===== PAGE: https://docs.tigerdata.com/use-timescale/continuous-aggregates/ =====
Continuous aggregates
From real-time dashboards to performance monitoring and historical trend analysis, data aggregation is a must-have for any sort of analytical application. To address this need, TimescaleDB uses continuous aggregates to precompute and store aggregate data for you. Using Postgres materialized views, TimescaleDB incrementally refreshes the aggregation query in the background. When you do run the query, only the data that has changed needs to be computed, not the entire dataset. This means you always have the latest aggregate data at your fingertips—and spend as little resources on it, as possible.
In this section you:
- Learn about continuous aggregates to understand how it works before you begin using it.
- Create a continuous aggregate and query it.
- Create a continuous aggregate on top of another continuous aggregate.
- Add refresh policies to an existing continuous aggregate.
- Manage time in your continuous aggregates.
- Drop data from your continuous aggregates.
- Manage materialized hypertables.
- Use real-time aggregates.
- Convert continuous aggregates to the columnstore.
- Migrate your continuous aggregates from old to new format. Continuous aggregates created in TimescaleDB v2.7 and later are in the new format, unless explicitly created in the old format.
- Troubleshoot continuous aggregates.
===== PAGE: https://docs.tigerdata.com/use-timescale/services/ =====
About Tiger Cloud services
Tiger Cloud is the modern Postgres data platform for all your applications. It enhances Postgres to handle time series, events, real-time analytics, and vector search—all in a single database alongside transactional workloads.
You get one system that handles live data ingestion, late and out-of-order updates, and low latency queries, with the performance, reliability, and scalability your app needs. Ideal for IoT, crypto, finance, SaaS, and a myriad other domains, Tiger Cloud allows you to build data-heavy, mission-critical apps while retaining the familiarity and reliability of Postgres.
A Tiger Cloud service is a single optimised Postgres instance extended with innovations in the database engine and cloud infrastructure to deliver speed without sacrifice. A Tiger Cloud service is 10-1000x faster at scale! It is ideal for applications requiring strong data consistency, complex relationships, and advanced querying capabilities. Get ACID compliance, extensive SQL support, JSON handling, and extensibility through custom functions, data types, and extensions.
Each service is associated with a project in Tiger Cloud. Each project can have multiple services. Each user is a member of one or more projects.
You create free and standard services in Tiger Cloud Console, depending on your pricing plan. A free service comes at zero cost and gives you limited resources to get to know Tiger Cloud. Once you are ready to try out more advanced features, you can switch to a paid plan and convert your free service to a standard one.
The Free pricing plan and services are currently in beta.
To the Postgres you know and love, Tiger Cloud adds the following capabilities:
Standard services:
- Real-time analytics: store and query time-series data at scale for real-time analytics and other use cases. Get faster time-based queries with hypertables, continuous aggregates, and columnar storage. Save money by compressing data into the columnstore, moving cold data to low-cost bottomless storage in Amazon S3, and deleting old data with automated policies.
- AI-focused: build AI applications from start to scale. Get fast and accurate similarity search with the pgvector and pgvectorscale extensions.
- Hybrid applications: get a full set of tools to develop applications that combine time-based data and AI.
All standard Tiger Cloud services include the tooling you expect for production and developer environments: live migration, automatic backups and PITR, high availability, read replicas, data forking, connection pooling, tiered storage, usage-based storage, secure in-Tiger Cloud Console SQL editing, service metrics and insights, streamlined maintenance, and much more. Tiger Cloud continuously monitors your services and prevents common Postgres out-of-memory crashes.
- Free services:
Postgres with TimescaleDB and vector extensions
Free services offer limited resources and a basic feature scope, perfect to get to know Tiger Cloud in a development environment.
Learn more about Tiger Cloud
Read about Tiger Cloud features in the documentation:
- Create your first hypertable.
- Run your first query using time_bucket().
- Trying more advanced time-series functions, starting with gap filling or real-time aggregates.
Keep testing during your free trial
You're now on your way to a great start with Tiger Cloud.
You have an unthrottled, 30-day free trial with Tiger Cloud to continue to test your use case. Before the end of your trial, make sure you add your credit card information. This ensures a smooth transition after your trial period concludes.
If you have any questions, you can join our community Slack group or contact us directly.
Advanced configuration
Tiger Cloud is a versatile hosting service that provides a growing list of advanced features for your Postgres and time-series data workloads.
For more information about customizing your database configuration, see the Configuration section.
The TimescaleDB Terraform provider provides configuration management resources for Tiger Cloud. You can use it to create, rename, resize, delete, and import services. For more information about the supported service configurations and operations, see the Terraform provider documentation.
===== PAGE: https://docs.tigerdata.com/use-timescale/write-data/ =====
Write data
Writing data in TimescaleDB works the same way as writing data to regular
Postgres. You can add and modify data in both regular tables and hypertables
using INSERT, UPDATE, and DELETE statements.
- Learn about writing data in TimescaleDB
- Insert data into hypertables
- Update data in hypertables
- Upsert data into hypertables
- Delete data from hypertables
For more information about using third-party tools to write data into TimescaleDB, see the Ingest data from other sources section.
===== PAGE: https://docs.tigerdata.com/use-timescale/query-data/ =====
Query data
Hypertables in TimescaleDB are Postgres tables. That means you can query them with standard SQL commands.
- About querying data
- Select data with
SELECT - Get faster
DISTINCTqueries with SkipScan - Perform advanced analytic queries
===== PAGE: https://docs.tigerdata.com/use-timescale/time-buckets/ =====
Time buckets
Time buckets enable you to aggregate data in hypertables by time interval. For example, you can group data into 5-minute, 1-hour, and 3-day buckets to calculate summary values.
- Learn how time buckets work
- Use time buckets to aggregate data
===== PAGE: https://docs.tigerdata.com/use-timescale/schema-management/ =====
Schema management
A database schema defines how the tables and indexes in your database are organized. Using a schema that is appropriate for your workload can result in significant performance improvements.
- Learn about schema management to understand how it works before you begin using it.
- Learn about indexing to understand how it works before you begin using it.
- Learn about tablespaces to understand how they work before you begin using them.
- Learn about constraints to understand how they work before you begin using them.
- Alter a hypertable to modify your schema.
- Create an index to speed up your queries.
- Create triggers to propagate your schema changes to chunks.
- Use JSON and JSONB for semi-structured data.
- Query external databases with foreign data wrappers.
- Troubleshoot your schemas.
===== PAGE: https://docs.tigerdata.com/use-timescale/configuration/ =====
Configuration
By default, Tiger Cloud uses the standard Postgres server configuration settings. However, in some cases, these settings are not appropriate, especially if you have larger servers that use more hardware resources such as CPU, memory, and storage.
This section contains information about tuning your Tiger Cloud service.
===== PAGE: https://docs.tigerdata.com/use-timescale/alerting/ =====
Alerting
Early issue detecting and prevention, ensuring high availability, and performance optimization are only a few of the reasons why alerting plays a major role for modern applications, databases, and services.
There are a variety of different alerting solutions you can use in conjunction with Tiger Cloud that are part of the Postgres ecosystem. Regardless of whether you are creating custom alerts embedded in your applications, or using third-party alerting tools to monitor event data across your organization, there are a wide selection of tools available.
Grafana
Grafana is a great way to visualize your analytical queries, and it has a first-class integration with Tiger Data products. Beyond data visualization, Grafana also provides alerting functionality to keep you notified of anomalies.
Within Grafana, you can define alert rules which are time-based thresholds for your dashboard data (for example, "Average CPU usage greater than 80 percent for 5 minutes"). When those alert rules are triggered, Grafana sends a message via the chosen notification channel. Grafana provides integration with webhooks, email and more than a dozen external services including Slack and PagerDuty.
To get started, first download and install Grafana. Next, add a new Postgres data source that points to your Tiger Cloud service. This data source was built by Tiger Data engineers, and it is designed to take advantage of the database's time-series capabilities. From there, proceed to your dashboard and set up alert rules as described above.
Alerting is only available in Grafana v4.0 and later.
Other alerting tools
Tiger Cloud works with a variety of alerting tools within the Postgres ecosystem. Users can use these tools to set up notifications about meaningful events that signify notable changes to the system.
Some popular alerting tools that work with Tiger Cloud include:
See the integration guides for details.
===== PAGE: https://docs.tigerdata.com/use-timescale/data-retention/ =====
Data retention
Data retention helps you save on storage costs by deleting old data. You can combine data retention with continuous aggregates to downsample your data.
In this section:
- Learn about data retention before you start using it
- Learn about data retention with continuous aggregates for downsampling data
- Create a data retention policy
- Manually drop chunks of data
- Troubleshoot data retention
===== PAGE: https://docs.tigerdata.com/use-timescale/data-tiering/ =====
Storage in Tiger
Tiered storage is a hierarchical storage management architecture for real-time analytics services you create in Tiger Cloud.
Engineered for infinite low-cost scalability, tiered storage consists of the following:
High-performance storage tier: stores the most recent and frequently queried data. This tier comes in two types, standard and enhanced, and provides you with up to 64 TB of storage and 32,000 IOPS.
Object storage tier: stores data that is rarely accessed and has lower performance requirements. For example, old data for auditing or reporting purposes over long periods of time, even forever. The object storage tier is low-cost and bottomless.
No matter the tier your data is stored in, you can query it when you need it. Tiger Cloud seamlessly accesses the correct storage tier and generates the response.
You define tiering policies that automatically migrate data from the high-performance storage tier to the object tier as it ages. You use retention policies to remove very old data from the object storage tier.
With tiered storage you don't need an ETL process, infrastructure changes, or custom-built, bespoke solutions to offload data to secondary storage and fetch it back in when needed. Kick back and relax, we do the work for you.
In this section, you:
- Learn more about storage tiers: understand how the tiers are built and how they differ.
- Manage storage and tiering: configure high-performance storage, object storage, and data tiering.
- Query tiered data: query the data in the object storage.
- Learn about replicas and forks with tiered data: understand how tiered storage works with forks and replicas of your service.
===== PAGE: https://docs.tigerdata.com/use-timescale/metrics-logging/ =====
Metrics and logging
Find metrics and logs for your services in Tiger Cloud Console, or integrate with third-party monitoring services:
- Monitor your services in Tiger Cloud Console.
- Export metrics to Datadog.
- Export metrics to Amazon Cloudwatch.
- Export metrics to Prometheus.
===== PAGE: https://docs.tigerdata.com/use-timescale/ha-replicas/ =====
High availability and read replication
In Tiger Cloud, replicas are copies of the primary data instance in a Tiger Cloud service. If your primary becomes unavailable, Tiger Cloud automatically fails over to your HA replica.
The replication strategies offered by Tiger Cloud are:
High Availability(HA) replicas: significantly reduce the risk of downtime and data loss due to system failure, and enable services to avoid downtime during routine maintenance.
Read replicas: safely scale a service to power your read-intensive
apps and business intelligence tooling and remove the load from the primary data instance.
For MST, see Failover in Managed Service for TimescaleDB. For self-hosted TimescaleDB, see Replication and high availability.
Rapid recovery
By default, all services have rapid recovery enabled.
Because compute and storage are handled separately in Tiger Cloud, services recover quickly from compute failures, but usually need a full recovery from backup for storage failures.
Compute failure: the most common cause of database failure. Compute failures can be caused by hardware failing, or through things like unoptimized queries, causing increased load that maxes out the CPU usage. In these cases, data on disk is unaffected and only the compute and memory needs replacing. Tiger Cloud recovery immediately provisions new compute infrastructure for the service and mounts the existing storage to the new node. Any WAL that was in memory then replays. This process typically only takes thirty seconds. However, depending on the amount of WAL that needs replaying this may take up to twenty minutes. Even in the worst-case scenario, Tiger Cloud recovery is an order of magnitude faster than a standard recovery from backup.
Storage failure: in the rare occurrence of disk failure, Tiger Cloud automatically performs a full recovery from backup.
If CPU usage for a service runs high for long periods of time, issues such as WAL archiving getting queued behind other processes can occur. This can cause a failure and could result in a larger data loss. To avoid data loss, services are monitored for this kind of scenario.
===== PAGE: https://docs.tigerdata.com/use-timescale/upgrades/ =====
Maintenance and upgrades
Tiger Cloud offers managed database services that provide a stable and reliable environment for your applications. Each service is based on a specific version of the Postgres database and the TimescaleDB extension. To ensure that you benefit from the latest features, performance and security improvements, it is important that your Tiger Cloud service is kept up to date with the latest versions of TimescaleDB and Postgres.
Tiger Cloud has the following upgrade policies:
- Minor software upgrades: handled automatically, you do not need to do anything.
Upgrades are performed on your Tiger Cloud service during a maintenance window that you define to suit your workload. You can also manually upgrade TimescaleDB.
- Critical security upgrades: installed outside normal maintenance windows when necessary, and sometimes require a short outage.
Downtime is usually between 30 seconds and 5 minutes. Tiger Data aims to notify you by email if downtime is required, so that you can plan accordingly. However, in some cases this is not possible.
- Major upgrades: such as a new version of Postgres are performed manually by you, or automatically by Tiger Cloud.
After a maintenance upgrade, the DNS name remains the same. However, the IP address often changes.
Minor software upgrades
If you do not manually upgrade TimescaleDB for non-critical upgrades,
Tiger Cloud performs upgrades automatically in the next available maintenance window. The upgrade is first applied to your services tagged #dev, and three weeks later to those tagged #prod. Subscribe to get an email notification before your #prod services are upgraded. You can upgrade your #prod services manually sooner, if needed.
Most upgrades that occur during your maintenance windows do not require any downtime. This means that there is no service outage during the upgrade. However, all connections and transactions in progress during the upgrade are reset. Usually, the service connection is automatically restored after the reset.
Some minor upgrades do require some downtime. This is usually between 30 seconds and 5 minutes. If downtime is required for an upgrade, Tiger Data endeavors to notify you by email ahead of the upgrade. However, in some cases, we might not be able to do so. Best practice is to schedule your maintenance window so that any downtime disrupts your workloads as little as possible and minimize downtime with replicas. If there are no pending upgrades available during a regular maintenance window, no changes are performed.
To track the status of maintenance events, see the Tiger Cloud status page.
Minimize downtime with replicas
Maintenance upgrades require up to two automatic failovers. Each failover takes less than a few seconds. Tiger Cloud services with high-availability replicas and read replicas require minimal write downtime during maintenance, read-only queries keep working throughout.
During a maintenance event, services with replicas perform maintenance on each node independently. When maintenance is complete on the primary node, it is restarted:
- If the restart takes more than a minute, a replica node is promoted to primary, given that the replica has no replication lag. Maintenance now proceeds on the newly promoted replica, following the same sequence. If the newly promoted replica takes more than a minute to restart, the former primary is promoted back. In total, the process may result in up to two minutes of write downtime and two failover events.
- If the maintenance on the primary node is completed within a minute and it comes back online, the replica remains the replica.
Manually upgrade TimescaleDB for non-critical upgrades
Non-critical upgrades are available before the upgrade is performed automatically by Tiger Cloud. To upgrade TimescaleDB manually:
- Connect to your service
In Tiger Cloud Console, select the service you want to upgrade.
- Upgrade TimescaleDB
Either:
- Click
SQL Editor, then runALTEREXTENSION timescaledb UPDATE. - Click
⋮, thenPauseandResumethe service.
Upgrading to a newer version of Postgres allows you to take advantage of new features, enhancements, and security fixes. It also ensures that you are using a version of Postgres that's compatible with the newest version of TimescaleDB, allowing you to take advantage of everything it has to offer. For more information about feature changes between versions, see the Tiger Cloud release notes, supported systems, and the Postgres release notes.
Deprecations
To ensure you benefit from the latest features, optimal performance, enhanced security, and full compatibility with TimescaleDB, Tiger Cloud supports a defined set of Postgres major versions. To reduce the maintenance burden and continue providing a high-quality managed experience, as Postgres and TimescaleDB evolve, Tiger Data periodically deprecates older Postgres versions.
Tiger Data provides advance notification to allow you ample time to plan and perform your upgrade. The timeline deprecation is as follows:
- Deprecation notice period begins: you receive email notification of the deprecation and the timeline for the upgrade.
- Customer self-service upgrade window: best practice is to manually upgrade to a new Postgres version in this time.
- Automatic upgrade deadline: Tiger Cloud performs an automatic upgrade of your service.
Manually upgrade Postgres for a service
Upgrading to a newer version of Postgres enables you to take advantage of new features, enhancements, and security fixes. It also ensures that you are using a version of Postgres that's compatible with the newest version of TimescaleDB.
For a smooth upgrade experience, make sure you:
- Plan ahead: upgrades cause downtime, so ideally perform an upgrade during a low traffic time.
- Run a test upgrade: fork your service, then try out the upgrade on the fork before running it on your production system. This gives you a good idea of what happens during the upgrade, and how long it might take.
- Keep a copy of your service: if you're worried about losing your data, fork your service without upgrading, and keep this duplicate of your service. To reduce cost, you can immediately pause this fork and only pay for storage until you are comfortable deleting it after the upgrade is complete.
Tiger Cloud services with replicas cannot be upgraded. To upgrade a service with a replica, you must first delete the replica and then upgrade the service.
The following table shows you the compatible versions of Postgres and TimescaleDB.
| TimescaleDB version |Postgres 17|Postgres 16|Postgres 15|Postgres 14|Postgres 13|Postgres 12|Postgres 11|Postgres 10| |-----------------------|-|-|-|-|-|-|-|-| | 2.22.x |✅|✅|✅|❌|❌|❌|❌|❌|❌| | 2.21.x |✅|✅|✅|❌|❌|❌|❌|❌|❌| | 2.20.x |✅|✅|✅|❌|❌|❌|❌|❌|❌| | 2.17 - 2.19 |✅|✅|✅|✅|❌|❌|❌|❌|❌| | 2.16.x |❌|✅|✅|✅|❌|❌|❌|❌|❌|❌| | 2.13 - 2.15 |❌|✅|✅|✅|✅|❌|❌|❌|❌| | 2.12.x |❌|❌|✅|✅|✅|❌|❌|❌|❌| | 2.10.x |❌|❌|✅|✅|✅|✅|❌|❌|❌| | 2.5 - 2.9 |❌|❌|❌|✅|✅|✅|❌|❌|❌| | 2.4 |❌|❌|❌|❌|✅|✅|❌|❌|❌| | 2.1 - 2.3 |❌|❌|❌|❌|✅|✅|✅|❌|❌| | 2.0 |❌|❌|❌|❌|❌|✅|✅|❌|❌ | 1.7 |❌|❌|❌|❌|❌|✅|✅|✅|✅|
We recommend not using TimescaleDB with Postgres 17.1, 16.5, 15.9, 14.14, 13.17, 12.21. These minor versions introduced a breaking binary interface change that, once identified, was reverted in subsequent minor Postgres versions 17.2, 16.6, 15.10, 14.15, 13.18, and 12.22. When you build from source, best practice is to build with Postgres 17.2, 16.6, etc and higher. Users of Tiger Cloud and platform packages for Linux, Windows, MacOS, Docker, and Kubernetes are unaffected.
For more information about feature changes between versions, see the Postgres release notes and TimescaleDB release notes.
Your Tiger Cloud service is unavailable until the upgrade is complete. This can take up to 20 minutes. Best practice is to test on a fork first, so you can estimate how long the upgrade will take.
To upgrade your service to a newer version of Postgres:
- Connect to your service
In Tiger Cloud Console, select the service you want to upgrade.
Disable high-availability replicas
- Click
Operations>High Availability, then clickChange configuaration. - Select
Non-production (No replica), then clickChange configuration.
- Click
Disable read replicas
- Click
Operations>Read scaling, then click the trash icon next to all replica sets.
- Click
Upgrade Postgres
- Click
Operations>Service Upgrades. - Click
Upgrade service, then confirm that you are ready to start the upgrade.
- Click
Your Tiger Cloud service is unavailable until the upgrade is complete. This normally takes up to 20 minutes. However, it can take longer if you have a large or complex service.
When the upgrade is finished, your service automatically resumes normal operations. If the upgrade is unsuccessful, the service returns to the state it was in before you started the upgrade.
- Enable high-availability replicas and replace your read replicas
Automatic Postgres upgrades for a service
If you do not manually upgrade your services within the customer self-service upgrade window, Tiger Cloud performs an automatic upgrade. Automatic upgrades can result in downtime, best practice is to manually upgrade your services during a low-traffic period for your application.
During an automatic upgrade:
- Any configured high-availability replicas or read replicas are temporarily removed.
- The primary service is upgraded.
- High-availability replicas and read replicas are added back to the service.
Define your maintenance window
When you are considering your maintenance window schedule, best practice is to choose a day and time that usually has very low activity, such as during the early hours of the morning, or over the weekend. This helps minimize the impact of a short service interruption. Alternatively, you might prefer to have your maintenance window occur during office hours, so that you can monitor your system during the upgrade.
To change your maintenance window:
- Connect to your service
In Tiger Cloud Console, select the service you want to manage.
- Set your maintenance window
- Click
Operations>Environment, then clickChange maintenance window.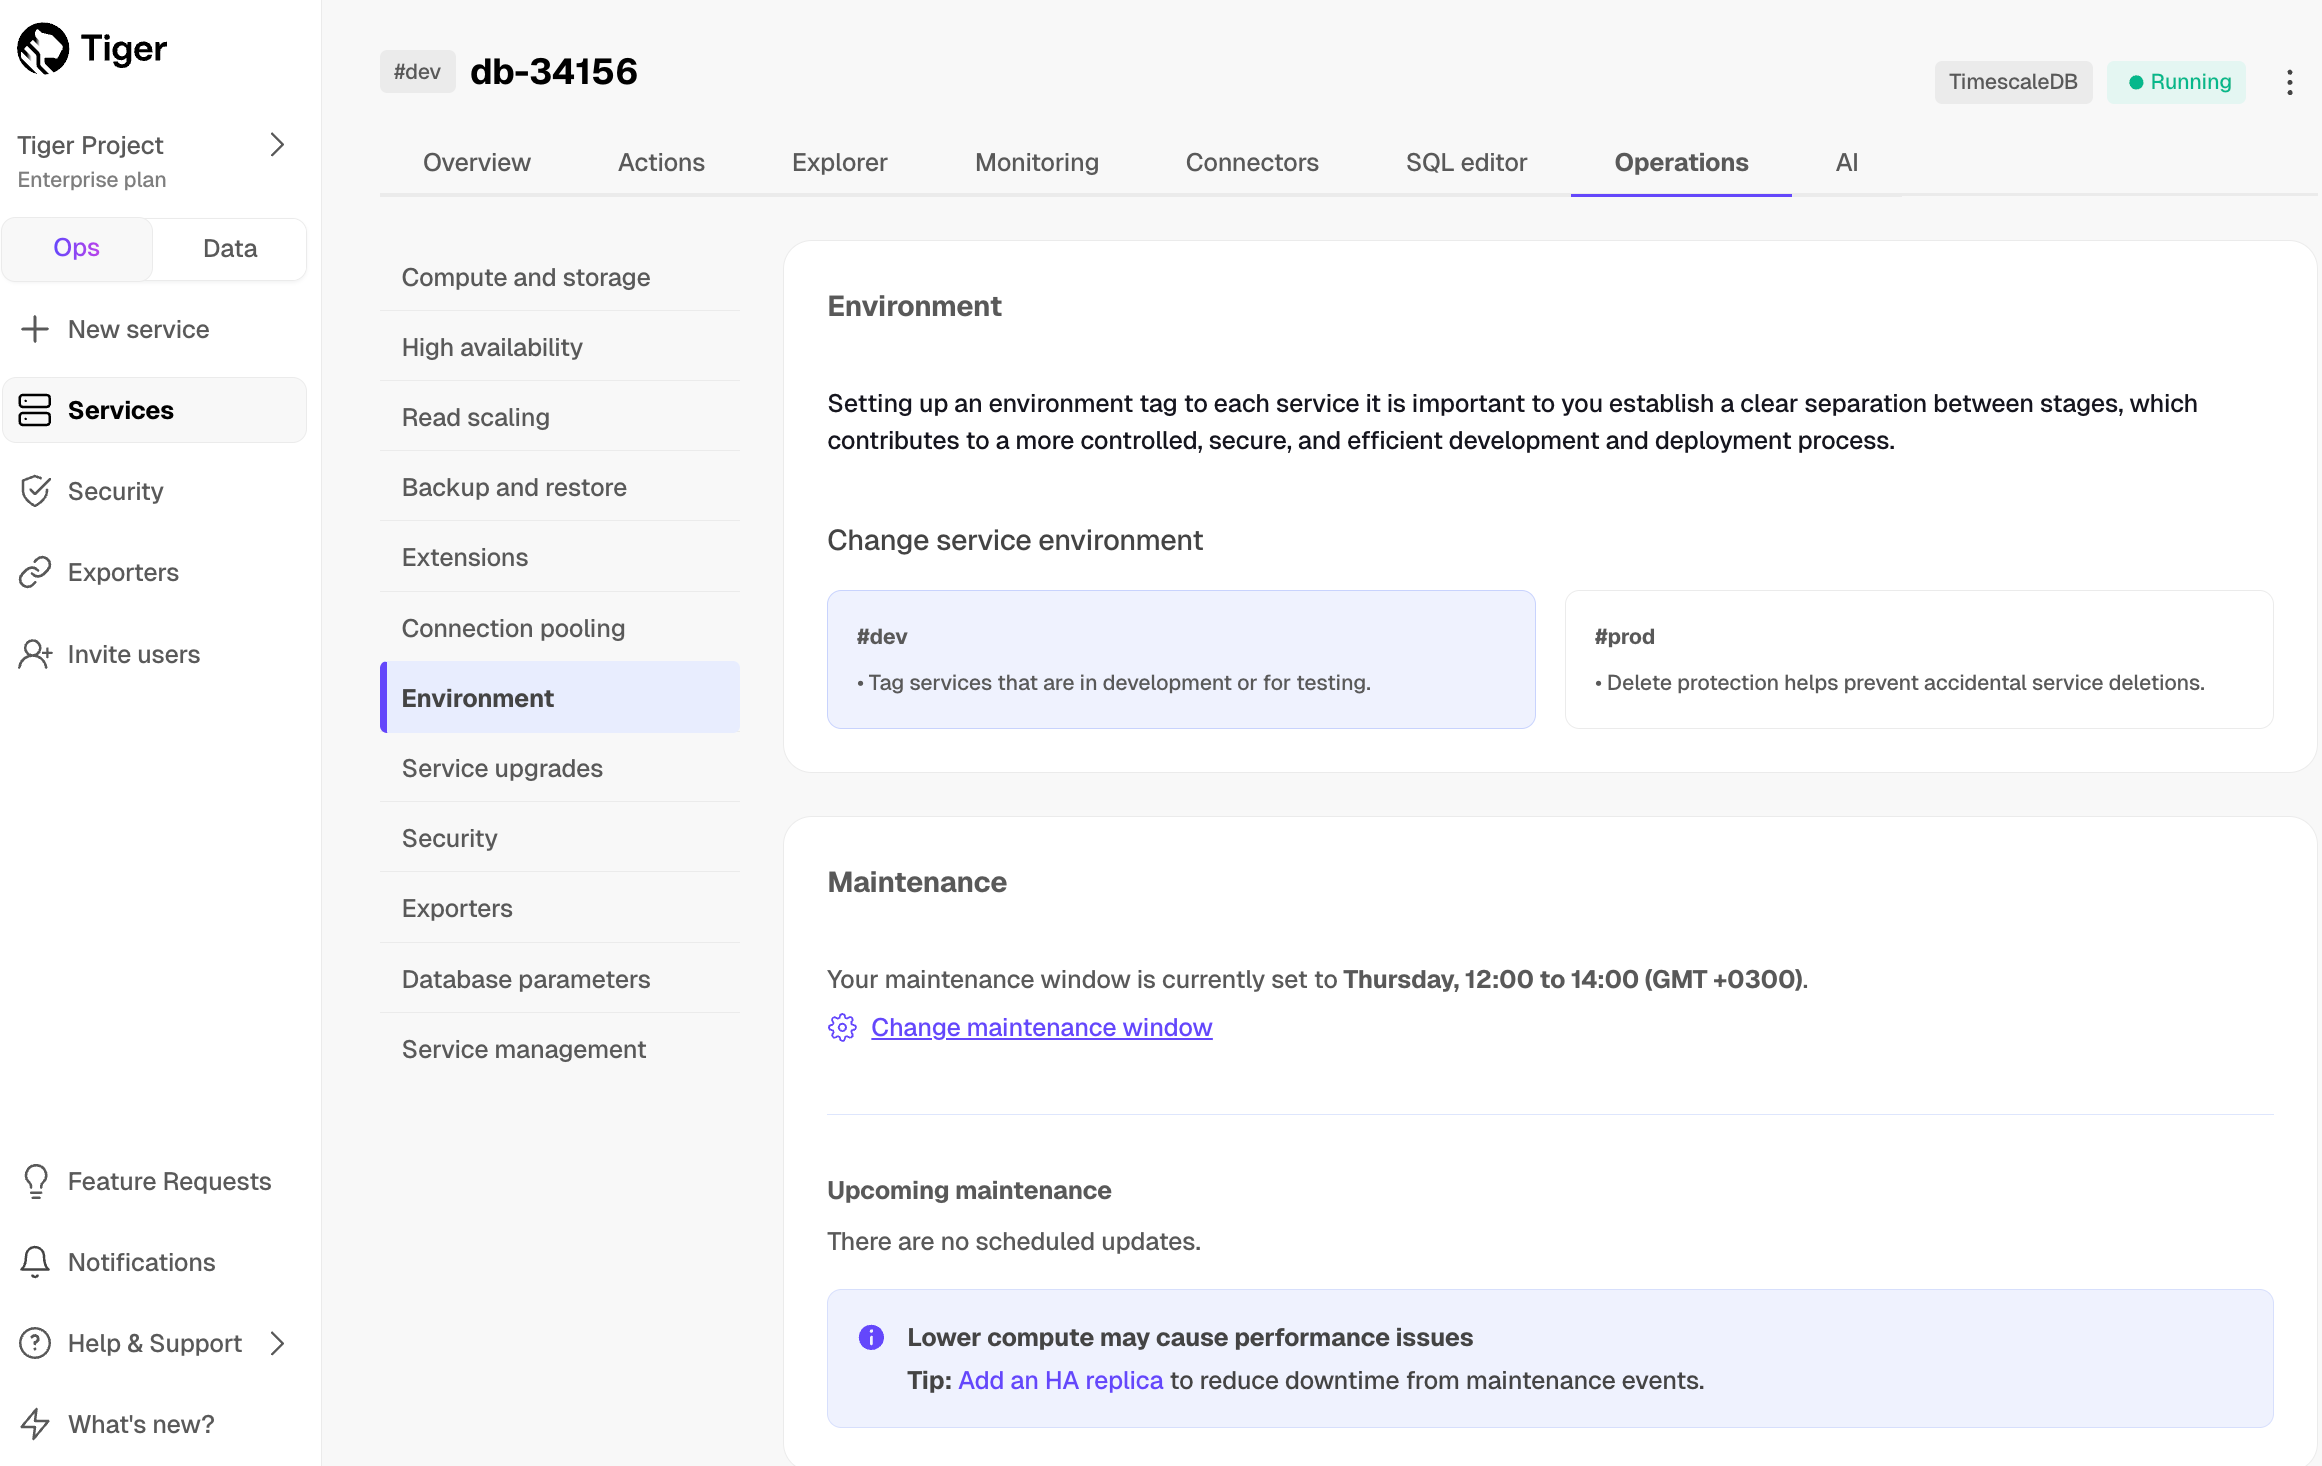
- Select the maintence window start time, then click
Apply.
- Click
Maintenance windows can run for up to four hours.
===== PAGE: https://docs.tigerdata.com/use-timescale/extensions/ =====
Postgres extensions
The following Postgres extensions are installed with each Tiger Cloud service:
Tiger Data extensions
| Extension | Description | Enabled by default |
|---|---|---|
| pgai | Helper functions for AI workflows | For AI-focused services |
| pg_textsearch | BM25-based full-text search | Currently early access. For development and staging environments only |
| pgvector | Vector similarity search for Postgres | For AI-focused services |
| pgvectorscale | Advanced indexing for vector data | For AI-focused services |
| timescaledb_toolkit | TimescaleDB Toolkit | For Real-time analytics services |
| timescaledb | TimescaleDB | For all services |
Postgres built-in extensions
| Extension | Description | Enabled by default |
|---|---|---|
| autoinc | Functions for autoincrementing fields | - |
| amcheck | Functions for verifying relation integrity | - |
| bloom | Bloom access method - signature file-based index | - |
| bool_plperl | Transform between bool and plperl | - |
| btree_gin | Support for indexing common datatypes in GIN | - |
| btree_gist | Support for indexing common datatypes in GiST | - |
| citext | Data type for case-insensitive character strings | - |
| cube | Data type for multidimensional cubes | - |
| dict_int | Text search dictionary template for integers | - |
| dict_xsyn | Text search dictionary template for extended synonym processing | - |
| earthdistance | Calculate great-circle distances on the surface of the Earth | - |
| fuzzystrmatch | Determine similarities and distance between strings | - |
| hstore | Data type for storing sets of (key, value) pairs | - |
| hstore_plperl | Transform between hstore and plperl | - |
| insert_username | Functions for tracking who changed a table | - |
| intagg | Integer aggregator and enumerator (obsolete) | - |
| intarray | Functions, operators, and index support for 1-D arrays of integers | - |
| isn | Data types for international product numbering standards | - |
| jsonb_plperl | Transform between jsonb and plperl | - |
| lo | Large object maintenance | - |
| ltree | Data type for hierarchical tree-like structures | - |
| moddatetime | Functions for tracking last modification time | - |
| old_snapshot | Utilities in support of old_snapshot_threshold |
- |
| pgcrypto | Cryptographic functions | - |
| pgrowlocks | Show row-level locking information | - |
| pgstattuple | Obtain tuple-level statistics | - |
| pg_freespacemap | Examine the free space map (FSM) | - |
| pg_prewarm | Prewarm relation data | - |
| pg_stat_statements | Track execution statistics of all SQL statements executed | For all services |
| pg_trgm | Text similarity measurement and index searching based on trigrams | - |
| pg_visibility | Examine the visibility map (VM) and page-level visibility info | - |
| plperl | PL/Perl procedural language | - |
| plpgsql | SQL procedural language | For all services |
| postgres_fdw | Foreign data wrappers | For all services |
| refint | Functions for implementing referential integrity (obsolete) | - |
| seg | Data type for representing line segments or floating-point intervals | - |
| sslinfo | Information about SSL certificates | - |
| tablefunc | Functions that manipulate whole tables, including crosstab | - |
| tcn | Trigger change notifications | - |
| tsm_system_rows | TABLESAMPLE method which accepts the number of rows as a limit |
- |
| tsm_system_time | TABLESAMPLE method which accepts the time in milliseconds as a limit |
- |
| unaccent | Text search dictionary that removes accents | - |
| uuid-ossp | Generate universally unique identifiers (UUIDs) | - |
Third-party extensions
| Extension | Description | Enabled by default |
|---|---|---|
| h3 | H3 bindings for Postgres | - |
| pgaudit | Detailed session and/or object audit logging | - |
| pgpcre | Perl-compatible RegEx | - |
| pg_cron | SQL commands that you can schedule and run directly inside the database | Contact us to enable |
| pg_repack | Table reorganization in Postgres with minimal locks | - |
| pgrouting | Geospatial routing functionality | - |
| postgis | PostGIS geometry and geography spatial types and functions | - |
| postgis_raster | PostGIS raster types and functions | - |
| postgis_sfcgal | PostGIS SFCGAL functions | - |
| postgis_tiger_geocoder | PostGIS Tiger Cloud geocoder and reverse geocoder | - |
| postgis_topology | PostGIS topology spatial types and functions | - |
| unit | SI units for Postgres | - |
===== PAGE: https://docs.tigerdata.com/use-timescale/backup-restore/ =====
Back up and recover your Tiger Cloud services
Tiger Cloud provides comprehensive backup and recovery solutions to protect your data, including automatic daily backups, cross-region protection, and point-in-time recovery.
Automatic backups
Tiger Cloud automatically handles backup for your Tiger Cloud services using the pgBackRest tool. You don't need to perform
backups manually. What's more, with cross-region backup, you are protected when an entire AWS region goes down.
Tiger Cloud automatically creates one full backup every week, and incremental backups every day in the same region as your service. Additionally, all Write-Ahead Log (WAL) files are retained back to the oldest full backup. This means that you always have a full backup available for the current and previous week:
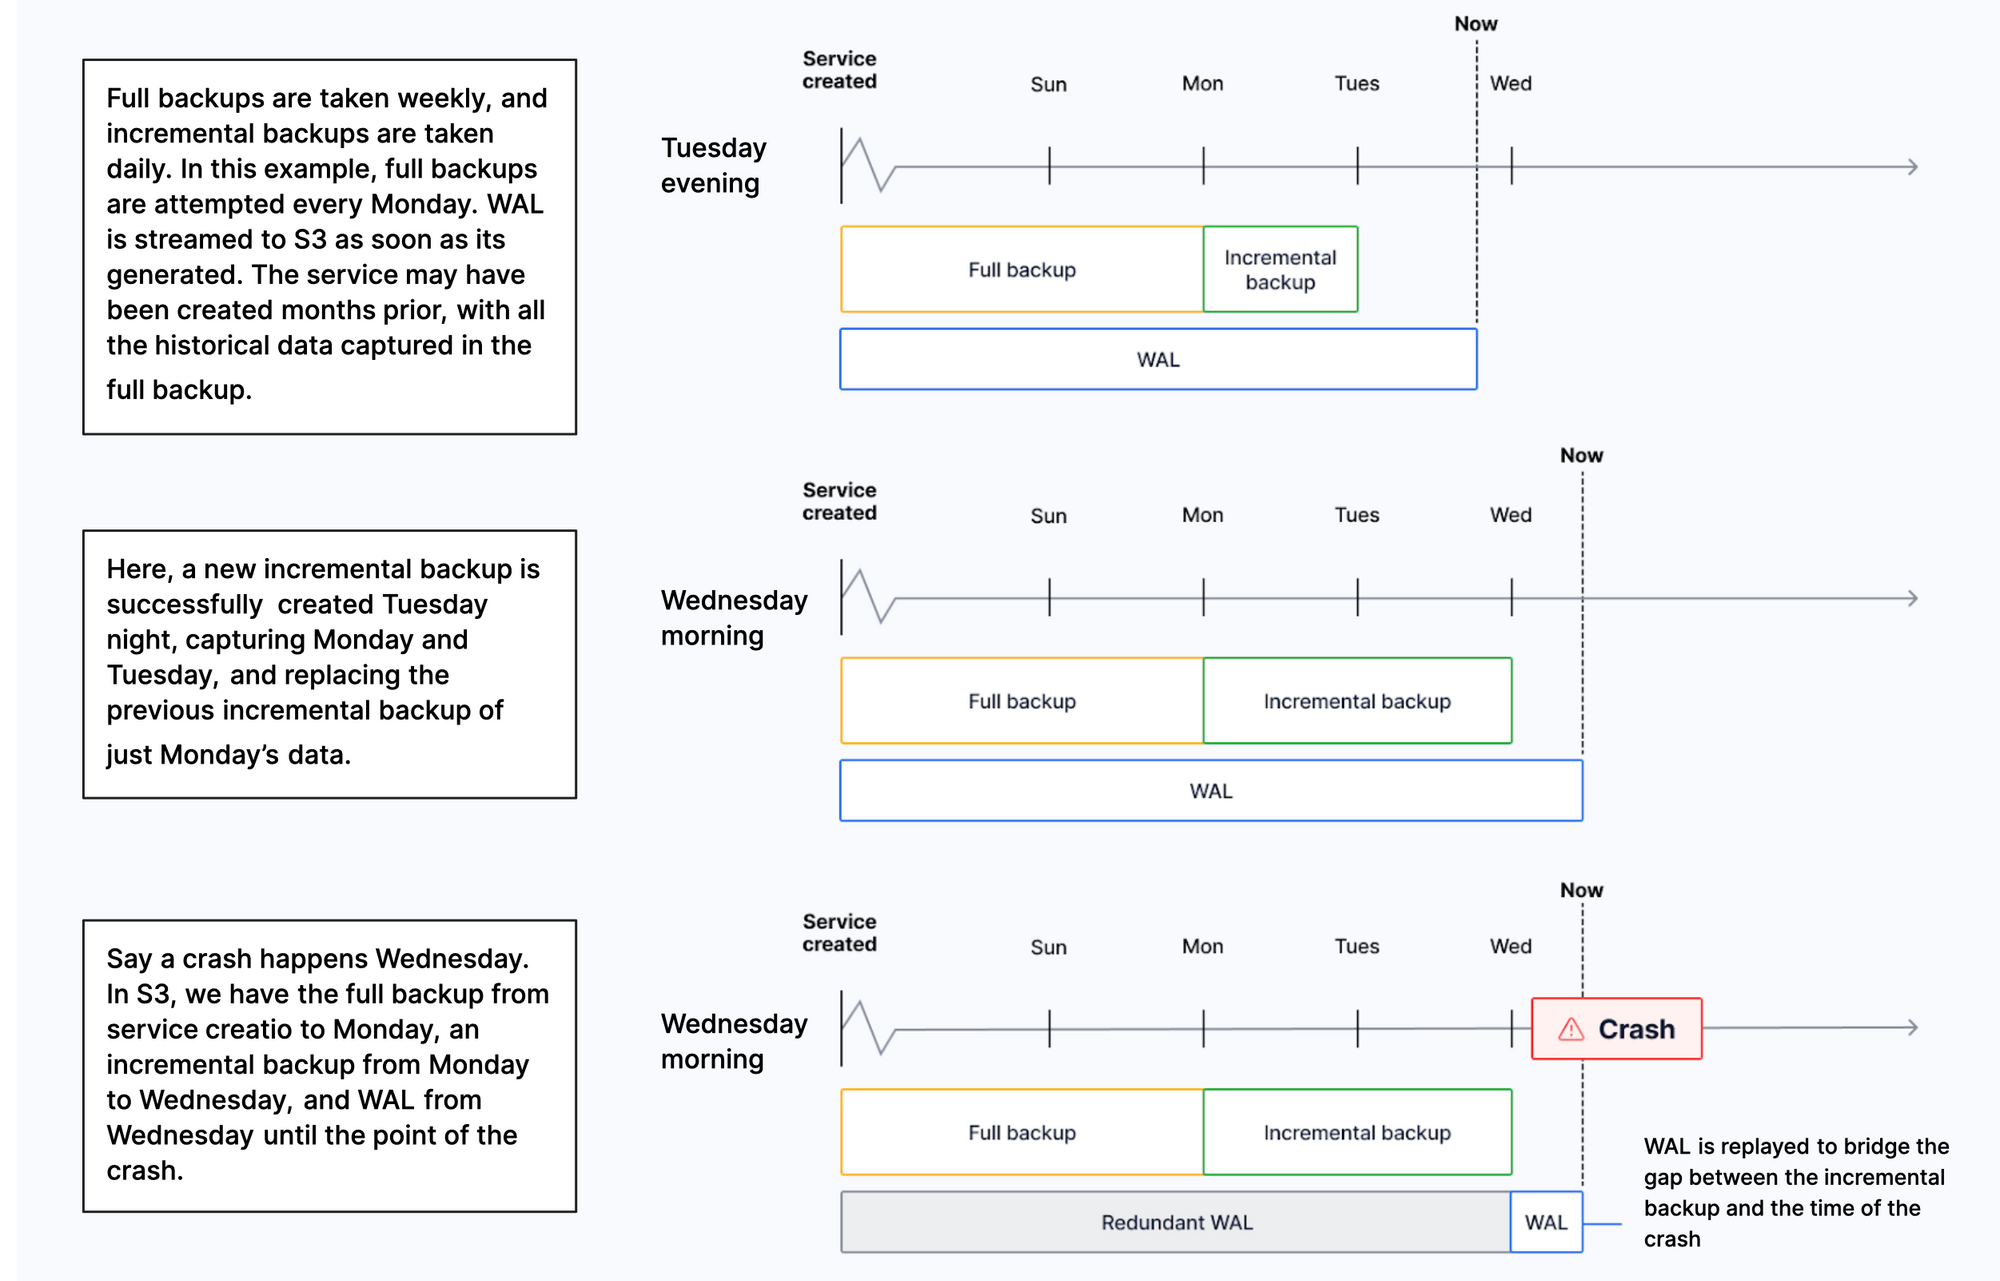
On Scale and Performance pricing plans, you can check the list of backups for the previous 14 days in Tiger Cloud Console. To do so, select your service, then click Operations > Backup and restore > Backup history.
In the event of a storage failure, a service automatically recovers from a backup to the point of failure. If the whole availability zone goes down, your Tiger Cloud services are recovered in a different zone. In the event of a user error, you can create a point-in-time recovery fork.
Enable cross-region backup
For added reliability, you can enable cross-region backup. This protects your data when an entire AWS region goes down. In this case, you have two identical backups of your service at any time, but one of them is in a different AWS region. Cross-region backups are updated daily and weekly in the same way as a regular backup. You can have one cross-region backup for a service.
You enable cross-region backup when you create a service, or configure it for an existing service in Tiger Cloud Console:
In Console, select your service and click
Operations>Backup & restore.In
Cross-region backup, select the region in the dropdown and clickEnable backup.
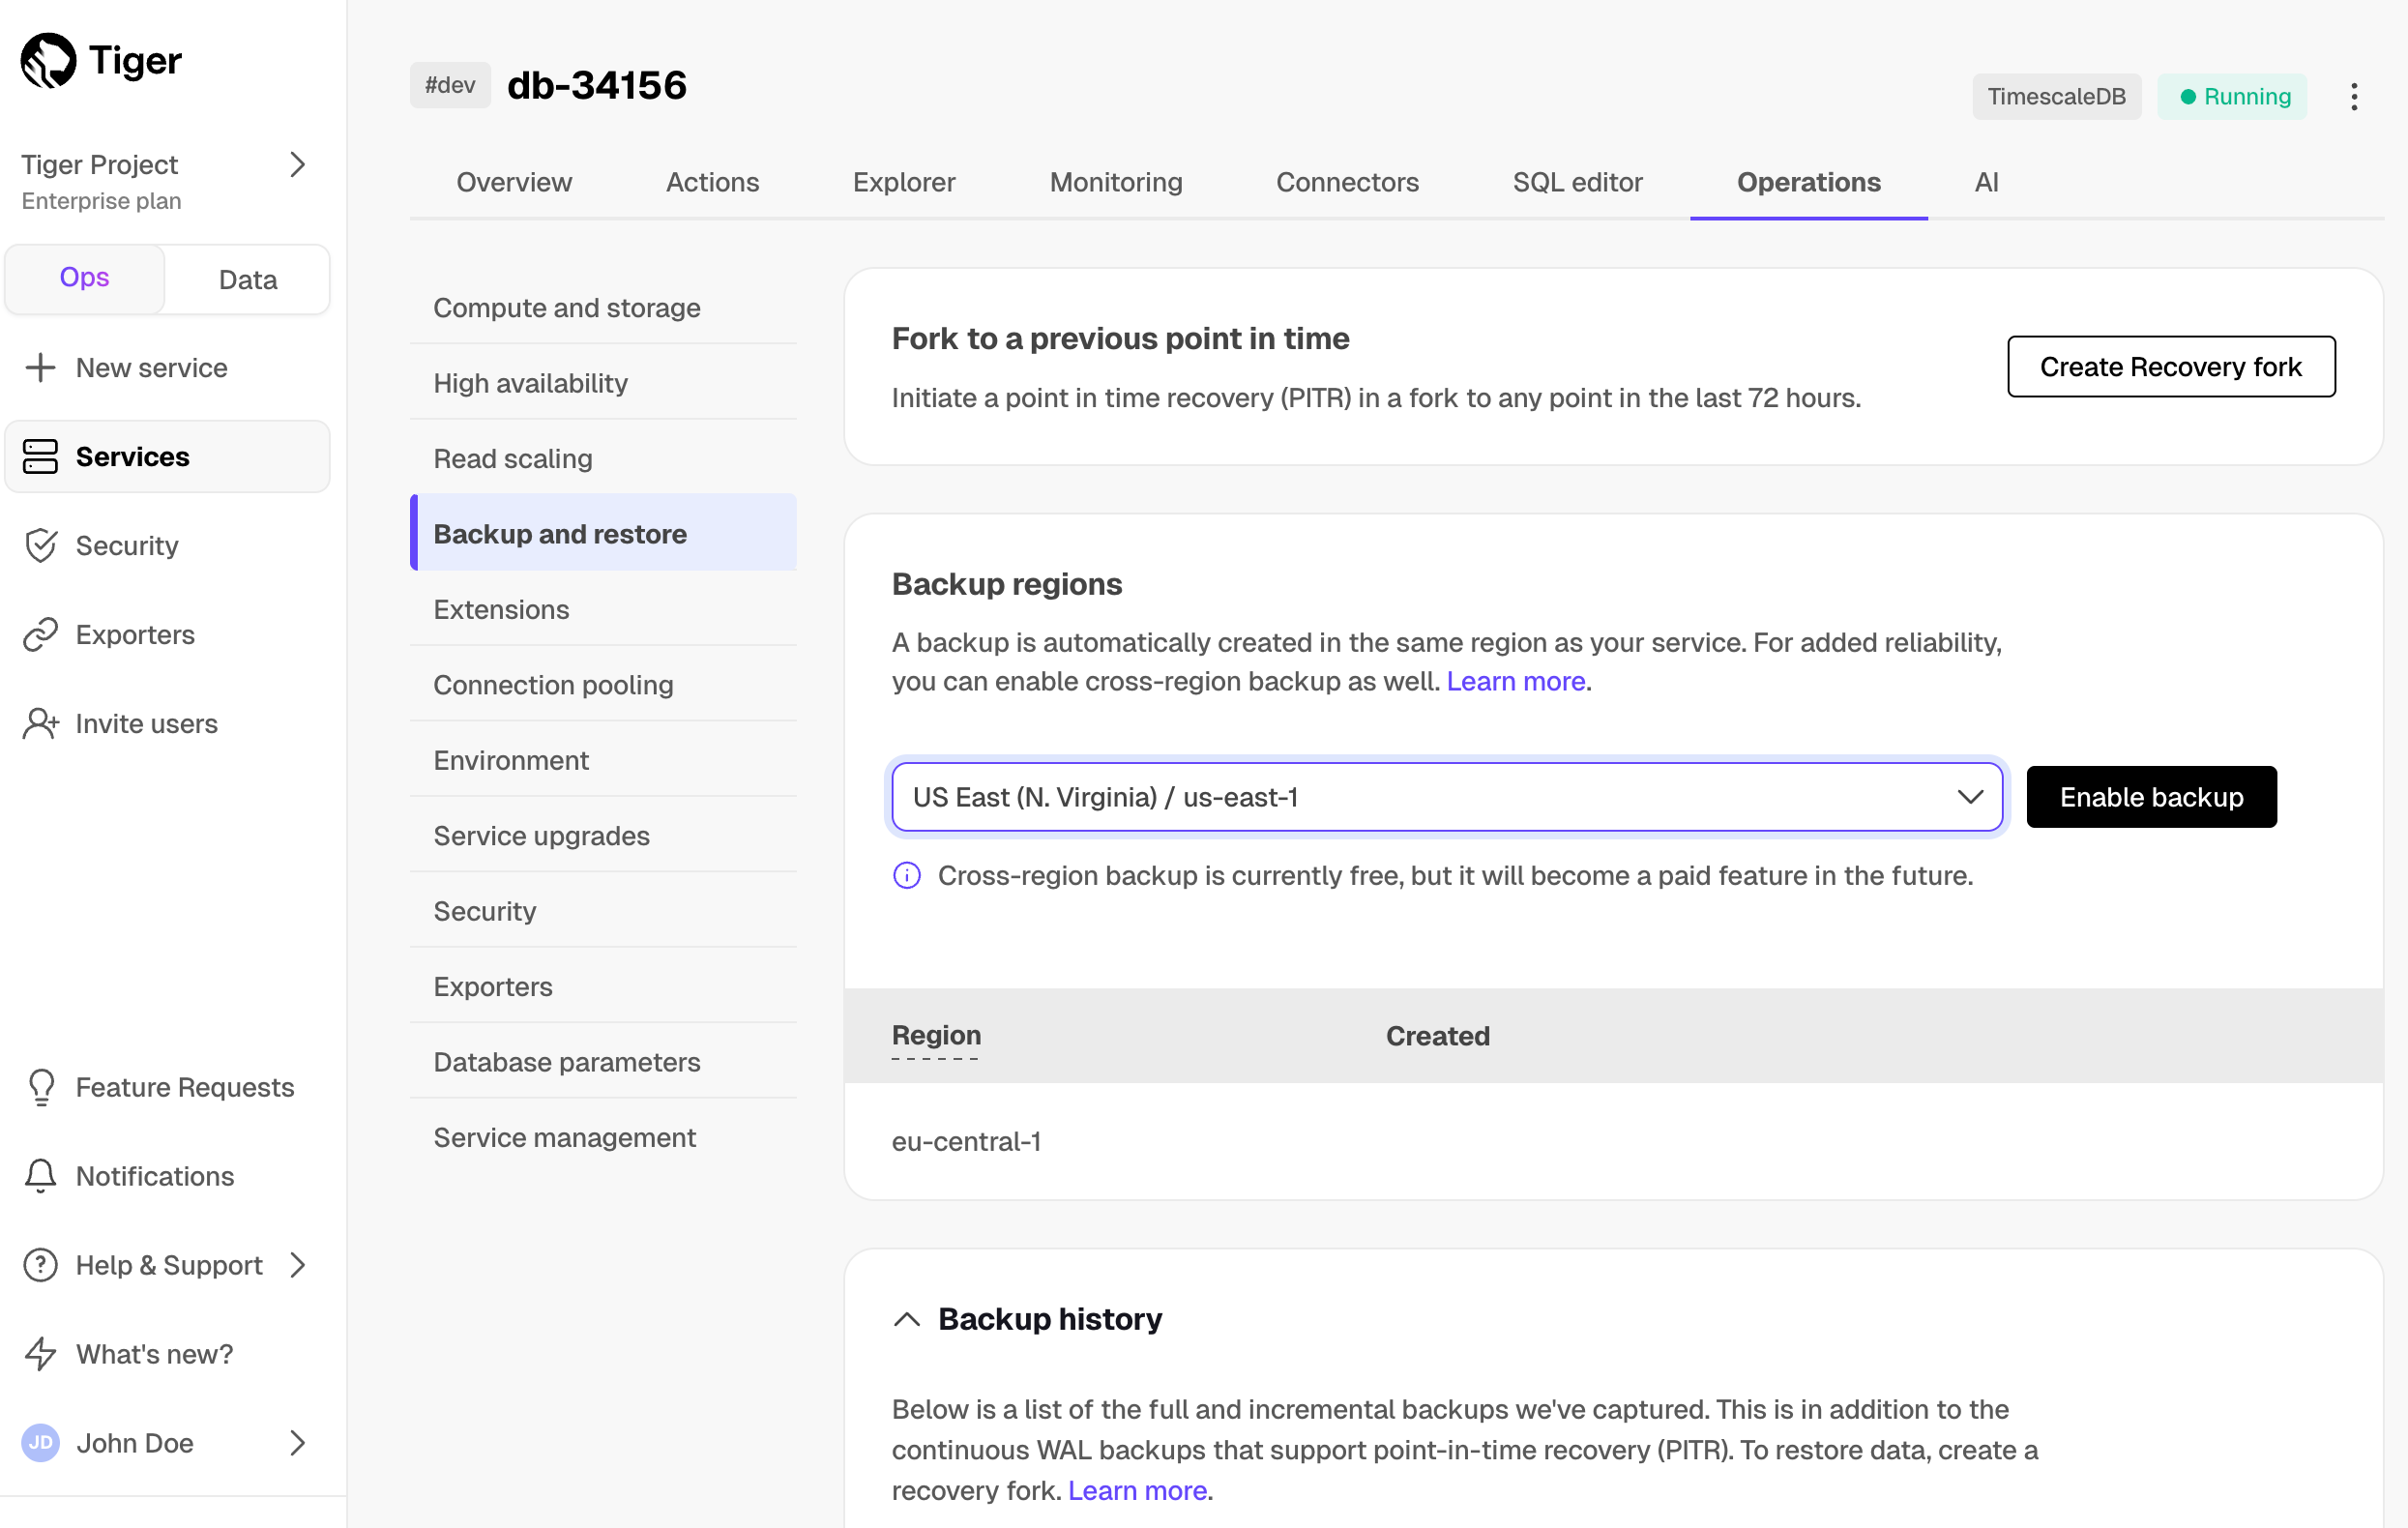
You can now see the backup, its region, and creation date in a list.
You can have one cross-region backup per service. To change the region of your backup:
In Console, select your service and click
Operations>Backup & restore.Click the trash icon next to the existing backup to disable it.
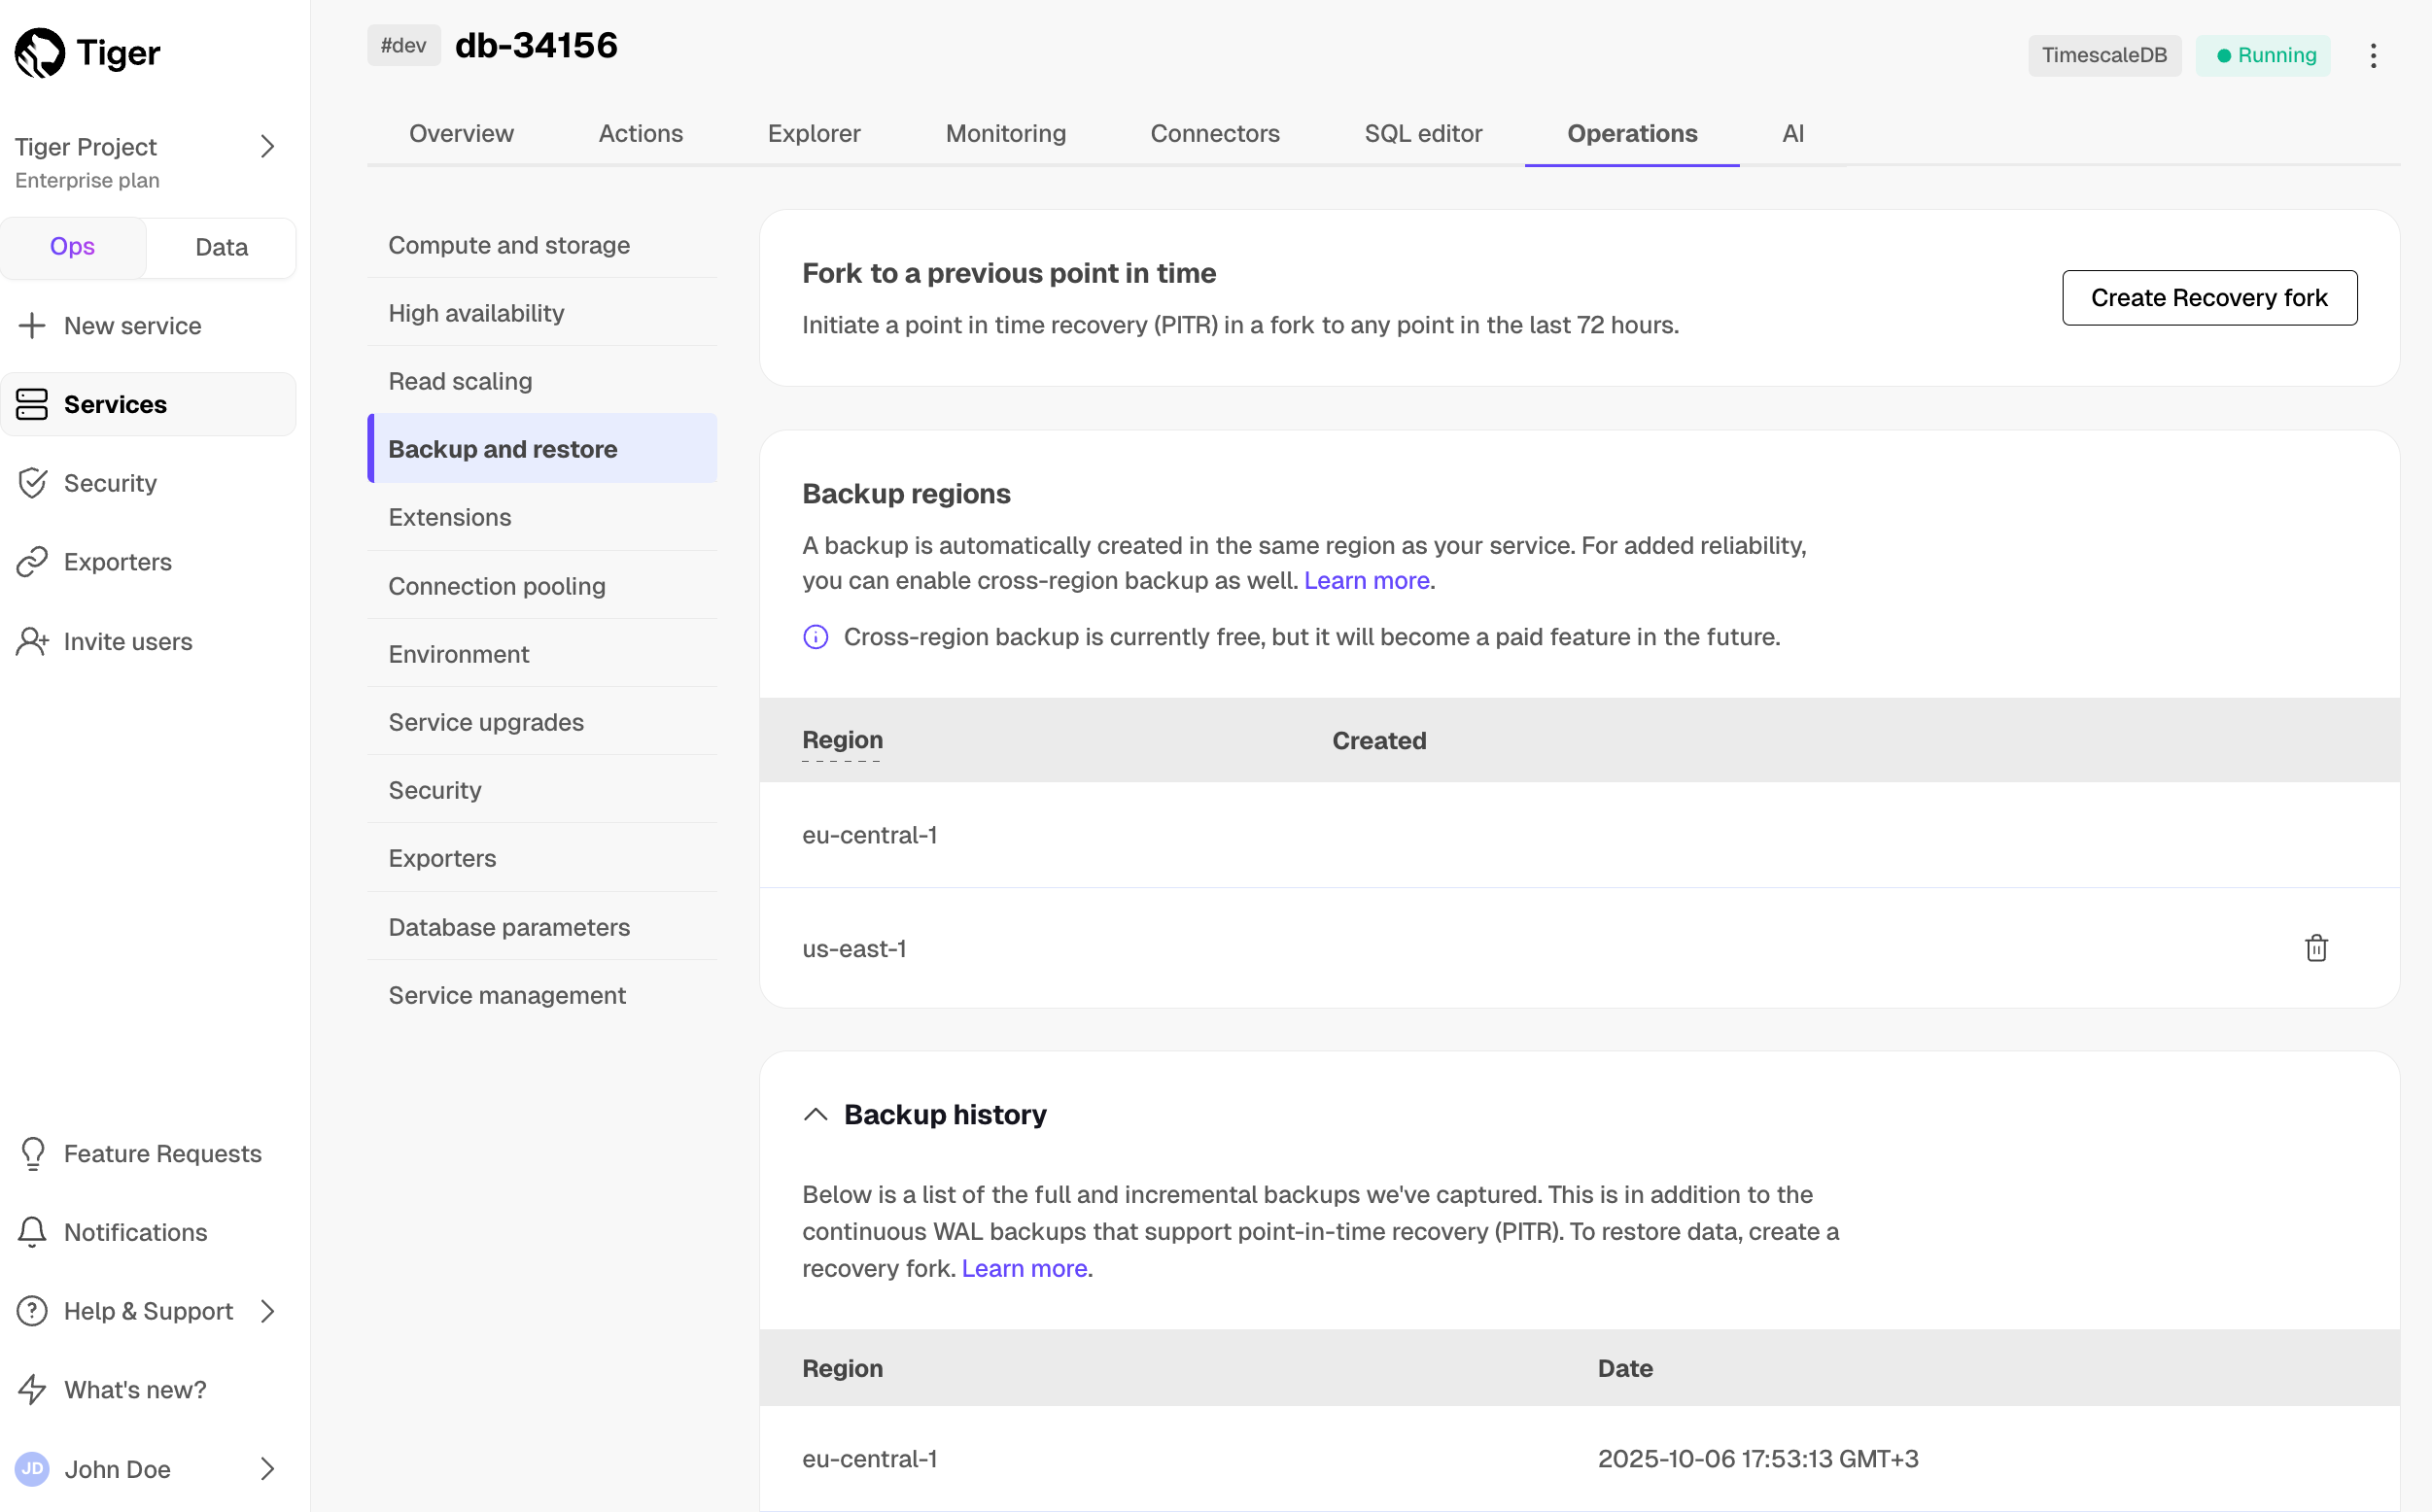
- Create a new backup in a different region.
Create a point-in-time recovery fork
To recover your service from a destructive or unwanted action, create a point-in-time recovery fork. You can recover a service to any point within the period defined by your pricing plan. The provision time for the recovery fork is typically less than twenty minutes, but can take longer depending on the amount of WAL to be replayed. The original service stays untouched to avoid losing data created since the time of recovery.
All tiered data remains recoverable during the PITR period. When restoring to any point-in-time recovery fork, your service contains all data that existed at that moment - whether it was stored in high-performance or low-cost storage.
When you restore a recovery fork:
- Data restored from a PITR point is placed into high-performance storage
- The tiered data, as of that point in time, remains in tiered storage
To avoid paying for compute for the recovery fork and the original service, pause the original to only pay storage costs.
You initiate a point-in-time recovery from a same-region or cross-region backup in Tiger Cloud Console:
- In Tiger Cloud Console, from the
Serviceslist, ensure the service you want to recover has a status ofRunningorPaused. - Navigate to
Operations>Service managementand clickCreate recovery fork. - Select the recovery point, ensuring the correct time zone (UTC offset).
Configure the fork.
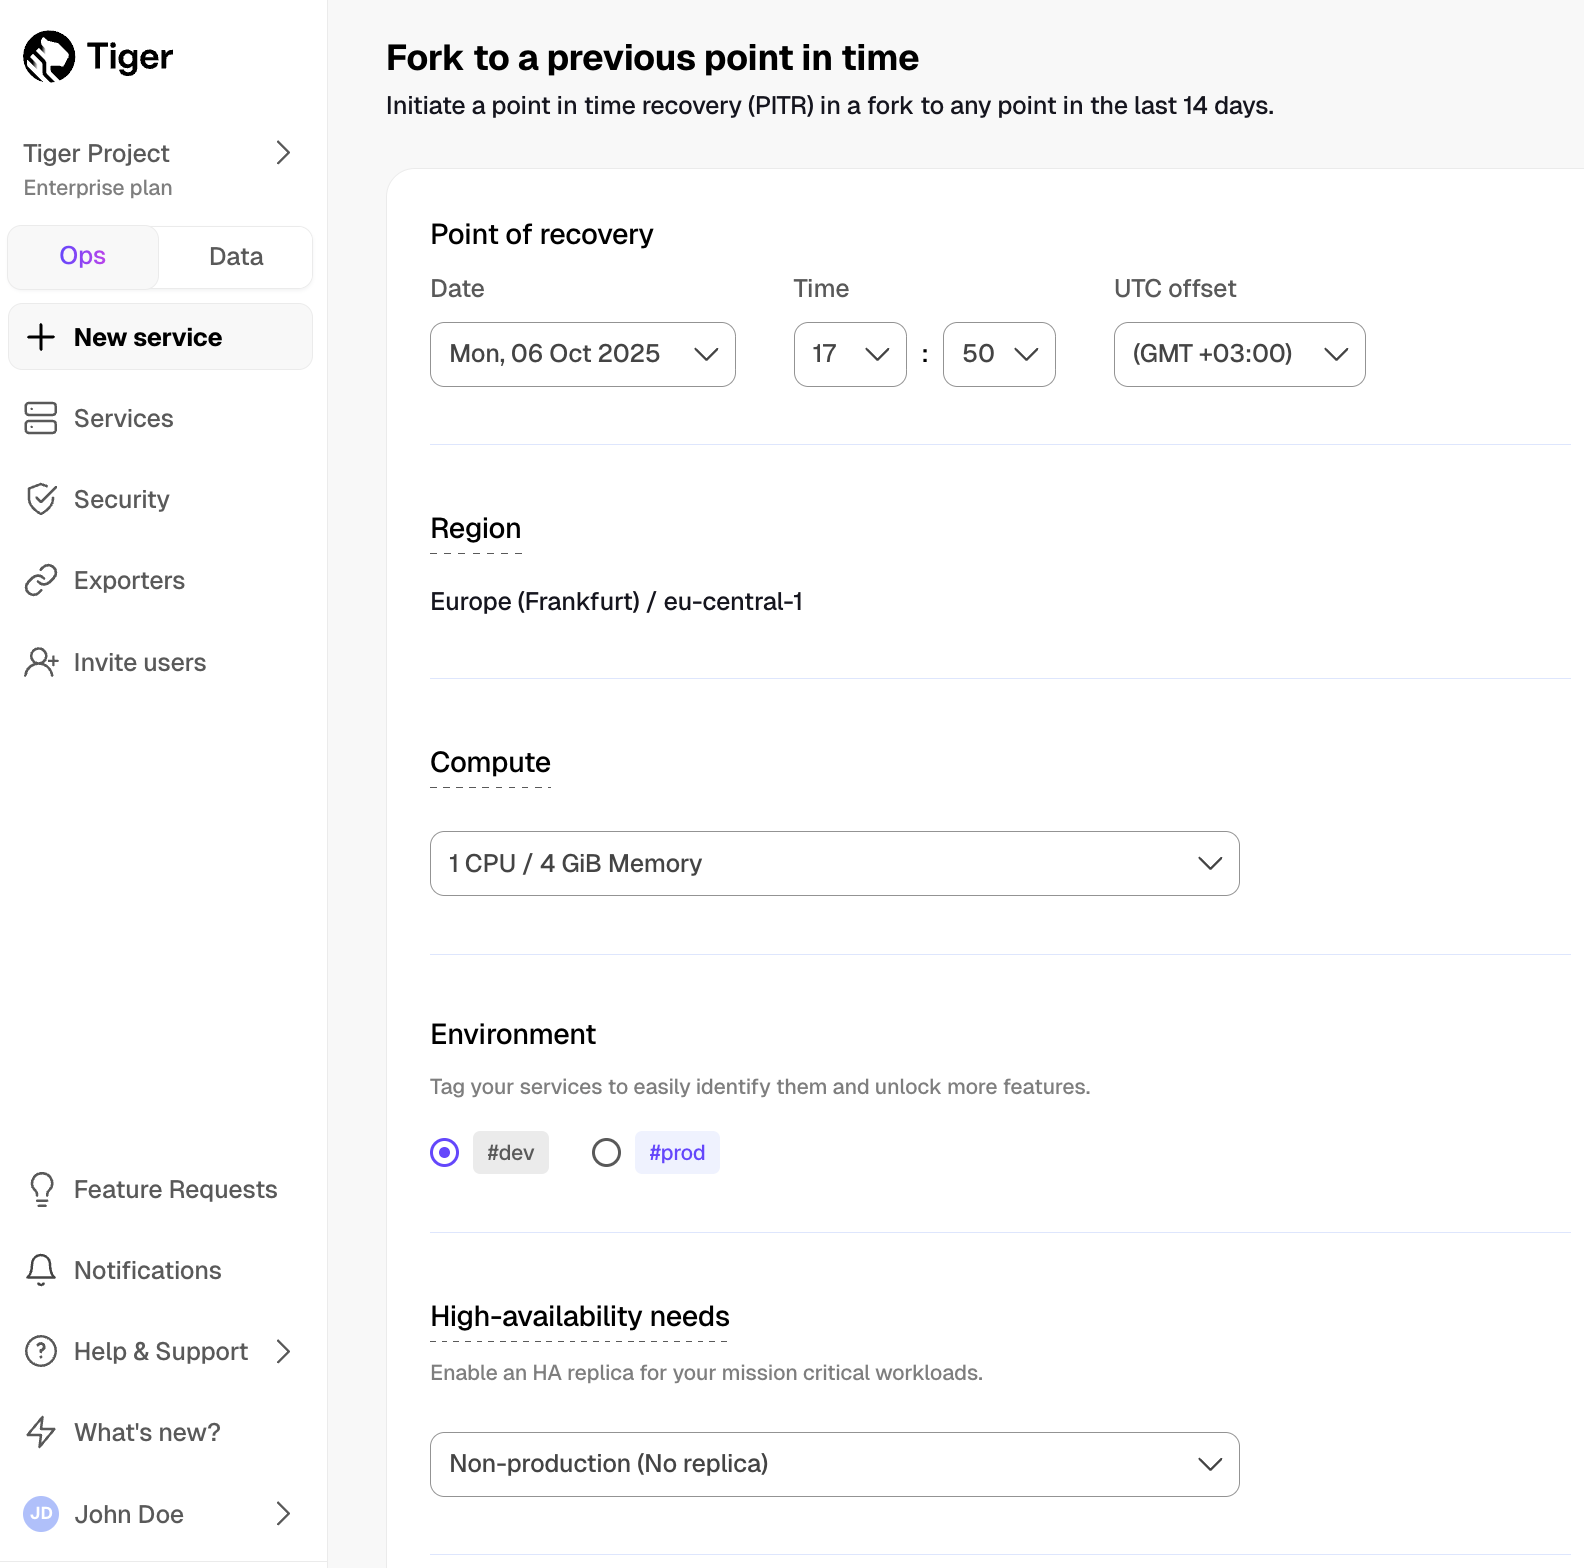
You can configure the compute resources, add an HA replica, tag your fork, and add a connection pooler. Best practice is to match the same configuration you had at the point you want to recover to.
Confirm by clicking
Create recovery fork.A fork of the service is created. The recovered service shows in
Serviceswith a label specifying which service it has been forked from.Update the connection strings in your app
Since the point-in-time recovery is done in a fork, to migrate your application to the point of recovery, change the connection strings in your application to use the fork.
Contact us, and we will assist in recovering your service.
Create a service fork
To manage development forks:
- Install Tiger CLI
Use the terminal to install the CLI:
```shell
curl -s https://packagecloud.io/install/repositories/timescale/tiger-cli/script.deb.sh | sudo os=any dist=any bash
sudo apt-get install tiger-cli
```
```shell
curl -s https://packagecloud.io/install/repositories/timescale/tiger-cli/script.deb.sh | sudo os=any dist=any bash
sudo apt-get install tiger-cli
```
```shell
curl -s https://packagecloud.io/install/repositories/timescale/tiger-cli/script.rpm.sh | sudo os=rpm_any dist=rpm_any bash
sudo yum install tiger-cli
```
```shell
curl -s https://packagecloud.io/install/repositories/timescale/tiger-cli/script.rpm.sh | sudo os=rpm_any dist=rpm_any bash
sudo yum install tiger-cli
```
```shell
brew install --cask timescale/tap/tiger-cli
```
```shell
curl -fsSL https://cli.tigerdata.com | sh
```
Set up API credentials
Log Tiger CLI into your Tiger Data account:
tiger auth login
Tiger CLI opens Console in your browser. Log in, then click
Authorize.You can have a maximum of 10 active client credentials. If you get an error, open credentials and delete an unused credential.
Select a Tiger Cloud project:
Auth URL is: https://console.cloud.timescale.com/oauth/authorize?client_id=lotsOfURLstuff Opening browser for authentication... Select a project: > 1. Tiger Project (tgrproject) 2. YourCompany (Company wide project) (cpnproject) 3. YourCompany Department (dptproject) Use ↑/↓ arrows or number keys to navigate, enter to select, q to quit
If only one project is associated with your account, this step is not shown.
Where possible, Tiger CLI stores your authentication information in the system keychain/credential manager. If that fails, the credentials are stored in
~/.config/tiger/credentialswith restricted file permissions (600). By default, Tiger CLI stores your configuration in~/.config/tiger/config.yaml.Test your authenticated connection to Tiger Cloud by listing services
tiger service list
This call returns something like:
- No services:
```terminaloutput
🏜️ No services found! Your project is looking a bit empty.
🚀 Ready to get started? Create your first service with: tiger service create
```
- One or more services:
```terminaloutput
┌────────────┬─────────────────────┬────────┬─────────────┬──────────────┬──────────────────┐
│ SERVICE ID │ NAME │ STATUS │ TYPE │ REGION │ CREATED │
├────────────┼─────────────────────┼────────┼─────────────┼──────────────┼──────────────────┤
│ tgrservice │ tiger-agent-service │ READY │ TIMESCALEDB │ eu-central-1 │ 2025-09-25 16:09 │
└────────────┴─────────────────────┴────────┴─────────────┴──────────────┴──────────────────┘
```
Fork the service
tiger service fork tgrservice --now --no-wait --name bob
By default a fork matches the resource of the parent Tiger Cloud services. For paid plans specify --cpu and/or --memory for dedicated resources.
You see something like:
```terminaloutput
🍴 Forking service 'tgrservice' to create 'bob' at current state...
✅ Fork request accepted!
📋 New Service ID: <service_id>
🔐 Password saved to system keyring for automatic authentication
🎯 Set service '<service_id>' as default service.
⏳ Service is being forked. Use 'tiger service list' to check status.
┌───────────────────┬──────────────────────────────────────────────────────────────────────────────────────────────────┐
│ PROPERTY │ VALUE │
├───────────────────┼──────────────────────────────────────────────────────────────────────────────────────────────────┤
│ Service ID │ <service_id> │
│ Name │ bob │
│ Status │ │
│ Type │ TIMESCALEDB │
│ Region │ eu-central-1 │
│ CPU │ 0.5 cores (500m) │
│ Memory │ 2 GB │
│ Direct Endpoint │ <service-id>.<project-id>.tsdb.cloud.timescale.com:<port> │
│ Created │ 2025-10-08 13:58:07 UTC │
│ Connection String │ postgresql://tsdbadmin@<service-id>.<project-id>.tsdb.cloud.timescale.com:<port>/tsdb?sslmode=require │
└───────────────────┴──────────────────────────────────────────────────────────────────────────────────────────────────┘
1. **When you are done, delete your forked service**
1. Use the CLI to request service delete:
```shell
tiger service delete <service_id>
```
1. Validate the service delete:
```terminaloutput
Are you sure you want to delete service '<service_id>'? This operation cannot be undone.
Type the service ID '<service_id>' to confirm:
<service_id>
```
You see something like:
```terminaloutput
🗑️ Delete request accepted for service '<service_id>'.
✅ Service '<service_id>' has been successfully deleted.
```
===== PAGE: https://docs.tigerdata.com/use-timescale/fork-services/ =====
# Fork services
Modern development is highly iterative. Developers and AI agents need safe spaces to test changes before deploying them
to production. Forkable services make this natural and easy. Spin up a branch, run your test, throw it away, or
merge it back.
A fork is an exact copy of a service at a specific point in time, with its own independent data and configuration,
including:
- The database data and schema
- Configuration
- An admin `tsdbadmin` user with a new password
Forks are fully independent. Changes to the fork don't affect the parent service. You can query
them, run migrations, add indexes, or test new features against the fork without affecting the original service.
Forks are a powerful way to share production-scale data safely. Testing, BI and data science teams often need access
to real datasets to build models or generate insights. With forkable services, you easily create fast, zero-copy
branches of a production service that are isolated from production, but contain all the data needed for
analysis. Rapid fork creation dramatically reduces friction getting insights from live data.
## Understand service forks
You can use service forks for disaster recovery, CI/CD automation, and testing and development. For example, you
can automatically test a major Postgres upgrade on a fork before applying it to your production service.
Tiger Cloud offers the following fork strategies:
- `now`: create a fresh fork of your database at the current time.
Use when:
- You need the absolute latest data
- Recent changes must be included in the fork
- `last-snapshot`: fork from the most recent [automatic backup or snapshot][automatic-backups].
Use when:
- You want the fastest possible fork creation
- Slightly behind current data is acceptable
- `timestamp`: fork from a specific point in time within your [retention period][pricing].
Use when:
- Disaster recovery from a known-good state
- Investigating issues that occurred at a specific time
- Testing "what-if" scenarios from historical data
The retention period for point-in-time recovery and forking depends on your [pricing plan][pricing-plan-features].
### Fork creation speed
Fork creation speed depends on your type of service you want to create:
- Free: ~30-90 seconds. Uses a Copy-on-Write storage architecture with zero-copy between a fork and the parent.
- Paid: varies with the size of your service, typically 5-20+ minutes. Uses tradional storage architecture
with backup restore + WAL replay.
### Billing
You can fork a free service to a free or a paid service. However, you cannot fork a paid
service to a free service.
Billing on storage works in the following way:
- High-performance storage:
- Copy-on-Write: you are only billed for storage for the chunks that diverge from the parent service.
- Traditional: you are billed for storage for the whole service.
- Object storage tier:
- [Tiered data][data-tiering] is shared across forks using copy-on-write and traditional storage:
- Chunks in tiered storage are only billed once, regardless of the number of forks
- Only new or modified chunks in a fork incur additional costs
For details, see [Replicas and forks with tiered data][tiered-forks].
## Prerequisites
To follow the steps on this page:
* Create a target [Tiger Cloud service][create-service] with the Real-time analytics capability.
You need [your connection details][connection-info]. This procedure also
works for [self-hosted TimescaleDB][enable-timescaledb].
## Manage forks using Tiger CLI
To manage development forks:
1. **Install Tiger CLI**
Use the terminal to install the CLI:
```shell
curl -s https://packagecloud.io/install/repositories/timescale/tiger-cli/script.deb.sh | sudo os=any dist=any bash
sudo apt-get install tiger-cli
```
```shell
curl -s https://packagecloud.io/install/repositories/timescale/tiger-cli/script.deb.sh | sudo os=any dist=any bash
sudo apt-get install tiger-cli
```
```shell
curl -s https://packagecloud.io/install/repositories/timescale/tiger-cli/script.rpm.sh | sudo os=rpm_any dist=rpm_any bash
sudo yum install tiger-cli
```
```shell
curl -s https://packagecloud.io/install/repositories/timescale/tiger-cli/script.rpm.sh | sudo os=rpm_any dist=rpm_any bash
sudo yum install tiger-cli
```
```shell
brew install --cask timescale/tap/tiger-cli
```
```shell
curl -fsSL https://cli.tigerdata.com | sh
```
1. **Set up API credentials**
1. Log Tiger CLI into your Tiger Data account:
```shell
tiger auth login
```
Tiger CLI opens Console in your browser. Log in, then click `Authorize`.
You can have a maximum of 10 active client credentials. If you get an error, open [credentials][rest-api-credentials]
and delete an unused credential.
1. Select a Tiger Cloud project:
```terminaloutput
Auth URL is: https://console.cloud.timescale.com/oauth/authorize?client_id=lotsOfURLstuff
Opening browser for authentication...
Select a project:
> 1. Tiger Project (tgrproject)
2. YourCompany (Company wide project) (cpnproject)
3. YourCompany Department (dptproject)
Use ↑/↓ arrows or number keys to navigate, enter to select, q to quit
```
If only one project is associated with your account, this step is not shown.
Where possible, Tiger CLI stores your authentication information in the system keychain/credential manager.
If that fails, the credentials are stored in `~/.config/tiger/credentials` with restricted file permissions (600).
By default, Tiger CLI stores your configuration in `~/.config/tiger/config.yaml`.
1. **Test your authenticated connection to Tiger Cloud by listing services**
```bash
tiger service list
```
This call returns something like:
- No services:
```terminaloutput
🏜️ No services found! Your project is looking a bit empty.
🚀 Ready to get started? Create your first service with: tiger service create
```
- One or more services:
```terminaloutput
┌────────────┬─────────────────────┬────────┬─────────────┬──────────────┬──────────────────┐
│ SERVICE ID │ NAME │ STATUS │ TYPE │ REGION │ CREATED │
├────────────┼─────────────────────┼────────┼─────────────┼──────────────┼──────────────────┤
│ tgrservice │ tiger-agent-service │ READY │ TIMESCALEDB │ eu-central-1 │ 2025-09-25 16:09 │
└────────────┴─────────────────────┴────────┴─────────────┴──────────────┴──────────────────┘
```
1. **Fork the service**
shell
tiger service fork tgrservice --now --no-wait --name bob
By default a fork matches the resource of the parent Tiger Cloud services. For paid plans specify `--cpu` and/or `--memory` for dedicated resources.
You see something like:
```terminaloutput
🍴 Forking service 'tgrservice' to create 'bob' at current state...
✅ Fork request accepted!
📋 New Service ID: <service_id>
🔐 Password saved to system keyring for automatic authentication
🎯 Set service '<service_id>' as default service.
⏳ Service is being forked. Use 'tiger service list' to check status.
┌───────────────────┬──────────────────────────────────────────────────────────────────────────────────────────────────┐
│ PROPERTY │ VALUE │
├───────────────────┼──────────────────────────────────────────────────────────────────────────────────────────────────┤
│ Service ID │ <service_id> │
│ Name │ bob │
│ Status │ │
│ Type │ TIMESCALEDB │
│ Region │ eu-central-1 │
│ CPU │ 0.5 cores (500m) │
│ Memory │ 2 GB │
│ Direct Endpoint │ <service-id>.<project-id>.tsdb.cloud.timescale.com:<port> │
│ Created │ 2025-10-08 13:58:07 UTC │
│ Connection String │ postgresql://tsdbadmin@<service-id>.<project-id>.tsdb.cloud.timescale.com:<port>/tsdb?sslmode=require │
└───────────────────┴──────────────────────────────────────────────────────────────────────────────────────────────────┘
When you are done, delete your forked service
Use the CLI to request service delete:
tiger service delete <service_id>Validate the service delete:
Are you sure you want to delete service '<service_id>'? This operation cannot be undone. Type the service ID '<service_id>' to confirm: <service_id>
You see something like:
```terminaloutput 🗑️ Delete request accepted for service '<service_id>'. ✅ Service '<service_id>' has been successfully deleted. ```
Manage forks using Console
To manage development forks:
- In Tiger Cloud Console, from the
Serviceslist, ensure the service you want to recover has a status ofRunningorPaused. - Navigate to
Operations>Service Managementand clickFork service. Configure the fork, then click
Fork service.A fork of the service is created. The forked service shows in
Serviceswith a label specifying which service it has been forked from.
Update the connection strings in your app to use the fork.
Integrate service forks in your CI/CD pipeline
To fork your Tiger Cloud service using GitHub actions:
Store your Tiger Cloud API key as a GitHub Actions secret
- In Tiger Cloud Console, click
Create credentials. - Save the
Public keyandSecret keylocally, then clickDone. - In your GitHub repository, click
Settings, openSecrets and variables, then clickActions. - Click
New repository secret, then setNametoTIGERDATA_API_KEY - Set
Secretto your Tiger Cloud API key in the following format<Public key>:<Secret key>, then clickAdd secret.
- In Tiger Cloud Console, click
Add the GitHub Actions Marketplace to your workflow YAML files
For example, the following workflow forks a service when a pull request is opened, running tests against the fork, then automatically cleans up.
```yaml
name: Test on a service fork
on: pull_request
jobs:
test:
runs-on: ubuntu-latest
steps:
- uses: actions/checkout@v4
- name: Fork Database
id: fork
uses: timescale/fork-service@v1
with:
project_id: ${{ secrets.TIGERDATA_PROJECT_ID }}
service_id: ${{ secrets.TIGERDATA_SERVICE_ID }}
api_key: ${{ secrets.TIGERDATA_API_KEY }}
fork_strategy: last-snapshot
cleanup: true
name: pr-${{ github.event.pull_request.number }}
- name: Run Integration Tests
env:
DATABASE_URL: postgresql://tsdbadmin:${{ steps.fork.outputs.initial_password }}@${{ steps.fork.outputs.host }}:${{ steps.fork.outputs.port }}/tsdb?sslmode=require
run: |
npm install
npm test
- name: Run Migrations
env:
DATABASE_URL: postgresql://tsdbadmin:${{ steps.fork.outputs.initial_password }}@${{ steps.fork.outputs.host }}:${{ steps.fork.outputs.port }}/tsdb?sslmode=require
run: npm run migrate
```
For the full list of inputs, outputs, and configuration options, see the [Tiger Data - Fork Service][github-action] in GitHub marketplace.
===== PAGE: https://docs.tigerdata.com/use-timescale/jobs/ =====
Jobs in TimescaleDB
TimescaleDB natively includes some job-scheduling policies, such as:
- Continuous aggregate policies to automatically refresh continuous aggregates
- Hypercore policies to optimize and compress historical data
- Retention policies to drop historical data
- Reordering policies to reorder data within chunks
If these don't cover your use case, you can create and schedule custom-defined jobs to run within your database. They help you automate periodic tasks that aren't covered by the native policies.
In this section, you see how to:
- Create and manage jobs
- Set up a generic data retention policy that applies across all hypertables
- Implement automatic moving of chunks between tablespaces
- Automatically downsample and compress older chunks
===== PAGE: https://docs.tigerdata.com/use-timescale/security/ =====
Security
Learn how Tiger Cloud protects your data and privacy.
- Learn about security in Tiger Cloud
- Restrict access to your project
- Restrict access to the data in your service
- Set up multifactor and SAML authentication
- Generate multiple client credentials instead of using your username and password
- Connect with a stricter SSL mode
- Secure your services with VPC peering
- Connect to your services from any cloud with AWS Transit Gateway
- Restrict access with an IP address allow list
===== PAGE: https://docs.tigerdata.com/use-timescale/limitations/ =====
Limitations
While TimescaleDB generally offers capabilities that go beyond what Postgres offers, there are some limitations to using hypertables.
Hypertable limitations
- Time dimensions (columns) used for partitioning cannot have NULL values.
- Unique indexes must include all columns that are partitioning dimensions.
UPDATEstatements that move values between partitions (chunks) are not supported. This includes upserts (INSERT ... ON CONFLICT UPDATE).- Foreign key constraints from a hypertable referencing another hypertable are not supported.
===== PAGE: https://docs.tigerdata.com/use-timescale/tigerlake/ =====
Integrate data lakes with Tiger Cloud
Tiger Lake enables you to build real-time applications alongside efficient data pipeline management within a single system. Tiger Lake unifies the Tiger Cloud operational architecture with data lake architectures.

Tiger Lake is a native integration enabling synchronization between hypertables and relational tables running in Tiger Cloud services to Iceberg tables running in Amazon S3 Tables in your AWS account.
Tiger Lake is currently in private beta. Please contact us to request access.
Prerequisites
To follow the steps on this page:
- Create a target Tiger Cloud service with the Real-time analytics capability.
You need your connection details.
Integrate a data lake with your Tiger Cloud service
To connect a Tiger Cloud service to your data lake:
- Set the AWS region to host your table bucket
- In AWS CloudFormation, select the current AWS region at the top-right of the page.
- Set it to the Region you want to create your table bucket in.
This must match the region your Tiger Cloud service is running in: if the regions do not match AWS charges you for cross-region data transfer.
Create your CloudFormation stack
- Click
Create stack, then selectWith new resources (standard). In
Amazon S3 URL, paste the following URL, then clickNext.https://tigerlake.s3.us-east-1.amazonaws.com/tigerlake-connect-cloudformation.yamlIn
Specify stack details, enter the following details, then clickNext:Stack Name: a name for this CloudFormation stackBucketName: a name for this S3 table bucketProjectIDandServiceID: enter the connection details for your Tiger Lake service
In
Configure stack optionscheckI acknowledge that AWS CloudFormation might create IAM resources, then clickNext.In
Review and create, clickSubmit, then wait for the deployment to complete. AWS deploys your stack and creates the S3 table bucket and IAM role.Click
Outputs, then copy all four outputs.
- Click
Connect your service to the data lake
In Tiger Cloud Console, select the service you want to integrate with AWS S3 Tables, then click
Connectors.Select the Apache Iceberg connector and supply the:
- ARN of the S3Table bucket
- ARN of a role with permissions to write to the table bucket
Provisioning takes a couple of minutes.
- Create your CloudFormation stack
Replace the following values in the command, then run it from the terminal:
Region: region of the S3 table bucketStackName: the name for this CloudFormation stackBucketName: the name of the S3 table bucket to createProjectID: enter your Tiger Cloud service connection detailsServiceID: enter your Tiger Cloud service connection detailsaws cloudformation create-stack \ --capabilities CAPABILITY_IAM \ --template-url https://tigerlake.s3.us-east-1.amazonaws.com/tigerlake-connect-cloudformation.yaml \ --region <Region> \ --stack-name <StackName> \ --parameters \ ParameterKey=BucketName,ParameterValue="<BucketName>" \ ParameterKey=ProjectID,ParameterValue="<ProjectID>" \ ParameterKey=ServiceID,ParameterValue="<ServiceID>"
Setting up the integration through Tiger Cloud Console in Tiger Cloud, provides a convenient copy-paste option with the placeholders populated.
Connect your service to the data lake
In Tiger Cloud Console, select the service you want to integrate with AWS S3 Tables, then click
Connectors.Select the Apache Iceberg connector and supply the:
- ARN of the S3Table bucket
- ARN of a role with permissions to write to the table bucket
Provisioning takes a couple of minutes.
Create a S3 Bucket
- Set the AWS region to host your table bucket
- In Amazon S3 console, select the current AWS region at the top-right of the page.
- Set it to the Region your you want to create your table bucket in.
This must match the region your Tiger Cloud service is running in: if the regions do not match AWS charges you for cross-region data transfer.
- In the left navigation pane, click
Table buckets, then clickCreate table bucket. - Enter
Table bucket name, then clickCreate table bucket. - Copy the
Amazon Resource Name (ARN)for your table bucket.
- Set the AWS region to host your table bucket
Create an ARN role
- In IAM Dashboard, click
Rolesthen clickCreate role In
Select trusted entity, clickCustom trust policy, replace the Custom trust policy code block with the following:{ "Version": "2012-10-17", "Statement": [ { "Effect": "Allow", "Principal": { "AWS": "arn:aws:iam::142548018081:root" }, "Action": "sts:AssumeRole", "Condition": { "StringEquals": { "sts:ExternalId": "<ProjectID>/<ServiceID>" } } } ] }
"Principal": { "AWS": "arn:aws:iam::123456789012:root" }does not meanrootaccess. This delegatespermissions to the entire AWS account, not just the root user.Replace
<ProjectID>and<ServiceID>with the the connection details for your Tiger Lake service, then clickNext.In
Permissions policies. clickNext.In
Role details, enterRole name, then clickCreate role.In
Roles, select the role you just created, then clickAdd Permissions>Create inline policy.Select
JSONthen replace thePolicy editorcode block with the following:{ "Version": "2012-10-17", "Statement": [ { "Sid": "BucketOps", "Effect": "Allow", "Action": [ "s3tables:*" ], "Resource": "<S3TABLE_BUCKET_ARN>" }, { "Sid": "BucketTableOps", "Effect": "Allow", "Action": [ "s3tables:*" ], "Resource": "<S3TABLE_BUCKET_ARN>/table/*" } ] }Replace
<S3TABLE_BUCKET_ARN>with theAmazon Resource Name (ARN)for the table bucket you just created.Click
Next, then give the inline policy a name and clickCreate policy.
- In IAM Dashboard, click
Connect your service to the data lake
In Tiger Cloud Console, select the service you want to integrate with AWS S3 Tables, then click
Connectors.Select the Apache Iceberg connector and supply the:
- ARN of the S3Table bucket
- ARN of a role with permissions to write to the table bucket
Provisioning takes a couple of minutes.
Stream data from your Tiger Cloud service to your data lake
When you start streaming, all data in the table is synchronized to Iceberg. Records are imported in time order, from oldest to youngest. The write throughput is approximately 40.000 records / second. For larger tables, a full import can take some time.
For Iceberg to perform update or delete statements, your hypertable or relational table must have a primary key. This includes composite primary keys.
To stream data from a Postgres relational table, or a hypertable in your Tiger Cloud service to your data lake, run the following statement:
ALTER TABLE SET (
tigerlake.iceberg_sync = true | false,
tigerlake.iceberg_partitionby = '<partition_specification>',
tigerlake.iceberg_namespace = '<namespace>',
tigerlake.iceberg_table = ''
)
tigerlake.iceberg_sync:boolean, set totrueto start streaming, orfalseto stop the stream. A stream cannot resume after being stopped.tigerlake.iceberg_partitionby: optional property to define a partition specification in Iceberg. By default the Iceberg table is partitioned asday(<time-column of hypertable>). This default behavior is only applicable to hypertables. For more information, see partitioning.tigerlake.iceberg_namespace: optional property to set a namespace, the default istimescaledb.tigerlake.iceberg_table: optional property to specify a different table name. If no name is specified the Postgres table name is used.
Partitioning intervals
By default, the partition interval for an Iceberg table is one day(time-column) for a hypertable. Postgres table sync does not enable any partitioning in Iceberg for non-hypertables. You can set it using tigerlake.iceberg_partitionby. The following partition intervals and specifications are supported:
| Interval | Description | Source types |
|---|---|---|
hour |
Extract a date or timestamp day, as days from epoch. Epoch is 1970-01-01. | date, timestamp, timestamptz |
day |
Extract a date or timestamp day, as days from epoch. | date, timestamp, timestamptz |
month |
Extract a date or timestamp day, as days from epoch. | date, timestamp, timestamptz |
year |
Extract a date or timestamp day, as days from epoch. | date, timestamp, timestamptz |
truncate[W] |
Value truncated to width W, see options |
These partitions define the behavior using the Iceberg partition specification:
Sample code
The following samples show you how to tune data sync from a hypertable or a Postgres relational table to your data lake:
- Sync a hypertable with the default one-day partitioning interval on the
ts_columncolumn
To start syncing data from a hypertable to your data lake using the default one-day chunk interval as the partitioning scheme to the Iceberg table, run the following statement:
ALTER TABLE my_hypertable SET (tigerlake.iceberg_sync = true);
This is equivalent to day(ts_column).
- Specify a custom partitioning scheme for a hypertable
You use the tigerlake.iceberg_partitionby property to specify a different partitioning scheme for the Iceberg
table at sync start. For example, to enforce an hourly partition scheme from the chunks on ts_column on a
hypertable, run the following statement:
ALTER TABLE my_hypertable SET (
tigerlake.iceberg_sync = true,
tigerlake.iceberg_partitionby = 'hour(ts_column)'
);
- Set the partition to sync relational tables
Postgres relational tables do not forward a partitioning scheme to Iceberg, you must specify the partitioning scheme using
tigerlake.iceberg_partitionby when you start the sync. For example, for a standard Postgres table to sync to the Iceberg
table with daily partitioning , run the following statement:
ALTER TABLE my_postgres_table SET (
tigerlake.iceberg_sync = true,
tigerlake.iceberg_partitionby = 'day(timestamp_col)'
);
Stop sync to an Iceberg table for a hypertable or a Postgres relational table
ALTER TABLE my_hypertable SET (tigerlake.iceberg_sync = false);Update or add the partitioning scheme of an Iceberg table
To change the partitioning scheme of an Iceberg table, you specify the desired partitioning scheme using the tigerlake.iceberg_partitionby property.
For example. if the samples table has an hourly (hour(ts)) partition on the ts timestamp column,
to change to daily partitioning, call the following statement:
ALTER TABLE samples SET (tigerlake.iceberg_partitionby = 'day(ts)');
This statement is also correct for Iceberg tables without a partitioning scheme. When you change the partition, you do not have to pause the sync to Iceberg. Apache Iceberg handles the partitioning operation in function of the internal implementation.
Specify a different namespace
By default, tables are created in the the timescaledb namespace. To specify a different namespace when you start the sync, use the tigerlake.iceberg_namespace property. For example:
ALTER TABLE my_hypertable SET (
tigerlake.iceberg_sync = true,
tigerlake.iceberg_namespace = 'my_namespace'
);
Specify a different Iceberg table name
The table name in Iceberg is the same as the source table in Tiger Cloud.
Some services do not allow mixed case, or have other constraints for table names.
To define a different table name for the Iceberg table at sync start, use the tigerlake.iceberg_table property. For example:
ALTER TABLE Mixed_CASE_TableNAME SET (
tigerlake.iceberg_sync = true,
tigerlake.iceberg_table = 'my_table_name'
);
Limitations
- Service requires Postgres 17.6 and above is supported.
- Consistent ingestion rates of over 30000 records / second can lead to a lost replication slot. Burst can be feathered out over time.
- Amazon S3 Tables Iceberg REST catalog only is supported.
- In order to collect deletes made to data in the columstore, certain columnstore optimizations are disabled for hypertables.
- Direct Compress is not supported.
- The
TRUNCATEstatement is not supported, and does not truncate data in the corresponding Iceberg table. - Data in a hypertable that has been moved to the low-cost object storage tier is not synced.
- Writing to the same S3 table bucket from multiple services is not supported, bucket-to-service mapping is one-to-one.
- Iceberg snapshots are pruned automatically if the amount exceeds 2500.
===== PAGE: https://docs.tigerdata.com/use-timescale/troubleshoot-timescaledb/ =====
Troubleshooting TimescaleDB
If you run into problems when using TimescaleDB, there are a few things that you can do. There are some solutions to common errors in this section as well as ways to output diagnostic information about your setup. If you need more guidance, you can join the community Slack group or post an issue on the TimescaleDB GitHub.
Common errors
Error updating TimescaleDB when using a third-party Postgres administration tool
The ALTER EXTENSION timescaledb UPDATE command must be the first
command executed upon connection to a database. Some administration tools
execute commands before this, which can disrupt the process. You might
need to manually update the database with psql. See the
update docs for details.
Log error: could not access file "timescaledb"
If your Postgres logs have this error preventing it from starting up, you
should double-check that the TimescaleDB files have been installed to the
correct location. The installation methods use pg_config to get Postgres's
location. However, if you have multiple versions of Postgres installed on the
same machine, the location pg_config points to may not be for the version you
expect. To check which version of TimescaleDB is used:
$ pg_config --version
PostgreSQL 12.3
If that is the correct version, double-check that the installation path is
the one you'd expect. For example, for Postgres 11.0 installed via
Homebrew on macOS it should be /usr/local/Cellar/postgresql/11.0/bin:
$ pg_config --bindir
/usr/local/Cellar/postgresql/11.0/bin
If either of those steps is not the version you are expecting, you need to
either uninstall the incorrect version of Postgres if you can, or update your
PATH environmental variable to have the correct path of pg_config listed
first, that is, by prepending the full path:
export PATH = /usr/local/Cellar/postgresql/11.0/bin:$PATH
Then, reinstall TimescaleDB and it should find the correct installation path.
ERROR: could not access file "timescaledb-<version>": No such file or directory
If the error occurs immediately after updating your version of TimescaleDB and
the file mentioned is from the previous version, it is probably due to an
incomplete update process. Within the greater Postgres server instance, each
database that has TimescaleDB installed needs to be updated with the SQL command
ALTER EXTENSION timescaledb UPDATE; while connected to that database.
Otherwise, the database looks for the previous version of the timescaledb files.
See our update docs for more info.
Scheduled jobs stop running
Your scheduled jobs might stop running for various reasons. On self-hosted TimescaleDB, you can fix this by restarting background workers:
SELECT _timescaledb_internal.restart_background_workers();
On Tiger Cloud and Managed Service for TimescaleDB, restart background workers by doing one of the following:
- Run
SELECT timescaledb_pre_restore(), followed bySELECT timescaledb_post_restore(). - Power the service off and on again. This might cause a downtime of a few minutes while the service restores from backup and replays the write-ahead log.
Failed to start a background worker
You might see this error message in the logs if background workers aren't properly configured:
"<TYPE_OF_BACKGROUND_JOB>": failed to start a background worker
To fix this error, make sure that max_worker_processes,
max_parallel_workers, and timescaledb.max_background_workers are properly
set. timescaledb.max_background_workers should equal the number of databases
plus the number of concurrent background workers. max_worker_processes should
equal the sum of timescaledb.max_background_workers and
max_parallel_workers.
For more information, see the worker configuration docs.
Cannot compress chunk
You might see this error message when trying to compress a chunk if the permissions for the compressed hypertable are corrupt.
tsdb=> SELECT compress_chunk('_timescaledb_internal._hyper_65_587239_chunk');
ERROR: role 149910 was concurrently dropped
This can be caused if you dropped a user for the hypertable before
TimescaleDB 2.5. For this case, the user would be removed from
pg_authid but not revoked from the compressed table.
As a result, the compressed table contains permission items that refer to numerical values rather than existing users (see below for how to find the compressed hypertable from a normal hypertable):
tsdb=> \dp _timescaledb_internal._compressed_hypertable_2
Access privileges
Schema | Name | Type | Access privileges | Column privileges | Policies
--------+--------------+-------+---------------------+-------------------+----------
public | transactions | table | mats=arwdDxt/mats +| |
| | | wizard=arwdDxt/mats+| |
| | | 149910=r/mats | |
(1 row)
This means that the relacl column of pg_class needs to be updated
and the offending user removed, but it is not possible to drop a user
by numerical value. Instead, you can use the internal function
repair_relation_acls in the _timescaledb_function schema:
tsdb=> CALL _timescaledb_functions.repair_relation_acls();
This requires superuser privileges (since you're modifying the
pg_class table) and that it removes any user not present in
pg_authid from all tables, so use with caution.
The permissions are usually corrupted for the hypertable as well, but
not always, so it is better to look at the compressed hypertable to
see if the problem is present. To find the compressed hypertable for
an associated hypertable (readings in this case):
tsdb=> select ht.table_name,
tsdb-> (select format('%I.%I', schema_name, table_name)::regclass
tsdb-> from _timescaledb_catalog.hypertable
tsdb-> where ht.compressed_hypertable_id = id) as compressed_table
tsdb-> from _timescaledb_catalog.hypertable ht
tsdb-> where table_name = 'readings';
format | format
----------+------------------------------------------------
readings | _timescaledb_internal._compressed_hypertable_2
(1 row)
Getting more information
EXPLAINing query performance
Postgres's EXPLAIN feature allows users to understand the underlying query plan that Postgres uses to execute a query. There are multiple ways that Postgres can execute a query: for example, a query might be fulfilled using a slow sequence scan or a much more efficient index scan. The choice of plan depends on what indexes are created on the table, the statistics that Postgres has about your data, and various planner settings. The EXPLAIN output let's you know which plan Postgres is choosing for a particular query. Postgres has a in-depth explanation of this feature.
To understand the query performance on a hypertable, we suggest first
making sure that the planner statistics and table maintenance is up-to-date on the hypertable
by running VACUUM ANALYZE <your-hypertable>;. Then, we suggest running the
following version of EXPLAIN:
EXPLAIN (ANALYZE on, BUFFERS on) <original query>;
If you suspect that your performance issues are due to slow IOs from disk, you
can get even more information by enabling the
track_io_timing variable with SET track_io_timing = 'on';
before running the above EXPLAIN.
Dump TimescaleDB meta data
To help when asking for support and reporting bugs,
TimescaleDB includes a SQL script that outputs metadata
from the internal TimescaleDB tables as well as version information.
The script is available in the source distribution in scripts/
but can also be downloaded separately.
To use it, run:
psql [your connect flags] -d your_timescale_db < dump_meta_data.sql > dumpfile.txt
and then inspect dump_file.txt before sending it together with a bug report or support question.
Debugging background jobs
By default, background workers do not print a lot of information about execution. The reason for this is to avoid writing a lot of debug information to the Postgres log unless necessary.
To aid in debugging the background jobs, it is possible to increase
the log level of the background workers without having to restart the
server by setting the timescaledb.bgw_log_level GUC and reloading
the configuration.
ALTER SYSTEM SET timescaledb.bgw_log_level TO 'DEBUG1';
SELECT pg_reload_conf();
This variable is set to the value of
log_min_messages by default, which typically is
WARNING. If the value of log_min_messages is
changed in the configuration file, it is used for
timescaledb.bgw_log_level when starting the workers.
Both ALTER SYSTEM and pg_reload_conf() require superuser
privileges by default. Grant EXECUTE permissions
to pg_reload_conf() and ALTER SYSTEM privileges to
timescaledb.bgw_log_level if you want this to work for a
non-superuser.
Since ALTER SYSTEM privileges only exist on Postgres 15 and later,
the necessary grants for executing these statements only exist on Tiger Cloud for Postgres 15 or later.
Debug level 1
The amount of information printed at each level varies between jobs,
but the information printed at DEBUG1 is currently shown below.
| Source | Event |
|---|---|
| All jobs | Job exit with runtime information |
| All jobs | Job scheduled for fast restart |
| Custom job | Execution started |
| Recompression job | Recompression job completed |
| Reorder job | Chunk reorder completed |
| Reorder job | Chunk reorder started |
| Scheduler | New jobs discovered and added to scheduled jobs list |
| Scheduler | Scheduling job for launch |
Debug level 2
The amount of information printed at each level varies between jobs,
but the information printed at DEBUG2 is currently shown below.
Note that all messages at level DEBUG1 are also printed when you set
the log level to DEBUG2, which is normal Postgres
behaviour.
| Source | Event |
|---|---|
| All jobs | Job found in jobs table |
| All jobs | Job starting execution |
| Scheduler | Scheduled jobs list update started |
| Scheduler | Scheduler dispatching job |
Debug level 5
| Source | Event |
|---|---|
| Scheduler | Scheduled wake up |
| Scheduler | Scheduler delayed in dispatching job |
hypertable chunks are not discoverable by the Postgres CDC service
hypertables require special handling for CDC support. Newly created chunks are not not published, which means they are not discoverable by the CDC service. To fix this problem, use the following trigger to automatically publishe newly created chunks on the replication slot. Please be aware that TimescaleDB does not provide full CDC support.
CREATE OR REPLACE FUNCTION ddl_end_trigger_func() RETURNS EVENT_TRIGGER AS
$$
DECLARE
r RECORD;
pub NAME;
BEGIN
FOR r IN SELECT * FROM pg_event_trigger_ddl_commands()
LOOP
SELECT pubname INTO pub
FROM pg_inherits
JOIN _timescaledb_catalog.hypertable ht
ON inhparent = format('%I.%I', ht.schema_name, ht.table_name)::regclass
JOIN pg_publication_tables
ON schemaname = ht.schema_name AND tablename = ht.table_name
WHERE inhrelid = r.objid;
IF NOT pub IS NULL THEN
EXECUTE format('ALTER PUBLICATION %s ADD TABLE %s', pub, r.objid::regclass);
END IF;
END LOOP;
END;
$$ LANGUAGE plpgsql;
CREATE EVENT TRIGGER ddl_end_trigger
ON ddl_command_end WHEN TAG IN ('CREATE TABLE') EXECUTE FUNCTION ddl_end_trigger_func();
===== PAGE: https://docs.tigerdata.com/use-timescale/compression/ =====
Compression
Old API since TimescaleDB v2.18.0 Replaced by hypercore.
Time-series data can be compressed to reduce the amount of storage required, and increase the speed of some queries. This is a cornerstone feature of TimescaleDB. When new data is added to your database, it is in the form of uncompressed rows. TimescaleDB uses a built-in job scheduler to convert this data to the form of compressed columns. This occurs across chunks of TimescaleDB hypertables.
===== PAGE: https://docs.tigerdata.com/tutorials/real-time-analytics-transport/ =====
Analytics on transport and geospatial data
Real-time analytics refers to the process of collecting, analyzing, and interpreting data instantly as it is generated. This approach enables you track and monitor activity, and make decisions based on real-time insights on data stored in a Tiger Cloud service.
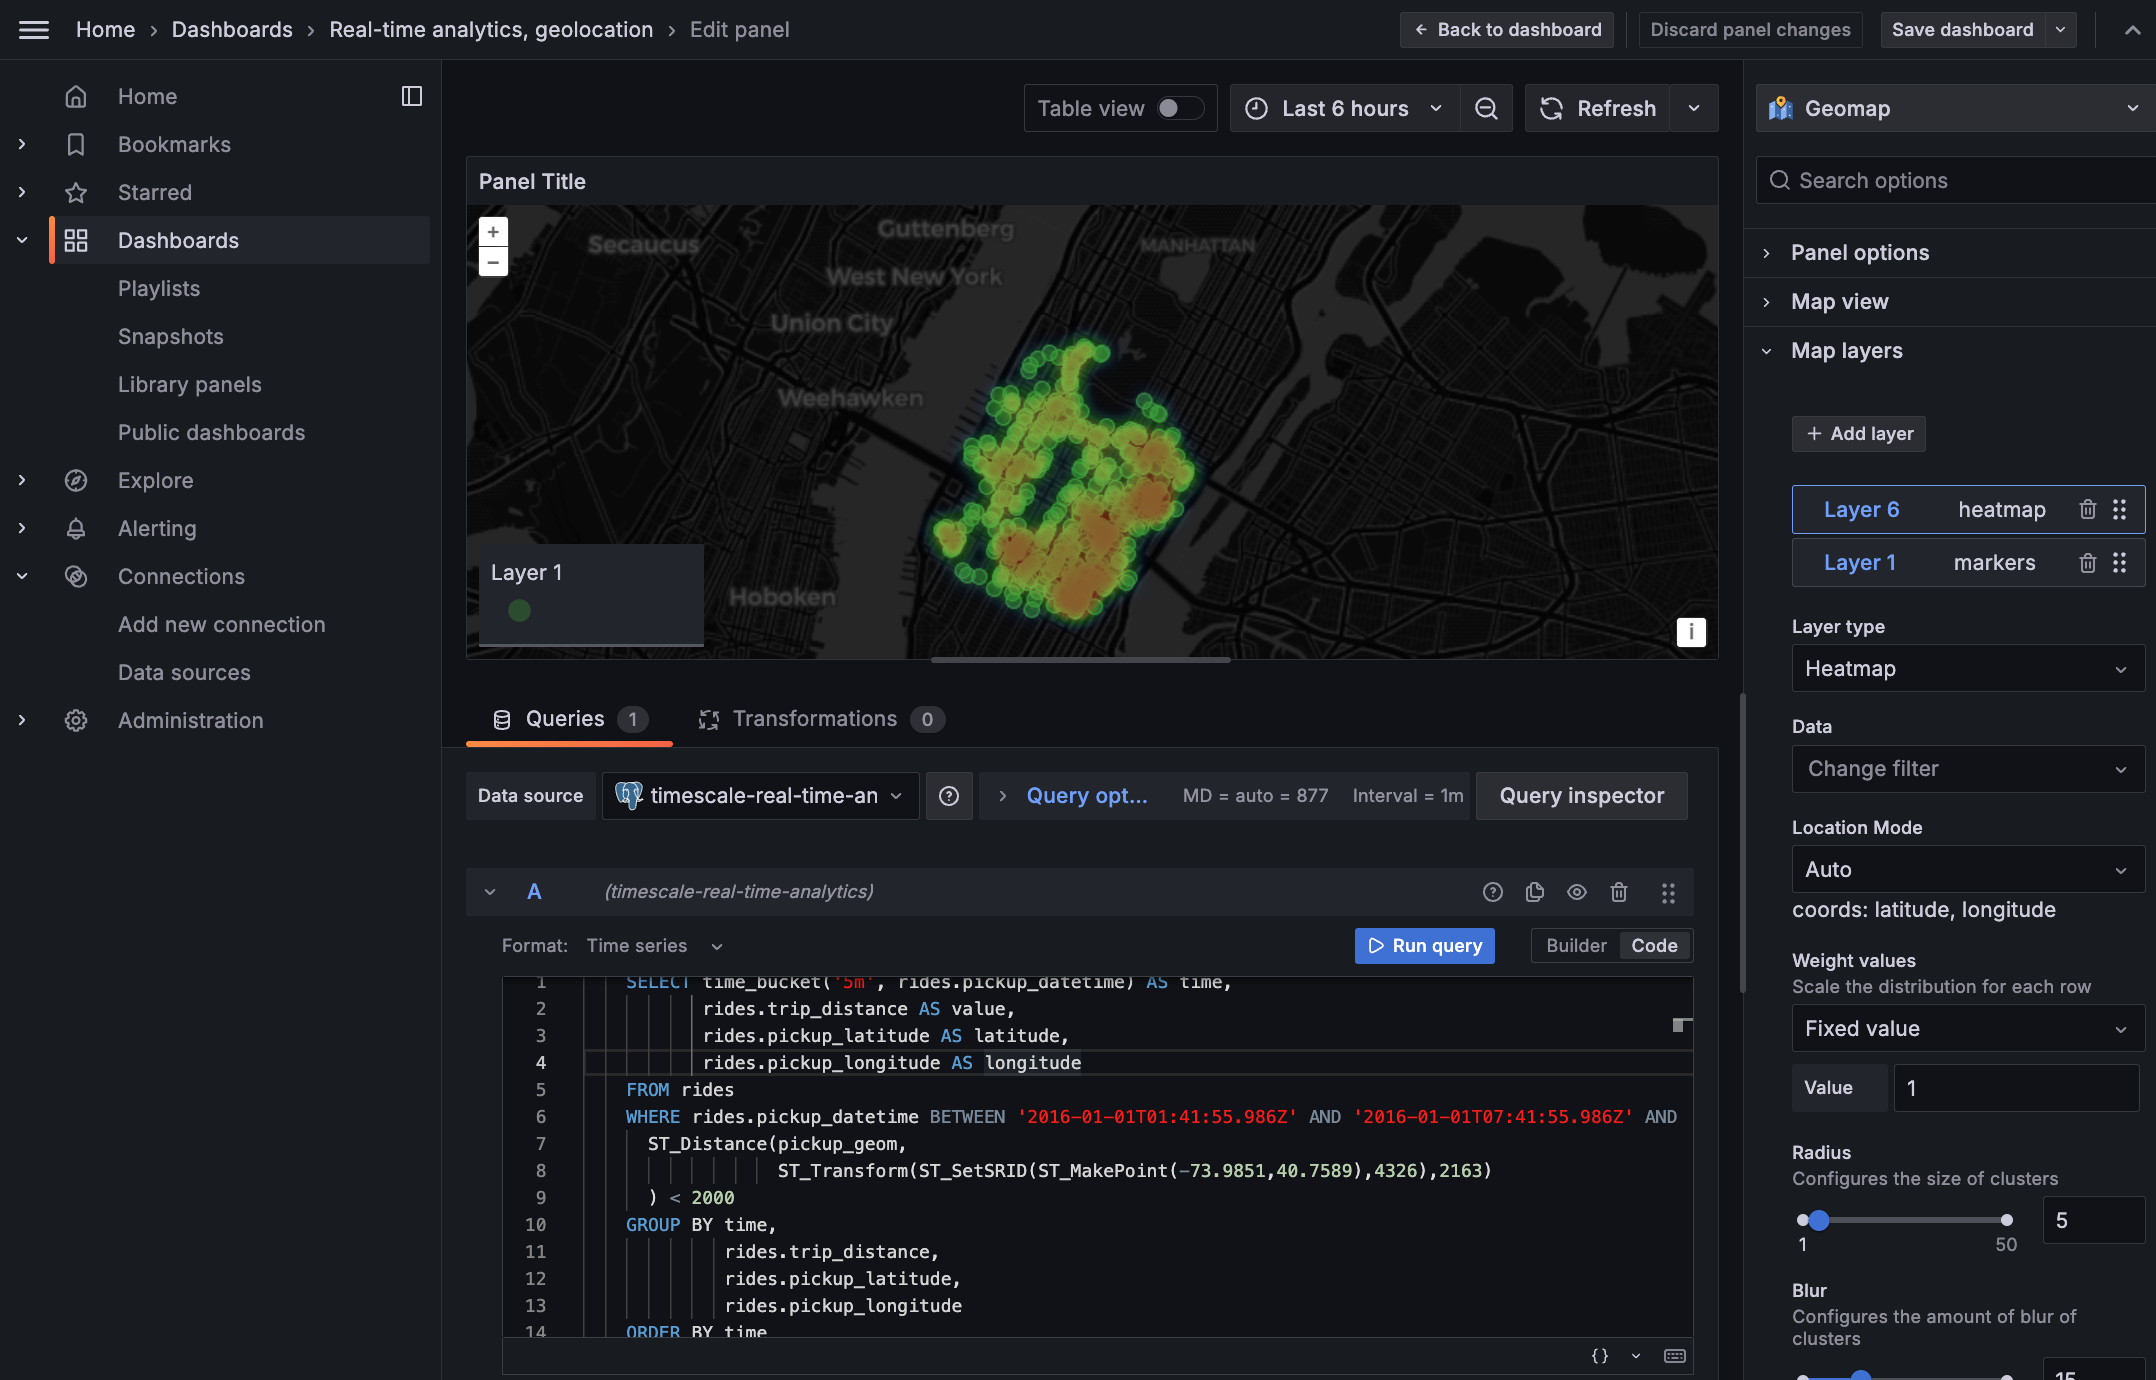
This page shows you how to integrate Grafana with a Tiger Cloud service and make insights based on visualization of data optimized for size and speed in the columnstore.
Prerequisites
To follow the steps on this page:
- Create a target Tiger Cloud service with the Real-time analytics capability.
You need your connection details. This procedure also works for self-hosted TimescaleDB.
- Install and run self-managed Grafana, or sign up for Grafana Cloud.
Optimize time-series data in hypertables
Hypertables are Postgres tables in TimescaleDB that automatically partition your time-series data by time. Time-series data represents the way a system, process, or behavior changes over time. Hypertables enable TimescaleDB to work efficiently with time-series data. Each hypertable is made up of child tables called chunks. Each chunk is assigned a range of time, and only contains data from that range. When you run a query, TimescaleDB identifies the correct chunk and runs the query on it, instead of going through the entire table.
Hypercore is the hybrid row-columnar storage engine in TimescaleDB used by hypertables. Traditional databases force a trade-off between fast inserts (row-based storage) and efficient analytics (columnar storage). Hypercore eliminates this trade-off, allowing real-time analytics without sacrificing transactional capabilities.
Hypercore dynamically stores data in the most efficient format for its lifecycle:
- Row-based storage for recent data: the most recent chunk (and possibly more) is always stored in the rowstore, ensuring fast inserts, updates, and low-latency single record queries. Additionally, row-based storage is used as a writethrough for inserts and updates to columnar storage.
- Columnar storage for analytical performance: chunks are automatically compressed into the columnstore, optimizing storage efficiency and accelerating analytical queries.
Unlike traditional columnar databases, hypercore allows data to be inserted or modified at any stage, making it a flexible solution for both high-ingest transactional workloads and real-time analytics—within a single database.
Because TimescaleDB is 100% Postgres, you can use all the standard Postgres tables, indexes, stored procedures, and other objects alongside your hypertables. This makes creating and working with hypertables similar to standard Postgres.
Import time-series data into a hypertable
- Unzip nyc_data.tar.gz to a
<local folder>.
This test dataset contains historical data from New York's yellow taxi network.
To import up to 100GB of data directly from your current Postgres-based database, migrate with downtime using native Postgres tooling. To seamlessly import 100GB-10TB+ of data, use the live migration tooling supplied by Tiger Data. To add data from non-Postgres data sources, see Import and ingest data.
In Terminal, navigate to
<local folder>and update the following string with your connection details to connect to your service.psql -d "postgres://<username>:<password>@<host>:<port>/<database-name>?sslmode=require"Create an optimized hypertable for your time-series data:
Create a hypertable with hypercore enabled by default for your time-series data using CREATE TABLE. For efficient queries on data in the columnstore, remember to
segmentbythe column you will use most often to filter your data.In your sql client, run the following command:
CREATE TABLE "rides"( vendor_id TEXT, pickup_datetime TIMESTAMP WITHOUT TIME ZONE NOT NULL, dropoff_datetime TIMESTAMP WITHOUT TIME ZONE NOT NULL, passenger_count NUMERIC, trip_distance NUMERIC, pickup_longitude NUMERIC, pickup_latitude NUMERIC, rate_code INTEGER, dropoff_longitude NUMERIC, dropoff_latitude NUMERIC, payment_type INTEGER, fare_amount NUMERIC, extra NUMERIC, mta_tax NUMERIC, tip_amount NUMERIC, tolls_amount NUMERIC, improvement_surcharge NUMERIC, total_amount NUMERIC ) WITH ( tsdb.hypertable, tsdb.partition_column='pickup_datetime', tsdb.create_default_indexes=false, tsdb.segmentby='vendor_id', tsdb.orderby='pickup_datetime DESC' );If you are self-hosting TimescaleDB v2.19.3 and below, create a Postgres relational table, then convert it using create_hypertable. You then enable hypercore with a call to ALTER TABLE.
Add another dimension to partition your hypertable more efficiently:
SELECT add_dimension('rides', by_hash('payment_type', 2));Create an index to support efficient queries by vendor, rate code, and passenger count:
CREATE INDEX ON rides (vendor_id, pickup_datetime DESC); CREATE INDEX ON rides (rate_code, pickup_datetime DESC); CREATE INDEX ON rides (passenger_count, pickup_datetime DESC);
Create Postgres tables for relational data:
Add a table to store the payment types data:
CREATE TABLE IF NOT EXISTS "payment_types"( payment_type INTEGER, description TEXT ); INSERT INTO payment_types(payment_type, description) VALUES (1, 'credit card'), (2, 'cash'), (3, 'no charge'), (4, 'dispute'), (5, 'unknown'), (6, 'voided trip');Add a table to store the rates data:
CREATE TABLE IF NOT EXISTS "rates"( rate_code INTEGER, description TEXT ); INSERT INTO rates(rate_code, description) VALUES (1, 'standard rate'), (2, 'JFK'), (3, 'Newark'), (4, 'Nassau or Westchester'), (5, 'negotiated fare'), (6, 'group ride');Upload the dataset to your service
\COPY rides FROM nyc_data_rides.csv CSV;
- Unzip nyc_data.tar.gz to a
Have a quick look at your data
You query hypertables in exactly the same way as you would a relational Postgres table. Use one of the following SQL editors to run a query and see the data you uploaded:
- Data mode: write queries, visualize data, and share your results in Tiger Cloud Console for all your Tiger Cloud services.
- SQL editor: write, fix, and organize SQL faster and more accurately in Tiger Cloud Console for a Tiger Cloud service.
- psql: easily run queries on your Tiger Cloud services or self-hosted TimescaleDB deployment from Terminal.
For example:
Display the number of rides for each fare type:
SELECT rate_code, COUNT(vendor_id) AS num_trips FROM rides WHERE pickup_datetime < '2016-01-08' GROUP BY rate_code ORDER BY rate_code;This simple query runs in 3 seconds. You see something like:
| rate_code | num_trips | |-----------------|-----------| |1 | 2266401| |2 | 54832| |3 | 4126| |4 | 967| |5 | 7193| |6 | 17| |99 | 42|
To select all rides taken in the first week of January 2016, and return the total number of trips taken for each rate code:
SELECT rates.description, COUNT(vendor_id) AS num_trips FROM rides JOIN rates ON rides.rate_code = rates.rate_code WHERE pickup_datetime < '2016-01-08' GROUP BY rates.description ORDER BY LOWER(rates.description);On this large amount of data, this analytical query on data in the rowstore takes about 59 seconds. You see something like:
| description | num_trips | |-----------------|-----------| | group ride | 17 | | JFK | 54832 | | Nassau or Westchester | 967 | | negotiated fare | 7193 | | Newark | 4126 | | standard rate | 2266401 |
Optimize your data for real-time analytics
When TimescaleDB converts a chunk to the columnstore, it automatically creates a different schema for your
data. TimescaleDB creates and uses custom indexes to incorporate the segmentby and orderby parameters when
you write to and read from the columstore.
To increase the speed of your analytical queries by a factor of 10 and reduce storage costs by up to 90%, convert data to the columnstore:
- Connect to your Tiger Cloud service
In Tiger Cloud Console open an SQL editor. The in-Console editors display the query speed. You can also connect to your serviceusing psql.
- Add a policy to convert chunks to the columnstore at a specific time interval
For example, convert data older than 8 days old to the columstore:
CALL add_columnstore_policy('rides', INTERVAL '8 days');
The data you imported for this tutorial is from 2016, it was already added to the columnstore by default. However, you get the idea. To see the space savings in action, follow Try the key Tiger Data features.
Just to hit this one home, by converting cooling data to the columnstore, you have increased the speed of your analytical queries by a factor of 10, and reduced storage by up to 90%.
Connect Grafana to Tiger Cloud
To visualize the results of your queries, enable Grafana to read the data in your service:
- Log in to Grafana
In your browser, log in to either:
- Self-hosted Grafana: at `http://localhost:3000/`. The default credentials are `admin`, `admin`.
- Grafana Cloud: use the URL and credentials you set when you created your account.
Add your service as a data source
- Open
Connections>Data sources, then clickAdd new data source. - Select
PostgreSQLfrom the list. Configure the connection:
Host URL,Database name,Username, andPassword
Configure using your connection details.
Host URLis in the format<host>:<port>.TLS/SSL Mode: selectrequire.PostgreSQL options: enableTimescaleDB.- Leave the default setting for all other fields.
Click
Save & test.
Grafana checks that your details are set correctly.
- Open
Monitor performance over time
A Grafana dashboard represents a view into the performance of a system, and each dashboard consists of one or more panels, which represent information about a specific metric related to that system.
To visually monitor the volume of taxi rides over time:
Create the dashboard
On the
Dashboardspage, clickNewand selectNew dashboard.Click
Add visualization.Select the data source that connects to your Tiger Cloud service. The
Time seriesvisualization is chosen by default.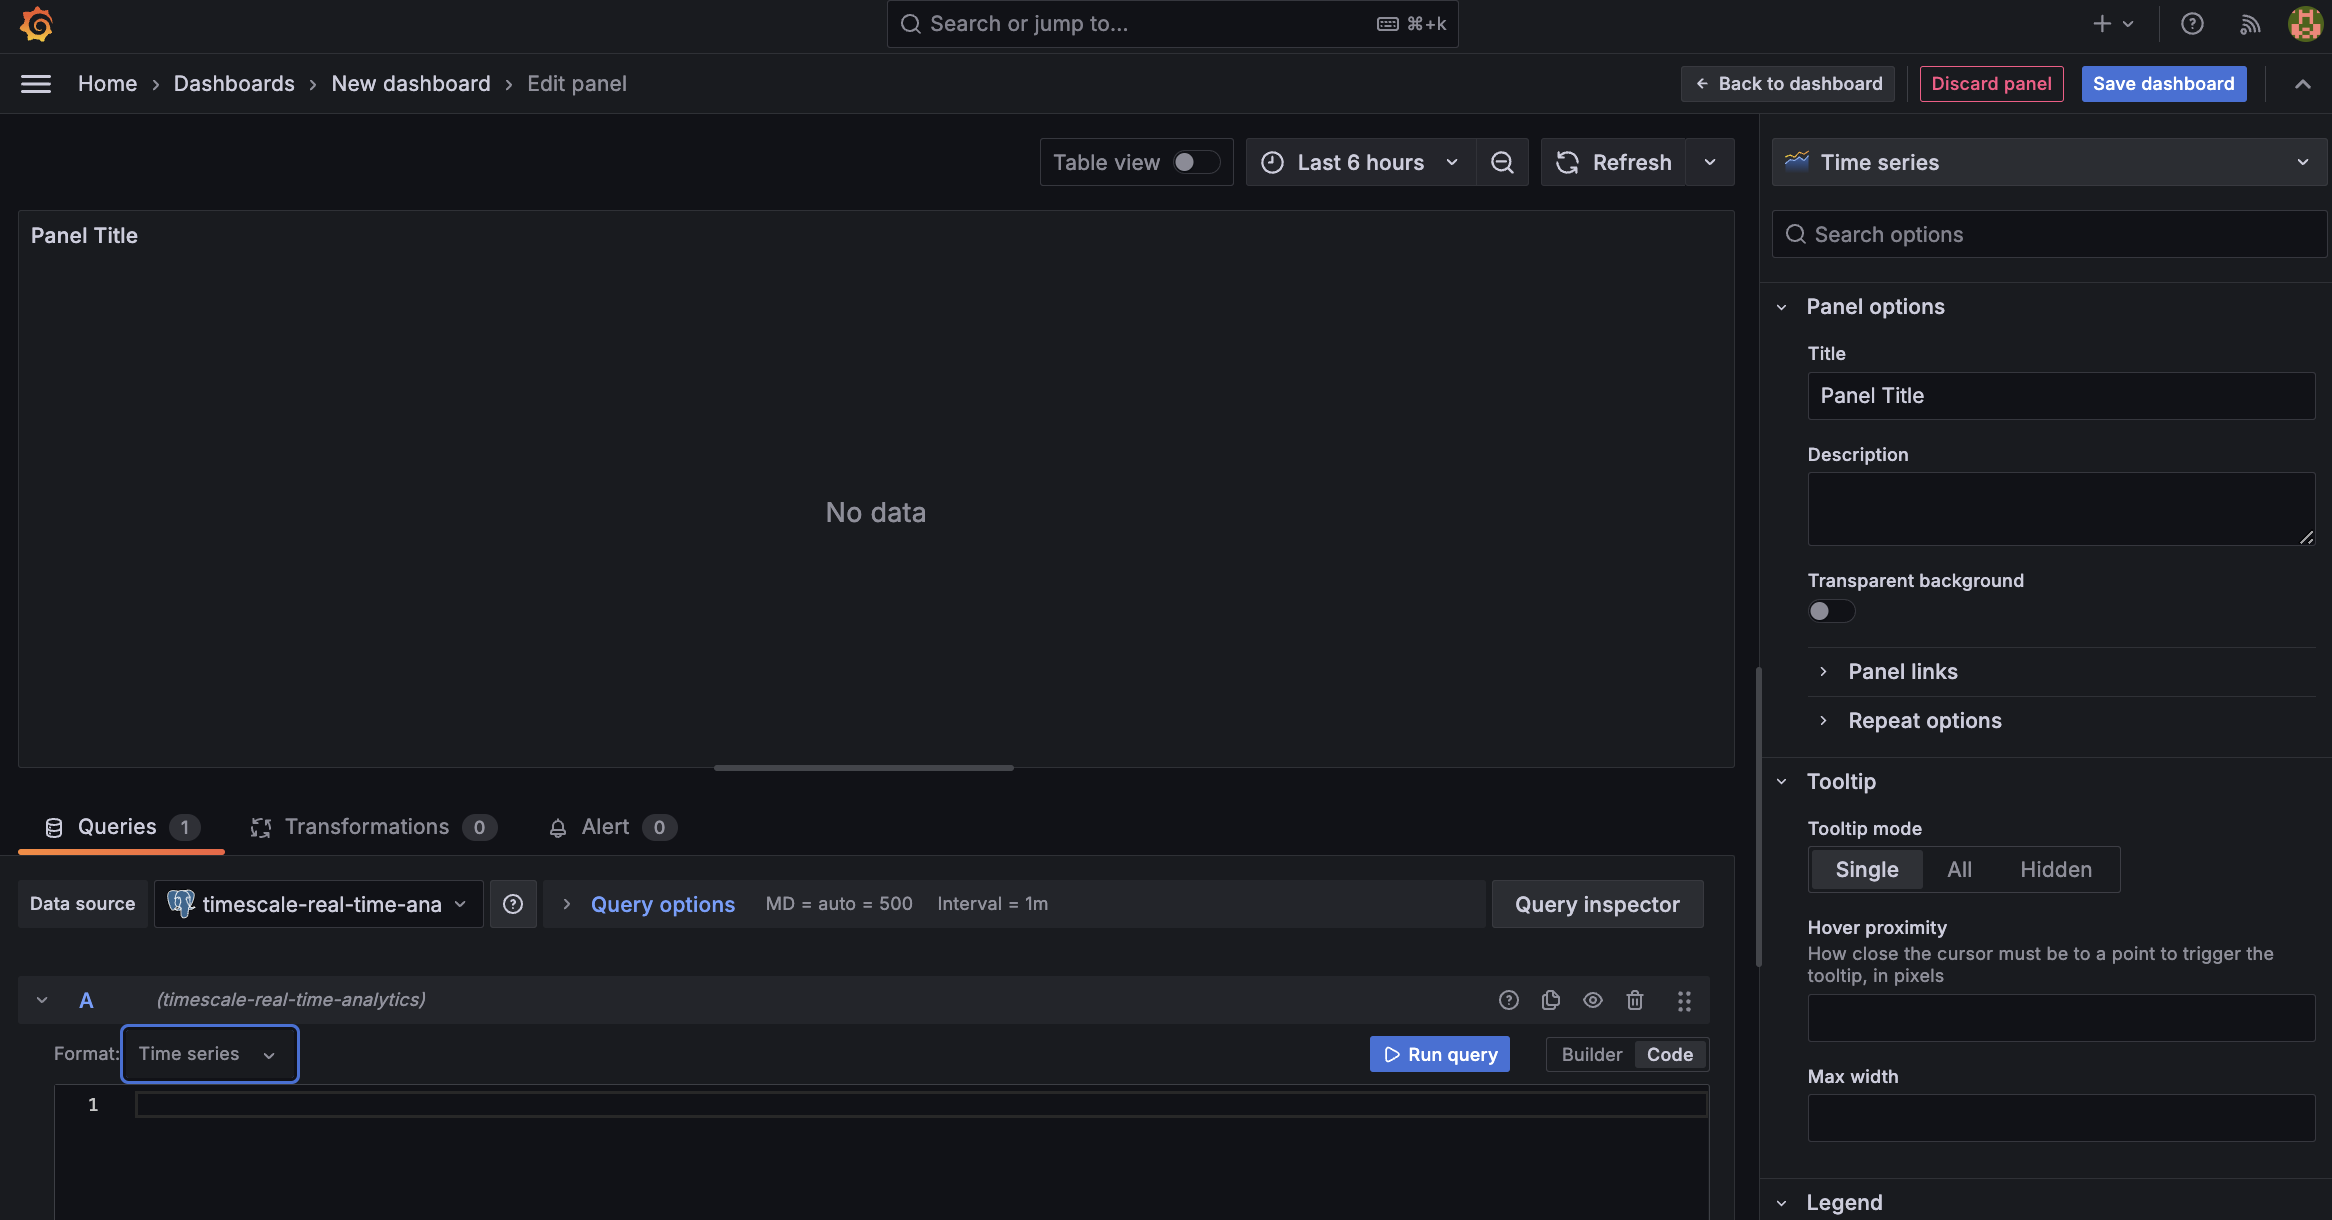
In the
Queriessection, selectCode, then selectTime seriesinFormat.Select the data range for your visualization: the data set is from 2016. Click the date range above the panel and set:
- From:
2016-01-01 01:00:00 - To:
2016-01-30 01:00:00
- From:
Combine TimescaleDB and Grafana functionality to analyze your data
Combine a TimescaleDB time_bucket, with the Grafana _timefilter() function to set the
pickup_datetime column as the filtering range for your visualizations.
SELECT
time_bucket('1 day', pickup_datetime) AS "time",
COUNT(*)
FROM rides
WHERE _timeFilter(pickup_datetime)
GROUP BY time
ORDER BY time;
This query groups the results by day and orders them by time.
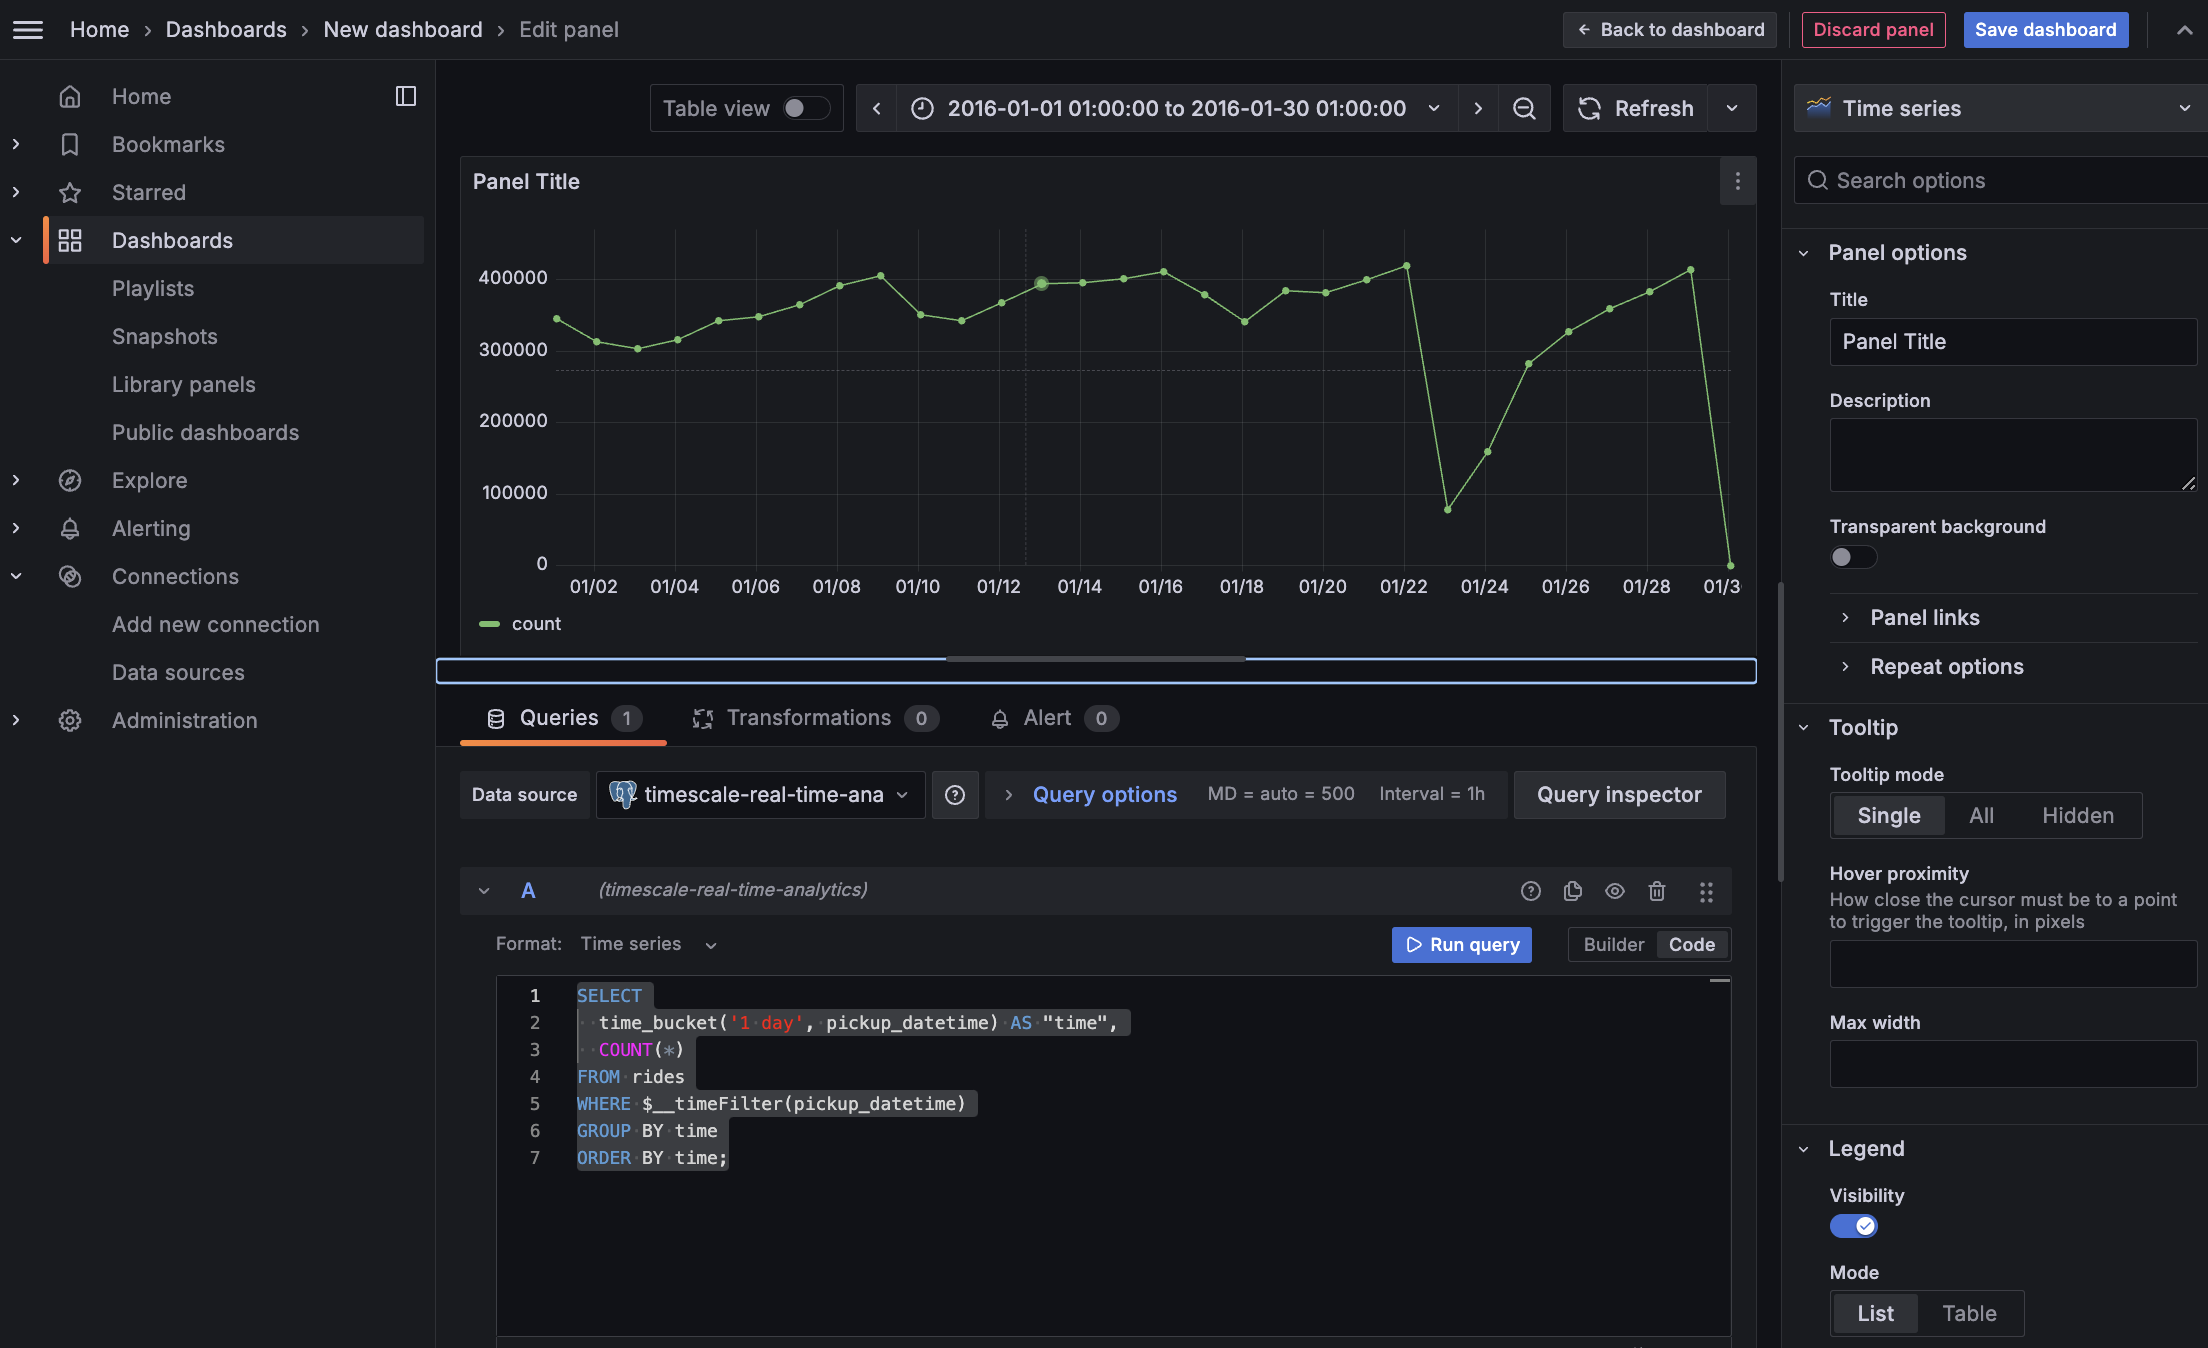
- Click
Save dashboard
Optimize revenue potential
Having all this data is great but how do you use it? Monitoring data is useful to check what has happened, but how can you analyse this information to your advantage? This section explains how to create a visualization that shows how you can maximize potential revenue.
Set up your data for geospatial queries
To add geospatial analysis to your ride count visualization, you need geospatial data to work out which trips originated where. As TimescaleDB is compatible with all Postgres extensions, use PostGIS to slice data by time and location.
Connect to your Tiger Cloud service and add the PostGIS extension:
CREATE EXTENSION postgis;Add geometry columns for pick up and drop off locations:
ALTER TABLE rides ADD COLUMN pickup_geom geometry(POINT,2163); ALTER TABLE rides ADD COLUMN dropoff_geom geometry(POINT,2163);Convert the latitude and longitude points into geometry coordinates that work with PostGIS:
UPDATE rides SET pickup_geom = ST_Transform(ST_SetSRID(ST_MakePoint(pickup_longitude,pickup_latitude),4326),2163), dropoff_geom = ST_Transform(ST_SetSRID(ST_MakePoint(dropoff_longitude,dropoff_latitude),4326),2163);This updates 10,906,860 rows of data on both columns, it takes a while. Coffee is your friend.
Visualize the area where you can make the most money
In this section you visualize a query that returns rides longer than 5 miles for
trips taken within 2 km of Times Square. The data includes the distance travelled and
is GROUP BY trip_distance and location so that Grafana can plot the data properly.
This enables you to see where a taxi driver is most likely to pick up a passenger who wants a longer ride, and make more money.
Create a geolocalization dashboard
In Grafana, create a new dashboard that is connected to your Tiger Cloud service data source with a Geomap visualization.
In the
Queriessection, selectCode, then select the Time seriesFormat.
To find rides longer than 5 miles in Manhattan, paste the following query:
SELECT time_bucket('5m', rides.pickup_datetime) AS time, rides.trip_distance AS value, rides.pickup_latitude AS latitude, rides.pickup_longitude AS longitude FROM rides WHERE rides.pickup_datetime BETWEEN '2016-01-01T01:41:55.986Z' AND '2016-01-01T07:41:55.986Z' AND ST_Distance(pickup_geom, ST_Transform(ST_SetSRID(ST_MakePoint(-73.9851,40.7589),4326),2163) ) < 2000 GROUP BY time, rides.trip_distance, rides.pickup_latitude, rides.pickup_longitude ORDER BY time LIMIT 500;
You see a world map with a dot on New York.
- Zoom into your map to see the visualization clearly.
Customize the visualization
- In the Geomap options, under
Map Layers, click+ Add layerand selectHeatmap. You now see the areas where a taxi driver is most likely to pick up a passenger who wants a longer ride, and make more money.
- In the Geomap options, under
You have integrated Grafana with a Tiger Cloud service and made insights based on visualization of your data.
===== PAGE: https://docs.tigerdata.com/tutorials/real-time-analytics-energy-consumption/ =====
Real-time analytics with Tiger Cloud and Grafana
Energy providers understand that customers tend to lose patience when there is not enough power for them to complete day-to-day activities. Task one is keeping the lights on. If you are transitioning to renewable energy, it helps to know when you need to produce energy so you can choose a suitable energy source.
Real-time analytics refers to the process of collecting, analyzing, and interpreting data instantly as it is generated. This approach enables you to track and monitor activity, make the decisions based on real-time insights on data stored in a Tiger Cloud service and keep those lights on.
Grafana is a popular data visualization tool that enables you to create customizable dashboards and effectively monitor your systems and applications.
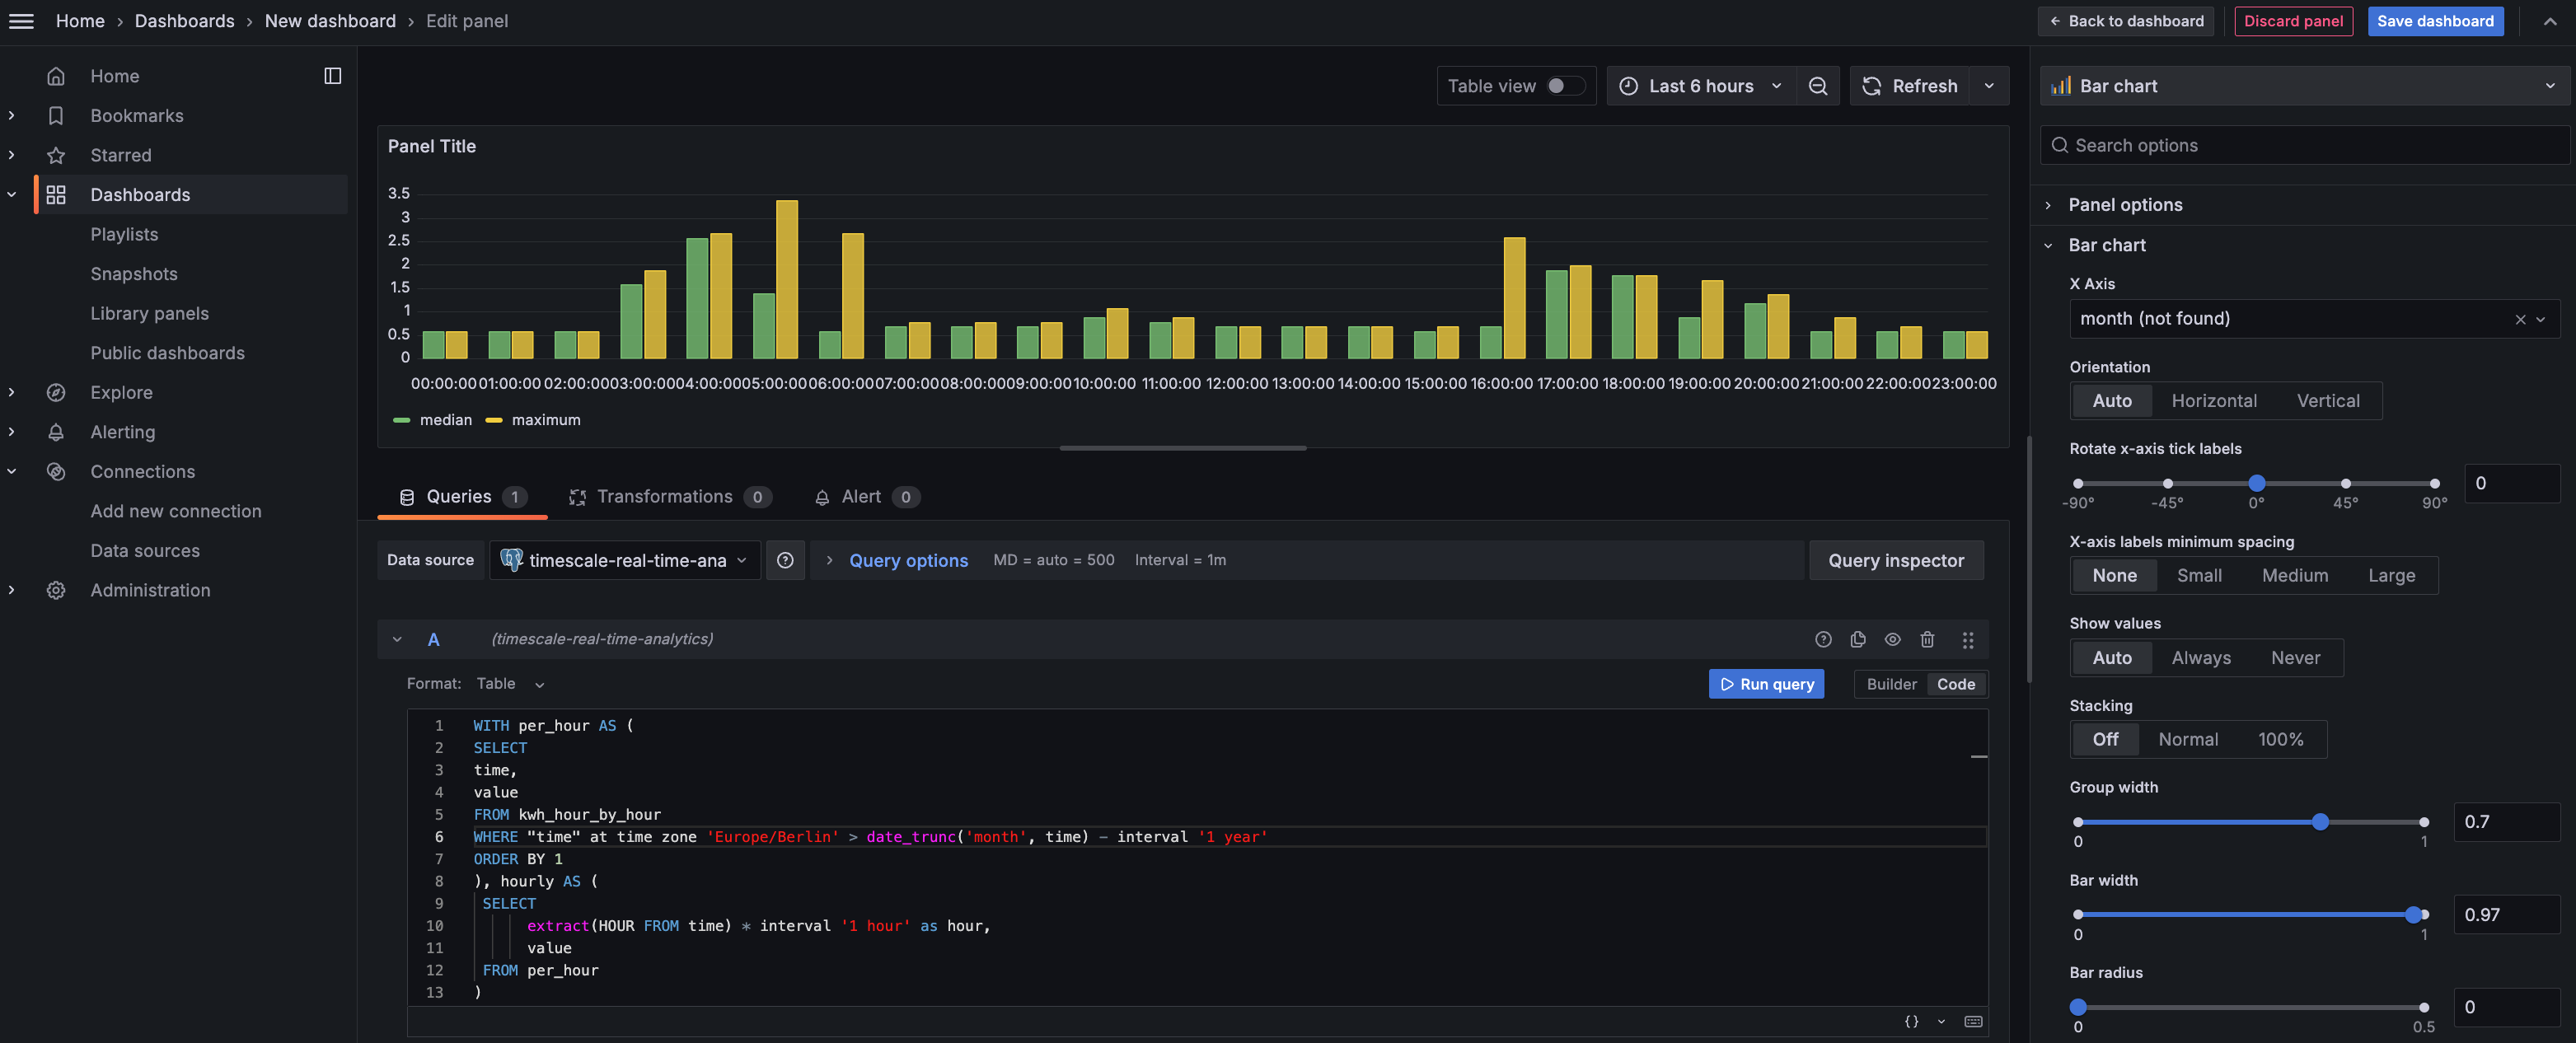
This page shows you how to integrate Grafana with a Tiger Cloud service and make insights based on visualization of data optimized for size and speed in the columnstore.
Prerequisites
To follow the steps on this page:
- Create a target Tiger Cloud service with the Real-time analytics capability.
You need your connection details. This procedure also works for self-hosted TimescaleDB.
- Install and run self-managed Grafana, or sign up for Grafana Cloud.
Optimize time-series data in hypertables
Hypertables are Postgres tables in TimescaleDB that automatically partition your time-series data by time. Time-series data represents the way a system, process, or behavior changes over time. Hypertables enable TimescaleDB to work efficiently with time-series data. Each hypertable is made up of child tables called chunks. Each chunk is assigned a range of time, and only contains data from that range. When you run a query, TimescaleDB identifies the correct chunk and runs the query on it, instead of going through the entire table.
Hypercore is the hybrid row-columnar storage engine in TimescaleDB used by hypertables. Traditional databases force a trade-off between fast inserts (row-based storage) and efficient analytics (columnar storage). Hypercore eliminates this trade-off, allowing real-time analytics without sacrificing transactional capabilities.
Hypercore dynamically stores data in the most efficient format for its lifecycle:
- Row-based storage for recent data: the most recent chunk (and possibly more) is always stored in the rowstore, ensuring fast inserts, updates, and low-latency single record queries. Additionally, row-based storage is used as a writethrough for inserts and updates to columnar storage.
- Columnar storage for analytical performance: chunks are automatically compressed into the columnstore, optimizing storage efficiency and accelerating analytical queries.
Unlike traditional columnar databases, hypercore allows data to be inserted or modified at any stage, making it a flexible solution for both high-ingest transactional workloads and real-time analytics—within a single database.
Because TimescaleDB is 100% Postgres, you can use all the standard Postgres tables, indexes, stored procedures, and other objects alongside your hypertables. This makes creating and working with hypertables similar to standard Postgres.
Import time-series data into a hypertable
- Unzip metrics.csv.gz to a
<local folder>.
This test dataset contains energy consumption data.
To import up to 100GB of data directly from your current Postgres based database, migrate with downtime using native Postgres tooling. To seamlessly import 100GB-10TB+ of data, use the live migration tooling supplied by Tiger Data. To add data from non-Postgres data sources, see Import and ingest data.
In Terminal, navigate to
<local folder>and update the following string with your connection details to connect to your service.psql -d "postgres://<username>:<password>@<host>:<port>/<database-name>?sslmode=require"Create an optimized hypertable for your time-series data:
- Create a hypertable with hypercore enabled by default for your
time-series data using CREATE TABLE. For efficient queries
on data in the columnstore, remember to
segmentbythe column you will use most often to filter your data.
In your sql client, run the following command:
```sql CREATE TABLE "metrics"( created timestamp with time zone default now() not null, type_id integer not null, value double precision not null ) WITH ( tsdb.hypertable, tsdb.partition_column='created', tsdb.segmentby = 'type_id', tsdb.orderby = 'created DESC' ); ``` If you are self-hosting TimescaleDB v2.19.3 and below, create a [Postgres relational table][pg-create-table],then convert it using create_hypertable. You then enable hypercore with a call to ALTER TABLE.
Upload the dataset to your service
\COPY metrics FROM metrics.csv CSV;
- Create a hypertable with hypercore enabled by default for your
time-series data using CREATE TABLE. For efficient queries
on data in the columnstore, remember to
- Unzip metrics.csv.gz to a
Have a quick look at your data
You query hypertables in exactly the same way as you would a relational Postgres table. Use one of the following SQL editors to run a query and see the data you uploaded:
- Data mode: write queries, visualize data, and share your results in Tiger Cloud Console for all your Tiger Cloud services.
- SQL editor: write, fix, and organize SQL faster and more accurately in Tiger Cloud Console for a Tiger Cloud service.
psql: easily run queries on your Tiger Cloud services or self-hosted TimescaleDB deployment from Terminal.
SELECT time_bucket('1 day', created, 'Europe/Berlin') AS "time", round((last(value, created) - first(value, created)) * 100.) / 100. AS value FROM metrics WHERE type_id = 5 GROUP BY 1;
On this amount of data, this query on data in the rowstore takes about 3.6 seconds. You see something like:
Time value 2023-05-29 22:00:00+00 23.1 2023-05-28 22:00:00+00 19.5 2023-05-30 22:00:00+00 25 2023-05-31 22:00:00+00 8.1
Optimize your data for real-time analytics
When TimescaleDB converts a chunk to the columnstore, it automatically creates a different schema for your
data. TimescaleDB creates and uses custom indexes to incorporate the segmentby and orderby parameters when
you write to and read from the columstore.
To increase the speed of your analytical queries by a factor of 10 and reduce storage costs by up to 90%, convert data to the columnstore:
- Connect to your Tiger Cloud service
In Tiger Cloud Console open an SQL editor. The in-Console editors display the query speed. You can also connect to your service using psql.
- Add a policy to convert chunks to the columnstore at a specific time interval
For example, 60 days after the data was added to the table:
CALL add_columnstore_policy('metrics', INTERVAL '8 days');
- Faster analytical queries on data in the columnstore
Now run the analytical query again:
SELECT time_bucket('1 day', created, 'Europe/Berlin') AS "time",
round((last(value, created) - first(value, created)) * 100.) / 100. AS value
FROM metrics
WHERE type_id = 5
GROUP BY 1;
On this amount of data, this analytical query on data in the columnstore takes about 250ms.
Just to hit this one home, by converting cooling data to the columnstore, you have increased the speed of your analytical queries by a factor of 10, and reduced storage by up to 90%.
Write fast analytical queries
Aggregation is a way of combining data to get insights from it. Average, sum, and count are all examples of simple aggregates. However, with large amounts of data aggregation slows things down, quickly. Continuous aggregates are a kind of hypertable that is refreshed automatically in the background as new data is added, or old data is modified. Changes to your dataset are tracked, and the hypertable behind the continuous aggregate is automatically updated in the background.
By default, querying continuous aggregates provides you with real-time data. Pre-aggregated data from the materialized view is combined with recent data that hasn't been aggregated yet. This gives you up-to-date results on every query.
You create continuous aggregates on uncompressed data in high-performance storage. They continue to work on data in the columnstore and rarely accessed data in tiered storage. You can even create continuous aggregates on top of your continuous aggregates.
Monitor energy consumption on a day-to-day basis
Create a continuous aggregate
kwh_day_by_dayfor energy consumption:CREATE MATERIALIZED VIEW kwh_day_by_day(time, value) with (timescaledb.continuous) as SELECT time_bucket('1 day', created, 'Europe/Berlin') AS "time", round((last(value, created) - first(value, created)) * 100.) / 100. AS value FROM metrics WHERE type_id = 5 GROUP BY 1;Add a refresh policy to keep
kwh_day_by_dayup-to-date:SELECT add_continuous_aggregate_policy('kwh_day_by_day', start_offset => NULL, end_offset => INTERVAL '1 hour', schedule_interval => INTERVAL '1 hour');
Monitor energy consumption on an hourly basis
Create a continuous aggregate
kwh_hour_by_hourfor energy consumption:CREATE MATERIALIZED VIEW kwh_hour_by_hour(time, value) with (timescaledb.continuous) as SELECT time_bucket('01:00:00', metrics.created, 'Europe/Berlin') AS "time", round((last(value, created) - first(value, created)) * 100.) / 100. AS value FROM metrics WHERE type_id = 5 GROUP BY 1;Add a refresh policy to keep the continuous aggregate up-to-date:
SELECT add_continuous_aggregate_policy('kwh_hour_by_hour', start_offset => NULL, end_offset => INTERVAL '1 hour', schedule_interval => INTERVAL '1 hour');
Analyze your data
Now you have made continuous aggregates, it could be a good idea to use them to perform analytics on your data. For example, to see how average energy consumption changes during weekdays over the last year, run the following query:
WITH per_day AS ( SELECT time, value FROM kwh_day_by_day WHERE "time" at time zone 'Europe/Berlin' > date_trunc('month', time) - interval '1 year' ORDER BY 1 ), daily AS ( SELECT to_char(time, 'Dy') as day, value FROM per_day ), percentile AS ( SELECT day, approx_percentile(0.50, percentile_agg(value)) as value FROM daily GROUP BY 1 ORDER BY 1 ) SELECT d.day, d.ordinal, pd.value FROM unnest(array['Sun', 'Mon', 'Tue', 'Wed', 'Thu', 'Fri', 'Sat']) WITH ORDINALITY AS d(day, ordinal) LEFT JOIN percentile pd ON lower(pd.day) = lower(d.day);You see something like:
| day | ordinal | value | | --- | ------- | ----- | | Mon | 2 | 23.08078714975423 | | Sun | 1 | 19.511430831944395 | | Tue | 3 | 25.003118897837307 | | Wed | 4 | 8.09300571759772 |
Connect Grafana to Tiger Cloud
To visualize the results of your queries, enable Grafana to read the data in your service:
- Log in to Grafana
In your browser, log in to either:
- Self-hosted Grafana: at `http://localhost:3000/`. The default credentials are `admin`, `admin`.
- Grafana Cloud: use the URL and credentials you set when you created your account.
Add your service as a data source
- Open
Connections>Data sources, then clickAdd new data source. - Select
PostgreSQLfrom the list. Configure the connection:
Host URL,Database name,Username, andPassword
Configure using your connection details.
Host URLis in the format<host>:<port>.TLS/SSL Mode: selectrequire.PostgreSQL options: enableTimescaleDB.- Leave the default setting for all other fields.
Click
Save & test.
Grafana checks that your details are set correctly.
- Open
Visualize energy consumption
A Grafana dashboard represents a view into the performance of a system, and each dashboard consists of one or more panels, which represent information about a specific metric related to that system.
To visually monitor the volume of energy consumption over time:
Create the dashboard
On the
Dashboardspage, clickNewand selectNew dashboard.Click
Add visualization, then select the data source that connects to your Tiger Cloud service and theBar chartvisualization.
In the
Queriessection, selectCode, then run the following query based on your continuous aggregate:WITH per_hour AS ( SELECT time, value FROM kwh_hour_by_hour WHERE "time" at time zone 'Europe/Berlin' > date_trunc('month', time) - interval '1 year' ORDER BY 1 ), hourly AS ( SELECT extract(HOUR FROM time) * interval '1 hour' as hour, value FROM per_hour ) SELECT hour, approx_percentile(0.50, percentile_agg(value)) as median, max(value) as maximum FROM hourly GROUP BY 1 ORDER BY 1;
This query averages the results for households in a specific time zone by hour and orders them by time. Because you use a continuous aggregate, this data is always correct in real time.
You see that energy consumption is highest in the evening and at breakfast time. You also know that the wind drops off in the evening. This data proves that you need to supply a supplementary power source for peak times, or plan to store energy during the day for peak times.
Click
Save dashboard
You have integrated Grafana with a Tiger Cloud service and made insights based on visualization of your data.
===== PAGE: https://docs.tigerdata.com/tutorials/simulate-iot-sensor-data/ =====
Simulate an IoT sensor dataset
The Internet of Things (IoT) describes a trend where computing capabilities are embedded into IoT devices. That is, physical objects, ranging from light bulbs to oil wells. Many IoT devices collect sensor data about their environment and generate time-series datasets with relational metadata.
It is often necessary to simulate IoT datasets. For example, when you are testing a new system. This tutorial shows how to simulate a basic dataset in your Tiger Cloud service, and then run simple queries on it.
To simulate a more advanced dataset, see Time-series Benchmarking Suite (TSBS).
Prerequisites
To follow the steps on this page:
- Create a target Tiger Cloud service with the Real-time analytics capability.
You need your connection details. This procedure also works for self-hosted TimescaleDB.
Simulate a dataset
To simulate a dataset, run the following queries:
Create the
sensorstable:CREATE TABLE sensors( id SERIAL PRIMARY KEY, type VARCHAR(50), location VARCHAR(50) );Create the
sensor_datahypertableCREATE TABLE sensor_data ( time TIMESTAMPTZ NOT NULL, sensor_id INTEGER, temperature DOUBLE PRECISION, cpu DOUBLE PRECISION, FOREIGN KEY (sensor_id) REFERENCES sensors (id) ) WITH ( tsdb.hypertable, tsdb.partition_column='time' );If you are self-hosting TimescaleDB v2.19.3 and below, create a Postgres relational table, then convert it using create_hypertable. You then enable hypercore with a call to ALTER TABLE.
Populate the
sensorstable:INSERT INTO sensors (type, location) VALUES ('a','floor'), ('a', 'ceiling'), ('b','floor'), ('b', 'ceiling');Verify that the sensors have been added correctly:
SELECT * FROM sensors;Sample output:
id | type | location ----+------+---------- 1 | a | floor 2 | a | ceiling 3 | b | floor 4 | b | ceiling (4 rows)Generate and insert a dataset for all sensors:
INSERT INTO sensor_data (time, sensor_id, cpu, temperature) SELECT time, sensor_id, random() AS cpu, random()*100 AS temperature FROM generate_series(now() - interval '24 hour', now(), interval '5 minute') AS g1(time), generate_series(1,4,1) AS g2(sensor_id);Verify the simulated dataset:
SELECT * FROM sensor_data ORDER BY time;Sample output:
time | sensor_id | temperature | cpu -------------------------------+-----------+--------------------+--------------------- 2020-03-31 15:56:25.843575+00 | 1 | 6.86688972637057 | 0.682070567272604 2020-03-31 15:56:40.244287+00 | 2 | 26.589260622859 | 0.229583469685167 2030-03-31 15:56:45.653115+00 | 3 | 79.9925176426768 | 0.457779890391976 2020-03-31 15:56:53.560205+00 | 4 | 24.3201029952615 | 0.641885648947209 2020-03-31 16:01:25.843575+00 | 1 | 33.3203678019345 | 0.0159163917414844 2020-03-31 16:01:40.244287+00 | 2 | 31.2673618085682 | 0.701185956597328 2020-03-31 16:01:45.653115+00 | 3 | 85.2960689924657 | 0.693413889966905 2020-03-31 16:01:53.560205+00 | 4 | 79.4769988860935 | 0.360561791341752 ...
Run basic queries
After you simulate a dataset, you can run some basic queries on it. For example:
Average temperature and CPU by 30-minute windows:
SELECT time_bucket('30 minutes', time) AS period, AVG(temperature) AS avg_temp, AVG(cpu) AS avg_cpu FROM sensor_data GROUP BY period;
Sample output:
period | avg_temp | avg_cpu
------------------------+------------------+-------------------
2020-03-31 19:00:00+00 | 49.6615830013373 | 0.477344429974134
2020-03-31 22:00:00+00 | 58.8521540844037 | 0.503637770501276
2020-03-31 16:00:00+00 | 50.4250325243144 | 0.511075591299838
2020-03-31 17:30:00+00 | 49.0742547437549 | 0.527267253802468
2020-04-01 14:30:00+00 | 49.3416377226822 | 0.438027751864865
...
Average and last temperature, average CPU by 30-minute windows:
SELECT time_bucket('30 minutes', time) AS period, AVG(temperature) AS avg_temp, last(temperature, time) AS last_temp, AVG(cpu) AS avg_cpu FROM sensor_data GROUP BY period;
Sample output:
period | avg_temp | last_temp | avg_cpu
------------------------+------------------+------------------+-------------------
2020-03-31 19:00:00+00 | 49.6615830013373 | 84.3963081017137 | 0.477344429974134
2020-03-31 22:00:00+00 | 58.8521540844037 | 76.5528806950897 | 0.503637770501276
2020-03-31 16:00:00+00 | 50.4250325243144 | 43.5192013625056 | 0.511075591299838
2020-03-31 17:30:00+00 | 49.0742547437549 | 22.740753274411 | 0.527267253802468
2020-04-01 14:30:00+00 | 49.3416377226822 | 59.1331578791142 | 0.438027751864865
...
Query the metadata:
SELECT sensors.location, time_bucket('30 minutes', time) AS period, AVG(temperature) AS avg_temp, last(temperature, time) AS last_temp, AVG(cpu) AS avg_cpu FROM sensor_data JOIN sensors on sensor_data.sensor_id = sensors.id GROUP BY period, sensors.location;
Sample output:
location | period | avg_temp | last_temp | avg_cpu
----------+------------------------+------------------+-------------------+-------------------
ceiling | 20120-03-31 15:30:00+00 | 25.4546818090603 | 24.3201029952615 | 0.435734559316188
floor | 2020-03-31 15:30:00+00 | 43.4297036845237 | 79.9925176426768 | 0.56992522883229
ceiling | 2020-03-31 16:00:00+00 | 53.8454438598516 | 43.5192013625056 | 0.490728285357666
floor | 2020-03-31 16:00:00+00 | 47.0046211887772 | 23.0230117216706 | 0.53142289724201
ceiling | 2020-03-31 16:30:00+00 | 58.7817596504465 | 63.6621567420661 | 0.488188337767497
floor | 2020-03-31 16:30:00+00 | 44.611586847653 | 2.21919436007738 | 0.434762630766879
ceiling | 2020-03-31 17:00:00+00 | 35.7026890735142 | 42.9420990403742 | 0.550129583687522
floor | 2020-03-31 17:00:00+00 | 62.2794370166957 | 52.6636955793947 | 0.454323202022351
...
You have now successfully simulated and run queries on an IoT dataset.
===== PAGE: https://docs.tigerdata.com/tutorials/cookbook/ =====
Tiger Data cookbook
This page contains suggestions from the Tiger Data Community about how to resolve common issues. Use these code examples as guidance to work with your own data.
Prerequisites
To follow the steps on this page:
- Create a target Tiger Cloud service with the Real-time analytics capability.
You need your connection details. This procedure also works for self-hosted TimescaleDB.
Hypertable recipes
This section contains recipes about hypertables.
Remove duplicates from an existing hypertable
Looking to remove duplicates from an existing hypertable? One method is to run a PARTITION BY query to get
ROW_NUMBER() and then the ctid of rows where row_number>1. You then delete these rows. However,
you need to check tableoid and ctid. This is because ctid is not unique and might be duplicated in
different chunks. The following code example took 17 hours to process a table with 40 million rows:
CREATE OR REPLACE FUNCTION deduplicate_chunks(ht_name TEXT, partition_columns TEXT, bot_id INT DEFAULT NULL)
RETURNS TABLE
(
chunk_schema name,
chunk_name name,
deleted_count INT
)
AS
$$
DECLARE
chunk RECORD;
where_clause TEXT := '';
deleted_count INT;
BEGIN
IF bot_id IS NOT NULL THEN
where_clause := FORMAT('WHERE bot_id = %s', bot_id);
END IF;
FOR chunk IN
SELECT c.chunk_schema, c.chunk_name
FROM timescaledb_information.chunks c
WHERE c.hypertable_name = ht_name
LOOP
EXECUTE FORMAT('
WITH cte AS (
SELECT ctid,
ROW_NUMBER() OVER (PARTITION BY %s ORDER BY %s ASC) AS row_num,
*
FROM %I.%I
%s
)
DELETE FROM %I.%I
WHERE ctid IN (
SELECT ctid
FROM cte
WHERE row_num > 1
)
RETURNING 1;
', partition_columns, partition_columns, chunk.chunk_schema, chunk.chunk_name, where_clause, chunk.chunk_schema,
chunk.chunk_name)
INTO deleted_count;
RETURN QUERY SELECT chunk.chunk_schema, chunk.chunk_name, COALESCE(deleted_count, 0);
END LOOP;
END
$$ LANGUAGE plpgsql;
SELECT *
FROM deduplicate_chunks('nudge_events', 'bot_id, session_id, nudge_id, time', 2540);
Shoutout to Mathias Ose and Christopher Piggott for this recipe.
Get faster JOIN queries with Common Table Expressions
Imagine there is a query that joins a hypertable to another table on a shared key:
SELECT timestamp,
FROM hypertable as h
JOIN related_table as rt
ON rt.id = h.related_table_id
WHERE h.timestamp BETWEEN '2024-10-10 00:00:00' AND '2024-10-17 00:00:00'
If you run EXPLAIN on this query, you see that the query planner performs a NestedJoin between these two tables, which means querying the hypertable multiple times. Even if the hypertable is well indexed, if it is also large, the query will be slow. How do you force a once-only lookup? Use materialized Common Table Expressions (CTEs).
If you split the query into two parts using CTEs, you can materialize the hypertable lookup and force Postgres to perform it only once.
WITH cached_query AS materialized (
SELECT *
FROM hypertable
WHERE BETWEEN '2024-10-10 00:00:00' AND '2024-10-17 00:00:00'
)
SELECT *
FROM cached_query as c
JOIN related_table as rt
ON rt.id = h.related_table_id
Now if you run EXPLAIN once again, you see that this query performs only one lookup. Depending on the size of your hypertable, this could result in a multi-hour query taking mere seconds.
Shoutout to Rowan Molony for this recipe.
IoT recipes
This section contains recipes for IoT issues:
Work with columnar IoT data
Narrow and medium width tables are a great way to store IoT data. A lot of reasons are outlined in Designing Your Database Schema: Wide vs. Narrow Postgres Tables.
One of the key advantages of narrow tables is that the schema does not have to change when you add new sensors. Another big advantage is that each sensor can sample at different rates and times. This helps support things like hysteresis, where new values are written infrequently unless the value changes by a certain amount.
Narrow table format example
Working with narrow table data structures presents a few challenges. In the IoT world one concern is that many data analysis approaches - including machine learning as well as more traditional data analysis - require that your data is resampled and synchronized to a common time basis. Fortunately, TimescaleDB provides you with hyperfunctions and other tools to help you work with this data.
An example of a narrow table format is:
| ts | sensor_id | value |
|---|---|---|
| 2024-10-31 11:17:30.000 | 1007 | 23.45 |
Typically you would couple this with a sensor table:
| sensor_id | sensor_name | units |
|---|---|---|
| 1007 | temperature | degreesC |
| 1012 | heat_mode | on/off |
| 1013 | cooling_mode | on/off |
| 1041 | occupancy | number of people in room |
A medium table retains the generic structure but adds columns of various types so that you can use the same table to store float, int, bool, or even JSON (jsonb) data:
| ts | sensor_id | d | i | b | t | j |
|---|---|---|---|---|---|---|
| 2024-10-31 11:17:30.000 | 1007 | 23.45 | null | null | null | null |
| 2024-10-31 11:17:47.000 | 1012 | null | null | TRUE | null | null |
| 2024-10-31 11:18:01.000 | 1041 | null | 4 | null | null | null |
To remove all-null entries, use an optional constraint such as:
CONSTRAINT at_least_one_not_null
CHECK ((d IS NOT NULL) OR (i IS NOT NULL) OR (b IS NOT NULL) OR (j IS NOT NULL) OR (t IS NOT NULL))
Get the last value of every sensor
There are several ways to get the latest value of every sensor. The following examples use the structure defined in Narrow table format example as a reference:
SELECT DISTINCT ON
If you have a list of sensors, the easy way to get the latest value of every sensor is to use
SELECT DISTINCT ON:
WITH latest_data AS (
SELECT DISTINCT ON (sensor_id) ts, sensor_id, d
FROM iot_data
WHERE d is not null
AND ts > CURRENT_TIMESTAMP - INTERVAL '1 week' -- important
ORDER BY sensor_id, ts DESC
)
SELECT
sensor_id, sensors.name, ts, d
FROM latest_data
LEFT OUTER JOIN sensors ON latest_data.sensor_id = sensors.id
WHERE latest_data.d is not null
ORDER BY sensor_id, ts; -- Optional, for displaying results ordered by sensor_id
The common table expression (CTE) used above is not strictly necessary. However, it is an elegant way to join to the sensor list to get a sensor name in the output. If this is not something you care about, you can leave it out:
SELECT DISTINCT ON (sensor_id) ts, sensor_id, d
FROM iot_data
WHERE d is not null
AND ts > CURRENT_TIMESTAMP - INTERVAL '1 week' -- important
ORDER BY sensor_id, ts DESC
It is important to take care when down-selecting this data. In the previous examples, the time that the query would scan back was limited. However, if there any sensors that have either not reported in a long time or in the worst case, never reported, this query devolves to a full table scan. In a database with 1000+ sensors and 41 million rows, an unconstrained query takes over an hour.
JOIN LATERAL
An alternative to SELECT DISTINCT ON is to use a JOIN LATERAL. By selecting your entire
sensor list from the sensors table rather than pulling the IDs out using SELECT DISTINCT, JOIN LATERAL can offer
some improvements in performance:
SELECT sensor_list.id, latest_data.ts, latest_data.d
FROM sensors sensor_list
-- Add a WHERE clause here to downselect the sensor list, if you wish
LEFT JOIN LATERAL (
SELECT ts, d
FROM iot_data raw_data
WHERE sensor_id = sensor_list.id
ORDER BY ts DESC
LIMIT 1
) latest_data ON true
WHERE latest_data.d is not null -- only pulling out float values ("d" column) in this example
AND latest_data.ts > CURRENT_TIMESTAMP - interval '1 week' -- important
ORDER BY sensor_list.id, latest_data.ts;
Limiting the time range is important, especially if you have a lot of data. Best practice is to use these kinds of queries for dashboards and quick status checks. To query over a much larger time range, encapsulate the previous example into a materialized query that refreshes infrequently, perhaps once a day.
Shoutout to Christopher Piggott for this recipe.
===== PAGE: https://docs.tigerdata.com/tutorials/blockchain-query/ =====
Query the Bitcoin blockchain
The financial industry is extremely data-heavy and relies on real-time and historical data for decision-making, risk assessment, fraud detection, and market analysis. Tiger Data simplifies management of these large volumes of data, while also providing you with meaningful analytical insights and optimizing storage costs.
In this tutorial, you use Tiger Cloud to ingest, store, and analyze transactions on the Bitcoin blockchain.
Blockchains are, at their essence, a distributed database. The transactions in a blockchain are an example of time-series data. You can use TimescaleDB to query transactions on a blockchain, in exactly the same way as you might query time-series transactions in any other database.
Steps in this tutorial
This tutorial covers:
- Ingest data into a service: set up and connect to a Tiger Cloud service, create tables and hypertables, and ingest data.
- Query your data: obtain information, including finding the most recent transactions on the blockchain, and gathering information about the transactions using aggregation functions.
- Compress your data using hypercore: compress data that is no longer needed for highest performance queries, but is still accessed regularly for real-time analytics.
When you've completed this tutorial, you can use the same dataset to Analyze the Bitcoin data, using TimescaleDB hyperfunctions.
===== PAGE: https://docs.tigerdata.com/tutorials/blockchain-analyze/ =====
Analyze the Bitcoin blockchain
The financial industry is extremely data-heavy and relies on real-time and historical data for decision-making, risk assessment, fraud detection, and market analysis. Tiger Data simplifies management of these large volumes of data, while also providing you with meaningful analytical insights and optimizing storage costs.
In this tutorial, you use Tiger Cloud to ingest, store, and analyze transactions on the Bitcoin blockchain.
Blockchains are, at their essence, a distributed database. The transactions in a blockchain are an example of time-series data. You can use TimescaleDB to query transactions on a blockchain, in exactly the same way as you might query time-series transactions in any other database.
Prerequisites
Before you begin, make sure you have:
- Signed up for a free Tiger Data account.
- [](#)Signed up for a Grafana account to graph your queries.
Steps in this tutorial
This tutorial covers:
About analyzing the Bitcoin blockchain with Tiger Cloud
This tutorial uses a sample Bitcoin dataset to show you how to aggregate blockchain transaction data, and construct queries to analyze information from the aggregations. The queries in this tutorial help you determine if a cryptocurrency has a high transaction fee, shows any correlation between transaction volumes and fees, or if it's expensive to mine.
It starts by setting up and connecting to a Tiger Cloud service, create tables,
and load data into the tables using psql. If you have already completed the
beginner blockchain tutorial, then you already have the
dataset loaded, and you can skip straight to the queries.
You then learn how to conduct analysis on your dataset using Timescale hyperfunctions. It walks you through creating a series of continuous aggregates, and querying the aggregates to analyze the data. You can also use those queries to graph the output in Grafana.
===== PAGE: https://docs.tigerdata.com/tutorials/financial-tick-data/ =====
Analyze financial tick data with TimescaleDB
The financial industry is extremely data-heavy and relies on real-time and historical data for decision-making, risk assessment, fraud detection, and market analysis. Tiger Data simplifies management of these large volumes of data, while also providing you with meaningful analytical insights and optimizing storage costs.
To analyze financial data, you can chart the open, high, low, close, and volume (OHLCV) information for a financial asset. Using this data, you can create candlestick charts that make it easier to analyze the price changes of financial assets over time. You can use candlestick charts to examine trends in stock, cryptocurrency, or NFT prices.
In this tutorial, you use real raw financial data provided by Twelve Data, create an aggregated candlestick view, query the aggregated data, and visualize the data in Grafana.
OHLCV data and candlestick charts
The financial sector regularly uses candlestick charts to visualize the price change of an asset. Each candlestick represents a time period, such as one minute or one hour, and shows how the asset's price changed during that time.
Candlestick charts are generated from the open, high, low, close, and volume data for each financial asset during the time period. This is often abbreviated as OHLCV:
- Open: opening price
- High: highest price
- Low: lowest price
- Close: closing price
- Volume: volume of transactions
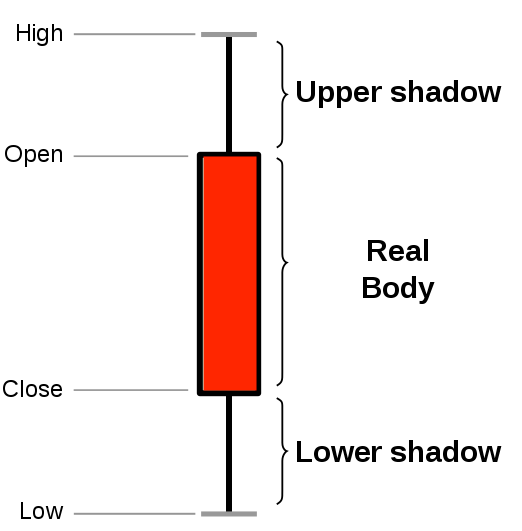
TimescaleDB is well suited to storing and analyzing financial candlestick data, and many Tiger Data community members use it for exactly this purpose. Check out these stories from some Tiger Datacommunity members:
- How Trading Strategy built a data stack for crypto quant trading
- How Messari uses data to open the cryptoeconomy to everyone
- How I power a (successful) crypto trading bot with TimescaleDB
Steps in this tutorial
This tutorial shows you how to ingest real-time time-series data into a Tiger Cloud service:
- Ingest data into a service: load data from Twelve Data into your TimescaleDB database.
- Query your dataset: create candlestick views, query the aggregated data, and visualize the data in Grafana.
- Compress your data using hypercore: learn how to store and query your financial tick data more efficiently using compression feature of TimescaleDB.
To create candlestick views, query the aggregated data, and visualize the data in Grafana, see the ingest real-time websocket data section.
===== PAGE: https://docs.tigerdata.com/tutorials/financial-ingest-real-time/ =====
Ingest real-time financial data using WebSocket
The financial industry is extremely data-heavy and relies on real-time and historical data for decision-making, risk assessment, fraud detection, and market analysis. Tiger Data simplifies management of these large volumes of data, while also providing you with meaningful analytical insights and optimizing storage costs.
This tutorial shows you how to ingest real-time time-series data into TimescaleDB using a websocket connection. The tutorial sets up a data pipeline to ingest real-time data from our data partner, Twelve Data. Twelve Data provides a number of different financial APIs, including stock, cryptocurrencies, foreign exchanges, and ETFs. It also supports websocket connections in case you want to update your database frequently. With websockets, you need to connect to the server, subscribe to symbols, and you can start receiving data in real-time during market hours.
When you complete this tutorial, you'll have a data pipeline set up that ingests real-time financial data into your Tiger Cloud.
This tutorial uses Python and the API wrapper library provided by Twelve Data.
Prerequisites
Before you begin, make sure you have:
- Signed up for a free Tiger Data account.
- Installed Python 3
- Signed up for Twelve Data. The free tier is perfect for this tutorial.
- Made a note of your Twelve Data API key.
Steps in this tutorial
This tutorial covers:
- Setting up your dataset: Load data from Twelve Data into your TimescaleDB database.
Querying your dataset: Create candlestick views, query the aggregated data, and visualize the data in Grafana.
This tutorial shows you how to ingest real-time time-series data into a Tiger Cloud service using a websocket connection. To create candlestick views, query the aggregated data, and visualize the data in Grafana.
About OHLCV data and candlestick charts
The financial sector regularly uses candlestick charts to visualize the price change of an asset. Each candlestick represents a time period, such as one minute or one hour, and shows how the asset's price changed during that time.
Candlestick charts are generated from the open, high, low, close, and volume data for each financial asset during the time period. This is often abbreviated as OHLCV:
- Open: opening price
- High: highest price
- Low: lowest price
- Close: closing price
- Volume: volume of transactions

TimescaleDB is well suited to storing and analyzing financial candlestick data, and many Tiger Datacommunity members use it for exactly this purpose.
===== PAGE: https://docs.tigerdata.com/api/hypertable/ =====
Hypertables and chunks
Tiger Cloud supercharges your real-time analytics by letting you run complex queries continuously, with near-zero latency. Under the hood, this is achieved by using hypertables—Postgres tables that automatically partition your time-series data by time and optionally by other dimensions. When you run a query, Tiger Cloud identifies the correct partition, called chunk, and runs the query on it, instead of going through the entire table.
Hypertables offer the following benefits:
Efficient data management with automated partitioning by time: Tiger Cloud splits your data into chunks that hold data from a specific time range. For example, one day or one week. You can configure this range to better suit your needs.
Better performance with strategic indexing: an index on time in the descending order is automatically created when you create a hypertable. More indexes are created on the chunk level, to optimize performance. You can create additional indexes, including unique indexes, on the columns you need.
Faster queries with chunk skipping: Tiger Cloud skips the chunks that are irrelevant in the context of your query, dramatically reducing the time and resources needed to fetch results. Even more—you can enable chunk skipping on non-partitioning columns.
Advanced data analysis with hyperfunctions: Tiger Cloud enables you to efficiently process, aggregate, and analyze significant volumes of data while maintaining high performance.
To top it all, there is no added complexity—you interact with hypertables in the same way as you would with regular Postgres tables. All the optimization magic happens behind the scenes.
Inheritance is not supported for hypertables and may lead to unexpected behavior.
For more information about using hypertables, including chunk size partitioning, see the hypertable section.
The hypertable workflow
Best practice for using a hypertable is to:
- Create a hypertable
Create a hypertable for your time-series data using CREATE TABLE.
For efficient queries on data in the columnstore, remember to segmentby the column you will
use most often to filter your data. For example:
CREATE TABLE conditions (
time TIMESTAMPTZ NOT NULL,
location TEXT NOT NULL,
device TEXT NOT NULL,
temperature DOUBLE PRECISION NULL,
humidity DOUBLE PRECISION NULL
) WITH (
tsdb.hypertable,
tsdb.partition_column='time',
tsdb.segmentby = 'device',
tsdb.orderby = 'time DESC'
);
If you are self-hosting TimescaleDB v2.19.3 and below, create a Postgres relational table, then convert it using create_hypertable. You then enable hypercore with a call to ALTER TABLE.
Set the columnstore policy
CALL add_columnstore_policy('conditions', after => INTERVAL '1d');
===== PAGE: https://docs.tigerdata.com/api/hypercore/ =====
Hypercore
Hypercore is a hybrid row-columnar storage engine in TimescaleDB. It is designed specifically for real-time analytics and powered by time-series data. The advantage of hypercore is its ability to seamlessly switch between row-oriented and column-oriented storage, delivering the best of both worlds:
Hypercore solves the key challenges in real-time analytics:
- High ingest throughput
- Low-latency ingestion
- Fast query performance
- Efficient handling of data updates and late-arriving data
- Streamlined data management
Hypercore’s hybrid approach combines the benefits of row-oriented and column-oriented formats:
Fast ingest with rowstore: new data is initially written to the rowstore, which is optimized for high-speed inserts and updates. This process ensures that real-time applications easily handle rapid streams of incoming data. Mutability—upserts, updates, and deletes happen seamlessly.
Efficient analytics with columnstore: as the data cools and becomes more suited for analytics, it is automatically converted to the columnstore. This columnar format enables fast scanning and aggregation, optimizing performance for analytical workloads while also saving significant storage space.
Faster queries on compressed data in columnstore: in the columnstore conversion, hypertable chunks are compressed by up to 98%, and organized for efficient, large-scale queries. Combined with chunk skipping, this helps you save on storage costs and keeps your queries operating at lightning speed.
Fast modification of compressed data in columnstore: just use SQL to add or modify data in the columnstore. TimescaleDB is optimized for superfast INSERT and UPSERT performance.
Full mutability with transactional semantics: regardless of where data is stored, hypercore provides full ACID support. Like in a vanilla Postgres database, inserts and updates to the rowstore and columnstore are always consistent, and available to queries as soon as they are completed.
For an in-depth explanation of how hypertables and hypercore work, see the Data model.
Since TimescaleDB v2.18.0
Hypercore workflow
Best practice for using hypercore is to:
- Enable columnstore
Create a hypertable for your time-series data using CREATE TABLE.
For efficient queries on data in the columnstore, remember to segmentby the column you will
use most often to filter your data. For example:
Use
CREATE TABLEfor a hypertableCREATE TABLE crypto_ticks ( "time" TIMESTAMPTZ, symbol TEXT, price DOUBLE PRECISION, day_volume NUMERIC ) WITH ( tsdb.hypertable, tsdb.partition_column='time', tsdb.segmentby='symbol', tsdb.orderby='time DESC' );If you are self-hosting TimescaleDB v2.19.3 and below, create a Postgres relational table, then convert it using create_hypertable. You then enable hypercore with a call to ALTER TABLE.
Use
ALTER MATERIALIZED VIEWfor a continuous aggregateALTER MATERIALIZED VIEW assets_candlestick_daily set ( timescaledb.enable_columnstore = true, timescaledb.segmentby = 'symbol' );
- Add a policy to move chunks to the columnstore at a specific time interval
For example, 7 days after the data was added to the table:
CALL add_columnstore_policy('crypto_ticks', after => INTERVAL '7d');
View the policies that you set or the policies that already exist
SELECT * FROM timescaledb_information.jobs WHERE proc_name='policy_compression';
See timescaledb_information.jobs.
You can also convert_to_columnstore and convert_to_rowstore manually for more fine-grained control over your data.
Limitations
Chunks in the columnstore have the following limitations:
ROW LEVEL SECURITYis not supported on chunks in the columnstore.
===== PAGE: https://docs.tigerdata.com/api/continuous-aggregates/ =====
Continuous aggregates
In modern applications, data usually grows very quickly. This means that aggregating it into useful summaries can become very slow. If you are collecting data very frequently, you might want to aggregate your data into minutes or hours instead. For example, if an IoT device takes temperature readings every second, you might want to find the average temperature for each hour. Every time you run this query, the database needs to scan the entire table and recalculate the average. TimescaleDB makes aggregating data lightning fast, accurate, and easy with continuous aggregates.
Continuous aggregates in TimescaleDB are a kind of hypertable that is refreshed automatically in the background as new data is added, or old data is modified. Changes to your dataset are tracked, and the hypertable behind the continuous aggregate is automatically updated in the background.
Continuous aggregates have a much lower maintenance burden than regular Postgres materialized views, because the whole view is not created from scratch on each refresh. This means that you can get on with working your data instead of maintaining your database.
Because continuous aggregates are based on hypertables, you can query them in exactly the same way as your other tables. This includes continuous aggregates in the rowstore, compressed into the columnstore, or tiered to object storage. You can even create continuous aggregates on top of your continuous aggregates, for an even more fine-tuned aggregation.
Real-time aggregation enables you to combine pre-aggregated data from the materialized view with the most recent raw data. This gives you up-to-date results on every query. In TimescaleDB v2.13 and later, real-time aggregates are DISABLED by default. In earlier versions, real-time aggregates are ENABLED by default; when you create a continuous aggregate, queries to that view include the results from the most recent raw data.
For more information about using continuous aggregates, see the documentation in Use Tiger Data products.
===== PAGE: https://docs.tigerdata.com/api/data-retention/ =====
Data retention
An intrinsic part of time-series data is that new data is accumulated and old data is rarely, if ever, updated. This means that the relevance of the data diminishes over time. It is therefore often desirable to delete old data to save disk space.
With TimescaleDB, you can manually remove old chunks of data or implement policies using these APIs.
For more information about creating a data retention policy, see the data retention section.
===== PAGE: https://docs.tigerdata.com/api/jobs-automation/ =====
Jobs
Jobs allow you to run functions and procedures implemented in a language of your choice on a schedule within Timescale. This allows automatic periodic tasks that are not covered by existing policies and even enhancing existing policies with additional functionality.
The following APIs and views allow you to manage the jobs that you create and get details around automatic jobs used by other TimescaleDB functions like continuous aggregation refresh policies and data retention policies. To view the policies that you set or the policies that already exist, see informational views.
===== PAGE: https://docs.tigerdata.com/api/uuid-functions/ =====
UUIDv7 functions
UUIDv7 is a time-ordered UUID that includes a Unix timestamp (with millisecond precision) in its first 48 bits. Like other UUIDs, it uses 6 bits for version and variant info, and the remaining 74 bits are random.

UUIDv7 is ideal anywhere you create lots of records over time, not only observability. Advantages are:
- No extra column required to partition by time with sortability: you can sort UUIDv7 instances by their value. This is useful for ordering records by creation time without the need for a separate timestamp column.
- Indexing performance: UUIDv7s increase with time, so new rows append near the end of a B-tree instead of This results in fewer page splits, less fragmentation, faster inserts, and efficient time-range scans.
- Easy keyset pagination:
WHERE id > :cursorand natural sharding. - UUID: safe across services, replicas, and unique across distributed systems.
UUIDv7 also increases query speed by reducing the number of chunks scanned during queries. For example, in a database with 25 million rows, the following query runs in 25 seconds:
WITH ref AS (SELECT now() AS t0)
SELECT count(*) AS cnt_ts_filter
FROM events e, ref
WHERE uuid_timestamp(e.event_id) >= ref.t0 - INTERVAL '2 days';
Using UUIDv7 excludes chunks at startup and reduces the query time to 550ms:
WITH ref AS (SELECT now() AS t0)
SELECT count(*) AS cnt_boundary_filter
FROM events e, ref
WHERE e.event_id >= to_uuidv7_boundary(ref.t0 - INTERVAL '2 days')
You use UUIDvs for events, orders, messages, uploads, runs, jobs, spans, and more.
Examples
- High-rate event logs for observability and metrics:
UUIDv7 gives you globally unique IDs (for traceability) and time windows (“last hour”), without the need for a
separate created_at column. UUIDv7 create less churn because inserts land at the end of the index, and you can
filter by time using UUIDv7 objects.
Last hour:
SELECT count(*) FROM logs WHERE id >= to_uuidv7_boundary(now() - interval '1 hour');Keyset pagination
SELECT * FROM logs WHERE id > to_uuidv7($last_seen'::timestamptz, true) ORDER BY id LIMIT 1000;Workflow / durable execution runs:
Each run needs a stable ID for joins and retries, and you often ask “what started since X?”. UUIDs help by serving both as the primary key and a time cursor across services. For example:
```sql
SELECT run_id, status
FROM runs
WHERE run_id >= to_uuidv7_boundary(now() - interval '5 minutes')
```
Orders / activity feeds / messages (SaaS apps):
Human-readable timestamps are not mandatory in a table. However, you still need time-ordered pages and day/week ranges. UUIDv7 enables clean date windows and cursor pagination with just the ID. For example:
SELECT * FROM orders WHERE id >= to_uuidv7('2025-08-01'::timestamptz, true) AND id < to_uuidv7('2025-08-02'::timestamptz, true) ORDER BY id;
Functions
- generate_uuidv7(): generate a version 7 UUID based on current time
- to_uuidv7(): create a version 7 UUID from a PostgreSQL timestamp
- to_uuidv7_boundary(): create a version 7 "boundary" UUID from a PostgreSQL timestamp
- uuid_timestamp(): extract a PostgreSQL timestamp from a version 7 UUID
- uuid_timestamp_micros(): extract a PostgreSQL timestamp with microsecond precision from a version 7 UUID
- uuid_version(): extract the version of a UUID
===== PAGE: https://docs.tigerdata.com/api/approximate_row_count/ =====
approximate_row_count()
Get approximate row count for hypertable, distributed hypertable, or regular Postgres table based on catalog estimates. This function supports tables with nested inheritance and declarative partitioning.
The accuracy of approximate_row_count depends on the database having up-to-date statistics about the table or hypertable, which are updated by VACUUM, ANALYZE, and a few DDL commands. If you have auto-vacuum configured on your table or hypertable, or changes to the table are relatively infrequent, you might not need to explicitly ANALYZE your table as shown below. Otherwise, if your table statistics are too out-of-date, running this command updates your statistics and yields more accurate approximation results.
Samples
Get the approximate row count for a single hypertable.
ANALYZE conditions;
SELECT * FROM approximate_row_count('conditions');
The expected output:
approximate_row_count
----------------------
240000
Required arguments
| Name | Type | Description |
|---|---|---|
relation |
REGCLASS | Hypertable or regular Postgres table to get row count for. |
===== PAGE: https://docs.tigerdata.com/api/first/ =====
first()
The first aggregate allows you to get the value of one column
as ordered by another. For example, first(temperature, time) returns the
earliest temperature value based on time within an aggregate group.
The last and first commands do not use indexes, they perform a sequential
scan through the group. They are primarily used for ordered selection within a
GROUP BY aggregate, and not as an alternative to an
ORDER BY time DESC LIMIT 1 clause to find the latest value, which uses
indexes.
Samples
Get the earliest temperature by device_id:
SELECT device_id, first(temp, time)
FROM metrics
GROUP BY device_id;
This example uses first and last with an aggregate filter, and avoids null values in the output:
SELECT
TIME_BUCKET('5 MIN', time_column) AS interv,
AVG(temperature) as avg_temp,
first(temperature,time_column) FILTER(WHERE time_column IS NOT NULL) AS beg_temp,
last(temperature,time_column) FILTER(WHERE time_column IS NOT NULL) AS end_temp
FROM sensors
GROUP BY interv
Required arguments
| Name | Type | Description |
|---|---|---|
value |
TEXT | The value to return |
time |
TIMESTAMP or INTEGER | The timestamp to use for comparison |
===== PAGE: https://docs.tigerdata.com/api/last/ =====
last()
The last aggregate allows you to get the value of one column
as ordered by another. For example, last(temperature, time) returns the
latest temperature value based on time within an aggregate group.
The last and first commands do not use indexes, they perform a sequential
scan through the group. They are primarily used for ordered selection within a
GROUP BY aggregate, and not as an alternative to an
ORDER BY time DESC LIMIT 1 clause to find the latest value, which uses
indexes.
Samples
Get the temperature every 5 minutes for each device over the past day:
SELECT device_id, time_bucket('5 minutes', time) AS interval,
last(temp, time)
FROM metrics
WHERE time > now () - INTERVAL '1 day'
GROUP BY device_id, interval
ORDER BY interval DESC;
This example uses first and last with an aggregate filter, and avoids null values in the output:
SELECT
TIME_BUCKET('5 MIN', time_column) AS interv,
AVG(temperature) as avg_temp,
first(temperature,time_column) FILTER(WHERE time_column IS NOT NULL) AS beg_temp,
last(temperature,time_column) FILTER(WHERE time_column IS NOT NULL) AS end_temp
FROM sensors
GROUP BY interv
Required arguments
| Name | Type | Description |
|---|---|---|
value |
ANY ELEMENT | The value to return |
time |
TIMESTAMP or INTEGER | The timestamp to use for comparison |
===== PAGE: https://docs.tigerdata.com/api/histogram/ =====
histogram()
The histogram() function represents the distribution of a set of
values as an array of equal-width buckets. It partitions the dataset
into a specified number of buckets (nbuckets) ranging from the
inputted min and max values.
The return value is an array containing nbuckets+2 buckets, with the
middle nbuckets bins for values in the stated range, the first
bucket at the head of the array for values under the lower min bound,
and the last bucket for values greater than or equal to the max bound.
Each bucket is inclusive on its lower bound, and exclusive on its upper
bound. Therefore, values equal to the min are included in the bucket
starting with min, but values equal to the max are in the last bucket.
Samples
A simple bucketing of device's battery levels from the readings dataset:
SELECT device_id, histogram(battery_level, 20, 60, 5)
FROM readings
GROUP BY device_id
LIMIT 10;
The expected output:
device_id | histogram
------------+------------------------------
demo000000 | {0,0,0,7,215,206,572}
demo000001 | {0,12,173,112,99,145,459}
demo000002 | {0,0,187,167,68,229,349}
demo000003 | {197,209,127,221,106,112,28}
demo000004 | {0,0,0,0,0,39,961}
demo000005 | {12,225,171,122,233,80,157}
demo000006 | {0,78,176,170,8,40,528}
demo000007 | {0,0,0,126,239,245,390}
demo000008 | {0,0,311,345,116,228,0}
demo000009 | {295,92,105,50,8,8,442}
Required arguments
| Name | Type | Description |
|---|---|---|
value |
ANY VALUE | A set of values to partition into a histogram |
min |
NUMERIC | The histogram's lower bound used in bucketing (inclusive) |
max |
NUMERIC | The histogram's upper bound used in bucketing (exclusive) |
nbuckets |
INTEGER | The integer value for the number of histogram buckets (partitions) |
===== PAGE: https://docs.tigerdata.com/api/time_bucket/ =====
time_bucket()
The time_bucket function is similar to the standard Postgres date_bin
function. Unlike date_bin, it allows for arbitrary time intervals of months or
longer. The return value is the bucket's start time.
Buckets are aligned to start at midnight in UTC+0. The time bucket size (bucket_width) can be set as INTERVAL or INTEGER. For INTERVAL-type bucket_width, you can change the time zone with the optional timezone parameter. In this case, the buckets are realigned to start at midnight in the time zone you specify.
Note that during shifts to and from daylight savings, the amount of data
aggregated into the corresponding buckets can be irregular. For example, if the
bucket_width is 2 hours, the number of bucketed hours is either three hours or one hour.
Samples
Simple five-minute averaging:
SELECT time_bucket('5 minutes', time) AS five_min, avg(cpu)
FROM metrics
GROUP BY five_min
ORDER BY five_min DESC LIMIT 10;
To report the middle of the bucket, instead of the left edge:
SELECT time_bucket('5 minutes', time) + '2.5 minutes'
AS five_min, avg(cpu)
FROM metrics
GROUP BY five_min
ORDER BY five_min DESC LIMIT 10;
For rounding, move the alignment so that the middle of the bucket is at the five-minute mark, and report the middle of the bucket:
SELECT time_bucket('5 minutes', time, '-2.5 minutes'::INTERVAL) + '2.5 minutes'
AS five_min, avg(cpu)
FROM metrics
GROUP BY five_min
ORDER BY five_min DESC LIMIT 10;
In this example, add the explicit cast to ensure that Postgres chooses the correct function.
To shift the alignment of the buckets, you can use the origin parameter passed as a timestamp, timestamptz, or date type. This example shifts the start of the week to a Sunday, instead of the default of Monday:
SELECT time_bucket('1 week', timetz, TIMESTAMPTZ '2017-12-31')
AS one_week, avg(cpu)
FROM metrics
GROUP BY one_week
WHERE time > TIMESTAMPTZ '2017-12-01' AND time < TIMESTAMPTZ '2018-01-03'
ORDER BY one_week DESC LIMIT 10;
The value of the origin parameter in this example is 2017-12-31, a Sunday
within the period being analyzed. However, the origin provided to the function
can be before, during, or after the data being analyzed. All buckets are
calculated relative to this origin. So, in this example, any Sunday could have
been used. Note that because time < TIMESTAMPTZ '2018-01-03' is used in this
example, the last bucket would have only 4 days of data. This cast to TIMESTAMP
converts the time to local time according to the server's time zone setting.
SELECT time_bucket(INTERVAL '2 hours', timetz::TIMESTAMP)
AS five_min, avg(cpu)
FROM metrics
GROUP BY five_min
ORDER BY five_min DESC LIMIT 10;
Bucket temperature values to calculate the average monthly temperature. Set the time zone to 'Europe/Berlin' so bucket start and end times are aligned to midnight in Berlin.
SELECT time_bucket('1 month', ts, 'Europe/Berlin') AS month_bucket,
avg(temperature) AS avg_temp
FROM weather
GROUP BY month_bucket
ORDER BY month_bucket DESC LIMIT 10;
Required arguments for interval time inputs
|Name|Type|Description|
|-|-|-|
|bucket_width|INTERVAL|A Postgres time interval for how long each bucket is|
|ts|DATE, TIMESTAMP, or TIMESTAMPTZ|The timestamp to bucket|
If you use months as an interval for bucket_width, you cannot combine it with
a non-month component. For example, 1 month and 3 months are both valid
bucket widths, but 1 month 1 day and 3 months 2 weeks are not.
Optional arguments for interval time inputs
|Name|Type| Description |
|-|-|------------------------------------------------------------------------------------------------------------------------------------------------------------------------------------------------------------------------------------------------------------------------------------------------|
|timezone|TEXT| The time zone for calculating bucket start and end times. Can only be used with TIMESTAMPTZ. Defaults to UTC+0. |
|origin|DATE, TIMESTAMP, or TIMESTAMPTZ| Buckets are aligned relative to this timestamp. Defaults to midnight on January 3, 2000, for buckets that don't include a month or year interval, and to midnight on January 1, 2000, for month, year, and century buckets. |
|offset|INTERVAL| The time interval to offset all time buckets by. A positive value shifts bucket start and end times later. A negative value shifts bucket start and end times earlier. offset must be surrounded with double quotes when used as a named argument, because it is a reserved key word in Postgres. |
Required arguments for integer time inputs
|Name|Type|Description|
|-|-|-|
|bucket_width|INTEGER|The bucket width|
|ts|INTEGER|The timestamp to bucket|
Optional arguments for integer time inputs
|Name|Type|Description|
|-|-|-|
|offset|INTEGER|The amount to offset all buckets by. A positive value shifts bucket start and end times later. A negative value shifts bucket start and end times earlier. offset must be surrounded with double quotes when used as a named argument, because it is a reserved key word in Postgres.|
===== PAGE: https://docs.tigerdata.com/api/time_bucket_ng/ =====
timescaledb_experimental.time_bucket_ng()
The time_bucket_ng() function is an experimental version of the
time_bucket() function. It introduced some new capabilities,
such as monthly buckets and timezone support. Those features are now part of the
regular time_bucket() function.
This section describes a feature that is deprecated. We strongly recommend that you do not use this feature in a production environment. If you need more information, contact us.
The time_bucket() and time_bucket_ng() functions are similar, but not
completely compatible. There are two main differences.
Firstly, time_bucket_ng() doesn't work with timestamps prior to origin,
while time_bucket() does.
Secondly, the default origin values differ. time_bucket() uses an origin
date of January 3, 2000, for buckets shorter than a month. time_bucket_ng()
uses an origin date of January 1, 2000, for all bucket sizes.
Samples
In this example, time_bucket_ng() is used to create bucket data in three month
intervals:
SELECT timescaledb_experimental.time_bucket_ng('3 month', date '2021-08-01');
time_bucket_ng
----------------
2021-07-01
(1 row)
This example uses time_bucket_ng() to bucket data in one year intervals:
SELECT timescaledb_experimental.time_bucket_ng('1 year', date '2021-08-01');
time_bucket_ng
----------------
2021-01-01
(1 row)
To split time into buckets, time_bucket_ng() uses a starting point in time
called origin. The default origin is 2000-01-01. time_bucket_ng cannot use
timestamps earlier than origin:
SELECT timescaledb_experimental.time_bucket_ng('100 years', timestamp '1988-05-08');
ERROR: origin must be before the given date
Going back in time from origin isn't usually possible, especially when you
consider timezones and daylight savings time (DST). Note also that there is no
reasonable way to split time in variable-sized buckets (such as months) from an
arbitrary origin, so origin defaults to the first day of the month.
To bypass named limitations, you can override the default origin:
-- working with timestamps before 2000-01-01
SELECT timescaledb_experimental.time_bucket_ng('100 years', timestamp '1988-05-08', origin => '1900-01-01');
time_bucket_ng
---------------------
1900-01-01 00:00:00
-- unlike the default origin, which is Saturday, 2000-01-03 is Monday
SELECT timescaledb_experimental.time_bucket_ng('1 week', timestamp '2021-08-26', origin => '2000-01-03');
time_bucket_ng
---------------------
2021-08-23 00:00:00
This example shows how time_bucket_ng() is used to bucket data
by months in a specified timezone:
-- note that timestamptz is displayed differently depending on the session parameters
SET TIME ZONE 'Europe/Moscow';
SET
SELECT timescaledb_experimental.time_bucket_ng('1 month', timestamptz '2001-02-03 12:34:56 MSK', timezone => 'Europe/Moscow');
time_bucket_ng
------------------------
2001-02-01 00:00:00+03
You can use time_bucket_ng() with continuous aggregates. This example tracks
the temperature in Moscow over seven day intervals:
CREATE TABLE conditions(
day DATE NOT NULL,
city text NOT NULL,
temperature INT NOT NULL);
SELECT create_hypertable(
'conditions', by_range('day', INTERVAL '1 day')
);
INSERT INTO conditions (day, city, temperature) VALUES
('2021-06-14', 'Moscow', 26),
('2021-06-15', 'Moscow', 22),
('2021-06-16', 'Moscow', 24),
('2021-06-17', 'Moscow', 24),
('2021-06-18', 'Moscow', 27),
('2021-06-19', 'Moscow', 28),
('2021-06-20', 'Moscow', 30),
('2021-06-21', 'Moscow', 31),
('2021-06-22', 'Moscow', 34),
('2021-06-23', 'Moscow', 34),
('2021-06-24', 'Moscow', 34),
('2021-06-25', 'Moscow', 32),
('2021-06-26', 'Moscow', 32),
('2021-06-27', 'Moscow', 31);
CREATE MATERIALIZED VIEW conditions_summary_weekly
WITH (timescaledb.continuous) AS
SELECT city,
timescaledb_experimental.time_bucket_ng('7 days', day) AS bucket,
MIN(temperature),
MAX(temperature)
FROM conditions
GROUP BY city, bucket;
SELECT to_char(bucket, 'YYYY-MM-DD'), city, min, max
FROM conditions_summary_weekly
ORDER BY bucket;
to_char | city | min | max
------------+--------+-----+-----
2021-06-12 | Moscow | 22 | 27
2021-06-19 | Moscow | 28 | 34
2021-06-26 | Moscow | 31 | 32
(3 rows)
The by_range dimension builder is an addition to TimescaleDB
2.13. For simpler cases, like this one, you can also create the
hypertable using the old syntax:
SELECT create_hypertable('', '<time column name>');
For more information, see the continuous aggregates documentation.
While time_bucket_ng() supports months and timezones,
continuous aggregates cannot always be used with monthly
buckets or buckets with timezones.
This table shows which time_bucket_ng() functions can be used in a continuous aggregate:
|Function|Available in continuous aggregate|TimescaleDB version| |-|-|-| |Buckets by seconds, minutes, hours, days, and weeks|✅|2.4.0 - 2.14.2| |Buckets by months and years|✅|2.6.0 - 2.14.2| |Timezones support|✅|2.6.0 - 2.14.2| |Specify custom origin|✅|2.7.0 - 2.14.2|
Required arguments
| Name | Type | Description |
|---|---|---|
bucket_width |
INTERVAL | A Postgres time interval for how long each bucket is |
ts |
DATE, TIMESTAMP or TIMESTAMPTZ | The timestamp to bucket |
Optional arguments
| Name | Type | Description |
|---|---|---|
origin |
Should be the same as ts |
Buckets are aligned relative to this timestamp |
timezone |
TEXT | The name of the timezone. The argument can be specified only if the type of ts is TIMESTAMPTZ |
For backward compatibility with time_bucket() the timezone argument is
optional. However, it is required for time buckets that are less than 24 hours.
If you call the TIMESTAMPTZ-version of the function without the timezone
argument, the timezone defaults to the session's timezone and so the function
can't be used with continuous aggregates. Best practice is to use
time_bucket_ng(interval, timestamptz, text) and specify the timezone.
Returns
The function returns the bucket's start time. The return value type is the
same as ts.
===== PAGE: https://docs.tigerdata.com/api/days_in_month/ =====
days_in_month()
Given a timestamptz, returns how many days are in that month.
Samples
Calculate how many days in the month of January 1, 2022:
SELECT days_in_month('2021-01-01 00:00:00+03'::timestamptz)
The output looks like this:
days_in_month
----------------------
31
Required arguments
|Name|Type|Description|
|-|-|-|
|date|TIMESTAMPTZ|Timestamp to use to calculate how many days in the month|
===== PAGE: https://docs.tigerdata.com/api/month_normalize/ =====
month_normalize()
Translate a metric to a standard month. A standard month is calculated as the exact number of days in a year divided by the number of months in a year, so 365.25/12 = 30.4375. month_normalize() divides a metric by the number of days in the corresponding calendar month and multiplies it by 30.4375.
This enables you to compare metrics for different months and decide which one performed better, objectively. For example, in the following table that summarizes the number of sales for three months, January has the highest number of total sales:
| Month | Sales |
|---|---|
| Jan | 3000 |
| Feb | 2900 |
| Mar | 2900 |
When you normalize the sales metrics, you get the following result, showing that February in fact performed better:
| Month | Normalized sales |
|---|---|
| Jan | 2945.56 |
| Feb | 3152.46 |
| Mar | 2847.38 |
Samples
Get the normalized value for a metric of 1000, and a reference date of January 1, 2021:
SELECT month_normalize(1000,'2021-01-01 00:00:00+03'::timestamptz)
The output looks like this:
month_normalize
----------------------
981.8548387096774
Required arguments
|Name|Type|Description|
|-|-|-|
|metric|float8||
|reference_date|TIMESTAMPTZ|Timestamp to normalize the metric with|
|days|float8|Optional, defaults to 365.25/12 if none provided|
===== PAGE: https://docs.tigerdata.com/api/gauge_agg/ =====
gauge_agg()
Produces a GaugeSummary that can be used to accumulate gauge data for further
calculations.
gauge_agg (
ts TIMESTAMPTZ,
value DOUBLE PRECISION
) RETURNS GaugeSummary
Experimental features could have bugs. They might not be backwards compatible, and could be removed in future releases. Use these features at your own risk, and do not use any experimental features in production.
For more information about counter and gauge aggregation functions, see the hyperfunctions documentation.
Required arguments
|Name|Type|Description
|-|-|-|
|ts|TIMESTAMPTZ|The time at each point|
|value|DOUBLE PRECISION|The value at that timestamp|
Only DOUBLE PRECISION values are accepted for the value parameter. For gauge
data stored as other numeric types, cast it to DOUBLE PRECISION when using the
function.
If there are NULL values in your data, the aggregate ignores them and
aggregates only non-NULL values. If you only have NULL values, the aggregate
returns NULL.
Optional arguments
|Name|Type|Description|
|-|-|-|
|bounds|TSTZRANGE|The largest and smallest possible times that can be input to the aggregate. Calling with NULL, or leaving out the argument, results in an unbounded GaugeSummary|
Bounds are required for extrapolation, but not for other accessor functions.
Returns
|Column|Type|Description|
|-|-|-|
|gauge_agg|GaugeSummary|A GaugeSummary object that can be passed to accessor functions or other objects in the gauge aggregate API|
The returned GaugeSummary can be used as an input the accessor functions
delta, idelta_left, and idelta_right. When this feature is mature, it will support
all the same accessor functions as CounterSummary, with the exception of
num_resets.
Sample usage
Create a gauge summary from time-series data that has a timestamp, ts, and a
gauge value, val. Get the instantaneous rate of change from the last 2 time
intervals using the irate_right accessor:
WITH t as (
SELECT
time_bucket('1 day'::interval, ts) as dt,
gauge_agg(ts, val) AS gs
FROM foo
WHERE id = 'bar'
GROUP BY time_bucket('1 day'::interval, ts)
)
SELECT
dt,
irate_right(gs)
FROM t;
===== PAGE: https://docs.tigerdata.com/api/frequency-analysis/ =====
Frequency analysis
This section includes frequency aggregate APIs, which find the most common elements out of a set of vastly more varied values.
For these hyperfunctions, you need to install the TimescaleDB Toolkit Postgres extension.
<HyperfunctionTable
hyperfunctionFamily='frequency analysis'
includeExperimental
sortByType
/>
===== PAGE: https://docs.tigerdata.com/api/informational-views/ =====
Information views
TimescaleDB makes complex database features like partitioning and data retention easy to use with our comprehensive APIs. TimescaleDB works hard to provide detailed information about the state of your data, hypertables, chunks, and any jobs or policies you have in place.
These views provide the data and statistics you need to keep track of your database.
===== PAGE: https://docs.tigerdata.com/api/configuration/ =====
Service configuration
Tiger Cloud service use the default Postgres server configuration settings. You can optimize your service configuration using the following TimescaleDB and Grand Unified Configuration (GUC) parameters.
===== PAGE: https://docs.tigerdata.com/api/administration/ =====
Administrative functions
These administrative APIs help you prepare a database before and after a restore event. They also help you keep track of your TimescaleDB setup data.
Dump TimescaleDB meta data
To help when asking for support and reporting bugs, TimescaleDB includes an SQL dump script. It outputs metadata from the internal TimescaleDB tables, along with version information.
This script is available in the source distribution in scripts/. To use it, run:
psql [your connect flags] -d your_timescale_db < dump_meta_data.sql > dumpfile.txt
Inspect dumpfile.txt before sending it together with a bug report or support question.
get_telemetry_report()
Returns the background telemetry string sent to Tiger Data.
If telemetry is turned off, it sends the string that would be sent if telemetry were enabled.
Sample usage
View the telemetry report:
SELECT get_telemetry_report();
timescaledb_post_restore()
Perform the required operations after you have finished restoring the database using pg_restore. Specifically, this resets the timescaledb.restoring GUC and restarts any background workers.
For more information, see Migrate using pg_dump and pg_restore.
Sample usage
Prepare the database for normal use after a restore:
SELECT timescaledb_post_restore();
timescaledb_pre_restore()
Perform the required operations so that you can restore the database using pg_restore. Specifically, this sets the timescaledb.restoring GUC to on and stops any background workers which could have been performing tasks.
The background workers are stopped until the timescaledb_post_restore() function is run, after the restore operation is complete.
For more information, see Migrate using pg_dump and pg_restore.
After using timescaledb_pre_restore(), you need to run timescaledb_post_restore() before you can use the database normally.
Sample usage
Prepare to restore the database:
SELECT timescaledb_pre_restore();
===== PAGE: https://docs.tigerdata.com/api/api-tag-overview/ =====
API reference tag overview
The TimescaleDB API Reference uses tags to categorize functions. The tags are
Community, Experimental, Toolkit, and Experimental (Toolkit). This
section explains each tag.
Community Community
This tag indicates that the function is available under TimescaleDB Community Edition, and are not available under the Apache 2 Edition. For more information, visit our TimescaleDB License comparison sheet.
Experimental (TimescaleDB Experimental Schema) Experimental
This tag indicates that the function is included in the TimescaleDB experimental schema. Do not use experimental functions in production. Experimental features could include bugs, and are likely to change in future versions. The experimental schema is used by TimescaleDB to develop new features more quickly. If experimental functions are successful, they can move out of the experimental schema and go into production use.
When you upgrade the timescaledb extension, the experimental schema is removed
by default. To use experimental features after an upgrade, you need to add the
experimental schema again.
For more information about the experimental schema, [read the Tiger Data blog post][experimental-blog].
Toolkit Toolkit
This tag indicates that the function is included in the TimescaleDB Toolkit extension. Toolkit functions are available under TimescaleDB Community Edition. For installation instructions, see the installation guide.
Experimental (TimescaleDB Toolkit) Experimental
This tag is used with the Toolkit tag. It indicates a Toolkit function that is under active development. Do not use experimental toolkit functions in production. Experimental toolkit functions could include bugs, and are likely to change in future versions.
These functions might not correctly handle unusual use cases or errors, and they could have poor performance. Updates to the TimescaleDB extension drop database objects that depend on experimental features like this function. If you use experimental toolkit functions on Timescale, this function is automatically dropped when the Toolkit extension is updated. For more information, see the TimescaleDB Toolkit docs.
===== PAGE: https://docs.tigerdata.com/api/api-reference/ =====
Tiger Cloud REST API reference
A comprehensive RESTful API for managing Tiger Cloud resources including VPCs, services, and read replicas.
Overview
API Version: 1.0.0
Base URL: https://console.cloud.timescale.com/public/api/v1
Authentication
The Tiger REST API uses HTTP Basic Authentication. Include your access key and secret key in the Authorization header.
Basic Authentication
Authorization: Basic <base64(access_key:secret_key)>
Example
curl -X GET "https://console.cloud.timescale.com/public/api/v1/projects/{project_id}/services" \
-H "Authorization: Basic $(echo -n 'your_access_key:your_secret_key' | base64)"
Service Management
You use this endpoint to create a Tiger Cloud service with one of more of the following addons:
time-series: a Tiger Cloud service optimized for real-time analytics. For time-stamped data like events, prices, metrics, sensor readings, or any information that changes over time.ai: a Tiger Cloud service instance with vector extensions.
To have multiple addons when you create a new service, set "addons": ["time-series", "ai"]. To create a
vanilla Postgres instance, set addons to an empty list [].
List All Services
GET /projects/{project_id}/services
Retrieve all services within a project.
Response: 200 OK
[
{
"service_id": "p7zm9wqqii",
"project_id": "jz22xtzemv",
"name": "my-production-db",
"region_code": "eu-central-1",
"service_type": "TIMESCALEDB",
"status": "READY",
"created": "2024-01-15T10:30:00Z",
"paused": false,
"resources": [
{
"id": "resource-1",
"spec": {
"cpu_millis": 1000,
"memory_gbs": 4,
"volume_type": "gp2"
}
}
],
"endpoint": {
"host": "my-service.com",
"port": 5432
}
}
]
Create a Service
POST /projects/{project_id}/services
Create a new Tiger Cloud service. This is an asynchronous operation.
Request Body:
{
"name": "test-2",
"addons": ["time-series"],
"region_code": "eu-central-1",
"cpu_millis": 1000,
"memory_gbs": 4
}
Response: 202 Accepted
{
"service_id": "p7zm9wqqii",
"project_id": "jz22xtzemv",
"name": "test-2",
"region_code": "eu-central-1",
"service_type": "TIMESCALEDB",
"created": "2025-09-04T20:46:46.265680278Z",
"paused": false,
"status": "READY",
"resources": [
{
"id": "100927",
"spec": {
"cpu_millis": 1000,
"memory_gbs": 4,
"volume_type": ""
}
}
],
"metadata": {
"environment": "PROD"
},
"endpoint": {
"host": "p7zm8wqqii.jz4qxtzemv.tsdb.cloud.timescale.com",
"port": 35482
},
"initial_password": "oamv8ch9t4ar2j8g"
}
Service Types:
TIMESCALEDB: a Tiger Cloud service instance optimized for real-time analytics service For time-stamped data like events, prices, metrics, sensor readings, or any information that changes over timePOSTGRES: a vanilla Postgres instanceVECTOR: a Tiger Cloud service instance with vector extensions
Get a Service
GET /projects/{project_id}/services/{service_id}
Retrieve details of a specific service.
Response: 200 OK
{
"service_id": "p7zm9wqqii",
"project_id": "jz22xtzemv",
"name": "test-2",
"region_code": "eu-central-1",
"service_type": "TIMESCALEDB",
"created": "2025-09-04T20:46:46.26568Z",
"paused": false,
"status": "READY",
"resources": [
{
"id": "100927",
"spec": {
"cpu_millis": 1000,
"memory_gbs": 4,
"volume_type": ""
}
}
],
"metadata": {
"environment": "DEV"
},
"endpoint": {
"host": "p7zm8wqqii.jz4qxtzemv.tsdb.cloud.timescale.com",
"port": 35482
}
}
Service Status:
QUEUED: Service creation is queuedDELETING: Service is being deletedCONFIGURING: Service is being configuredREADY: Service is ready for useDELETED: Service has been deletedUNSTABLE: Service is in an unstable statePAUSING: Service is being pausedPAUSED: Service is pausedRESUMING: Service is being resumedUPGRADING: Service is being upgradedOPTIMIZING: Service is being optimized
Delete a Service
DELETE /projects/{project_id}/services/{service_id}
Delete a specific service. This is an asynchronous operation.
Response: 202 Accepted
Resize a Service
POST /projects/{project_id}/services/{service_id}/resize
Change CPU and memory allocation for a service.
Request Body:
{
"cpu_millis": 2000,
"memory_gbs": 8
}
Response: 202 Accepted
Update Service Password
POST /projects/{project_id}/services/{service_id}/updatePassword
Set a new master password for the service.
Request Body:
{
"password": "a-very-secure-new-password"
}
Response: 204 No Content
Set Service Environment
POST /projects/{project_id}/services/{service_id}/setEnvironment
Set the environment type for the service.
Request Body:
{
"environment": "PROD"
}
Environment Values:
PROD: Production environmentDEV: Development environment
Response: 200 OK
{
"message": "Environment set successfully"
}
Configure High Availability
POST /projects/{project_id}/services/{service_id}/setHA
Change the HA configuration for a service. This is an asynchronous operation.
Request Body:
{
"replica_count": 1
}
Response: 202 Accepted
Connection Pooler Management
Enable Connection Pooler
POST /projects/{project_id}/services/{service_id}/enablePooler
Activate the connection pooler for a service.
Response: 200 OK
{
"message": "Connection pooler enabled successfully"
}
Disable Connection Pooler
POST /projects/{project_id}/services/{service_id}/disablePooler
Deactivate the connection pooler for a service.
Response: 200 OK
{
"message": "Connection pooler disabled successfully"
}
Fork a Service
POST /projects/{project_id}/services/{service_id}/forkService
Create a new, independent service by taking a snapshot of an existing one.
Request Body:
{
"name": "fork-test2",
"region_code": "eu-central-1",
"cpu_millis": 1000,
"memory_gbs": 4
}
Response: 202 Accepted
{
"service_id": "otewd3pem2",
"project_id": "jz22xtzemv",
"name": "fork-test2",
"region_code": "eu-central-1",
"service_type": "TIMESCALEDB",
"created": "2025-09-04T20:54:09.53380732Z",
"paused": false,
"status": "READY",
"resources": [
{
"id": "100929",
"spec": {
"cpu_millis": 1000,
"memory_gbs": 4,
"volume_type": ""
}
}
],
"forked_from": {
"project_id": "jz22xtzemv",
"service_id": "p7zm9wqqii",
"is_standby": false
},
"initial_password": "ph33bl5juuri5gem"
}
Read Replica Sets
Manage read replicas for improved read performance.
List Read Replica Sets
GET /projects/{project_id}/services/{service_id}/replicaSets
Retrieve all read replica sets associated with a primary service.
Response: 200 OK
[
{
"id": "l5alxb3s2g",
"name": "replica-set-test2",
"status": "active",
"nodes": 1,
"cpu_millis": 1000,
"memory_gbs": 4,
"endpoint": {
"host": "l5alxb3s2g.jz4qxtzemv.tsdb.cloud.timescale.com",
"port": 38448
},
"connection_pooler": {
"endpoint": {
"host": "l5alxb3s2g.jz4qxtzemv.tsdb.cloud.timescale.com",
"port": 38543
}
},
"metadata": {
"environment": "DEV"
}
}
]
Replica Set Status:
creating: Replica set is being createdactive: Replica set is active and readyresizing: Replica set is being resizeddeleting: Replica set is being deletederror: Replica set encountered an error
Create a Read Replica Set
POST /projects/{project_id}/services/{service_id}/replicaSets
Create a new read replica set. This is an asynchronous operation.
Request Body:
{
"name": "replica-set-test2",
"cpu_millis": 1000,
"memory_gbs": 4,
"nodes": 1
}
Response: 202 Accepted
{
"id": "dsldm715t2",
"name": "replica-set-test2",
"status": "active",
"nodes": 1,
"cpu_millis": 1000,
"memory_gbs": 4
}
Delete a Read Replica Set
DELETE /projects/{project_id}/services/{service_id}/replicaSets/{replica_set_id}
Delete a specific read replica set. This is an asynchronous operation.
Response: 202 Accepted
Resize a Read Replica Set
POST /projects/{project_id}/services/{service_id}/replicaSets/{replica_set_id}/resize
Change resource allocation for a read replica set. This operation is async.
Request Body:
{
"cpu_millis": 500,
"memory_gbs": 2,
"nodes": 2
}
Response: 202 Accepted
{
"message": "Replica set resize request accepted"
}
Read Replica Set Connection Pooler
Enable Replica Set Pooler
POST /projects/{project_id}/services/{service_id}/replicaSets/{replica_set_id}/enablePooler
Activate the connection pooler for a read replica set.
Response: 200 OK
{
"message": "Connection pooler enabled successfully"
}
Disable Replica Set Pooler
POST /projects/{project_id}/services/{service_id}/replicaSets/{replica_set_id}/disablePooler
Deactivate the connection pooler for a read replica set.
Response: 200 OK
{
"message": "Connection pooler disabled successfully"
}
Set Replica Set Environment
POST /projects/{project_id}/services/{service_id}/replicaSets/{replica_set_id}/setEnvironment
Set the environment type for a read replica set.
Request Body:
{
"environment": "PROD"
}
Response: 200 OK
{
"message": "Environment set successfully"
}
VPC Management
Virtual Private Clouds (VPCs) provide network isolation for your TigerData services.
List All VPCs
GET /projects/{project_id}/vpcs
List all Virtual Private Clouds in a project.
Response: 200 OK
[
{
"id": "1234567890",
"name": "my-production-vpc",
"cidr": "10.0.0.0/16",
"region_code": "eu-central-1"
}
]
Create a VPC
POST /projects/{project_id}/vpcs
Create a new VPC.
Request Body:
{
"name": "my-production-vpc",
"cidr": "10.0.0.0/16",
"region_code": "eu-central-1"
}
Response: 201 Created
{
"id": "1234567890",
"name": "my-production-vpc",
"cidr": "10.0.0.0/16",
"region_code": "eu-central-1"
}
Get a VPC
GET /projects/{project_id}/vpcs/{vpc_id}
Retrieve details of a specific VPC.
Response: 200 OK
{
"id": "1234567890",
"name": "my-production-vpc",
"cidr": "10.0.0.0/16",
"region_code": "eu-central-1"
}
Rename a VPC
POST /projects/{project_id}/vpcs/{vpc_id}/rename
Update the name of a specific VPC.
Request Body:
{
"name": "my-renamed-vpc"
}
Response: 200 OK
{
"id": "1234567890",
"name": "my-renamed-vpc",
"cidr": "10.0.0.0/16",
"region_code": "eu-central-1"
}
Delete a VPC
DELETE /projects/{project_id}/vpcs/{vpc_id}
Delete a specific VPC.
Response: 204 No Content
VPC Peering
Manage peering connections between VPCs across different accounts and regions.
List VPC Peerings
GET /projects/{project_id}/vpcs/{vpc_id}/peerings
Retrieve all VPC peering connections for a given VPC.
Response: 200 OK
[
{
"id": "1234567890",
"peer_account_id": "acc-12345",
"peer_region_code": "eu-central-1",
"peer_vpc_id": "1234567890",
"provisioned_id": "1234567890",
"status": "active",
"error_message": null
}
]
Create VPC Peering
POST /projects/{project_id}/vpcs/{vpc_id}/peerings
Create a new VPC peering connection.
Request Body:
{
"peer_account_id": "acc-12345",
"peer_region_code": "eu-central-1",
"peer_vpc_id": "1234567890"
}
Response: 201 Created
{
"id": "1234567890",
"peer_account_id": "acc-12345",
"peer_region_code": "eu-central-1",
"peer_vpc_id": "1234567890",
"provisioned_id": "1234567890",
"status": "pending"
}
Get VPC Peering
GET /projects/{project_id}/vpcs/{vpc_id}/peerings/{peering_id}
Retrieve details of a specific VPC peering connection.
Delete VPC Peering
DELETE /projects/{project_id}/vpcs/{vpc_id}/peerings/{peering_id}
Delete a specific VPC peering connection.
Response: 204 No Content
Service VPC Operations
Attach Service to VPC
POST /projects/{project_id}/services/{service_id}/attachToVPC
Associate a service with a VPC.
Request Body:
{
"vpc_id": "1234567890"
}
Response: 202 Accepted
Detach Service from VPC
POST /projects/{project_id}/services/{service_id}/detachFromVPC
Disassociate a service from its VPC.
Request Body:
{
"vpc_id": "1234567890"
}
Response: 202 Accepted
Data Models
VPC Object
{
"id": "string",
"name": "string",
"cidr": "string",
"region_code": "string"
}
Service Object
{
"service_id": "string",
"project_id": "string",
"name": "string",
"region_code": "string",
"service_type": "TIMESCALEDB|POSTGRES|VECTOR",
"created": "2024-01-15T10:30:00Z",
"initial_password": "string",
"paused": false,
"status": "READY|CONFIGURING|QUEUED|...",
"resources": [
{
"id": "string",
"spec": {
"cpu_millis": 1000,
"memory_gbs": 4,
"volume_type": "string"
}
}
],
"metadata": {
"environment": "PROD|DEV"
},
"endpoint": {
"host": "string",
"port": 5432
},
"connection_pooler": {
"endpoint": {
"host": "string",
"port": 5432
}
}
}
Peering Object
{
"id": "string",
"peer_account_id": "string",
"peer_region_code": "string",
"peer_vpc_id": "string",
"provisioned_id": "string",
"status": "string",
"error_message": "string"
}
Read Replica Set Object
{
"id": "string",
"name": "string",
"status": "creating|active|resizing|deleting|error",
"nodes": 2,
"cpu_millis": 1000,
"memory_gbs": 4,
"metadata": {
"environment": "PROD|DEV"
},
"endpoint": {
"host": "string",
"port": 5432
},
"connection_pooler": {
"endpoint": {
"host": "string",
"port": 5432
}
}
}
Error Handling
Tiger Cloud REST API uses standard HTTP status codes and returns error details in JSON format.
Error Response Format
{
"code": "ERROR_CODE",
"message": "Human-readable error description"
}
Common Error Codes
400 Bad Request: Invalid request parameters or malformed JSON401 Unauthorized: Missing or invalid authentication credentials403 Forbidden: Insufficient permissions for the requested operation404 Not Found: Requested resource does not exist409 Conflict: Request conflicts with current resource state500 Internal Server Error: Unexpected server error
Example Error Response
{
"code": "INVALID_REQUEST",
"message": "The service_type field is required"
}
===== PAGE: https://docs.tigerdata.com/api/glossary/ =====
Tiger Data glossary of terms
This glossary defines technical terms, concepts, and terminology used in Tiger Data documentation, database industry, and real-time analytics.
A
ACL (Access Control List): a table that tells a computer operating system which access rights each user has to a particular system object, such as a file directory or individual file.
ACID: a set of properties (atomicity, consistency, isolation, durability) that guarantee database transactions are processed reliably.
ACID compliance: a set of database properties—Atomicity, Consistency, Isolation, Durability—ensuring reliable and consistent transactions. Inherited from Postgres.
Adaptive query optimization: dynamic query plan adjustment based on actual execution statistics and data distribution patterns, improving performance over time.
Aggregate (Continuous Aggregate): a materialized, precomputed summary of query results over time-series data, providing faster access to analytics.
Alerting: the process of automatically notifying administrators when predefined conditions or thresholds are met in system monitoring.
Analytics database: a system optimized for large-scale analytical queries, supporting complex aggregations, time-based queries, and data exploration.
Anomaly detection: the identification of abnormal patterns or outliers within time-series datasets, common in observability, IoT, and finance.
Append-only storage: a storage pattern where data is only added, never modified in place. Ideal for time-series workloads and audit trails.
Archival: the process of moving old or infrequently accessed data to long-term, cost-effective storage solutions.
Auto-partitioning: automatic division of a hypertable into chunks based on partitioning dimensions to optimize scalability and performance.
Availability zone: an isolated location within a cloud region that provides redundant power, networking, and connectivity.
B
B-tree: a self-balancing tree data structure that maintains sorted data and allows searches, sequential access, insertions, and deletions in logarithmic time.
Background job: an automated task that runs in the background without user intervention, typically for maintenance operations like compression or data retention.
Background worker: a Postgres process that runs background tasks independently of client sessions.
Batch processing: handling data in grouped batches rather than as individual real-time events, often used for historical data processing.
Backfill: the process of filling in historical data that was missing or needs to be recalculated, often used during migrations or after schema changes.
Backup: a copy of data stored separately from the original data to protect against data loss, corruption, or system failure.
Bloom filter: a probabilistic data structure that tests set membership with possible false positives but no false negatives. TimescaleDB uses blocked bloom filters to speed up point lookups by eliminating chunks that don't contain queried values.
Buffer pool: memory area where frequently accessed data pages are cached to reduce disk I/O operations.
BRIN (Block Range Index): a Postgres index type that stores summaries about ranges of table blocks, useful for large tables with naturally ordered data.
Bytea: a Postgres data type for storing binary data as a sequence of bytes.
C
Cache hit ratio: the percentage of data requests served from memory cache rather than disk, indicating query performance efficiency.
Cardinality: the number of unique values in a dataset or database column.
Check constraint: a database constraint that limits the values that can be stored in a column by checking them against a specified condition.
Chunk: a horizontal partition of a hypertable that contains data for a specific time interval and space partition. See chunks.
Chunk interval: the time period covered by each chunk in a hypertable, which affects query performance and storage efficiency.
Chunk skipping: a query optimization technique that skips chunks not relevant to the query's time range, dramatically improving performance.
CIDR (Classless Inter-Domain Routing): a method for allocating IP addresses and routing IP packets.
Client credentials: authentication tokens used by applications to access services programmatically without user interaction.
Close: in financial data, the closing price of a security at the end of a trading period.
Cloud: computing services delivered over the internet, including servers, storage, databases, networking, software, analytics, and intelligence.
Cloud deployment: the use of public, private, or hybrid cloud infrastructure to host TimescaleDB, enabling elastic scalability and managed services.
Cloud-native: an approach to building applications that leverage cloud infrastructure, scalability, and services like Kubernetes.
Cold storage: a tier of data storage for infrequently accessed data that offers lower costs but higher access times.
Columnar: a data storage format that stores data column by column rather than row by row, optimizing for analytical queries.
Columnstore: TimescaleDB's columnar storage engine optimized for analytical workloads and compression.
Compression: the process of reducing data size by encoding information using fewer bits, improving storage efficiency and query performance. See compression.
Connection pooling: a technique for managing multiple database connections efficiently, reducing overhead for high-concurrency environments.
Consensus algorithm: protocols ensuring distributed systems agree on data state, critical for multi-node database deployments.
Compression policy: an automated rule that compresses hypertable chunks after they reach a specified age or size threshold.
Compression ratio: the ratio between the original data size and the compressed data size, indicating compression effectiveness.
Constraint: a rule enforced by the database to maintain data integrity and consistency.
Continuous aggregate: a materialized view that incrementally updates with new data, providing fast access to pre-computed aggregations. See continuous aggregates.
Counter aggregation: aggregating monotonic counter data, handling counter resets and extrapolation.
Cron: a time-based job scheduler in Unix-like computer operating systems.
Cross-region backup: a backup stored in a different geographical region from the primary data for disaster recovery.
D
Data lake: a centralized repository storing structured and unstructured data at scale, often integrated with time-series databases for analytics.
Data lineage: the tracking of data flow from source to destination, including transformations, essential for compliance and debugging.
Data pipeline: automated workflows for moving, transforming, and loading data between systems, often using tools like Apache Kafka or Apache Airflow.
Data migration: the process of moving data from one system, storage type, or format to another. See the migration guides.
Data retention: the practice of storing data for a specified period before deletion, often governed by compliance requirements or storage optimization. See data retention.
Data rollup: the process of summarizing detailed historical data into higher-level aggregates, balancing storage needs with query efficiency.
Data skew: uneven distribution of data across partitions or nodes, potentially causing performance bottlenecks.
Data tiering: a storage management strategy that places data on different storage tiers based on access patterns and performance requirements.
Data type: a classification that specifies which type of value a variable can hold, such as integer, string, or boolean.
Decompress: the process of restoring compressed data to its original, uncompressed state.
Delta: the difference between two values, commonly used in counter aggregations to calculate the change over time.
DHCP (Dynamic Host Configuration Protocol): a network management protocol used to automatically assign IP addresses and other network configuration parameters.
Dimension: a partitioning key in a hypertable that determines how data is distributed across chunks.
Disaster recovery: the process and procedures for recovering and protecting a business's IT infrastructure in the event of a disaster.
Double precision: a floating-point data type that provides more precision than the standard float type.
Downsample: the process of reducing the temporal resolution of time-series data by aggregating data points over longer time intervals.
Downtime: the period during which a system, service, or application is unavailable or not operational.
Dual-write and backfill: a migration approach where new data is written to both the source and target databases simultaneously, followed by backfilling historical data to ensure completeness.
Dual-write: a migration pattern where applications write data to both the source and target systems simultaneously.
E
Edge computing: processing data at or near the data source such as IoT devices, rather than solely in centralized servers, reducing latency.
Edge gateway: a device that aggregates data from sensors and performs preprocessing before sending data to cloud or centralized databases.
ELT (Extract, Load, Transform): a data pipeline pattern where raw data is loaded first, then transformed within the target system, leveraging database processing power.
Embedding: a vector representation of data such as text or images, that captures semantic meaning in a high-dimensional space.
Error rate: the percentage of requests or operations that result in errors over a given time period.
Euclidean distance: a measure of the straight-line distance between two points in multidimensional space.
Exactly-once: a message is delivered and processed precisely once. There is no loss and no duplicates.
Explain: a Postgres command that shows the execution plan for a query, useful for performance analysis.
Event sourcing: an architectural pattern storing all changes as a sequence of events, naturally fitting time-series database capabilities.
Event-driven architecture: a design pattern where components react to events such as sensor readings, requiring real-time data pipelines and storage.
Extension: a Postgres add-on that extends the database's functionality beyond the core features.
F
Fact table: the central table in a star schema containing quantitative measures, often time-series data with foreign keys to dimension tables.
Failover: the automatic switching to a backup system, server, or network upon the failure or abnormal termination of the primary system.
Financial time-series: high-volume, timestamped datasets like stock market feeds or trade logs, requiring low-latency, scalable databases like TimescaleDB.
Foreign key: a database constraint that establishes a link between data in two tables by referencing the primary key of another table.
Fork: a copy of a database service that shares the same data but can diverge independently through separate writes.
Free service: a free instance of Tiger Cloud with limited resources. You can create up to two free services under any pricing plan. When a free service reaches the resource limit, it converts to the read-only state. You can convert a free service to a standard one under paid pricing plans.
FTP (File Transfer Protocol): a standard network protocol used for transferring files between a client and server on a computer network.
G
Gap filling: a technique for handling missing data points in time-series by interpolation or other methods, often implemented with hyperfunctions.
GIN (Generalized Inverted Index): a Postgres index type designed for indexing composite values and supporting fast searches.
GiST (Generalized Search Tree): a Postgres index type that provides a framework for implementing custom index types.
GP-LTTB: an advanced downsampling algorithm that extends Largest-Triangle-Three-Buckets with Gaussian Process modeling.
GUC (Grand Unified Configuration): Postgres's configuration parameter system that controls various aspects of database behavior.
GUID (Globally Unique Identifier): a unique identifier used in software applications, typically represented as a 128-bit value.
H
Hash: an index type that provides constant-time lookups for equality comparisons but doesn't support range queries.
High-cardinality: refers to datasets with a large number of unique values, which can strain storage and indexing in time-series applications.
Histogram bucket: a predefined range of metrics organized for statistical analysis, commonly visualized in monitoring tools.
Hot standby: a replication configuration where the standby server can serve read-only queries while staying synchronized with the primary.
High availability: a system design that ensures an agreed level of operational performance, usually uptime, for a higher than normal period.
High: in financial data, the highest price of a security during a specific time period.
Histogram: a graphical representation of the distribution of numerical data, showing the frequency of data points in different ranges.
Historical data: previously recorded data that provides context and trends for analysis and decision-making.
HNSW (Hierarchical Navigable Small World): a graph-based algorithm for approximate nearest neighbor search in high-dimensional spaces.
Hot storage: a tier of data storage for frequently accessed data that provides the fastest access times but at higher cost.
Hypercore: TimescaleDB's hybrid storage engine that seamlessly combines row and column storage for optimal performance. See Hypercore.
Hyperfunction: an SQL function in TimescaleDB designed for time-series analysis, statistics, and specialized computations. See Hyperfunctions.
HyperLogLog: a probabilistic data structure used for estimating the cardinality of large datasets with minimal memory usage.
Hypershift: a migration tool and strategy for moving data to TimescaleDB with minimal downtime.
Hypertable: TimescaleDB's core abstraction that automatically partitions time-series data for scalability. See Hypertables.
I
Idempotency: the property where repeated operations produce the same result, crucial for reliable data ingestion and processing.
Ingest rate: the speed at which new data is written to the system, measured in rows per second. Critical for IoT and observability.
Inner product: a mathematical operation that combines two vectors to produce a scalar, used in similarity calculations.
Insert: an SQL operation that adds new rows of data to a database table.
Integer: a data type that represents whole numbers without decimal points.
Intercept: a statistical measure representing the y-intercept in linear regression analysis.
Internet gateway: an AWS VPC component that enables communication between instances in a VPC and the internet.
Interpolation: a method of estimating unknown values that fall between known data points.
IP allow list: a security feature that restricts access to specified IP addresses or ranges.
Isolation level: a database transaction property that defines the degree to which operations in one transaction are isolated from those in other concurrent transactions.
J
Job: an automated task scheduled to run at specific intervals or triggered by certain conditions.
Job execution: the process of running scheduled background tasks or automated procedures.
JIT (Just-In-Time) compilation: Postgres feature that compiles frequently executed query parts for improved performance, available in TimescaleDB.
Job history: a record of past job executions, including their status, duration, and any errors encountered.
JSON (JavaScript Object Notation): a lightweight data interchange format that is easy for humans to read and write.
JWT (JSON Web Token): a compact, URL-safe means of representing claims to be transferred between two parties.
L
Latency: the time delay between a request being made and the response being received.
Lifecycle policy: a set of rules that automatically manage data throughout its lifecycle, including retention and deletion.
Live migration: a data migration technique that moves data with minimal or zero downtime.
Load balancer: a service distributing traffic across servers or database nodes to optimize resource use and avoid single points of failure.
Log-Structured Merge (LSM) Tree: a data structure optimized for write-heavy workloads, though TimescaleDB primarily uses B-tree indexes for balanced read/write performance.
LlamaIndex: a framework for building applications with large language models, providing tools for data ingestion and querying.
LOCF (Last Observation Carried Forward): a method for handling missing data by using the most recent known value.
Logical backup: a backup method that exports data in a human-readable format, allowing for selective restoration.
Logical replication: a Postgres feature that replicates data changes at the logical level rather than the physical level.
Logging: the process of recording events, errors, and system activities for monitoring and troubleshooting purposes.
Low: in financial data, the lowest price of a security during a specific time period.
LTTB (Largest-Triangle-Three-Buckets): a downsampling algorithm that preserves the visual characteristics of time-series data.
M
Manhattan distance: a distance metric calculated as the sum of the absolute differences of their coordinates.
Manual compression: the process of compressing chunks manually rather than through automated policies.
Materialization: the process of computing and storing the results of a query or view for faster access.
Materialized view: a database object that stores the result of a query and can be refreshed periodically.
Memory-optimized query: a query pattern designed to minimize disk I/O by leveraging available RAM and efficient data structures.
Metric: a quantitative measurement used to assess system performance, business outcomes, or operational efficiency.
MFA (Multi-Factor Authentication): a security method that requires two or more verification factors to grant access.
Migration: the process of moving data, applications, or systems from one environment to another. See migration guides.
Monitoring: the continuous observation and measurement of system performance and health.
Multi-tenancy: an architecture pattern supporting multiple customers or applications within a single database instance, with proper isolation.
MQTT (Message Queuing Telemetry Transport): a lightweight messaging protocol designed for small sensors and mobile devices.
MST (Managed Service for TimescaleDB): a fully managed TimescaleDB service that handles infrastructure and maintenance tasks.
N
NAT Gateway: a network address translation service that enables instances in a private subnet to connect to the internet.
Node (database node): an individual server within a distributed system, contributing to storage, compute, or replication tasks.
Normalization: database design technique organizing data to reduce redundancy, though time-series data often benefits from denormalized structures.
Not null: a database constraint that ensures a column cannot contain empty values.
Numeric: a Postgres data type for storing exact numeric values with user-defined precision.
O
OAuth: an open standard for access delegation commonly used for token-based authentication and authorization.
Observability: the ability to measure the internal states of a system by examining its outputs.
OLAP (Online Analytical Processing): systems or workloads focused on large-scale, multidimensional, and complex analytical queries.
OLTP (Online Transaction Processing): high-speed transactional systems optimized for data inserts, updates, and short queries.
OHLC: an acronym for Open, High, Low, Close prices, commonly used in financial data analysis.
OHLCV: an extension of OHLC that includes Volume data for complete candlestick analysis.
Open: in financial data, the opening price of a security at the beginning of a trading period.
OpenTelemetry: open standard for collecting, processing, and exporting telemetry data, often stored in time-series databases.
Optimization: the process of making systems, queries, or operations more efficient and performant.
P
Parallel copy: a technique for copying large amounts of data using multiple concurrent processes to improve performance.
Parallel Query Execution: a Postgres feature that uses multiple CPU cores to execute single queries faster, inherited by TimescaleDB.
Partitioning: the practice of dividing large tables into smaller, more manageable pieces based on certain criteria.
Percentile: a statistical measure that indicates the value below which a certain percentage of observations fall.
Performance: a measure of how efficiently a system operates, often quantified by metrics like throughput, latency, and resource utilization.
pg_basebackup: a Postgres utility for taking base backups of a running Postgres cluster.
pg_dump: a Postgres utility for backing up database objects and data in various formats.
pg_restore: a Postgres utility for restoring databases from backup files created by pg_dump.
pgVector: a Postgres extension that adds vector similarity search capabilities for AI and machine learning applications. See pgvector.
pgai on Tiger Cloud: a cloud solution for building search, RAG, and AI agents with Postgres. Enables calling AI embedding and generation models directly from the database using SQL. See pgai.
pgvectorscale: a performance enhancement for pgvector featuring StreamingDiskANN indexing, binary quantization compression, and label-based filtering. See pgvectorscale.
pgvectorizer: a TimescaleDB tool for automatically vectorizing and indexing data for similarity search.
Physical backup: a backup method that copies the actual database files at the storage level.
PITR (Point-in-Time Recovery): the ability to restore a database to a specific moment in time.
Policy: an automated rule or procedure that performs maintenance tasks like compression, retention, or refresh operations.
Predictive maintenance: the use of time-series data to forecast equipment failure, common in IoT and industrial applications.
Postgres: an open-source object-relational database system known for its reliability, robustness, and performance.
PostGIS: a Postgres extension that adds support for geographic objects and spatial queries.
Primary key: a database constraint that uniquely identifies each row in a table.
psql: an interactive terminal-based front-end to Postgres that allows users to type queries interactively.
Q
QPS (Queries Per Second): a measure of database performance indicating how many queries a database can process per second.
Query: a request for data or information from a database, typically written in SQL.
Query performance: a measure of how efficiently database queries execute, including factors like execution time and resource usage.
Query planner/optimizer: a component determining the most efficient strategy for executing SQL queries based on database structure and indexes.
Query planning: the database process of determining the most efficient way to execute a query.
R
RBAC (Role-Based Access Control): a security model that assigns permissions to users based on their roles within an organization.
Read committed: an isolation level where transactions can read committed changes made by other transactions.
Read scaling: a technique for improving database performance by distributing read queries across multiple database replicas.
Read uncommitted: the lowest isolation level where transactions can read uncommitted changes from other transactions.
Read-only role: a database role with permissions limited to reading data without modification capabilities.
Read replica: a copy of the primary database that serves read-only queries, improving read scalability and geographic distribution.
Real-time analytics: the immediate analysis of incoming data streams, crucial for observability, trading platforms, and IoT monitoring.
Real: a Postgres data type for storing single-precision floating-point numbers.
Real-time aggregate: a continuous aggregate that includes both materialized historical data and real-time calculations on recent data.
Refresh policy: an automated rule that determines when and how continuous aggregates are updated with new data.
Region: a geographical area containing multiple data centers, used in cloud computing for data locality and compliance.
Repeatable read: an isolation level that ensures a transaction sees a consistent snapshot of data throughout its execution.
Replica: a copy of a database that can be used for read scaling, backup, or disaster recovery purposes.
Replication: the process of copying and maintaining data across multiple database instances to ensure availability and durability.
Response time: the time it takes for a system to respond to a request, measured from request initiation to response completion.
REST API: a web service architecture that uses HTTP methods to enable communication between applications.
Restore: the process of recovering data from backups to restore a database to a previous state.
Restore point: a snapshot of database state that can be used as a reference point for recovery operations.
Retention policy: an automated rule that determines how long data is kept before being deleted from the system.
Route table: a set of rules that determine where network traffic is directed within a cloud network.
RTO (Recovery Time Objective): the maximum acceptable time that systems can be down after a failure or disaster.
RPO (Recovery Point Objective): the maximum acceptable amount of data loss measured in time after a failure or disaster.
Rowstore: traditional row-oriented data storage where data is stored row by row, optimized for transactional workloads.
S
SAML (Security Assertion Markup Language): an XML-based standard for exchanging authentication and authorization data between security domains.
Scheduled job: an automated task that runs at predetermined times or intervals.
Schema evolution: the process of modifying database structure over time while maintaining compatibility with existing applications.
Schema: the structure of a database, including tables, columns, relationships, and constraints.
Security group: a virtual firewall that controls inbound and outbound traffic for cloud resources.
Service discovery: mechanisms allowing applications to dynamically locate services like database endpoints, often used in distributed environments.
Segmentwise recompression: a TimescaleDB compression technique that recompresses data segments to improve compression ratios.
Serializable: the highest isolation level that ensures transactions appear to run serially even when executed concurrently.
Service: see Tiger Cloud service.
Sharding: horizontal partitioning of data across multiple database instances, distributing load and enabling linear scalability.
SFTP (SSH File Transfer Protocol): a secure version of FTP that encrypts both commands and data during transmission.
SkipScan: query optimization for DISTINCT operations that incrementally jumps between ordered values without reading intermediate rows. Uses a Custom Scan node to efficiently traverse ordered indexes, dramatically improving performance over traditional DISTINCT queries.
Similarity search: a technique for finding items that are similar to a given query item, often used with vector embeddings.
SLA (Service Level Agreement): a contract that defines the expected level of service between a provider and customer.
SLI (Service Level Indicator): a quantitative measure of some aspect of service quality.
SLO (Service Level Objective): a target value or range for service quality measured by an SLI.
Slope: a statistical measure representing the rate of change in linear regression analysis.
SMTP (Simple Mail Transfer Protocol): an internet standard for email transmission across networks.
Snapshot: a point-in-time copy of data that can be used for backup and recovery purposes.
SP-GiST (Space-Partitioned Generalized Search Tree): a Postgres index type for data structures that naturally partition search spaces.
Storage optimization: techniques for reducing storage costs and improving performance through compression, tiering, and efficient data organization.
Streaming data: continuous flows of data generated by devices, logs, or sensors, requiring high-ingest, real-time storage solutions.
SQL (Structured Query Language): a programming language designed for managing and querying relational databases.
SSH (Secure Shell): a cryptographic network protocol for secure communication over an unsecured network.
SSL (Secure Sockets Layer): a security protocol that establishes encrypted links between networked computers.
Standard service: a regular Tiger Cloud service that includes the resources and features according to the pricing plan. You can create standard services under any of the paid plans.
Streaming replication: a Postgres replication method that continuously sends write-ahead log records to standby servers.
Synthetic monitoring: simulated transactions or probes used to test system health, generating time-series metrics for performance analysis.
T
Table: a database object that stores data in rows and columns, similar to a spreadsheet.
Tablespace: a Postgres storage structure that defines where database objects are physically stored on disk.
TCP (Transmission Control Protocol): a connection-oriented protocol that ensures reliable data transmission between applications.
TDigest: a probabilistic data structure for accurate estimation of percentiles in distributed systems.
Telemetry: the collection of real-time data from systems or devices for monitoring and analysis.
Text: a Postgres data type for storing variable-length character strings.
Throughput: a measure of system performance indicating the amount of work performed or data processed per unit of time.
Tiered storage: a storage strategy that automatically moves data between different storage classes based on access patterns and age.
Tiger Cloud: Tiger Data's managed cloud platform that provides TimescaleDB as a fully managed solution with additional features.
Tiger Lake: Tiger Data's service for integrating operational databases with data lake architectures.
Tiger Cloud service: an instance of optimized Postgres extended with database engine innovations such as TimescaleDB, in a cloud infrastructure that delivers speed without sacrifice. You can create free services and standard services.
Time series: data points indexed and ordered by time, typically representing how values change over time.
Time-weighted average: a statistical calculation that gives more weight to values based on the duration they were held.
Time bucketing: grouping timestamps into uniform intervals for analysis, commonly used with hyperfunctions.
Time-series forecasting: the application of statistical models to time-series data to predict future trends or events.
TimescaleDB: an open-source Postgres extension for real-time analytics that provides scalability and performance optimizations.
Timestamp: a data type that stores date and time information without timezone data.
Timestamptz: a Postgres data type that stores timestamp with timezone information.
TLS (Transport Layer Security): a cryptographic protocol that provides security for communication over networks.
Tombstone: marker indicating deleted data in append-only systems, requiring periodic cleanup processes.
Transaction isolation: the database property controlling the visibility of uncommitted changes between concurrent transactions.
TPS (Transactions Per Second): a measure of database performance indicating transaction processing capacity.
Transaction: a unit of work performed against a database that must be completed entirely or not at all.
Trigger: a database procedure that automatically executes in response to certain events on a table or view.
U
UDP (User Datagram Protocol): a connectionless communication protocol that provides fast but unreliable data transmission.
Unique: a database constraint that ensures all values in a column or combination of columns are distinct.
Uptime: the amount of time that a system has been operational and available for use.
Usage-based storage: a billing model where storage costs are based on actual data stored rather than provisioned capacity.
UUID (Universally Unique Identifier): a 128-bit identifier used to uniquely identify information without central coordination.
V
Vacuum: a Postgres maintenance operation that reclaims storage and updates database statistics.
Varchar: a variable-length character data type that can store strings up to a specified maximum length.
Vector operations: SIMD (Single Instruction, Multiple Data) optimizations for processing arrays of data, improving analytical query performance.
Vertical scaling (scale up): increasing system capacity by adding more power (CPU, RAM) to existing machines, as opposed to horizontal scaling.
Visualization tool: a platform or dashboard used to display time-series data in charts, graphs, and alerts for easier monitoring and analysis.
Vector: a mathematical object with magnitude and direction, used in machine learning for representing data as numerical arrays.
VPC (Virtual Private Cloud): a virtual network dedicated to your cloud account that provides network isolation.
VWAP (Volume Weighted Average Price): a financial indicator that shows the average price weighted by volume over a specific time period.
W
WAL (Write-Ahead Log): Postgres's method for ensuring data integrity by writing changes to a log before applying them to data files.
Warm storage: a storage tier that balances access speed and cost, suitable for data accessed occasionally.
Watermark: a timestamp that tracks the progress of continuous aggregate materialization.
WebSocket: a communication protocol that provides full-duplex communication channels over a single TCP connection.
Window function: an SQL function that performs calculations across related rows, particularly useful for time-series analytics and trend analysis.
Workload management: techniques for prioritizing and scheduling different types of database operations to optimize overall system performance.
X
XML (eXtensible Markup Language): a markup language that defines rules for encoding documents in a format that is both human-readable and machine-readable.
Y
YAML (YAML Ain't Markup Language): a human-readable data serialization standard commonly used for configuration files.
Z
Zero downtime: a system design goal where services remain available during maintenance, upgrades, or migrations without interruption.
Zero-downtime migration: migration strategies that maintain service availability throughout the transition process, often using techniques like dual-write and gradual cutover.
===== PAGE: https://docs.tigerdata.com/api/compression/ =====
Compression
Old API since TimescaleDB v2.18.0 Replaced by Hypercore.
Compression functionality is included in Hypercore.
Before you set up compression, you need to configure the hypertable for compression and then set up a compression policy.
Before you set up compression for the first time, read the compression blog post and documentation.
You can also compress chunks manually, instead of using an automated compression policy to compress chunks as they age.
Compressed chunks have the following limitations:
ROW LEVEL SECURITYis not supported on compressed chunks.- Creation of unique constraints on compressed chunks is not supported. You can add them by disabling compression on the hypertable and re-enabling after constraint creation.
Restrictions
In general, compressing a hypertable imposes some limitations on the types of data modifications that you can perform on data inside a compressed chunk.
This table shows changes to the compression feature, added in different versions of TimescaleDB:
|TimescaleDB version|Supported data modifications on compressed chunks| |-|-| |1.5 - 2.0|Data and schema modifications are not supported.| |2.1 - 2.2|Schema may be modified on compressed hypertables. Data modification not supported.| |2.3|Schema modifications and basic insert of new data is allowed. Deleting, updating and some advanced insert statements are not supported.| |2.11|Deleting, updating and advanced insert statements are supported.|
In TimescaleDB 2.1 and later, you can modify the schema of hypertables that have compressed chunks. Specifically, you can add columns to and rename existing columns of compressed hypertables.
In TimescaleDB v2.3 and later, you can insert data into compressed chunks and to enable compression policies on distributed hypertables.
In TimescaleDB v2.11 and later, you can update and delete compressed data.
You can also use advanced insert statements like ON CONFLICT and RETURNING.
===== PAGE: https://docs.tigerdata.com/api/distributed-hypertables/ =====
Distributed hypertables ( Sunsetted v2.14.x )
Multi-node support is sunsetted.
TimescaleDB v2.13 is the last release that includes multi-node support for Postgres versions 13, 14, and 15.
Distributed hypertables are an extension of regular hypertables, available when using a multi-node installation of TimescaleDB. Distributed hypertables provide the ability to store data chunks across multiple data nodes for better scale-out performance.
Most management APIs used with regular hypertable chunks also work with distributed hypertables as documented in this section. There are a number of APIs for specifically dealing with data nodes and a special API for executing SQL commands on data nodes.
===== PAGE: https://docs.tigerdata.com/self-hosted/install/ =====
Install self-hosted TimescaleDB
TimescaleDB is an open-source Postgres extension that powers Tiger Cloud. Designed for running real-time analytics on time-series data, it supercharges ingest, query, storage, and analytics performance.
You can install self-hosted TimescaleDB from source, with a pre-built Docker container, or on one of the supported platforms. This section provides instructions for installing the latest version of self-hosted TimescaleDB.
The following instructions are for development and testing installations. For a production environment, we strongly recommend that you implement the following, many of which you can achieve using Postgres tooling:
- Incremental backup and database snapshots, with efficient point-in-time recovery.
- High availability replication, ideally with nodes across multiple availability zones.
- Automatic failure detection with fast restarts, for both non-replicated and replicated deployments.
- Asynchronous replicas for scaling reads when needed.
- Connection poolers for scaling client connections.
- Zero-down-time minor version and extension upgrades.
- Forking workflows for major version upgrades and other feature testing.
- Monitoring and observability.
Deploying for production? With a Tiger Cloud service we tune your database for performance and handle scalability, high availability, backups, and management, so you can relax.
Installation
Refer to the installation documentation for detailed setup instructions.
For more details about the latest release, see the release notes section.
===== PAGE: https://docs.tigerdata.com/self-hosted/configuration/ =====
Configuration
By default, TimescaleDB uses the default Postgres server configuration settings. However, in some cases, these settings are not appropriate, especially if you have larger servers that use more hardware resources such as CPU, memory, and storage.
- Learn about configuration to understand how it works before you begin using it.
- Use the TimescaleDB tune tool.
- Manually edit the
postgresql.confconfiguration file. - If you run TimescaleDB in a Docker container, configure within Docker.
- Find out more about the data that we collect.
===== PAGE: https://docs.tigerdata.com/self-hosted/backup-and-restore/ =====
Backup and restore
TimescaleDB takes advantage of the reliable backup and restore functionality provided by Postgres. There are a few different mechanisms you can use to back up your self-hosted TimescaleDB database:
- Logical backup with pg_dump and pg_restore.
- Physical backup with
pg_basebackupor another tool. - DEPRECATED Ongoing physical backups using write-ahead log (WAL) archiving.
Tiger Cloud is a fully managed service with automatic backup and restore, high availability with replication, seamless scaling and resizing, and much more. You can try Tiger Cloud free for thirty days.
===== PAGE: https://docs.tigerdata.com/self-hosted/migration/ =====
Migrate your Postgres database to self-hosted TimescaleDB
You can migrate your existing Postgres database to self-hosted TimescaleDB.
There are several methods for migrating your data:
- If the database you want to migrate is smaller than 100 GB, migrate your entire database at once: This method directly transfers all data and schemas, including Timescale-specific features. Your hypertables, continuous aggregates, and policies are automatically available in the new self-hosted TimescaleDB instance.
- For databases larger than 100GB, migrate your schema and data separately: With this method, you migrate your tables one by one for easier failure recovery. If migration fails mid-way, you can restart from the failure point rather than from the beginning. However, Timescale-specific features won't be automatically migrated. Follow the instructions to restore your hypertables, continuous aggregates, and policies.
- If you need to move data from Postgres tables into hypertables within an existing self-hosted TimescaleDB instance, migrate within the same database: This method assumes that you have TimescaleDB set up in the same database instance as your existing table.
- If you have data in an InfluxDB database, migrate using Outflux: Outflux pipes exported data directly to your self-hosted TimescaleDB instance, and manages schema discovery, validation, and creation. Outflux works with earlier versions of InfluxDB. It does not work with InfluxDB version 2 and later.
Choose a migration method
Which method you choose depends on your database size, network upload and download speeds, existing continuous aggregates, and tolerance for failure recovery.
If you are migrating from an Amazon RDS service, Amazon charges for the amount of data transferred out of the service. You could be charged by Amazon for all data egressed, even if the migration fails.
If your database is smaller than 100 GB, choose to migrate your entire database at once. You can also migrate larger databases using this method, but the copying process must keep running, potentially over days or weeks. If the copy is interrupted, the process needs to be restarted. If you think an interruption in the copy is possible, choose to migrate your schema and data separately instead.
Migrating your schema and data separately does not retain continuous aggregates calculated using already-deleted data. For example, if you delete raw data after a month but retain downsampled data in a continuous aggregate for a year, the continuous aggregate loses any data older than a month upon migration. If you must keep continuous aggregates calculated using deleted data, migrate your entire database at once regardless of database size.
If you aren't sure which method to use, try copying the entire database at once to estimate the time required. If the time estimate is very long, stop the migration and switch to the other method.
Migrate an active database
If your database is actively ingesting data, take precautions to ensure that your self-hosted TimescaleDB instance contains the data that is ingested while the migration is happening. Begin by running ingest in parallel on the source and target databases. This ensures that the newest data is written to both databases. Then backfill your data with one of the two migration methods.
===== PAGE: https://docs.tigerdata.com/self-hosted/manage-storage/ =====
Manage storage using tablespaces
If you are running TimescaleDB on your own hardware, you can save storage by moving chunks between tablespaces. By moving older chunks to cheaper, slower storage, you can save on storage costs while still using faster, more expensive storage for frequently accessed data. Moving infrequently accessed chunks can also improve performance, because it isolates historical data from the continual read-and-write workload of more recent data.
Using tablespaces is one way to manage data storage costs with TimescaleDB. You can also use compression and data retention to reduce your storage requirements.
Tiger Cloud is a fully managed service with automatic backup and restore, high availability with replication, seamless scaling and resizing, and much more. You can try Tiger Cloud free for thirty days.
Move data
To move chunks to a new tablespace, you first need to create the new tablespace
and set the storage mount point. You can then use the
move_chunk API call to move individual chunks from the
default tablespace to the new tablespace. The move_chunk command also allows
you to move indexes belonging to those chunks to an appropriate tablespace.
Additionally, move_chunk allows you reorder the chunk during the migration.
This can be used to make your queries faster, and works in a similar way to the
reorder_chunk command.
You must be logged in as a super user, such as the postgres user, to use the
move_chunk() API call.
Moving data
Create a new tablespace. In this example, the tablespace is called
history, it is owned by thepostgressuper user, and the mount point is/mnt/history:CREATE TABLESPACE history OWNER postgres LOCATION '/mnt/history';List chunks that you want to move. In this example, chunks that contain data that is older than two days:
SELECT show_chunks('conditions', older_than => INTERVAL '2 days');Move a chunk and its index to the new tablespace. You can also reorder the data in this step. In this example, the chunk called
_timescaledb_internal._hyper_1_4_chunkis moved to thehistorytablespace, and is reordered based on its time index:SELECT move_chunk( chunk => '_timescaledb_internal._hyper_1_4_chunk', destination_tablespace => 'history', index_destination_tablespace => 'history', reorder_index => '_timescaledb_internal._hyper_1_4_chunk_netdata_time_idx', verbose => TRUE );You can verify that the chunk now resides in the correct tablespace by querying
pg_tablesto list all of the chunks on the tablespace:SELECT tablename from pg_tables WHERE tablespace = 'history' and tablename like '_hyper_%_%_chunk';You can also verify that the index is in the correct location:
SELECT indexname FROM pg_indexes WHERE tablespace = 'history';
Move data in bulk
To move several chunks at once, select the chunks you want to move by using
FROM show_chunks(...). For example, to move chunks containing data between 1
and 3 weeks old, in a hypertable named example:
SELECT move_chunk(
chunk => i,
destination_tablespace => '')
FROM show_chunks('example', now() - INTERVAL '1 week', now() - INTERVAL '3 weeks') i;
Examples
After moving a chunk to a slower tablespace, you can move it back to the default, faster tablespace:
SELECT move_chunk(
chunk => '_timescaledb_internal._hyper_1_4_chunk',
destination_tablespace => 'pg_default',
index_destination_tablespace => 'pg_default',
reorder_index => '_timescaledb_internal._hyper_1_4_chunk_netdata_time_idx'
);
You can move a data chunk to the slower tablespace, but keep the chunk's indexes on the default, faster tablespace:
SELECT move_chunk(
chunk => '_timescaledb_internal._hyper_1_4_chunk',
destination_tablespace => 'history',
index_destination_tablespace => 'pg_default',
reorder_index => '_timescaledb_internal._hyper_1_4_chunk_netdata_time_idx'
);
You can also keep the data in pg_default but move the index to history.
Alternatively, you can set up a third tablespace called history_indexes,
and move the data to history and the indexes to history_indexes.
In TimescaleDB v2.0 and later, you can use move_chunk with the job scheduler
framework. For more information, see the jobs section.
===== PAGE: https://docs.tigerdata.com/self-hosted/replication-and-ha/ =====
High availability
Postgres relies on replication for high availability, failover, and balancing read loads across multiple nodes. Replication ensures that data written to the primary Postgres database is mirrored on one or more nodes. By virtue of having multiple nodes with an exact copy of the primary database available, the primary database can be replaced with a replica node in the event of a failure or outage on the primary server. Replica nodes can also be used as read only databases, also called read replicas, allowing reads to be horizontally scaled by spreading the read query volume across multiple nodes.
- Learn about high availability to understand how it works before you begin using it.
- Configure replication.
Tiger Cloud is a fully managed service with automatic backup and restore, high availability with replication, seamless scaling and resizing, and much more. You can try Tiger Cloud free for thirty days.
===== PAGE: https://docs.tigerdata.com/self-hosted/tooling/ =====
Additional tooling
Get the most from TimescaleDB with open source tools that help you perform common tasks.
- Automatically configure your TimescaleDB instance with
timescaledb-tune - Install TimescaleDB Toolkit to access more hyperfunctions and function pipelines
===== PAGE: https://docs.tigerdata.com/self-hosted/upgrades/ =====
Upgrade TimescaleDB
A major upgrade is when you update from TimescaleDB X.<minor version> to Y.<minor version>.
A minor upgrade is when you update from TimescaleDB <major version>.x, to TimescaleDB <major version>.y.
You upgrade your self-hosted TimescaleDB installation in-place.
Tiger Cloud is a fully managed service with automatic backup and restore, high availability with replication, seamless scaling and resizing, and much more. You can try Tiger Cloud free for thirty days.
This section shows you how to:
- Upgrade self-hosted TimescaleDB to a new minor version.
- Upgrade self-hosted TimescaleDB to a new major version.
- Upgrade self-hosted TimescaleDB running in a Docker container to a new minor version.
- Upgrade Postgres to a new version.
- Downgrade self-hosted TimescaleDB to the previous minor version.
===== PAGE: https://docs.tigerdata.com/self-hosted/uninstall/ =====
Uninstall TimescaleDB
If you want to uninstall TimescaleDB because it does not meet your requirements, you can uninstall it without having to uninstall Postgres.
- Learn how to uninstall TimescaleDB in macOS
===== PAGE: https://docs.tigerdata.com/self-hosted/multinode-timescaledb/ =====
Multi-node
Multi-node support is sunsetted.
TimescaleDB v2.13 is the last release that includes multi-node support for Postgres versions 13, 14, and 15.
If you have a larger workload, you might need more than one TimescaleDB instance. TimescaleDB multi-node allows you to run and manage multiple instances, giving you faster data ingest, and more responsive and efficient queries.
- Learn about multi-node to understand how it works before you begin using it.
- Set up multi-node in a self-hosted environment.
- Set up authentication for your cluster
- Configure your cluster
- Administer your cluster
- Grow or shrink your cluster
- Set up high availability (HA) for your cluster
- Maintain your multi-node environment
===== PAGE: https://docs.tigerdata.com/self-hosted/distributed-hypertables/ =====
Distributed hypertables
Multi-node support is sunsetted.
TimescaleDB v2.13 is the last release that includes multi-node support for Postgres versions 13, 14, and 15.
Distributed hypertables are hypertables that span multiple nodes. With distributed hypertables, you can scale your data storage across multiple machines and benefit from parallelized processing for some queries.
Many features of distributed hypertables work the same way as standard hypertables. To learn how hypertables work in general, see the hypertables section.
In this section:
- Learn about distributed hypertables for multi-node databases
- Create a distributed hypertable
- Insert data into distributed hypertables
- Query data in distributed hypertables
- Alter and drop distributed hypertables
- Create foreign keys on distributed hypertables
- Set triggers on distributed hypertables
===== PAGE: https://docs.tigerdata.com/mst/about-mst/ =====
About Managed Service for TimescaleDB
Managed Service for TimescaleDB (MST) is TimescaleDB hosted on Azure and GCP. MST is offered in partnership with Aiven.
Tiger Cloud is a high-performance developer focused cloud that provides Postgres services enhanced with our blazing fast vector search. You can securely integrate Tiger Cloud with your AWS, GCS or Azure infrastructure. Create a Tiger Cloud service and try for free.
If you need to run TimescaleDB on GCP or Azure, you're in the right place — keep reading.
Your Managed Service for TimescaleDB account has three main components: projects, services, and databases.
Projects
When you sign up for Managed Service for TimescaleDB, an empty project is created for you automatically. Projects are the highest organization level, and they contain all your services and databases. You can use projects to organize groups of services. Each project can also have its own billing settings.
To create a new project: In MST Console, click Projects > Create project.
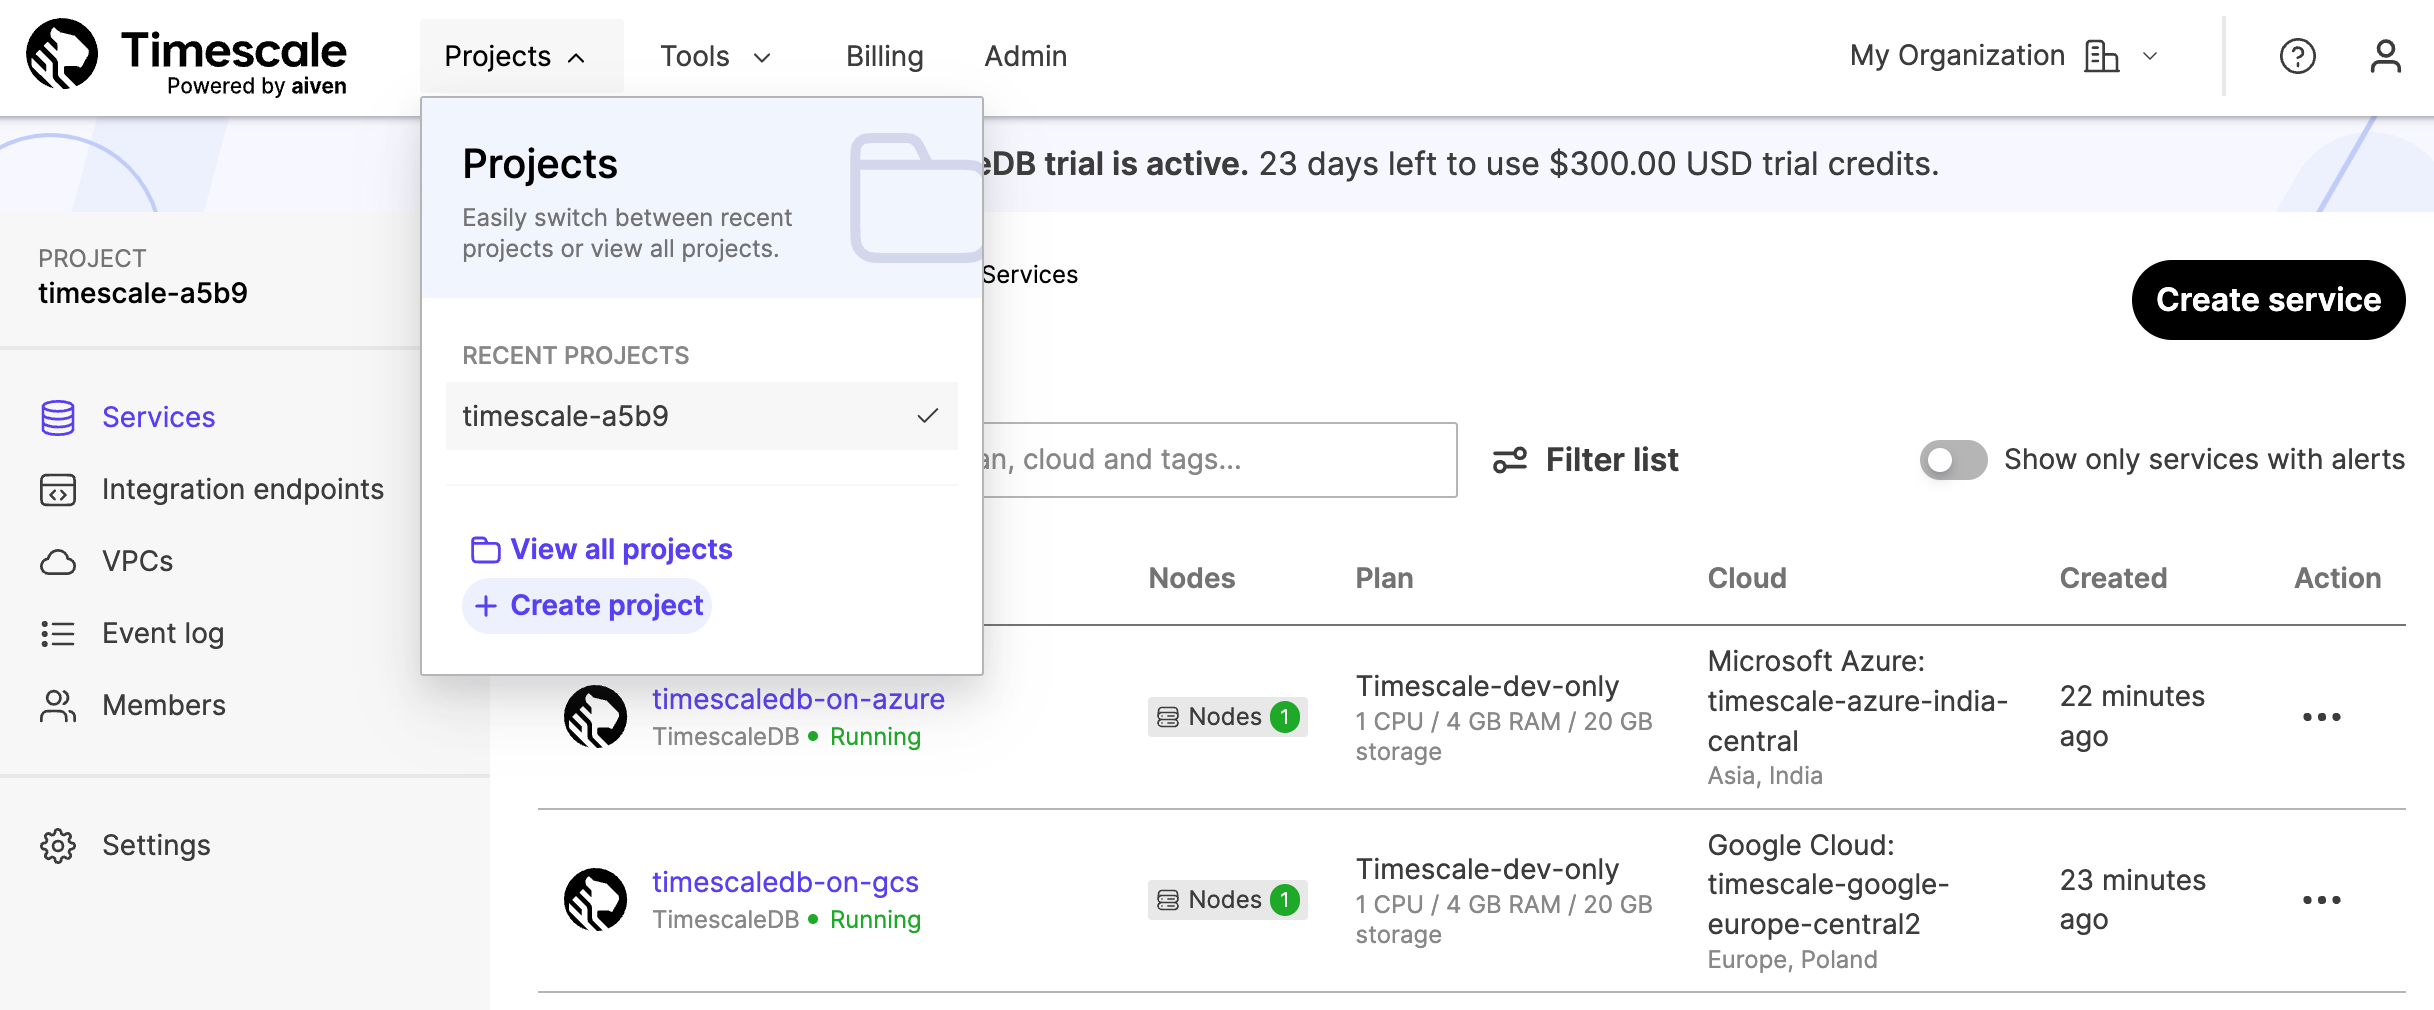
services
Each project contains one or more services. You can have multiple services under
each project, and each service corresponds to a cloud service provider tier. You
can access all your services from the Services tab within your projects.
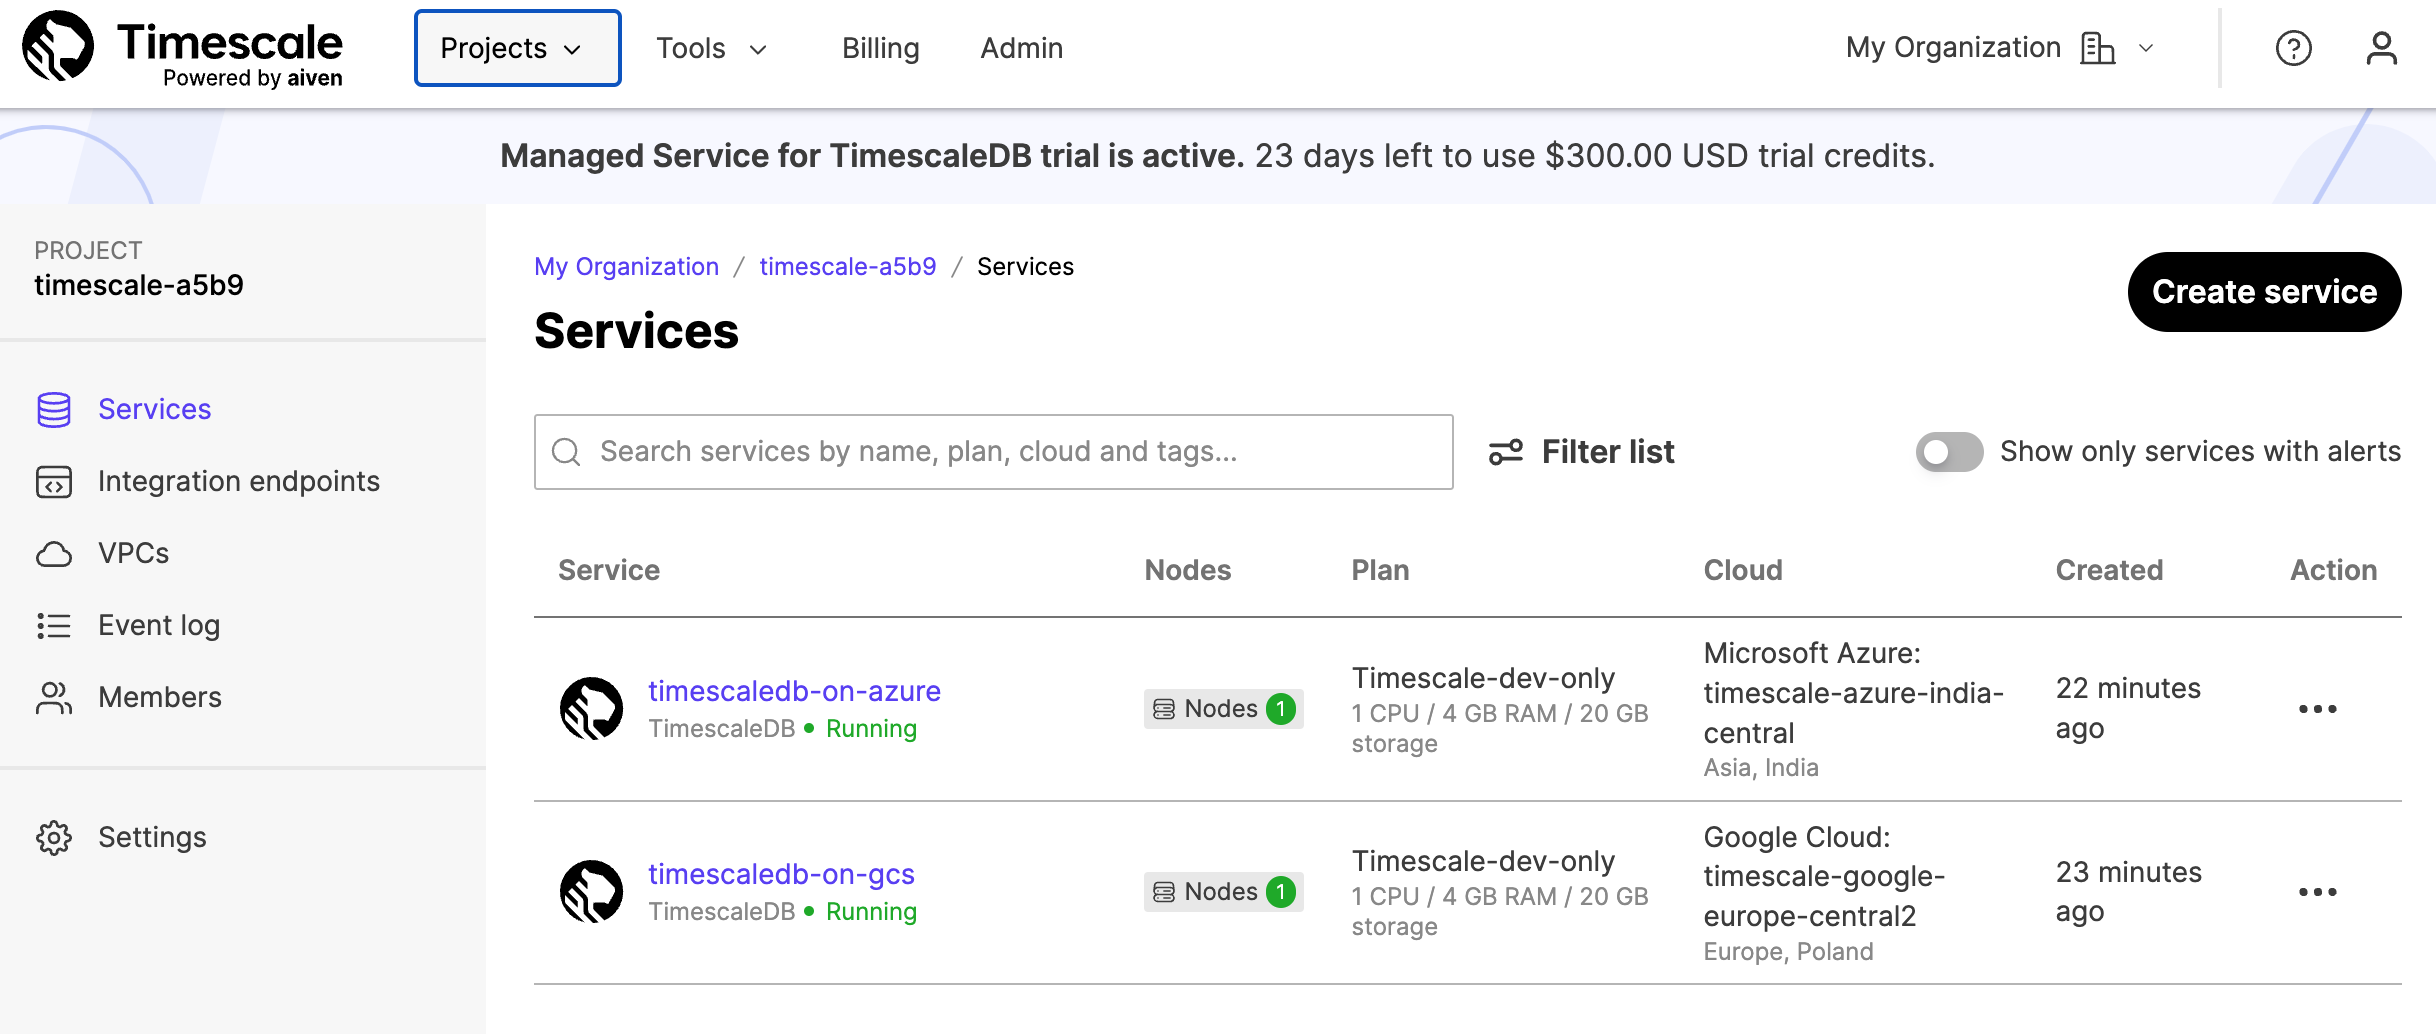
For more information about getting your first service up and running, see the Managed Service for TimescaleDB installation section.
When you have created, and named, a new Managed Service for TimescaleDB service, you cannot rename it. If you need to have your service running under a different name, you need to create a new service, and manually migrate the data. For more information about migrating data, see migrating your data.
For information about billing on Managed Service for TimescaleDB, see the billing section.
Databases
Each service can contain one or more databases. To view existing databases, or
to create a new database, select a service in the services list,
click Databases, then click Create database.
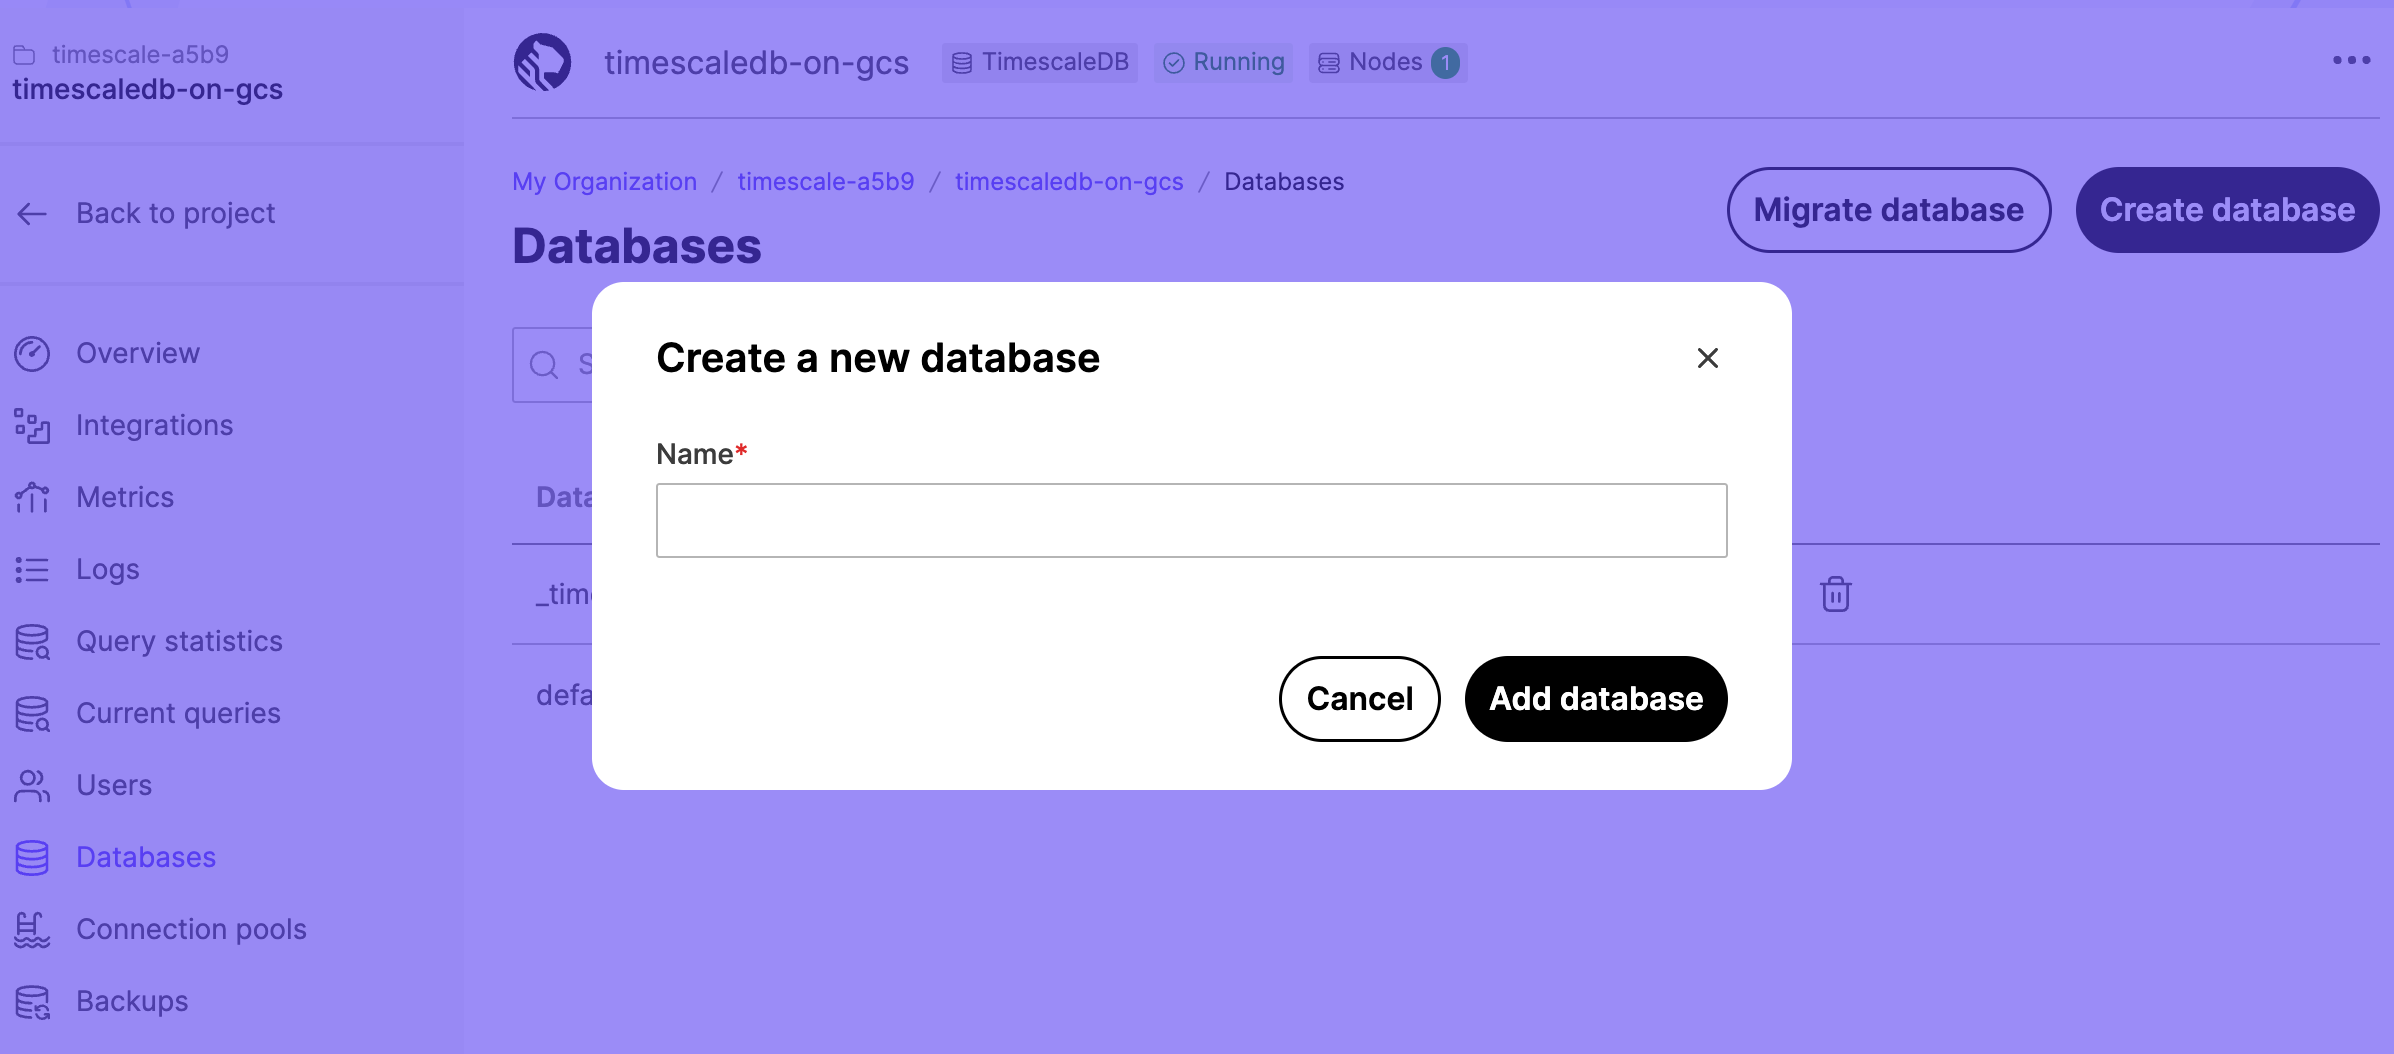
Service level agreement
Managed Service for TimescaleDB is provided through a partnership with Aiven. This provides you with a service commitment to deliver 99.99% availability. For more information, see the Aiven Service Level Agreement policy.
Service configuration plans
When you create a new service, you need to select a configuration plan. The plan determines the number of VMs the service runs in, the high availability configuration, the number of CPU cores, and size of RAM and storage volumes.
The plans are:
- Basic Plans: include 2 days of backups and automatic backup and restore if your instance fails.
- Dev Plans: include 1 day of backups and automatic backup and restore if your instance fails.
- Pro Plans: include 3 days of backups and automatic failover to a hot standby if your instance fails.
The Basic and Dev plans are serviced by a single virtual machine (VM) node. This means that if the node fails, the service is unavailable until a new VM is built. This can result in data loss, if some of the latest changes to the data weren't backed up before the failure. Sometimes, it can also take a long time to return the service back to normal operation, because a new VM needs to be created and restored from backups before the service can resume. The time to recover depends on the amount of data you have to restore.
The Pro plans are much more resilient to failures. A single node failure causes no data loss, and the possible downtime is minimal. If an acting TimescaleDB master node fails, an up-to-date replica node is automatically promoted to become the new master. This means there is only a small outage while applications reconnect to the database and access the new master.
You can upgrade your plan while the service is running. The service is reconfigured to run on larger VMs in the background and when the reconfiguration is complete, the DNS names are pointed to the new hosts. This can cause a short disruption to your service while DNS changes are propagated.
Within each configuration plan option, there are several plan types available:
IO-OptimizedandCompute-OptimizedThese configurations are optimized for input/output (I/O) performance, using SSD storage media.Storage-Optimized: These configurations usually have larger amounts of overall storage, using HDD storage media.Dev-Only: These configurations are typically smaller footprints, and lower cost, designed for development and testing scenarios.
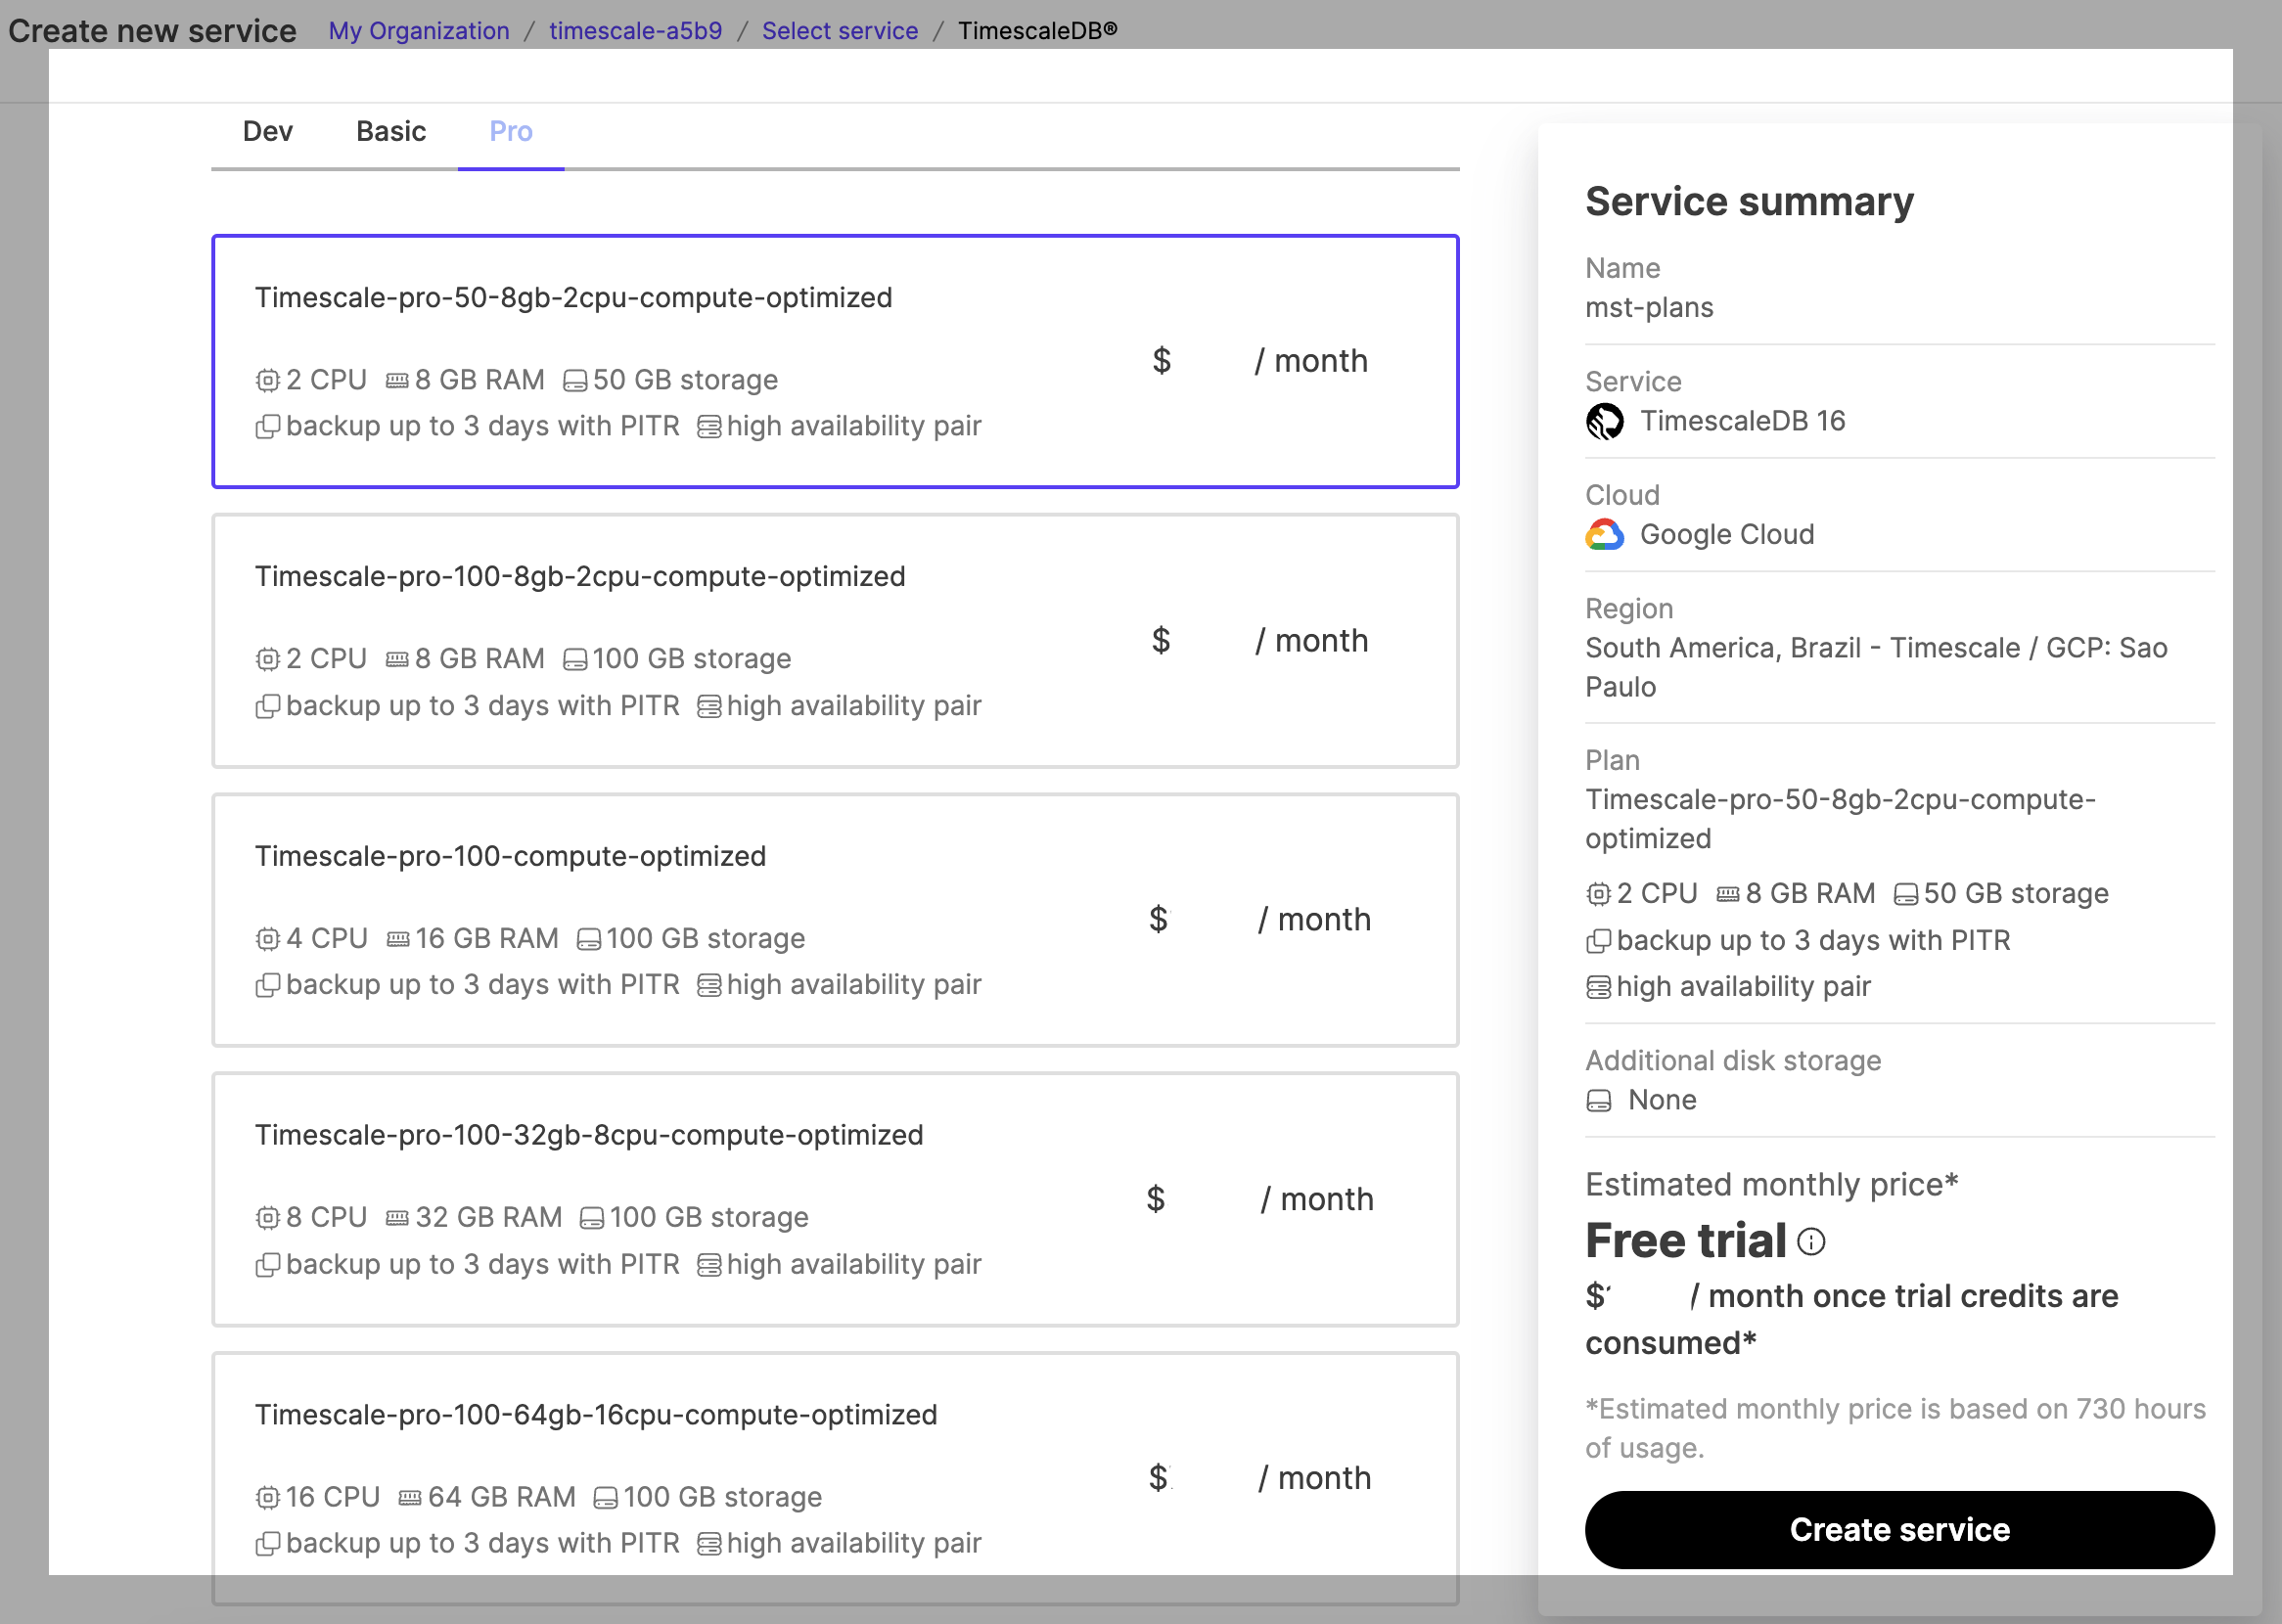
High availability
Most minor failures are handled automatically without making any changes to your service deployment. This includes failures such as service process crashes, or a temporary loss of network access. The service automatically restores normal operation when the crashed process restarts automatically or when the network access is restored.
However, more severe failure modes, such as losing a single node entirely, require more drastic recovery measures. Losing an entire node or a virtual machine could happen for example due to hardware failure or a severe software failure.
A failing node is automatically detected by the MST monitoring infrastructure. Either the node starts reporting that its own self-diagnostics is reporting problems or the node stops communicating entirely. The monitoring infrastructure automatically schedules a new replacement node to be created when this happens.
In case of database failover, the service URL of your service remains the same. Only the IP address changes to point at the new master node.
Managed Service for TimescaleDB availability features differ based on the service plan:
- Basic and Dev plans: These are single-node plans. Basic plans include a two-day backup history, and Dev plans include a one-day backup history.
- Pro plans: These are two-node plans with a master and a standby for higher availability, and three-day backup histories.
Single node
In the Basic and Dev plans, if you lose the only node from the service, it immediately starts the automatic process of creating a new replacement node. The new node starts up, restores its state from the latest available backup, and resumes the service. Because there was just a single node providing the service, the service is unavailable for the duration of the restore operation. Also, any writes made since the backup of the latest write-ahead log (WAL) file is lost. Typically this time window is limited to either five minutes, or one WAL file.
Highly available nodes
In Pro plans, if a Postgres standby fails, the master node keeps running normally and provides normal service level to the client applications. When the new replacement standby node is ready and synchronized with the master, it starts replicating the master in real time and normal operation resumes.
If the Postgres master fails, the combined information from the MST monitoring
infrastructure and the standby node is used to make a failover decision. On the
nodes, the open source monitoring daemon PGLookout, in combination with the
information from the MST system infrastructure, reports the failover. If the
master node is down completely, the standby node promotes itself as the new
master node and immediately starts serving clients. A new replacement node is
automatically scheduled and becomes the new standby node.
If both master and standby nodes fail at the same time, two new nodes are automatically scheduled for creation and become the new master and standby nodes respectively. The master node restores itself from the latest available backup, which means that there can be some degree of data loss involved. For example, any writes made since the backup of the latest write-ahead log (WAL) file can be lost.
The amount of time it takes to replace a failed node depends mainly on the cloud region and the amount of data that needs to be restored. However, in the case of services with two-node Pro plans, the surviving node keeps serving clients even during the recreation of the other node. This process is entirely automatic and requires no manual intervention.
For backups and restoration, Managed Service for TimescaleDB uses the
open source backup daemon PGHoard that MST maintains. It makes real-time
copies of write-ahead log (WAL) files to an object store in a compressed and
encrypted format.
Connection limits
Managed Service for TimescaleDB limits the maximum number of connections to each
service. The maximum number of allowed connections depends on your service plan.
To see the current connection limit for your service, navigate to the service
Overview tab and locate the Connection Limit section.
If you have a lot of clients or client threads connecting to your database, use connection pooling to limit the number of connections. For more information about connection pooling, see the connection pooling section.
If you have a high number of connections to your database, your service might run more slowly, and could run out of memory. Remain aware of how many open connections your have to your database at any given time.
Service termination protection
You can protect your services from accidentally being terminated, by enabling service termination protection. When termination protection is enabled, you cannot power down the service from the web console, the REST API, or with a command-line client. To power down a protected service, you need to turn off termination protection first. Termination protection does not interrupt service migrations or upgrades.
To enable service termination protection, navigate to the service Overview
tab. Locate the Termination protection section, and toggle to enable
protection.
If you run out of free sign-up credit, and have not entered a valid credit card for payment, your service is powered down, even if you have enabled termination protection.
Idle connections
Managed Service for TimescaleDB uses the default keep alive settings for TCP connections. The default settings are:
tcp_keepalives_idle: 7200tcp_keepalive_count: 9tcp_keepalives_interval: 75
If you have long idle database connection sessions, you might need to adjust these settings to ensure that your TCP connection remains stable. If you experience a broken TCP connection, when you reconnect make sure that your client resolves the DNS address correctly, as the underlying address changes during automatic failover.
For more information about adjusting keep alive settings, see the Postgres documentation.
Long running queries
Managed Service for TimescaleDB does not cancel database queries. If you have created a query that is taking a very long time, or that has hung, it could lock resources on your service, and could prevent database administration tasks from being performed.
You can find out if you have any long-running queries by navigating to the
service Current Queries tab. You can also cancel long running queries from
this tab.
Alternatively, you can use your connection client to view running queries with this command:
SELECT * FROM pg_stat_activity
WHERE state <> 'idle';
Cancel long-running queries using this command, with the PID of the query you want to cancel:
SELECT pg_terminate_backend(<PID>);
If you want to automatically cancel any query that runs over a specified length of time, you can use this command:
SET statement_timeout = <milliseconds>
===== PAGE: https://docs.tigerdata.com/mst/installation-mst/ =====
Get started with Managed Service for TimescaleDB
Managed Service for TimescaleDB (MST) is TimescaleDB hosted on Azure and GCP. MST is offered in partnership with Aiven.
Tiger Cloud is a high-performance developer focused cloud that provides Postgres services enhanced with our blazing fast vector search. You can securely integrate Tiger Cloud with your AWS, GCS or Azure infrastructure. Create a Tiger Cloud service and try for free.
If you need to run TimescaleDB on GCP or Azure, you're in the right place — keep reading.
Create your first service
A service in Managed Service for TimescaleDB is a cloud instance on your chosen cloud provider, which you can install your database on.
Creating your first service
- Sign in to your MST Console.
Click
Create serviceand chooseTimescaleDB, and update your preferences: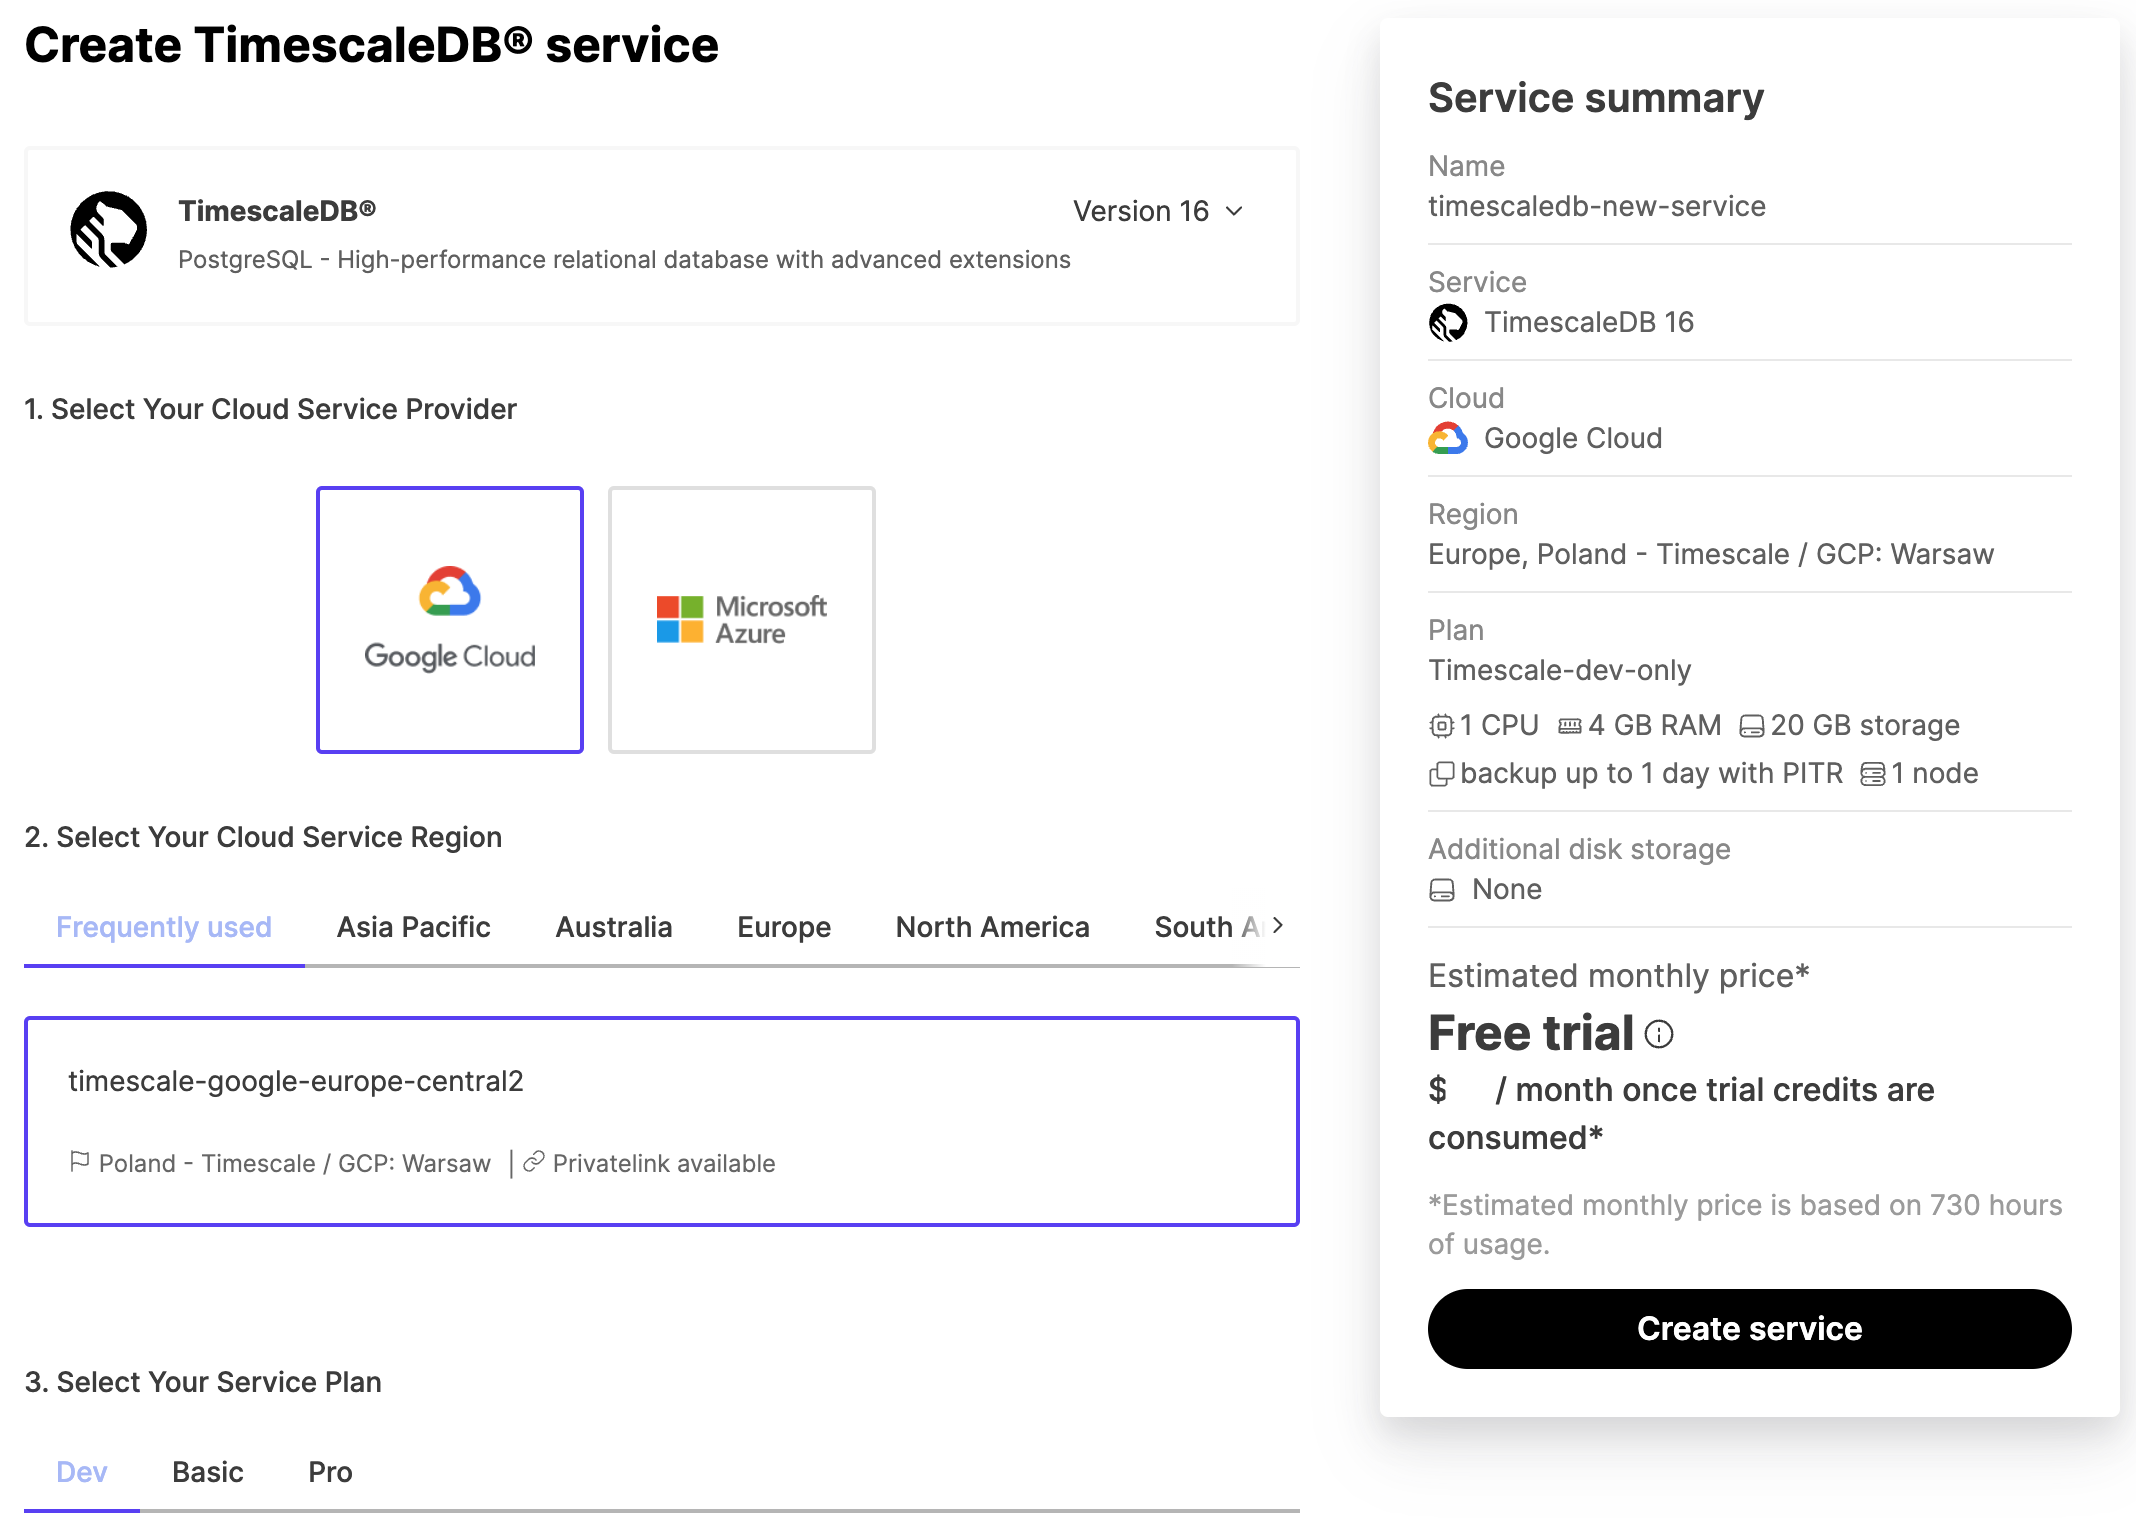
- In the
Select Your Cloud Service Providerfield, click your preferred provider. - In the
Select Your Cloud Service Regionfield, click your preferred server location. This is often the server that's physically closest to you. - In the
Select Your Service Planfield, click your preferred plan, based on the hardware configuration you require. If you are in your trial period, and just want to try the service out, or develop a proof of concept, we recommend theDevplan, because it is the most cost-effective during your trial period.
- In the
In the information bar on the right of the screen, review the settings you have selected for your service, and click
Create Service. The service takes a few minutes to provision.
Connect to your service from the command prompt
When you have a service up and running, you can connect to it from your local
system using the psql command-line utility. This is the same tool you might
have used to connect to Postgres before, but if you haven't installed it yet,
check out the installing psql section.
Connecting to your service from the command prompt
- Sign in to your MST Console.
- In the
Servicestab, find the service you want to connect to, and check it is marked asRunning. - Click the name of the service you want to connect to see the connection
information. Take a note of the
host,port, andpassword. On your local system, at the command prompt, connect to the service, using your own service details:
psql -x "postgres://tsdbadmin:<PASSWORD>@<HOSTNAME>:<PORT>/defaultdb?sslmode=require"If your connection is successful, you'll see a message like this, followed by the
psqlprompt:psql (13.3, server 13.4) SSL connection (protocol: TLSv1.3, cipher: TLS_AES_256_GCM_SHA384, bits: 256, compression: off) Type "help" for help. defaultdb=>
Check that you have the TimescaleDB extension
TimescaleDB is provided as an extension to your Postgres database, and it is
enabled by default when you create a new service on Managed Service for TimescaleDB You can check that the TimescaleDB extension is installed by using
the \dx command at the psql prompt. It looks like this:
defaultdb=> \dx
List of installed extensions
-[ RECORD 1 ]------------------------------------------------------------------
Name | plpgsql
Version | 1.0
Schema | pg_catalog
Description | PL/pgSQL procedural language
-[ RECORD 2 ]------------------------------------------------------------------
Name | timescaledb
Version | 2.5.1
Schema | public
Description | Enables scalable inserts and complex queries for time-series data
defaultdb=>
Install and update TimescaleDB Toolkit
Run this command on each database you want to use the Toolkit with:
CREATE EXTENSION timescaledb_toolkit;
Update an installed version of the Toolkit using this command:
ALTER EXTENSION timescaledb_toolkit UPDATE;
Where to next
Now that you have your first service up and running, you can check out the Managed Service for TimescaleDB section in the documentation, and find out what you can do with it.
If you want to work through some tutorials to help you get up and running with TimescaleDB and time-series data, check out the tutorials section.
You can always contact us if you need help working something out, or if you want to have a chat.
===== PAGE: https://docs.tigerdata.com/mst/ingest-data/ =====
Ingest data
There are several different ways of ingesting your data into Managed Service for TimescaleDB. This section contains instructions to:
- Bulk upload from a
.csvfile - Insert data directly using a client driver, such as JDBC, ODBC, or Node.js
- Insert data directly using a message queue, such as Kafka
Before you begin, make sure you have
created your service,
and can connect to it using psql.
Preparing your new database
Use
psqlto connect to your service.psql -h <HOSTNAME> -p <PORT> -U <USERNAME> -W -d <DATABASE_NAME>You retrieve the service URL, port, and login credentials from the service overview in the MST dashboard.
Create a new database for your data. In this example, the new database is called
new_db:CREATE DATABASE new_db; \c new_db;Create a new SQL table in your database. The columns you create for the table must match the columns in your source data. In this example, the table is storing weather condition data, and has columns for the timestamp, location, and temperature:
CREATE TABLE conditions ( time TIMESTAMPTZ NOT NULL, location text NOT NULL, temperature DOUBLE PRECISION NULL );Load the
timescaledbPostgres extension:CREATE EXTENSION timescaledb; \dxConvert the SQL table into a hypertable:
SELECT create_hypertable('conditions', by_range('time'));The
by_rangedimension builder is an addition to TimescaleDB 2.13.
When you have successfully set up your new database, you can ingest data using one of these methods.
Bulk upload from CSV files
If you have a dataset stored in a .csv file, you can import it into an empty
hypertable. You need to begin by creating the new table, before you
import the data.
Before you begin, make sure you have prepared your new database.
Bulk uploading from a CSV file
Insert data into the new hypertable using the
timescaledb-parallel-copytool. You should already have the tool installed, but you can install it manually from our GitHub repository if you need to. In this example, we are inserting the data using four workers:timescaledb-parallel-copy \ --connection '<service_url>' \ --table conditions \ --file ~/Downloads/example.csv \ --workers 4 \ --copy-options "CSV" \ --skip-headerWe recommend that you set the number of workers lower than the number of available CPU cores on your client machine or server, to prevent the workers having to compete for resources. This helps your ingest go faster.
OPTIONAL: If you don't want to use the
timescaledb-parallel-copytool, or if you have a very small dataset, you can use the PostgresCOPYcommand instead:psql '<service_url>/new_db?sslmode=require' -c "\copy conditions FROM <example.csv> WITH (FORMAT CSV, HEADER)"
Insert data directly using a client driver
You can use a client driver such as JDBC, Python, or Node.js, to insert data directly into your new database.
See the Postgres instructions for using the ODBC driver.
See the Code Quick Starts for using various languages, including Python and node.js.
Insert data directly using a message queue
If you have data stored in a message queue, you can import it into your service. This section provides instructions on using the Kafka Connect Postgres connector.
This connector deploys Postgres change events from Kafka Connect to a runtime service. It monitors one or more schemas in a service, and writes all change events to Kafka topics, which can then be independently consumed by one or more clients. Kafka Connect can be distributed to provide fault tolerance, which ensures the connectors are running and continually keeping up with changes in the database.
You can also use the Postgres connector as a library without Kafka or Kafka Connect. This allows applications and services to directly connect to MST and obtain the ordered change events. In this environment, the application must record the progress of the connector so that when it is restarted, the connect can continue where it left off. This approach can be useful for less critical use cases. However, for production use cases, we recommend that you use the connector with Kafka and Kafka Connect.
See these instructions for using the Kafka connector.
===== PAGE: https://docs.tigerdata.com/mst/user-management/ =====
User management
You can add new users, and manage existing users, in MST Console. New users can be added to an entire project, or a single service.
Project members
You can invite new users to join your project as project members. There are several roles available for project members:
|Role|Invite more users|Modify billing information|Manage existing services|Start and stop services|View service information| |-|-|-|-|-|-| |Admin|✅|✅|✅|✅|✅| |Operator|❌|❌|✅|✅|✅| |Developer|✅|❌|✅|❌|✅| |Read-only|❌|❌|❌|❌|✅|
Users who can manage existing services can create databases and connect to them, on a service that already exists. To create a new service, users need the start and stop services permission.
Adding project members
- Sign in to your MST Console.
- Check that you are in the project that you want to change the members for,
and click
Members. - In the
Project memberspage, type the email address of the member you want to add, and select a role for the member. - Click
Send invitation. - The new user is sent an email inviting them to the project, and the invite
shows in the
Pending invitationslist. You can clickWithdraw invitationto remove an invitation before it has been accepted. - When they accept the invitation, the user details show in the
Memberslist. You can edit a member role by selecting a new role in the list. You can delete a member by clicking the delete icon in the list.
Service users
By default, when you create a new service, a new tsdbadmin user is created.
This is the user that you use to connect to your new service.
The tsdbadmin user is the owner of the database, but is not a superuser. To
access features requiring a superuser, log in as the postgres user instead.
The tsdbadmin user for Managed Service for TimescaleDBs can:
- Create a database
- Create a role
- Perform replication
- Bypass row level security (RLS)
This allows you to use the tsdbadmin user to create another user with any
other roles. For a complete list of roles available, see the
Postgres role attributes documentation.
Your service must be running before you can manage users.
Adding service users
- Sign in to MST Console. By
default, you start in the
Servicesview, showing any services you currently have in your project. - Click the name of the service that you want to add users to.
Select
Users, then clickAdd service user: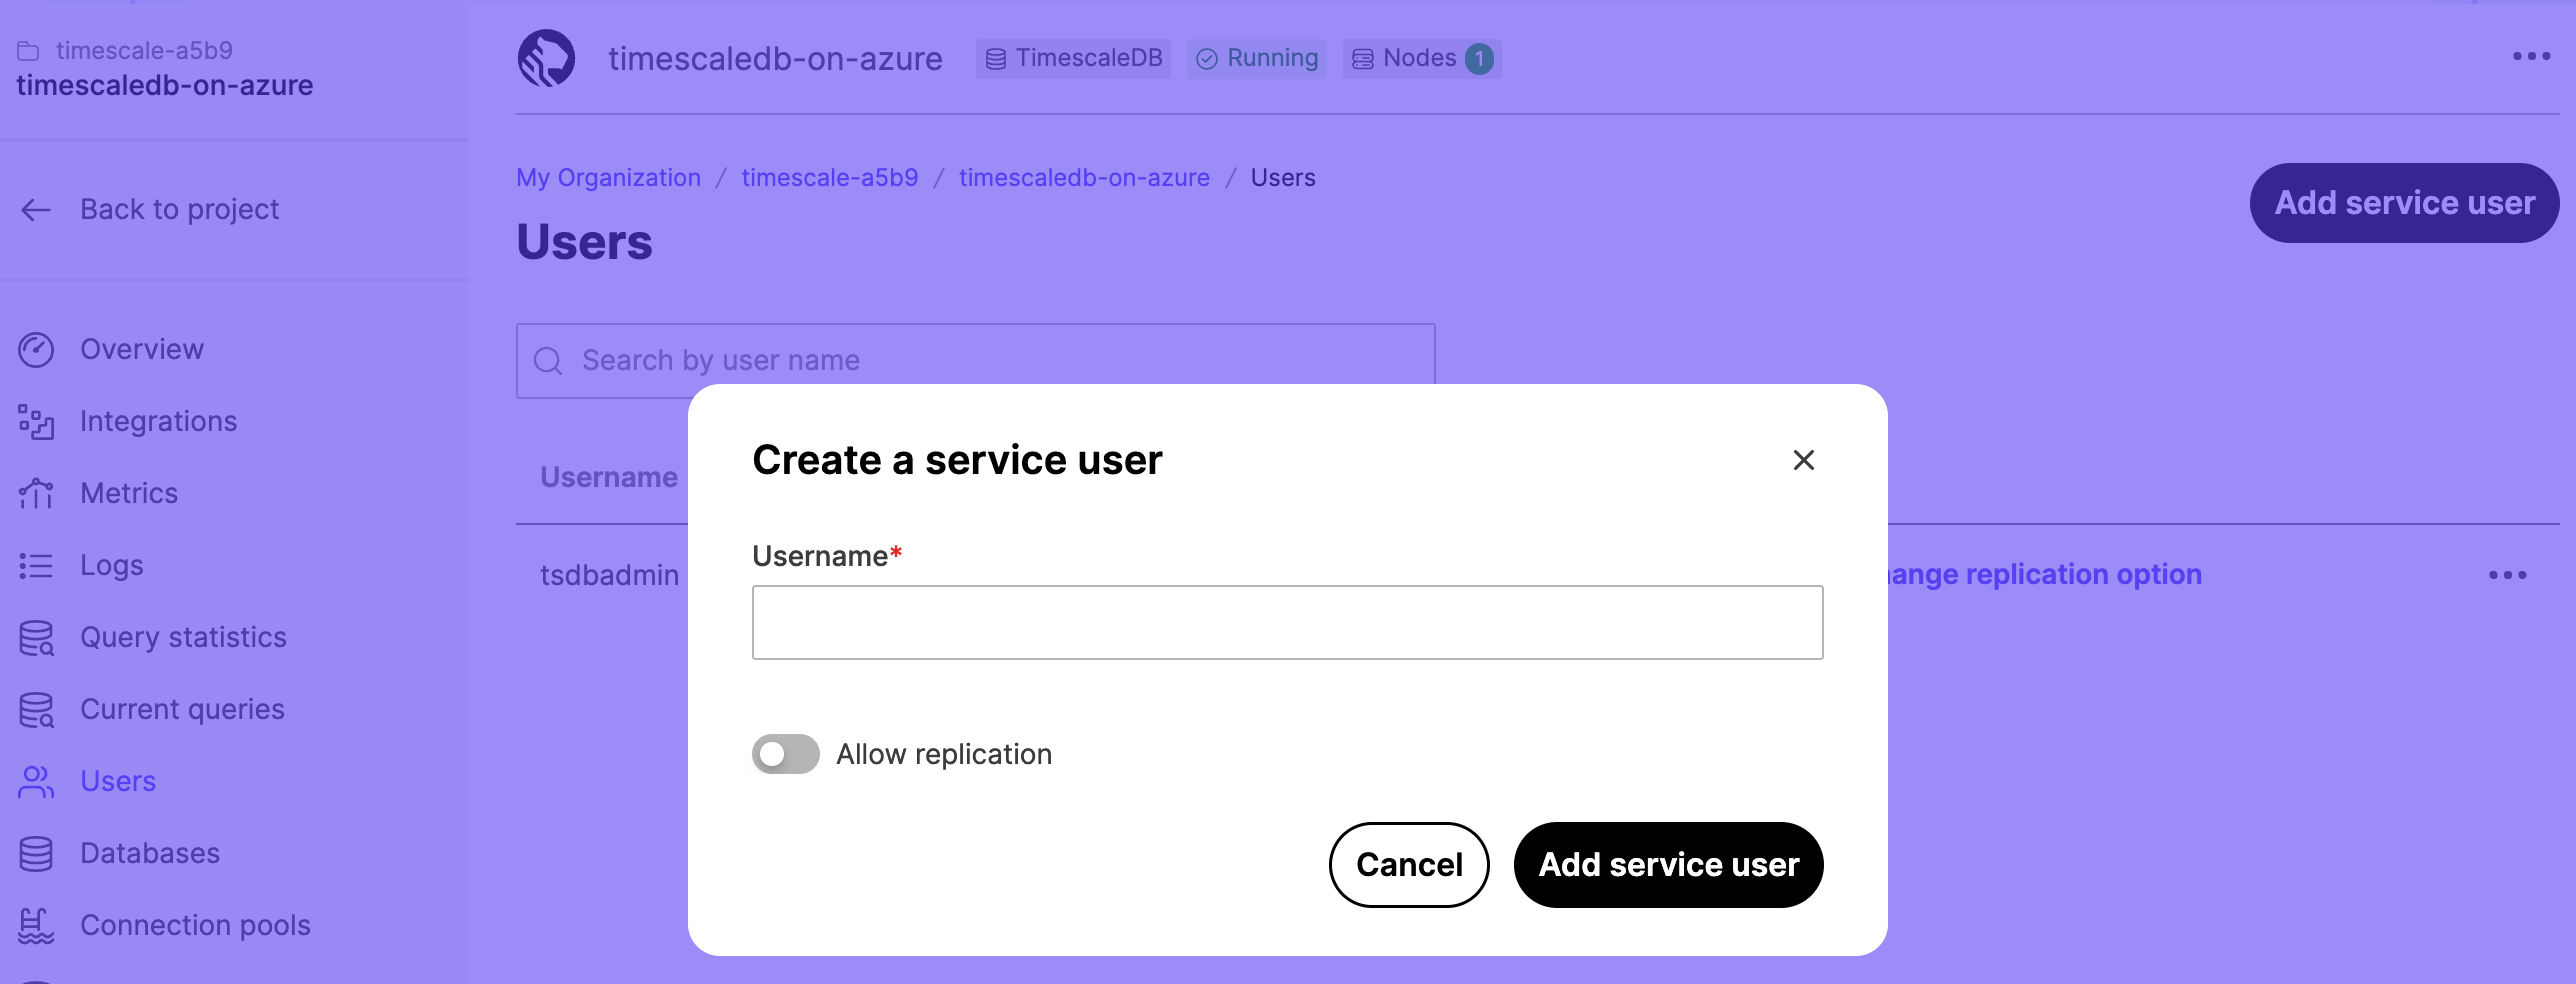
In the
Usernamefield, type a name for your user. If you want to allow the user to be replicated, toggleAllow replication. ClickAdd service userto save the user.The new user shows in the
Usernamelist.To view the password, click the eye icon. Use the options in the list to change the replication setting and password, or delete the user.
Multi-factor user authentication
You can use multi-factor authentication (MFA) to log in to MST Console. This requires an authentication code, provided by the Google Authenticator app on your mobile device.
You can see which authentication method is in use by each member of your Managed Service for TimescaleDB project. From the dashboard, navigate to the Members
section. Each member is listed in the table with an authentication method of
either Password or Two-Factor.
Before you begin, install the Google Authenticator app on your mobile device. For more information, and installation instructions, see the Google Authenticator documentation.
Configuring multi-factor authentication
- Sign in to MST Console.
- Click the
User informationicon in the top-right of the dashboard to go to theUser profilesection. - In the
Authenticationtab, toggleTwo-factor authenticationtoEnabled, and enter your password. - On your mobile device, open the Google Authenticator app, tap
+and selectScan a QR code. - On your mobile device, scan the QR code provided by Managed Service for TimescaleDB.
- In your MST dashboard, enter the confirmation
code provided by the Google Authenticator app, and click
Enable Two-Factor Auth.
If you lose access to the mobile device you use for multi-factor
authentication, you cannot sign in to your Managed Service for TimescaleDB
account. To regain access to your account, on the login screen, click
Forgot password? and follow the step to reset your password. When you have
regained access to your account, reconfigure multi-factor authentication.
User authentication tokens
Every time a registered user logs in, Managed Service for TimescaleDB creates a new authentication token. This occurs for login events using the portal, and using the API. By default, authentication tokens expire after 30 days, but the expiry date is adjusted every time the token is used. This means that tokens can be used indefinitely, if the user logs in at least every 30 days.
You can see the list of all current authentication tokens in the Managed Service for TimescaleDB dashboard. Sign in to your account, and click the
User information icon in the top-right of the dashboard to go to the
User profile section. In the Authentication tab, the table lists all current
authentication tokens.
When you make authentication changes, such as enabling two factor authentication
or resetting a password, all existing tokens are revoked. In some cases, a new
token is immediately created so that the web console session remains valid. You
can also manually revoke authentication tokens from the User profile page
individually, or click Revoke all tokens to revoke all current tokens.
Additionally, you can click Generate token to create a new token. When you
generate a token on this page, you can provide a description, maximum age, and
an extension policy. Generating authentication tokens in this way allows you to
use them with monitoring applications that make automatic API calls to Managed Service for TimescaleDB.
There is a limit to how many valid authentication tokens are allowed per user. This limit is different for tokens that are created as a result of a sign in operation, and for tokens created explicitly. For automatically created tokens, the system automatically deletes the oldest tokens as new ones are created. For explicitly created tokens, older tokens are not deleted unless they expire or are manually revoked. This can result in explicitly created tokens that stop working, even though they haven't expired or been revoked. To avoid this, make sure you sign out at the end of every user session, instead of just discarding your authentication token. This is especially important for automation tools that automatically sign in.
===== PAGE: https://docs.tigerdata.com/mst/billing/ =====
Billing on Managed Service for TimescaleDB
By default, all new services require a credit card, which is charged at the end of the month for all charges accrued over that month. Each project is charged separately. Your credit card statement records the transaction as coming from Aiven, as Aiven provides billing services for Managed Service for TimescaleDB.
Managed Service for TimescaleDB uses hourly billing. This charge is automatically calculated, based on the services you are running in your project. The price charged for your project includes:
- Virtual machine
- Networking
- Backups
- Setting up
Managed Service for TimescaleDB does not charge you for network traffic used by your service. However, your application cloud service provider might charge you for the network traffic going to or from your service.
Terminating or powering a service down stops the accumulation of new charges immediately. However, the minimum hourly charge unit is one hour. For example, if you launch a service and shut it down after 40 minutes, you are charged for one full hour.
Migrating to different service plan levels does not incur extra charges for the migration itself. Note, though, that some service plan levels are more costly per hour, and your new service is charged at the new rate.
Migrating a service to another cloud region or different cloud provider does not incur extra charges.
All prices listed for Managed Service for TimescaleDB are inclusive of credit card and processing fees. However, in some cases, your credit card provider might charge additional fees, such as an international transaction fee. These fees are not charged by Tiger Data or Aiven.
Billing groups
Create billing groups to set up common billing profiles for projects within an organization. Billing groups make it easier to manage your costs since you receive a consolidated invoice for all projects assigned to a billing group and can pay with one saved payment method.
Billing groups can only be used in one organization. Credits are assigned per billing group and are automatically used to cover charges of any project assigned to that group.
You can track spending by exporting cost information to business intelligence tools using the invoice API.
To access billing groups in MST Console, you must be a super admin or account owner.
Create a billing group
To create a billing group, take the following steps:
- In MST Console, click Billing > Billing groups > Create billing group.
- Enter a name for the billing group and click Continue.
- Enter the billing details.
You can copy these details from another billing group by selecting it from the list. Click Continue.
- Select the projects to add to this billing group and click Continue
You can skip this step and add projects later.
- Check the information in the Summary step. To make changes to any section, click Edit.
- When you have confirmed everything is correct, click Create & Assign.
Manage billing groups
To view and update your billing groups, take the following steps:
Rename billing groups:
- In MST Console, go to Billing > Billing groups and find the billing group to rename.
- Click Actions > Rename.
- Enter the new name and click Rename.
Update your billing information:
- In MST Console, go to Billing > Billing groups and click on the name of the group to update.
- Open the Billing information tab and click Edit to update the details for each section.
Delete billing groups
- In MST Console, open Billing > Billing groups and select the group to delete.
- On the Projects tab, confirm that the billing group has no projects. If there are projects listed, move them to a different billing group.
- Go back to the list of billing groups and click Actions > Delete next to the group to be deleted.
Assign and unassign projects
To manage projects in billing groups, take the following steps.
Assign projects to a billing group:
- In MST Console, go to Billing > Billing groups.
- Select the billing group to assign the project to.
- On the Projects tab, click Assign projects.
- Select the projects and click Assign projects.
- Click Cancel to close the dialog box.
Assigning a project that is already assigned to another billing group will unassign it from that billing group.
Move a project to another billing group
- In MST Console, go to Billing > Billing groups.
- Click on the name of the billing group that the project is currently assigned to.
- On the Projects tab, find the project to move.
- Click the three dots for that project and select the billing group to move it to.
Taxation
Aiven provides billing services for Managed Service for TimescaleDB. These services are provided by Aiven Ltd, a private limited company incorporated in Finland.
If you are within the European Union, Finnish law requires that you are charged a value-added tax (VAT). The VAT percentage depends on where you are domiciled. For business customers in EU countries other than Finland, you can use the reverse charge mechanism of 2006/112/EC article 196, by entering a valid VAT ID into the billing information of your project.
If you are within the United States, no tax is withheld from your payments. In
most cases, you do not require a W-8 form to confirm this, however, if you
require a W-8BEN-E form describing this status, you can
request one.
If you are elsewhere in the world, no taxes are applied to your account, according to the Value-Added Tax Act of Finland, section 69 h.
Corporate billing
If you prefer to pay by invoice, or if you are unable to provide a credit card
for billing, you can switch your project to corporate billing instead. Under
this model, invoices are generated at the end of the month based on actual
usage, and are sent in .pdf format by email to the billing email addresses you
configured in your dashboard.
Payment terms for corporate invoices are 14 days net, by bank transfer, to the bank details provided on the invoice. By default, services are charged in US Dollars (USD), but you can request your invoices be sent in either Euros (EUR) or Pounds Sterling (GBP) at the invoice date's currency exchange rates.
To switch from credit card to corporate billing, make sure your billing profile and email address is correct in your project's billing settings, and send a message to the Tiger Data support team asking to be changed to corporate billing.
===== PAGE: https://docs.tigerdata.com/mst/connection-pools/ =====
Connection pools
When you connect to your database, you consume server resources. If you have a lot of connections to your database, you can consume a lot of server resources. One way to mitigate this is to use connection pooling, which allows you to have high numbers of connections, but keep your server resource use low. The more client connections you have to your database, the more useful connection pooling becomes.
By default, Postgres creates a separate backend process for each connection to the server. Connection pooling uses a tool called PGBouncer to pool multiple connections to a single backend process. PGBouncer automatically interleaves the client queries to use a limited number of backend connections more efficiently, leading to lower resource use on the server and better total performance.
Without connection pooling, the database connections are handled directly by
Postgres backend processes, one process per connection:
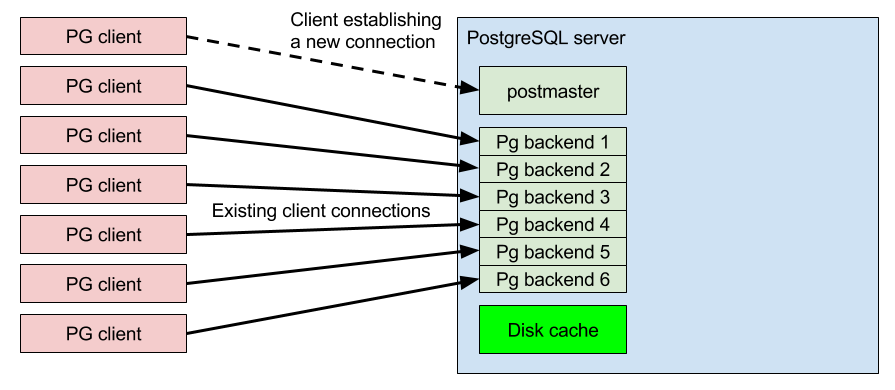
When you add connection pooling, fewer backend connections are required. This
frees up server resources for other tasks, such as disk caching:
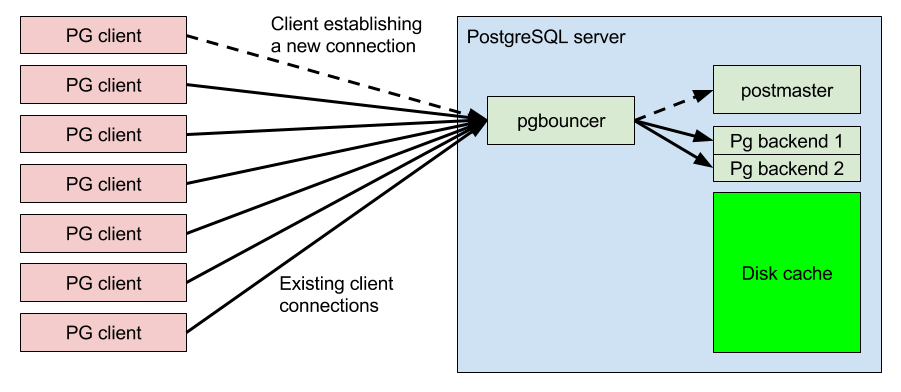
Connection pooling allows you to handle up to 5000 database client connections simultaneously. You can calculate how many connections you can handle by the number of CPU cores you have available. You should have at least one connection per core, but make sure you are not overloading each core. A good number of connections to aim for is three to five times the available CPU cores, depending on your workload.
Connection pooling modes
There are several different pool modes:
- Transaction (default)
- Session
- Statement
Transaction pooling mode
This is the default pooling mode. It allows each client connection to take turns using a backend connection during a single transaction. When the transaction is committed, the backend connection is returned back into the pool and the next waiting client connection reuses the same connection immediately. This provides quick response times for queries as long as the most transactions are performed quickly. This is the most commonly used mode.
Session pooling mode
This mode holds a client connection until the client disconnects. When the client disconnects, the server connection is returned back into the connection pool free connection list, to wait for the next client connection. Client connections are accepted at TCP level, but their queries only proceed when another client disconnects and frees up the backend connection back into the pool. This mode is useful when you require a wait queue for incoming connections, while keeping the server memory usage low. However, it is not useful in most common scenarios because the backend connections are recycled very slowly.
Statement pooling mode
This mode is similar to the transaction pool mode, except that instead of allowing a full transaction to be run, it cycles the server side connections after each and every database statement (SELECT, INSERT, UPDATE, DELETE, for example). Transactions containing multiple SQL statements are not allowed in this mode. This mode is best suited to specialized workloads that use sharding front-end proxies.
Set up a connection pool
You can set up a connection pool from the MST Console. Make sure you have already created a service that you want to add connection pooling to.
Setting up a connection pool
- In MST Console, navigate to the
Serviceslist, and click the name of the service you want to add connection pooling to. - In the
Service overviewpage, navigate to thePoolstab. When you have created some pools, they are shown here. - Click
Add Poolto create a new pool. - In the
Create New Connection Pooldialog, use these settings:- In the
Pool namefield, type a name for your new pool. This name becomes the databasedbnameconnection parameter for your pooled client connectons. - In the
Databasefield, select a database to connect to. Each pool can only connect to one database. - In the
Pool Modefield, select which pool mode to use. - In the
Pool Sizefield, select the maximum number of server connections this pool can use at any one time. - In the
Usernamefield, select which database username to connect to the database with.
- In the
- Click
Createto create the pool, and see the details of the new pool in the list. You can clickInfonext to the pool details to see more information, including the URI and port details.
Pooled servers use a different port number than regular servers. This allows you to use both pooled and un-pooled connections at the same time.
===== PAGE: https://docs.tigerdata.com/mst/viewing-service-logs/ =====
Viewing service logs
Occasionally there is a need to inspect logs from Managed Service for TimescaleDB. For example, to debug query performance or inspecting errors caused by a specific workload.
There are different built-in ways to inspect service logs at Managed Service for TimescaleDB:
- When you select a specific service, navigate to the
Logstab to see recent events. Logs can be browsed back in time. Download logs using the command-line client by running:
avn service logs -S desc -f --project <PROJECT_NAME> <SERVICE_NAME>REST API endpoint is available for fetching the same information two above methods output, in case programmatic access is needed.
Service logs included on the normal service price are stored only for a few days. Unless you are using logs integration to another service, older logs are not accessible.
===== PAGE: https://docs.tigerdata.com/mst/vpc-peering/ =====
VPC peering
Virtual Private Cloud (VPC) peering is a method of connecting separate Cloud private networks to each other. It makes it possible for the virtual machines in the different VPCs to talk to each other directly without going through the public internet. VPC peering is limited to VPCs that share the same Cloud provider.
VPC peering setup is a per project and per region setting. This means that all services created and running utilize the same VPC peering connection. If needed, you can have multiple projects that peer with different connections.
services are only accessible using your VPC's internal network. They are not accessible from the public internet. TLS certificates for VPC peered services are signed by the MST project CA and cannot be validated against a public CA (Let's Encrypt). You can choose whether you want to run on a VPC peered network or on the public internet for every service.
You can set up VPC peering on:
===== PAGE: https://docs.tigerdata.com/mst/integrations/ =====
Integrations for Managed Service for TimescaleDB
Managed Service for TimescaleDB integrates with the other tools you are already using. You can combine your services with third-party tools and build a complete cloud data platform.
You can integrate Managed Service for TimescaleDB with:
- Grafana
- Loggly
- Datadog
- Prometheus
- Syslog
- External Elasticsearch
- External OpenSearch
===== PAGE: https://docs.tigerdata.com/mst/extensions/ =====
Supported Postgres extensions in Managed Service for TimescaleDB
Managed Service for TimescaleDB supports many Postgres extensions. See available extensions for a full list.
Add an extension
You can add a supported extension to your database from the command line.
Some extensions have dependencies. When adding these, make sure to create them in the proper order.
Some extensions require disconnecting and reconnecting the client connection before they are fully available.
Adding an extension
- Connect to your database as the
tsdbadminuser. - Run
CREATE EXTENSION IF NOT EXISTS <extension_name>.
Available extensions
These extensions are available on Managed Service for TimescaleDB:
- address_standardizer
- address_standardizer_data_us
- aiven_extras
- amcheck
- anon
- autoinc
- bloom
- bool_plperl
- btree_gin
- btree_gist
- citext
- cube
- dblink
- dict_int
- dict_xsyn
- earthdistance
- file_fdw
- fuzzystrmatch
- h3
- h3_postgis
- hll
- hstore
- hstore_plperl
- insert_username
- intagg
- intarray
- isn
- jsonb_plperl
- lo
- ltree
- moddatetime
- pageinspect
- pg_buffercache
- pg_cron
- pg_freespacemap
- pg_prewarm
- pg_repack
- pg_similarity
- pg_stat_monitor
- pg_stat_statements
- pg_surgery
- pg_trgm
- pg_visibility
- pg_walinspect
- pgaudit
- pgcrypto
- pgrouting
- pgrowlocks
- pgstattuple
- plperl
- plpgsql
- postgis
- postgis_raster
- postgis_sfcgal
- postgis_tiger_geocoder
- postgis_topology
- postgres_fdw
- refint
- rum
- seg
- sslinfo
- tablefunc
- tcn
- timescaledb
- tsm_system_rows
- tsm_system_time
- unaccent
- unit
- uuid-ossp
- vector
- vectorscale
- xml2
- timescaledb_toolkit
The postgis_legacy extension is not packaged or supported as an extension by
the PostGIS project. Tiger Data provides the extension package for Managed Service for TimescaleDB.
Request an extension
You can request an extension not on the list by contacting Support. In your request, specify the database service and user database where you want to use the extension.
Untrusted language extensions are not supported. This restriction preserves our
ability to offer the highest possible service level. An example of an untrusted
language extension is plpythonu.
You can contact Support directly from Managed Service for TimescaleDB. Click the life-preserver icon in the upper-right corner of your dashboard.
===== PAGE: https://docs.tigerdata.com/mst/dblink-extension/ =====
Using the dblink extension in Managed Service for TimescaleDB
The dblink Postgres extension allows you to connect to
other Postgres databases and to run arbitrary queries.
You can use foreign data wrappers (FDWs) to define a remote
foreign server to access its data. The database connection details such as
hostnames are kept in a single place, and you only need to create a
user mapping to store remote connections credentials.
Prerequisites
Before you begin, sign in to your service,
navigate to the Overview tab, and take a note of these parameters for the
Postgres remote server. Alternatively, you can use the avn service get
command in the Aiven client:
HOSTNAME: The remote database hostnamePORT: The remote database portUSER: The remote database user to connect. The default user istsdbadmin.PASSWORD: The remote database password for theUSERDATABASE_NAME: The remote database name. The default database name isdefaultdb.
Enable the dblink extension
To enable the dblink extension on an MST Postgres service:
Connect to the database as the
tsdbadminuser:psql -x "postgres://tsdbadmin:<PASSWORD>@<HOSTNAME>:<PORT>/defaultdb?sslmode=require"Create the
dblinkextensionCREATE EXTENSION dblink;Create a table named
inventory:CREATE TABLE inventory (id int);Insert data into the
inventorytable:INSERT INTO inventory (id) VALUES (100), (200), (300);
Create a foreign data wrapper using dblink_fdw
Create a user
user1who can access thedblinkCREATE USER user1 PASSWORD 'secret1'Create a remote server definition named
mst_remote, usingdblink_fdwand the connection details of the service.CREATE SERVER mst_remote FOREIGN DATA WRAPPER dblink_fdw OPTIONS ( host 'HOST', dbname 'DATABASE_NAME', port 'PORT' );Create a user mapping for the
user1to automatically authenticate as thetsdbadminwhen using thedblink:CREATE USER MAPPING FOR user1 SERVER mst_remote OPTIONS ( user 'tsdbadmin', password 'PASSWORD' );Enable
user1to use the remote Postgres connectionmst_remote:GRANT USAGE ON FOREIGN SERVER mst_remote TO user1;
Query data using a foreign data wrapper
In this example in the user1 user queries the remote table inventory defined
in the target Postgres database from the mst_remote server definition:
Quering data using a foreign data wrapper
To query a foreign data wrapper, you must be a database user with the necessary permissions on the remote server.
Connect to the service as
user1with necessary grants to the remote server.Establish the
dblinkconnection to the remote target server:SELECT dblink_connect('my_new_conn', 'mst_remote');Query using the foreign server definition as parameter:
SELECT * FROM dblink('my_new_conn','SELECT * FROM inventory') AS t(a int);
Output is similar to:
a
-----
100
200
300
(3 rows)
===== PAGE: https://docs.tigerdata.com/mst/security/ =====
Security overview
This section covers how Managed Service for TimescaleDB handles security of your data while it is stored.
Cloud provider accounts
services are hosted by cloud provider accounts controlled by Tiger Data. These accounts are managed only by Tiger Data and Aiven operations personnel. Members of the public cannot directly access the cloud provider account resources.
Virtual machines
Your services are located on one or more virtual machines. Each virtual machine is dedicated to a single customer, and is never multi-tenanted. Customer data never leaves the virtual machine, except when uploaded to an offsite backup location.
When you create a new service, you need to select a cloud region. When the virtual machine is launched, it does so in the cloud region you have chosen. Your data never leaves the chosen cloud region.
If a cloud region has multiple Availability Zones, or a similar high-availability mechanism, the virtual machines are distributed evenly across the zones. This provides the best possible service if an Availability Zone becomes unavailable.
Access to the virtual machine providing your service is restricted. Software that is accessing your database needs to run on a different virtual machine. To reduce latency, it is best for it to be using a virtual machine provided by the same cloud provider, and in the same region, if possible.
Virtual machines are not reused. They are terminated and wiped when you upgrade or delete your service.
Project security
Every Managed Service for TimescaleDB project has its own certificate authority. This certificate authority is used to sign certificates used internally by your services to communicate between different cluster nodes and to management systems.
You can download your project certificate authority in MST Console. In the Services tab, click the service you want to find
the certificate for. In the service Overview tab, under Connection
information, locate the CA Certificate section, and click Show to see the
certificate. It is recommended that you set up your browser or client to trust
that certificate.
All server certificates are signed by the project certificate authority OF MST Console.
Data encryption
Managed Service for TimescaleDB at-rest data encryption covers both active service instances as well as service backups in cloud object storage.
Service instances and the underlying virtual machines use full volume
encryption. The encryption method uses LUKS, with a randomly generated ephemeral
key per each instance, and per volume. The keys are never re-used, and are
disposed of when the instance is destroyed. This means that a natural key
rotation occurs with roll-forward upgrades. By default, the LUKS mode is
aes-xts-plain64:sha256, with a 512-bit key.
Backups are encrypted with a randomly generated key per file. These keys are in turn encrypted with an RSA key-encryption key-pair, and stored in the header section of each backup segment. The file encryption is performed with AES-256 in CTR mode, with HMAC-SHA256 for integrity protection. The RSA key-pair is randomly generated for each service. The key lengths are 256-bit for block encryption, 512-bit for the integrity protection, and 3072-bits for the RSA key.
Encrypted backup files are stored in the object storage in the same region that the virtual machines are located for the service.
Networking security
Access to provided services is only provided over TLS encrypted connections. TLS ensures that third-parties can't eavesdrop or modify the data while it's in transit between your service and the clients accessing your service. You cannot use unencrypted plain text connections.
Communication between virtual machines within Managed Service for TimescaleDB is secured with either TLS or IPsec. You cannot use unencrypted plaintext connections.
Virtual machines network interfaces are protected by a dynamically configured firewall based on iptables, which only allows connections from specific addresses. This is used for network traffic from the internal network to other VMs in the same service, and for external public network, to client connections.
By default, new services accept incoming traffic from all sources, which is used to simplify initial set up of your service. It is highly recommended that you restrict the IP addresses that are allowed to establish connections to your services.
Configure allowed incoming IP addresses for your service
- In MST Console, select the service to update.
In
Overviewcheck thePortnumber.This is the port that you are managing inbound access for.
In
Network, checkIP filters. The default value is `Open for all.Click the ellipsis (...) to the right of Network, then select
Set public IP filters.Set the
Allowed inbound IP addresses:
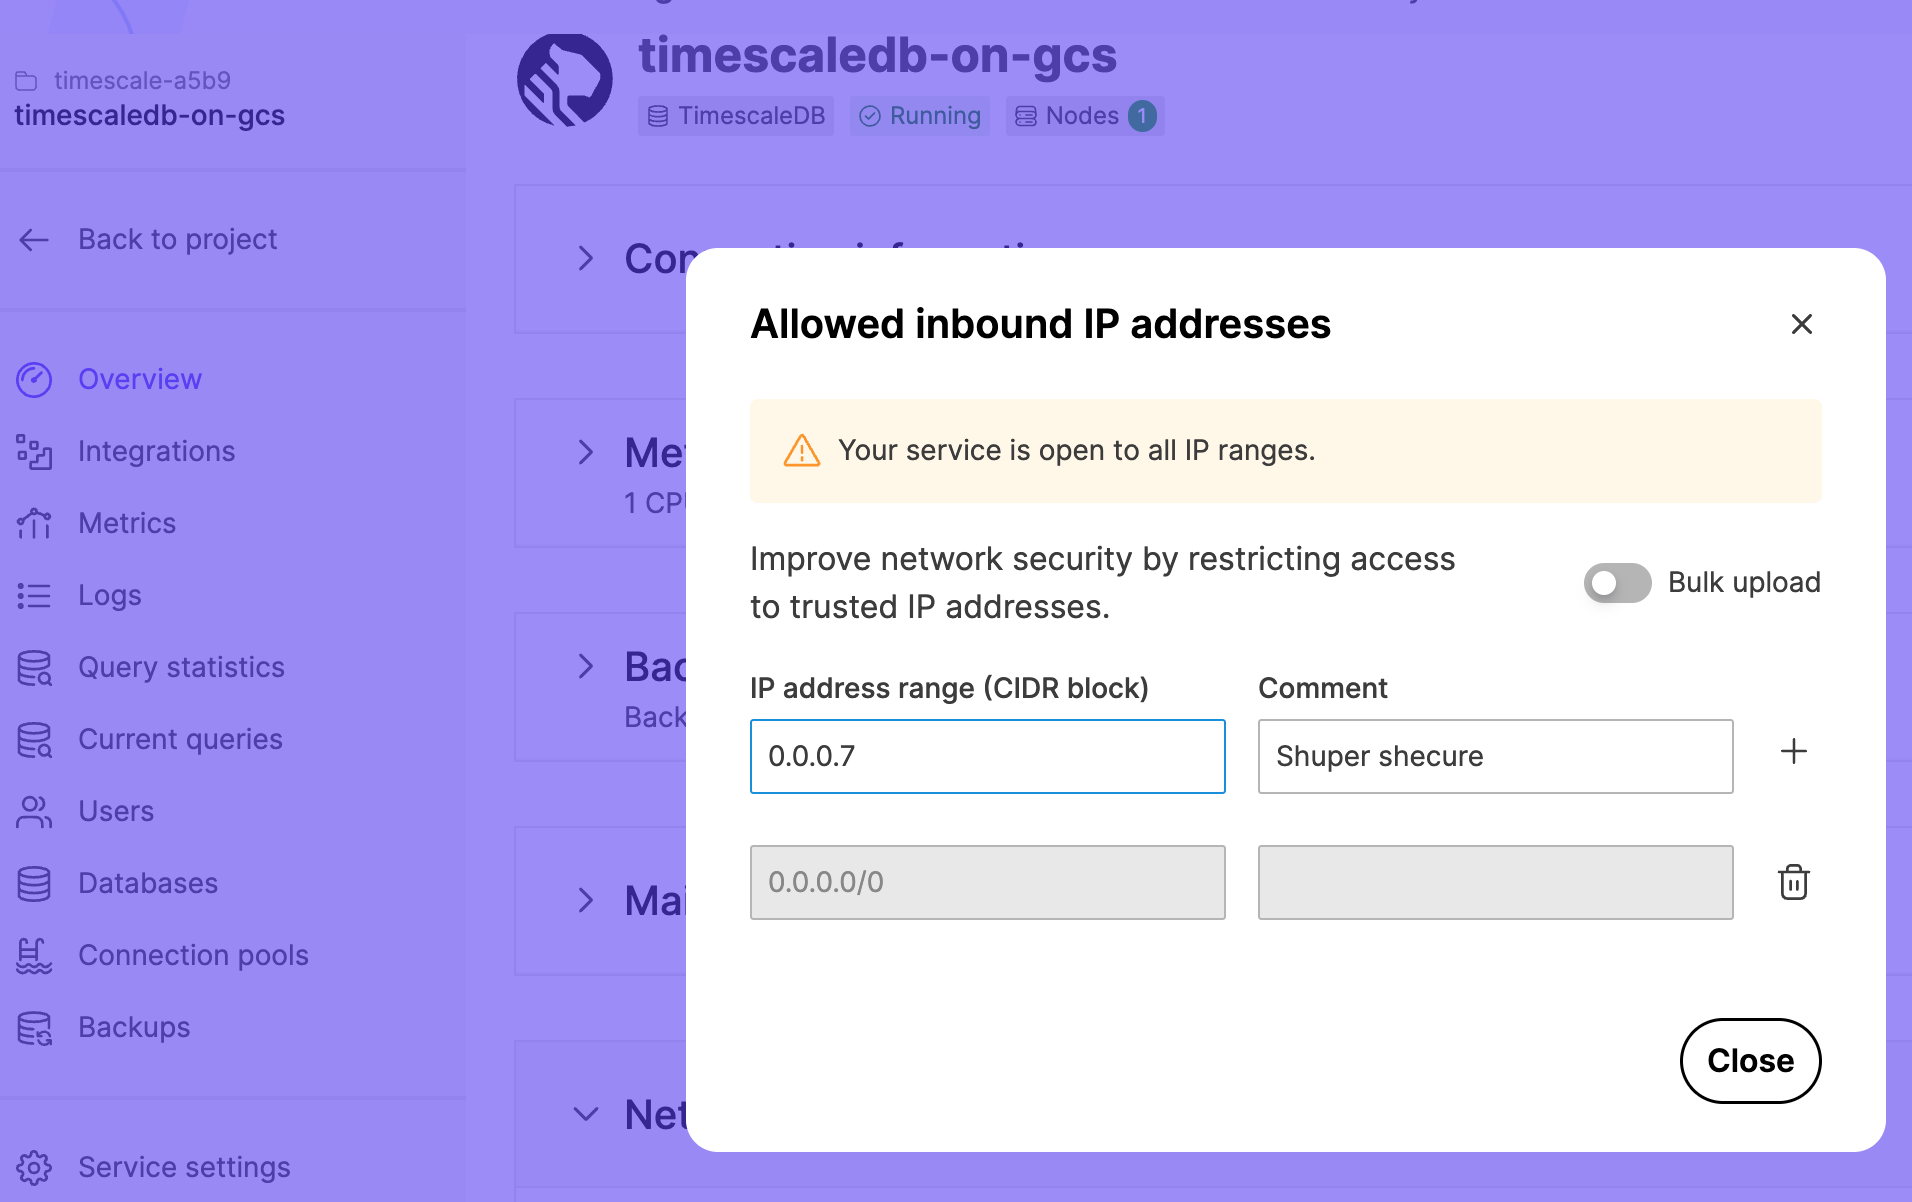
Networking with VPC peering
When you set up VPC peering, you cannot access your services using public internet-based access. Service addresses are published in the public DNS record, but they can only be connected to from your peered VPC network using private network addresses.
The virtual machines providing your service are hosted by cloud provider accounts controlled by Tiger Data.
Customer data privacy
Customer data privacy is of utmost importance at Tiger Data. Tiger Data works with Aiven to provide Managed Service for TimescaleDB.
In most cases, all the resources required for providing your services are automatically created, maintained, and terminated by the Managed Service for TimescaleDB infrastructure, with no manual operator intervention required.
The Tiger Data Operations Team are able to securely log in to your service Virtual Machines, for the purposes of troubleshooting, as required. Tiger Data operators never access customer data unless you explicitly request them to do so, to troubleshoot a technical issue. This access is logged and audited.
There is no ability for any customer or member of the public to access any virtual machines used in Managed Service for TimescaleDB.
Managed Service for TimescaleDB services are periodically assessed and penetration tested for any security issues by an independent professional cyber-security vendor.
Aiven is fully GDPR-compliant, and has executed data processing agreements (DPAs) with relevant cloud infrastructure providers. If you require a DPA, or if you want more information about information security policies, contact Tiger Data.
===== PAGE: https://docs.tigerdata.com/mst/postgresql-read-replica/ =====
Create a read-only replica of Postgres
Postgres read-only replicas allow you to perform read-only queries against the replica and reduce the load on the primary server. You can optimize query response times across different geographical locations because the replica can be created in different regions or on different cloud providers. For information about creating a read-only replica using the Aiven client, see the documentation on creating a read replica using the CLI.
If you are running a Managed Service for TimescaleDB Pro plan, you have standby nodes available in a high availability setup. The standby nodes support read-only queries to reduce the effect of slow queries on the primary node.
Creating a replica of Postgres
In MST Console, click the service you want to create a remote replica for.
In
Overview, clickCreate a read replica.In
Create a PostgreSQL read replica, type a name for the remote replica, select the cloud provider, location, plan that you want to use, and clickCreate.
When the read-only replica is created it is listed as a service in your
project. The Overview tab of the replica also lists the name of the primary
service for the replica. To promote a read-only replica as a master database,
click the Promote to master button.
Using read-only replica for the service on MST
In the
Overviewpage of the read-only replica for the service on MST, copy theService URI.At the psql prompt, connect to the read-only service:
psql <SERVICE_URI>To check whether you are connected to a primary or replica node:
SELECT * FROM pg_is_in_recovery();If the output is
TRUEyou are connected to the replica, and if the output isFALSEyou are connected to the primary server.
Managed Service for TimescaleDB uses asynchronous replication, so some lag is
expected. When you run an INSERT operation on the primary node, a small
delay of less than a second is expected for the change to propagate to the
replica.
===== PAGE: https://docs.tigerdata.com/mst/maintenance/ =====
Maintenance
On Managed Service for TimescaleDB, software updates are handled automatically, and you do not need to perform any actions to keep up to date.
Non-critical software updates are applied during a maintenance window that you can define to suit your workload. If a security vulnerability is found that affects you, maintenance might be performed outside of your scheduled maintenance window.
After maintenance updates have been applied, if a new version of the TimescaleDB binary has been installed, you need to update the extension to use the new version. To do this, use this command:
ALTER EXTENSION timescaledb UPDATE;
After a maintenance update, the DNS name remains the same, but the IP address it points to changes.
Non-critical maintenance updates
Non-critical upgrades are made available before the upgrade is performed
automatically. During this time you can click Apply upgrades to start the
upgrade at any time. However, after the time expires, usually around a week,
the upgrade is triggered automatically in the next available maintenance window
for your service. You can configure the maintenance window so that these
upgrades are started only at a particular time, on a set day of the week. If
there are no pending upgrades available during a regular maintenance window, no
changes are performed.
When you are considering your maintenance window schedule, you might prefer to choose a day and time that usually has very low activity, such as during the early hours of the morning, or over the weekend. This can help minimize the impact of a short service interruption. Alternatively, you might prefer to have your maintenance window occur during office hours, so that you can monitor your system during the upgrade.
Adjusting your maintenance window
- In MST Console, click the service that you want to manage the maintenance window for.
- Click the ellipses (...) to the right of
Maintenance, then clickChange maintenence window. - In the
Service Maintenance Windowdialog, select the day of the week and the time (in Universal Coordinated Time) you want the maintenance window to start. Maintenance windows can run for up to four hours.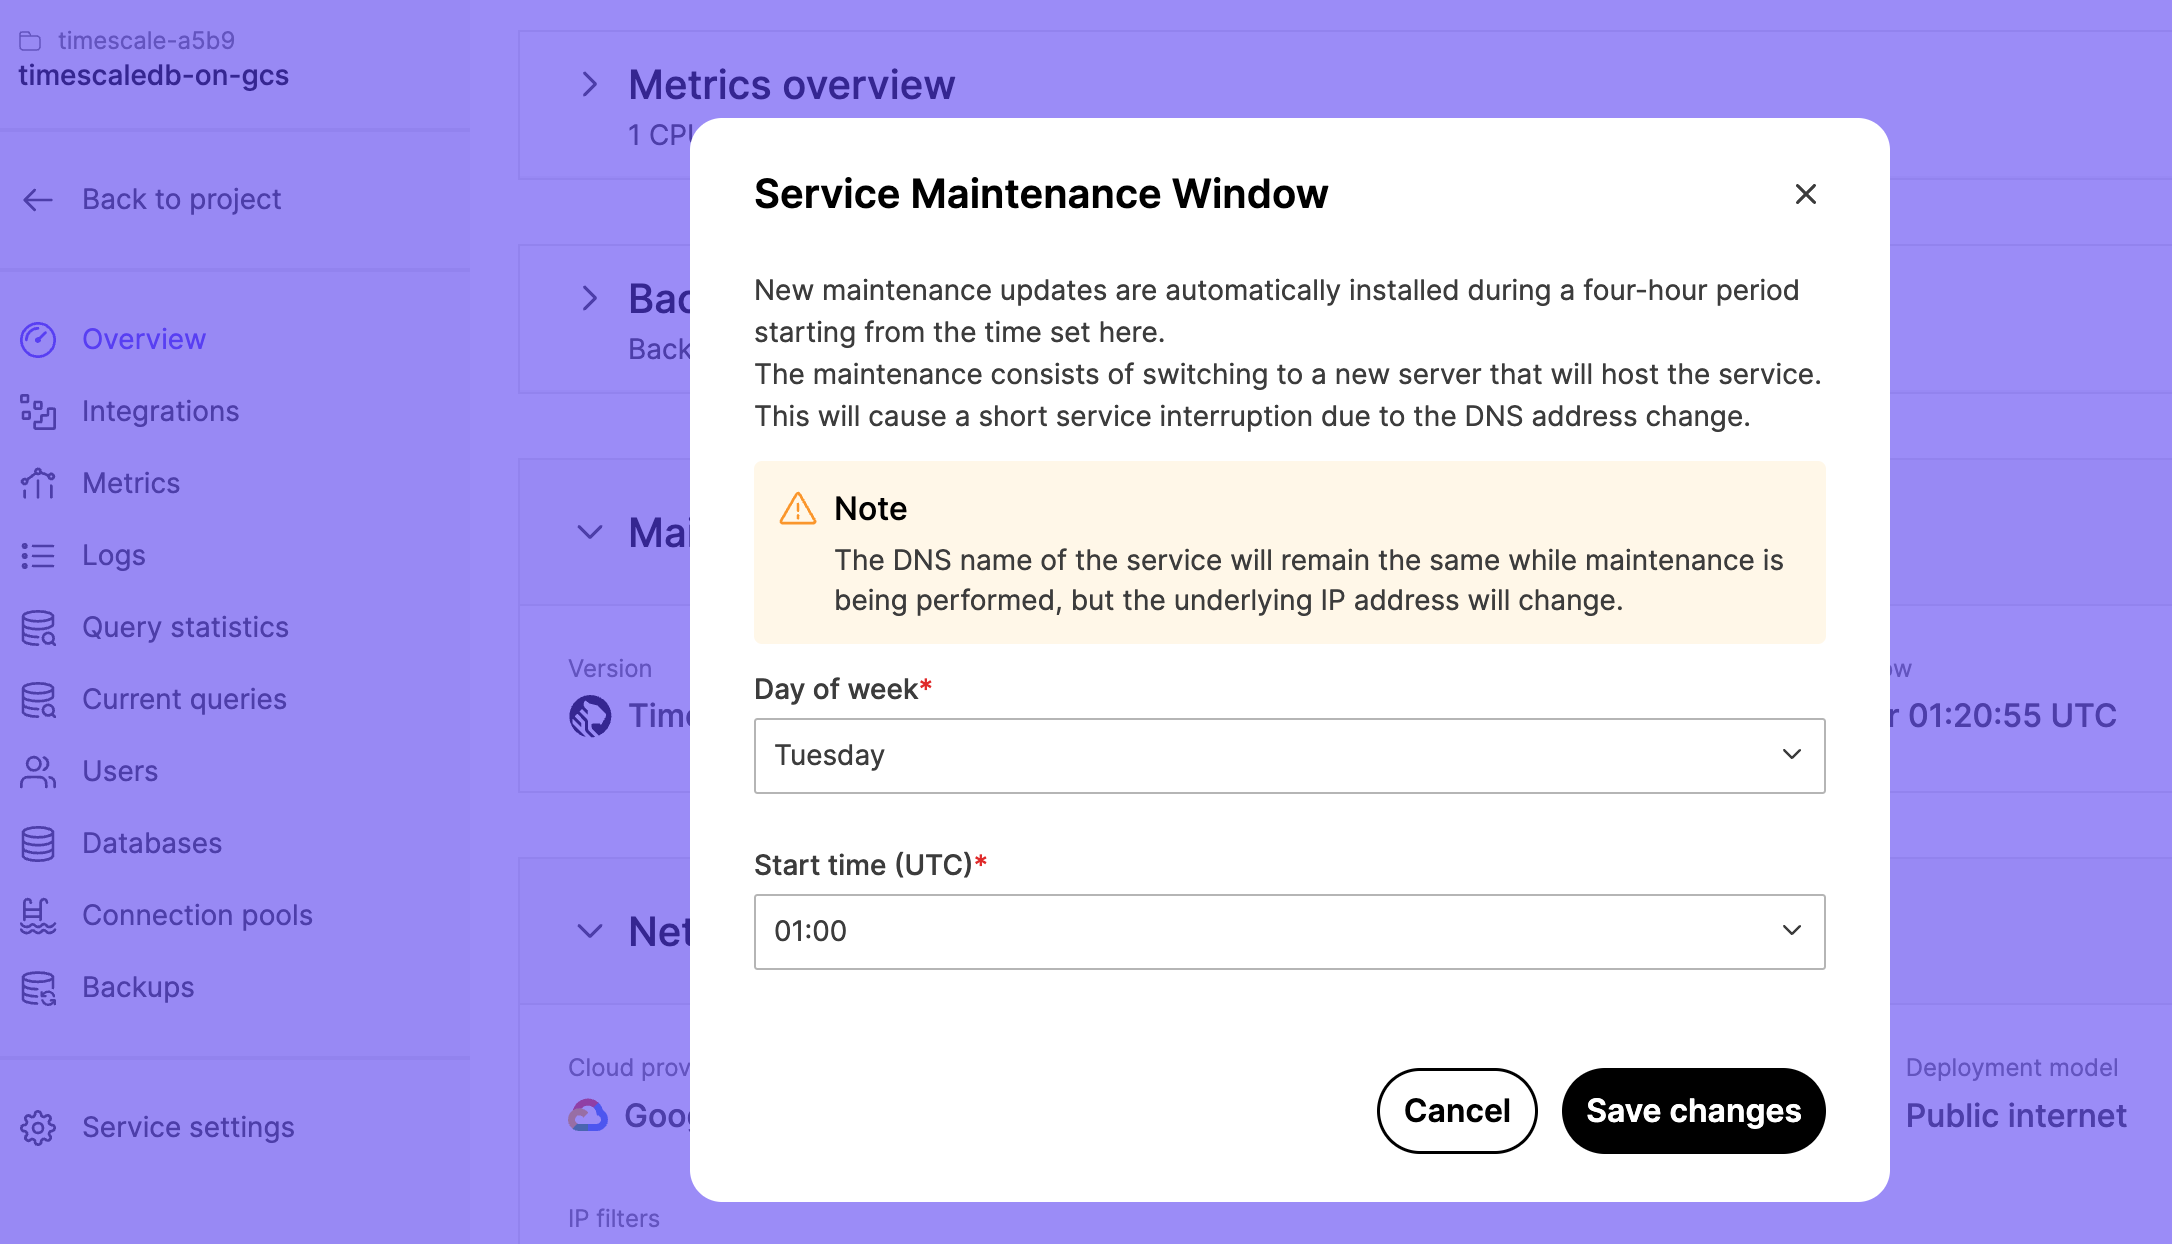
- Click
Save Changes.
Critical updates
Critical upgrades and security fixes are installed outside normal maintenance windows when necessary, and sometimes require a short outage.
Upgrades are performed as rolling upgrades where completely new server instances are built alongside the old ones. When the new instances are up and running they are synchronized with the old servers, and a controlled automatic failover is performed to switch the service to the new upgraded servers. The old servers are retired automatically after the new servers have taken over. The controlled failover is a very quick and safe operation and it takes less than a minute to get clients connected again. In most cases, there is five to ten second outage during this process.
===== PAGE: https://docs.tigerdata.com/mst/failover/ =====
Failover
One standby read-only replica server is configured, for each service on a Pro plan. You can query a read-only replica server, but cannot write to a read-only replica server. When a master server fails, the standby replica server is automatically promoted as master. If you manually created a read-only replica service, then if a master server fails, the read-only replica services are not promoted as master servers.
The two distinct cases during which failovers occur are:
- When the master or replica fails unexpectedly, for example because the hardware hosting the virtual machine fails.
- When controlled failover happens because of upgrades.
Uncontrolled master or replica fail
When a replica server fails unexpectedly, there is no way to know whether the server really failed, or whether there is a temporary network glitch with the cloud provider's network.
There is a 300 second timeout before Managed Service for TimescaleDB
automatically decides the server is gone and spins up a new replica server.
During these 300 seconds, replica.servicename.timescaledb.io points to a
server that may not serve queries anymore. The DNS record pointing to the master
server servicename.timescaledb.io continues to serve the queries. If the replica
server does not come back up within 300 seconds,
replica.servicename.timescaledb.io points to the master server, until a new
replica server is built.
When the master server fails, a replica server waits for 60 seconds before
promoting itself as master. During this 60-second timeout, the master server
servicename.timescaledb.io remains unavailable and does not respond. However,
replica.servicename.timescaledb.io works in read-only mode. After the replica
server promotes itself as master, servicename.timescaledb.io points to the new
master server, and replica.servicename.timescaledb.io continues to point to
the new master server. A new replica server is built automatically, and after it
is in sync, replica.servicename.timescaledb.io points to the new replica
server.
Controlled failover during upgrades
When applying upgrades or plan changes on business or premium plans, the standby server is replaced:
A new server is started, the backup is restored, and the new server starts
following the old master server. After the new server is up and running,
replica.servicename.timescaledb.io is updated, and the old replica server is
deleted.
For premium plans, this step is executed for both replica servers before the master
server is replaced. Two new servers are started, a backup is restored, and one new
server is synced up to the old master server. When it is time to switch the master
to a new server, the old master is terminated and one of the new replica servers
is immediately promoted as a master. At this point, servicename.timescaledb.io
is updated to point at the new master server. Similarly, the new master is
removed from the replica.servicename.timescaledb.io record.
===== PAGE: https://docs.tigerdata.com/mst/manage-backups/ =====
Back up and restore your Managed Service for TimescaleDB
services are automatically backed up, with full backups daily, and write-ahead log (WAL) continuously recorded. All backups are encrypted.
Managed Service for TimescaleDB uses pghoard, a Postgres backup
daemon and restore tool, to store backup data in cloud object stores. The number
of backups stored and the retention time of the backup depend on the service
plan.
The size of logical backups can be different from the size of the Managed Service for TimescaleDB backup that appears on the web console. In some cases,
the difference is significant. Backup sizes that appear in the MST Console are for daily backups, before encryption and
compression. To view the size of each database, including space consumed by
indexes, you can use the \l+ command at the psql prompt.
Logical and binary backups
The two types of backups are binary backups and logical backups. Full backups
are version-specific binary backups which, when combined with WAL, allow
consistent recovery to a point in time (PITR). You can create a logical backup
with the pg_dump command.
This table lists the differences between binary and logical backups when backing up indexes, transactions, and data:
|Type|Binary|Logical| |-|-|-| |index|contains all data from indexes|does not contain index data, it contains only queries used to recreate indexes from other data| |transactions|contains uncommitted transactions|does not contain uncommitted transactions| |data|contains deleted and updated rows which have not been cleaned up by Postgres VACUUM process, and all databases, including templates|does not contain any data already deleted, and depending on the options given, the output might be compressed|
Restore a service
Managed Service for TimescaleDB provides a point-in-time recovery (PITR). To
restore your service from a backup, click the Restore button in the Backups
tab for your service. The backups are taken automatically by Managed Service for TimescaleDB and retained for a few days depending on your plan type.
|Plan type|Backup retention period| |-|-| |Dev|1 day| |Basic|2 days| |Pro|3 days|
Manually creating a backup
You can use pg_dump to create a backup manually. The pg_dump command allows
you to create backups that can be directly restored elsewhere if required.
Typical parameters for the command pg_dump include:
pg_dump '<SERVICE_URL_FROM_PORTAL>' -f '<TARGET_FILE/DIR>' -j '<NUMBER_OF_JOBS>' -F '<BACKUP_FORMAT>'
The pg_dump command can also be run against one of the standby nodes. For
example, use this command to create a backup in directory format using two
concurrent jobs. The results are stored to a directory named backup:
pg_dump 'postgres://tsdbadmin:password@mypg-myproject.a.timescaledb.io:26882/defaultdb?sslmode=require' -f backup -j 2 -F directory
You can put all backup files to single tar file and upload to Amazon S3. For example:
export BACKUP_NAME=backup-date -I.tartar -cf $BACKUP_NAME backup/s3cmd put $BACKUP_NAME s3://pg-backups/$BACKUP_NAME
===== PAGE: https://docs.tigerdata.com/mst/aiven-client/ =====
Aiven Client for Managed Service for TimescaleDB
You can use Aiven Client to manage your services in Managed Service for TimescaleDB.
You can use the Aiven Client tool to:
- Connect to Managed Service for TimescaleDB
- Create a service
- Create a fork
- Add authentication plugins to your attached Grafana service
Instructions:
- Install and configure the Aiven client
- Fork services with Aiven client
- Configure Grafana authentication plugins
- Send Grafana emails
- Create a read-only replica with the Aiven client
Install and configure the Aiven client
Aiven Client is a command line tool for fully managed services. To use Aiven Client, you first need to create an authentication token. Then, you configure the client to connect to your Managed Service for TimescaleDB using the command line.
Create an authentication token in Managed Service for TimescaleDB
To connect to Managed Service for TimescaleDB using Aiven Client, create an authentication token.
- In Managed Service for TimescaleDB, click
User Informationin the top right corner. - In the
User Profilepage, navigate to theAuthenticationtab. - Click
Generate Token. - In the
Generate access tokendialog, type a descriptive name for the token. Leave the rest of the fields blank. - Copy the generated authentication token and save it.
Install the Aiven Client
The Aiven Client is provided as a Python package. If you've already installed Python, you can install the client on Linux, MacOS, or Windows systems using pip:
pip install aiven-client
For more information about installing the Aiven Client, see the Aiven documentation.
Configure Aiven Client to connect to Managed Service for TimescaleDB
To access Managed Service for TimescaleDB with the Aiven Client, you need an authentication token. Aiven Client uses this to access your services on Managed Service for TimescaleDB.
Configuring Aiven Client to connect to Managed Service for TimescaleDB
Change to the install directory that contains the configuration files:
cd ~/.config/aiven/Open the
aiven-credentials.jsonusing any editor and update these lines with your Managed Service for TimescaleDBUser email, and theauthentication tokenthat you generated:{ "auth_token": "ABC1+123...TOKEN==", "user_email": "your.email@timescale.com" }Save the
aiven-credentials.jsonfile.To verify that you can access your services on Managed Service for TimescaleDB, type:
avn project listThis command shows a list of all your projects:
PROJECT_NAME DEFAULT_CLOUD CREDIT_CARD ============= ======================= =================== project-xxxx timescale-aws-us-east-1 xxxx-xxxx-xxxx-xxxx project-yyyy timescale-aws-us-east-1 xxxx-xxxx-xxxx-xxxx project-zzzz timescale-aws-us-east-1 xxxx-xxxx-xxxx-xxxx
Fork services with Aiven client
When you a fork a service, you create an exact copy of the service, including the underlying database. You can use a fork of your service to:
- Create a development copy of your production environment.
- Set up a snapshot to analyze an issue or test an upgrade.
- Create an instance in a different cloud, geographical location, or under a different plan.
For more information about projects, plans, and other details about services, see About Managed Service for TimescaleDB.
Creating a fork of your service
In the Aiven client, connect to your service.
Switch to the project that contains the service you want to fork:
avn project switch <PROJECT>List the services in the project, and make a note of the service that you want to fork, listed under
SERVICE_NAMEcolumn in the output.avn service listGet the details of the service that you want to fork:
avn service get <SERVICE_NAME>Create the fork:
avn service create <NAME_OF_FORK> --project <PROJECT_ID>\ -t <SERVICE_TYPE> --plan <PLAN> --cloud <CLOUD_NAME>\ -c service_to_fork_from=<NAME_OF_SERVICE_TO_FORK>
Example
To create a fork named grafana-fork for a service named grafana with these parameters:
- PROJECT_ID:
project-fork - CLOUD_NAME:
timescale-aws-us-east-1 PLAN_TYPE:
dashboard-1avn service create grafana-fork --project project-fork -t grafana --plan dashboard-1 --cloud timescale-aws-us-east-1 -c service_to_fork_from=grafana
You can switch to project-fork and view the newly created grafana-fork using:
avn service list
Configure Grafana authentication plugins
Grafana supports multiple authentication plugins, in addition to built-in username and password authentication.
On Managed Service for TimescaleDB, Grafana supports Google, GitHub, and GitLab authentication. You can configure authentication integration using the Aiven command-line client.
Integrating the Google authentication plugin
To integrate Google authentication with Grafana service on Managed Service for TimescaleDB, you need to create your Google OAuth keys. Copy your client ID and client secret to a secure location.
How to integrate the Google authentication plugin
In the Aiven Client, connect to your service.
Switch to the project that contains the Grafana service you want to integrate:
avn switch <PROJECT>List the services in the project. Make a note of the Grafana service that you want to integrate, listed under
SERVICE_NAMEcolumn in the output.avn service listGet the details of the service that you want to integrate:
avn service get <SERVICE_NAME>Integrate the plugin with your services using the
<CLIENT_ID>and<CLIENT_SECRET>from your Google developer console:avn service update -c auth_google.allowed_domains=<G-SUITE_DOMAIN>\ -c auth_google.client_id=<CLIENT_ID>\ -c auth_google.client_secret=<CLIENT_SECRET><SERVICE_NAME>Log in to Grafana with your service credentials.
Navigate to
Configuration→Pluginsand verify that the Google OAuth application is listed as a plugin.
When you allow sign-ups using the -c auth_google.allow_sign_up=true option, by default each new user is created with viewer permissions and added to their own newly created organizations. To specify different permissions, use -c user_auto_assign_org_role=ROLE_NAME. To add all new users to the main organization, use the -c user_auto_assign_org=true option.
Integrating the GitHub authentication plugin
To integrate GitHub authentication with Grafana service on Managed Service for TimescaleDB, you need to create your GitHub OAuth application. Store your client ID and client secret in a secure location.
How to integrate the GitHub authentication plugin
In the Aiven Client, connect to your service.
Switch to the project that contains the Grafana service you want to integrate:
avn switch <PROJECT>List the services in the project, and make a note of the Grafana service that you want to integrate, listed under
SERVICE_NAMEcolumn in the output.avn service listGet the details of the service that you want to integrate:
avn service get <SERVICE_NAME>Integrate the plugin with your service using the
<CLIENT_ID>, and<CLIENT_SECRET>from your GitHub OAuth application:avn service update -c auth_github.client_id=<CLIENT_ID>\ -c auth_github.client_secret=<CLIENT_SECRET> <SERVICE_NAME>Log in to Grafana with your service credentials.
Navigate to
Configuration→Plugins. The Plugins page lists GitHub OAuth application for the Grafana instance.
When you allow sign-ups using the -c auth_github.allow_sign_up=true option, by default each new user is created with viewerpermission and added to their own newly created organizations. To specify different permissions, use -c user_auto_assign_org_role=ROLE_NAME. To add all new users to the main organization, use the -c user_auto_assign_org=true option.
Integrating the GitLab authentication plugin
To integrate the GitLab authentication with Grafana service on Managed Service for TimescaleDB, you need to create your GitLab OAuth application. Copy your client ID, client secret, and GitLab groups name to a secure location.
If you use your own instance of GitLab instead of gitlab.com, then you need to set the following:
- auth_gitlab.api_url
- auth_github.auth_url
- auth_github.token_url
How to integrate the GitLab authentication plugin
In the Aiven Client, connect to your MST_SERVICE_LONG.
Switch to the project that contains the Grafana service you want to integrate:
avn project switch <PROJECT>List the services in the project. Note the Grafana service that you want to integrate, listed under
SERVICE_NAMEcolumn in the output.avn service listGet the details of the service that you want to integrate:
avn service get <SERVICE_NAME>Integrate the plugin with your service using the
<CLIENT_ID>,<CLIENT_SECRET>, and<GITLAB_GROUPS>from your GitLab OAuth application:avn service update -c auth_gitlab.client_id=<CLIENT_ID>\ -c auth_gitlab.client_secret=<CLIENT_SECRET>\ -c auth_gitlab.allowed_groups=<GITLAB_GROUPS> <SERVICE_NAME>Log in to Grafana with your service credentials.
Navigate to
Configuration→Plugins. The Plugins page lists GitLab OAuth application for the Grafana instance.
When you allow sign-ups using the -c auth_gitlab.allow_sign_up=true option, by default each new user is created with viewerpermission and added to their own newly created organizations. To specify different permissions, use -c user_auto_assign_org_role=ROLE_NAME. To add all new users to the main organization, use the -c user_auto_assign_org=true option.
Send Grafana emails
Use the Aiven client to configure the Simple Mail Transfer Protocol (SMTP) server settings and send emails from Managed Service for TimescaleDB for Grafana. This includes invite emails, reset password emails, and alert messages.
Prerequisites
Before you begin, make sure you have:
- (Optional): Made a note of these values in the SMTP server:
IP or hostname,SMTP server port,Username,Password,Sender email address, andSender name.
Configuring the SMTP server for Grafana service
In the Aiven client, connect to your service.
Switch to the project that contains the Grafana service you want to integrate:
avn project switch <PROJECT>List the services in the project. Note the Grafana service that you want to configure, listed under
SERVICE_NAMEcolumn in the output.avn service listGet the details of the service that you want to integrate:
avn service get <SERVICE_NAME>Configure the Grafana service using the SMTP values:
avn service update --project <PROJECT> <SERVICE_NAME>\ -c smtp_server.host=smtp.example.com \ -c smtp_server.port=465 \ -c smtp_server.username=emailsenderuser \ -c smtp_server.password=emailsenderpass \ -c smtp_server.from_address="grafana@yourcompany.com"[](#) Review all available custom options, and configure:
avn service types -v
You can now send emails for your Grafana service on MST.
Create a read-only replica with Aiven client
Read-only replicas enable you to perform read-only queries against the replica and reduce the load on the primary server. They are also a good way to optimize query response times across different geographical locations. You can achieve this by placing the replicas in different regions or even different cloud providers.
Creating a read-only replica of your service
In the Aiven client, connect to your service.
Switch to the project that contains the service you want to create a read-only replica for:
avn project switch <PROJECT>List the services in the project. Note the service for which you will create a read-only replica. You can find it listed under the
SERVICE_NAMEcolumn in the output:avn service listGet the details of the service that you want to fork:
avn service get <SERVICE_NAME>Create a read-only replica:
avn service create <NAME_OF_REPLICA> --project <PROJECT_ID>\ -t pg --plan <PLAN_TYPE> --cloud timescale-aws-us-east-1\ -c pg_read_replica=true\ -c service_to_fork_from=<NAME_OF_SERVICE_TO_FORK>\ -c pg_version=11 -c variant=timescale
Example
To create a fork named replica-fork for a service named timescaledb with
these parameters:
- PROJECT_ID:
fork-project - CLOUD_NAME:
timescale-aws-us-east-1 PLAN_TYPE:
timescale-basic-100-compute-optimizedavn service create replica-fork --project fork-project\ -t pg --plan timescale-basic-100-compute-optimized\ --cloud timescale-aws-us-east-1 -c pg_read_replica=true\ -c service_to_fork_from=timescaledb -c\ pg_version=11 -c variant=timescale
You can switch to project-fork and view the newly created replica-fork using:
avn service list
===== PAGE: https://docs.tigerdata.com/mst/migrate-to-mst/ =====
Migrate from self-hosted TimescaleDB to Managed Service for TimescaleDB
You can migrate your data from self-hosted TimescaleDB to Managed Service for TimescaleDB and automate most of the common operational tasks.
Each service has a database named defaultdb, and a default user account named tsdbadmin. You use
MST Console to create additional users and databases using the Users and Databases tabs.
You can switch between different plan sizes in Managed Service for TimescaleDB. However, during the migration process, choose a plan size that has the same storage size or slightly larger than the currently allocated plan. This allows you to limit the downtime during the migration process and have sufficient compute and storage resources.
Depending on your database size and network speed, migration can take a very long time. During this time, any new writes that happen during the migration process are not included. To prevent data loss, turn off all the writes to the source self-hosted TimescaleDB database before you start migration.
Before migrating for production, do a cold run without turning off writes to the source self-hosted TimescaleDB database. This gives you an estimate of the time the migration process takes, and helps you to practice migrating without causing downtime to your customers.
If you prefer the features of Tiger Cloud, you can easily migrate your data from an service to a Tiger Cloud service.
Prerequisites
Before you migrate your data, do the following:
- Set up the migration machine:
You run the migration commands on the migration machine. It must have enough disk space to hold the dump file.
Install the Postgres
pg_dumpandpg_restoreutilities on a migration machine.Install a client to connect to self-hosted TimescaleDB and Managed Service for TimescaleDB.
These instructions use
psql, but any client works.Create a target service:
For more information, see the Install Managed Service for TimescaleDB. Provision your target service with enough space for all your data.
On the source self-hosted TimescaleDB and the target service, ensure that you are running:
- The same major version of Postgres.
For information, see upgrade Postgres.
- The same major version of TimescaleDB
For more information, see Upgrade TimescaleDB to a major version.
Migrate your data to a service
To move your data from self-hosted TimescaleDB instance to a service, run the following commands from your migration machine:
- Take offline the applications that connect to the source self-hosted TimescaleDB instance
The duration of migration is proportional to the amount of data stored in your database. By disconnecting your app from your database, you avoid possible data loss.
- Set your connection strings
These variables hold the connection information for the source self-hosted TimescaleDB instance and the target service:
export SOURCE="postgres://<user>:<password>@<source host>:<source port>/<db_name>"
export TARGET="postgres://tsdbadmin:<password>@<host>:<port>/defaultdb?sslmode=require"
Dump the data from your source Tiger Cloud service
pg_dump -d "source" --no-owner -Fc -v -f dump.bakPut your target service in the right state for restoring
psql -d "target" -c "SELECT timescaledb_pre_restore();"Upload your data to the target service
pg_restore -d "target" --jobs 4 -Fc dump.bak
The --jobs option specifies the number of CPUs to use to dump and restore the database concurrently.
Return your target service to normal operations
psql -d "target" -c "SELECT timescaledb_post_restore();"Connect to your new database and update your table statistics by running
ANALYZEon your entire dataset:psql -d "target" defaultdb=> ANALYZE;
To migrate from multiple databases, you repeat this migration procedure one database after another.
Troubleshooting
If you see the following errors during migration, you can safely ignore them. The migration still runs successfully.
For
pg_dump:pg_dump: warning: there are circular foreign-key constraints on this table: pg_dump: hypertable pg_dump: You might not be able to restore the dump without using --disable-triggers or temporarily dropping the constraints. pg_dump: Consider using a full dump instead of a --data-only dump to avoid this problem. pg_dump: NOTICE: hypertable data are in the chunks, no data will be copied DETAIL: Data for hypertables are stored in the chunks of a hypertable so COPY TO of a hypertable will not copy any data. HINT: Use "COPY (SELECT * FROM <hypertable>) TO ..." to copy all data in hypertable, or copy each chunk individually.For
pg_restore:pg_restore: while PROCESSING TOC: pg_restore: from TOC entry 4142; 0 0 COMMENT EXTENSION timescaledb pg_restore: error: could not execute query: ERROR: must be owner of extension timescaledb Command was: COMMENT ON EXTENSION timescaledb IS 'Enables scalable inserts and complex queries for time-series data';
===== PAGE: https://docs.tigerdata.com/mst/restapi/ =====
Using REST API in Managed Service for TimescaleDB
Managed Service for TimescaleDB has an API for integration and automation tasks. For information about using the endpoints, see the API Documentation. MST offers an HTTP API with token authentication and JSON-formatted data. You can use the API for all the tasks that can be performed using the MST Console. To get started you need to first create an authentication token, and then use the token in the header to use the API endpoints.
- In Managed Service for TimescaleDB, click
User Informationin the top right corner. - In the
User Profilepage, navigate to theAuthenticationtab. - Click
Generate Token. - In the
Generate access tokendialog, type a descriptive name for the token and leave the rest of the fields blank. - Copy the generated authentication token and save it.
Using cURL to get your details
Set the environment variable
MST_API_TOKENwith the access token that you generate:export MST_API_TOKEN="access token"To get the details about the current user session using the
/meendpoint:curl -s -H "Authorization: aivenv1 $MST_API_TOKEN" https://api.aiven.io/v1/me|json_ppThe output looks similar to this:
{ "user": { "auth": [], "create_time": "string", "features": { }, "intercom": {}, "invitations": [], "project_membership": {}, "project_memberships": {}, "projects": [], "real_name": "string", "state": "string", "token_validity_begin": "string", "user": "string", "user_id": "string" } }
===== PAGE: https://docs.tigerdata.com/mst/identify-index-issues/ =====
Identify and resolve issues with indexes in Managed Service for TimescaleDB
Postgres indexes can be corrupted for a variety of reasons, including
software bugs, hardware failures, or unexpected duplicated data. REINDEX allows
you to rebuild the index in such situations.
Rebuild non-unique indexes
You can rebuild corrupted indexes that do not have UNIQUE in their definition.
You can run the REINDEX command for all indexes of a table (REINDEX TABLE),
and for all indexes in the entire database (REINDEX DATABASE).
For more information on the REINDEX command, see the Postgres documentation.
This command creates a new index that replaces the old one:
REINDEX INDEX <index-name>;
When you use REINDEX, the tables are locked and you may not be able to use the
database, until the operation is complete.
In some cases, you might need to manually build a second index concurrently with the old index, and then remove the old index:
CREATE INDEX CONCURRENTLY test_index_new ON table_a (...);
DROP INDEX CONCURRENTLY test_index_old;
ALTER INDEX test_index_new RENAME TO test_index;
Rebuild unique indexes
A UNIQUE index works on one or more columns where the combination is unique
in the table. When the index is corrupted or disabled, duplicated
physical rows appear in the table, breaking the uniqueness constraint of the
index. When you try to rebuild an index that is not unique, the REINDEX command fails.
To resolve this issue, first remove the duplicate rows from the table and then
rebuild the index.
Identify conflicting duplicated rows
To identify conflicting duplicate rows, you need to run a query that counts the number of rows for each combination of columns included in the index definition.
For example, this route table has a unique_route_index index defining
unique rows based on the combination of the source and destination columns:
CREATE TABLE route(
source TEXT,
destination TEXT,
description TEXT
);
CREATE UNIQUE INDEX unique_route_index
ON route (source, destination);
If the unique_route_index is corrupt, you can find duplicated rows in the
route table using this query:
SELECT
source,
destination,
count
FROM
(SELECT
source,
destination,
COUNT(*) AS count
FROM route
GROUP BY
source,
destination) AS foo
WHERE count > 1;
The query groups the data by the same source and destination fields defined
in the index, and filters any entries with more than one occurrence.
Resolve the problematic entries in the rows by manually deleting or merging the
entries until no duplicates exist. After all duplicate entries are removed, you
can use the REINDEX command to rebuild the index.
===== PAGE: https://docs.tigerdata.com/about/whitepaper/ =====
Tiger Data architecture for real-time analytics
Tiger Data has created a powerful application database for real-time analytics on time-series data. It integrates seamlessly with the Postgres ecosystem and enhances it with automatic time-based partitioning, hybrid row-columnar storage, and vectorized execution—enabling high-ingest performance, sub-second queries, and full SQL support at scale.
Tiger Cloud offers managed database services that provide a stable and reliable environment for your applications. Each service is based on a Postgres database instance and the TimescaleDB extension.
By making use of incrementally updated materialized views and advanced analytical functions, TimescaleDB reduces compute overhead and improves query efficiency. Developers can continue using familiar SQL workflows and tools, while benefiting from a database purpose-built for fast, scalable analytics.
This document outlines the architectural choices and optimizations that power TimescaleDB and Tiger Cloud’s performance and scalability while preserving Postgres’s reliability and transactional guarantees.
Want to read this whitepaper from the comfort of your own computer?
Tiger Data architecture for real-time analytics (PDF)
Introduction
What is real-time analytics?
Real-time analytics enables applications to process and query data as it is generated and as it accumulates, delivering immediate and ongoing insights for decision-making. Unlike traditional analytics, which relies on batch processing and delayed reporting, real-time analytics supports both instant queries on fresh data and fast exploration of historical trends—powering applications with sub-second query performance across vast, continuously growing datasets.
Many modern applications depend on real-time analytics to drive critical functionality:
- IoT monitoring systems track sensor data over time, identifying long-term performance patterns while still surfacing anomalies as they arise. This allows businesses to optimize maintenance schedules, reduce costs, and improve reliability.
- Financial and business intelligence platforms analyze both current and historical data to detect trends, assess risk, and uncover opportunities—from tracking stock performance over a day, week, or year to identifying spending patterns across millions of transactions.
- Interactive customer dashboards empower users to explore live and historical data in a seamless experience—whether it's a SaaS product providing real-time analytics on business operations, a media platform analyzing content engagement, or an e-commerce site surfacing personalized recommendations based on recent and past behavior.
Real-time analytics isn't just about reacting to the latest data, although that is critically important. It's also about delivering fast, interactive, and scalable insights across all your data, enabling better decision-making and richer user experiences. Unlike traditional ad-hoc analytics used by analysts, real-time analytics powers applications—driving dynamic dashboards, automated decisions, and user-facing insights at scale.
To achieve this, real-time analytics systems must meet several key requirements:
- Low-latency queries ensure sub-second response times even under high load, enabling fast insights for dashboards, monitoring, and alerting.
- Low-latency ingest minimizes the lag between when data is created and when it becomes available for analysis, ensuring fresh and accurate insights.
- Data mutability allows for efficient updates, corrections, and backfills, ensuring analytics reflect the most accurate state of the data.
- Concurrency and scalability enable systems to handle high query volumes and growing workloads without degradation in performance.
- Seamless access to both recent and historical data ensures fast queries across time, whether analyzing live, streaming data, or running deep historical queries on days or months of information.
- Query flexibility provides full SQL support, allowing for complex queries with joins, filters, aggregations, and analytical functions.
Tiger Cloud: real-time analytics from Postgres
Tiger Cloud is a high-performance database that brings real-time analytics to applications. It combines fast queries, high ingest performance, and full SQL support—all while ensuring scalability and reliability. Tiger Cloud extends Postgres with the TimescaleDB extension. It enables sub-second queries on vast amounts of incoming data while providing optimizations designed for continuously updating datasets.
Tiger Cloud achieves this through the following optimizations:
- Efficient data partitioning: automatically and transparently partitioning data into chunks, ensuring fast queries, minimal indexing overhead, and seamless scalability
- Row-columnar storage: providing the flexibility of a row store for transactions and the performance of a column store for analytics
- **Optimized query execution: **using techniques like chunk and batch exclusion, columnar storage, and vectorized execution to minimize latency
- Continuous aggregates: precomputing analytical results for fast insights without expensive reprocessing
- **Cloud-native operation: **compute/compute separation, elastic usage-based storage, horizontal scale out, data tiering to object storage
- **Operational simplicity: **offering high availability, connection pooling, and automated backups for reliable and scalable real-time applications
With Tiger Cloud, developers can build low-latency, high-concurrency applications that seamlessly handle streaming data, historical queries, and real-time analytics while leveraging the familiarity and power of Postgres.
Data model
Today's applications demand a database that can handle real-time analytics and transactional queries without sacrificing speed, flexibility, or SQL compatibility (including joins between tables). TimescaleDB achieves this with hypertables, which provide an automatic partitioning engine, and hypercore, a hybrid row-columnar storage engine designed to deliver high-performance queries and efficient compression (up to 95%) within Postgres.
Efficient data partitioning
TimescaleDB provides hypertables, a table abstraction that automatically partitions data into chunks in real time (using time stamps or incrementing IDs) to ensure fast queries and predictable performance as datasets grow. Unlike traditional relational databases that require manual partitioning, hypertables automate all aspects of partition management, keeping locking minimal even under high ingest load.
At ingest time, hypertables ensure that Postgres can deal with a constant stream of data without suffering from table bloat and index degradation by automatically partitioning data across time. Because each chunk is ordered by time and has its own indexes and storage, writes are usually isolated to small, recent chunks—keeping index sizes small, improving cache locality, and reducing the overhead of vacuum and background maintenance operations. This localized write pattern minimizes write amplification and ensures consistently high ingest performance, even as total data volume grows.
At query time, hypertables efficiently exclude irrelevant chunks from the execution plan when the partitioning column is used in a WHERE clause. This architecture ensures fast query execution, avoiding the gradual slowdowns that affect non-partitioned tables as they accumulate millions of rows. Chunk-local indexes keep indexing overhead minimal, ensuring index operations scans remain efficient regardless of dataset size.
Hypertables are the foundation for all of TimescaleDB’s real-time analytics capabilities. They enable seamless data ingestion, high-throughput writes, optimized query execution, and chunk-based lifecycle management—including automated data retention (drop a chunk) and data tiering (move a chunk to object storage).
Row-columnar storage
Traditional databases force a trade-off between fast inserts (row-based storage) and efficient analytics (columnar storage). Hypercore eliminates this trade-off, allowing real-time analytics without sacrificing transactional capabilities.
Hypercore dynamically stores data in the most efficient format for its lifecycle:
- Row-based storage for recent data: the most recent chunk (and possibly more) is always stored in the rowstore, ensuring fast inserts, updates, and low-latency single record queries. Additionally, row-based storage is used as a writethrough for inserts and updates to columnar storage.
- Columnar storage for analytical performance: chunks are automatically compressed into the columnstore, optimizing storage efficiency and accelerating analytical queries.
Unlike traditional columnar databases, hypercore allows data to be inserted or modified at any stage, making it a flexible solution for both high-ingest transactional workloads and real-time analytics—within a single database.
Columnar storage layout
TimescaleDB’s columnar storage layout optimizes analytical query performance by structuring data efficiently on disk, reducing scan times, and maximizing compression rates. Unlike traditional row-based storage, where data is stored sequentially by row, columnar storage organizes and compresses data by column, allowing queries to retrieve only the necessary fields in batches rather than scanning entire rows. But unlike many column store implementations, TimescaleDB’s columnstore supports full mutability—inserts, upserts, updates, and deletes, even at the individual record level—with transactional guarantees. Data is also immediately visible to queries as soon as it is written.
Columnar batches
TimescaleDB uses columnar collocation and columnar compression within row-based storage to optimize analytical query performance while maintaining full Postgres compatibility. This approach ensures efficient storage, high compression ratios, and rapid query execution.
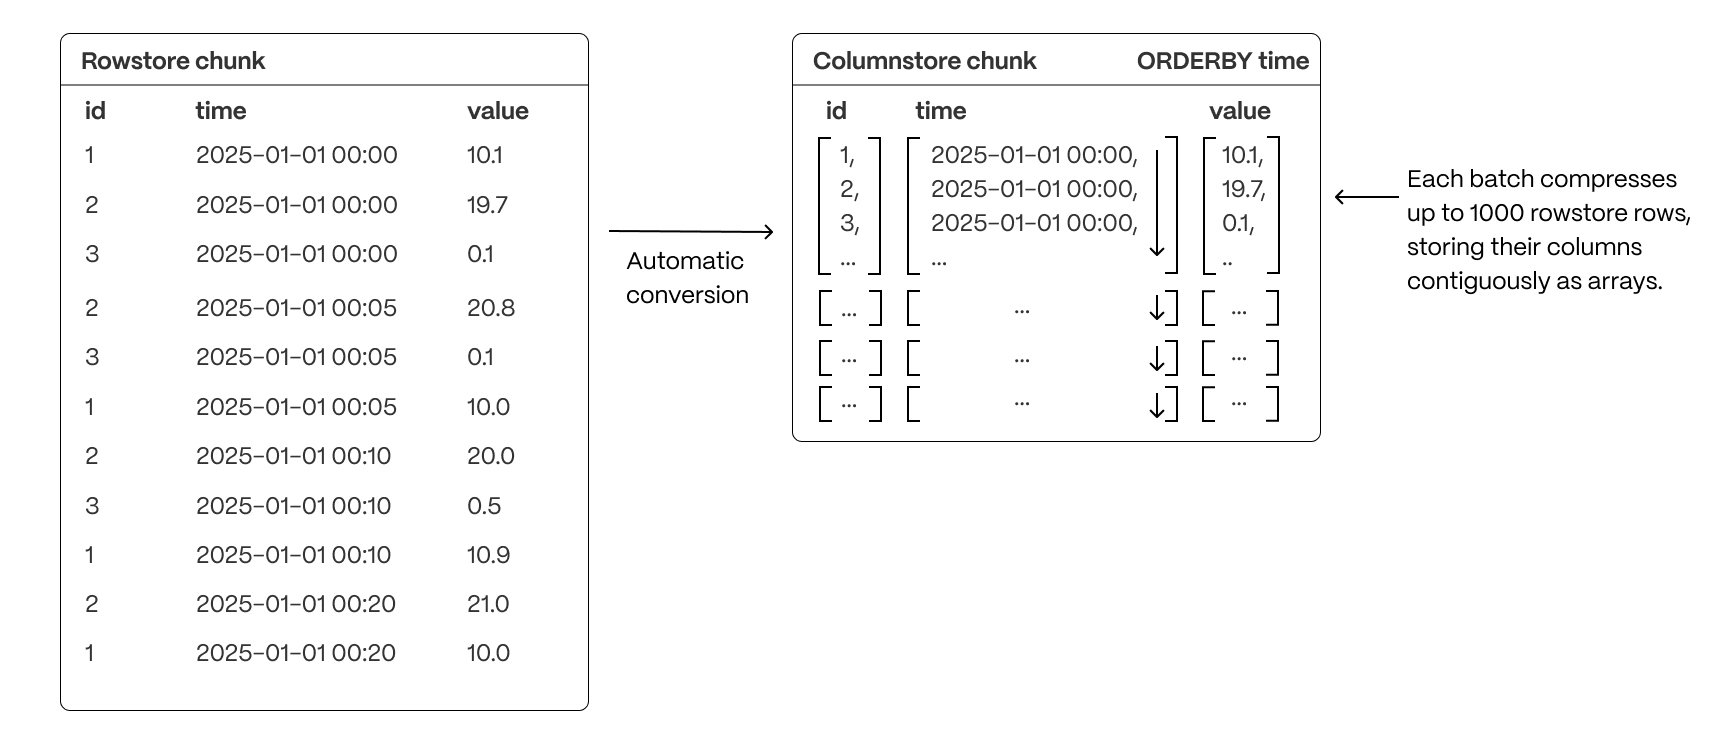
A rowstore chunk is converted to a columnstore chunk by successfully grouping together sets of rows (typically up to 1000) into a single batch, then converting the batch into columnar form.
Each compressed batch does the following:
- Encapsulates columnar data in compressed arrays of up to 1,000 values per column, stored as a single entry in the underlying compressed table
- Uses a column-major format within the batch, enabling efficient scans by co-locating values of the same column and allowing the selection of individual columns without reading the entire batch
- Applies advanced compression techniques at the column level, including run-length encoding, delta encoding, and Gorilla compression, to significantly reduce storage footprint (by up to 95%) and improve I/O performance.
While the chunk interval of rowstore and columnstore batches usually remains the same, TimescaleDB can also combine columnstore batches so they use a different chunk interval.
This architecture provides the benefits of columnar storage—optimized scans, reduced disk I/O, and improved analytical performance—while seamlessly integrating with Postgres’s row-based execution model.
Segmenting and ordering data
To optimize query performance, TimescaleDB allows explicit control over how data is physically organized within columnar storage. By structuring data effectively, queries can minimize disk reads and execute more efficiently, using vectorized execution for parallel batch processing where possible.
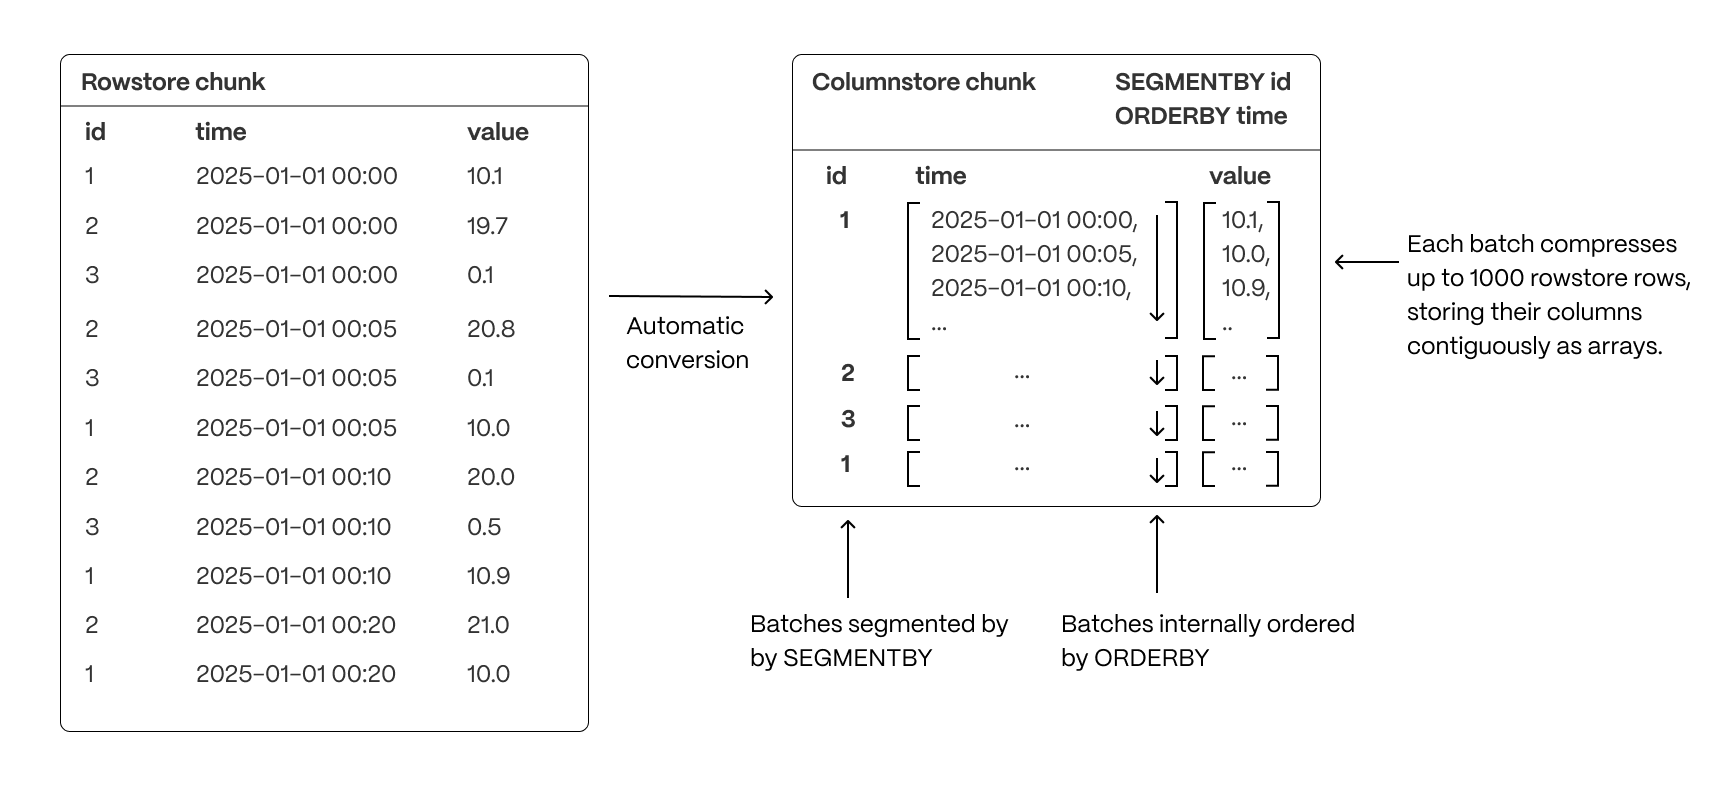
- Group related data together to improve scan efficiency: organizing rows into logical segments ensures that queries filtering by a specific value only scan relevant data sections. For example, in the above, querying for a specific ID is particularly fast. (Implemented with
SEGMENTBY.) - Sort data within segments to accelerate range queries: defining a consistent order reduces the need for post-query sorting, making time-based queries and range scans more efficient. (Implemented with
ORDERBY.) - Reduce disk reads and maximize vectorized execution: a well-structured storage layout enables efficient batch processing (Single Instruction, Multiple Data, or SIMD vectorization) and parallel execution, optimizing query performance.
By combining segmentation and ordering, TimescaleDB ensures that columnar queries are not only fast but also resource-efficient, enabling high-performance real-time analytics.
Data mutability
Traditional databases force a trade-off between fast updates and efficient analytics. Fully immutable storage is impractical in real-world applications, where data needs to change. Asynchronous mutability—where updates only become visible after batch processing—introduces delays that break real-time workflows. In-place mutability, while theoretically ideal, is prohibitively slow in columnar storage, requiring costly decompression, segmentation, ordering, and recompression cycles.
Hypercore navigates these trade-offs with a hybrid approach that enables immediate updates without modifying compressed columnstore data in place. By staging changes in an interim rowstore chunk, hypercore allows updates and deletes to happen efficiently while preserving the analytical performance of columnar storage.
Real-time writes without delays
All new data which is destined for a columnstore chunk is first written to an interim rowstore chunk, ensuring high-speed ingestion and immediate queryability. Unlike fully columnar systems that require ingestion to go through compression pipelines, hypercore allows fresh data to remain in a fast row-based structure before being later compressed into columnar format in ordered batches as normal.
Queries transparently access both the rowstore and columnstore chunks, meaning applications always see the latest data instantly, regardless of its storage format.
Efficient updates and deletes without performance penalties
When modifying or deleting existing data, hypercore avoids the inefficiencies of both asynchronous updates and in-place modifications. Instead of modifying compressed storage directly, affected batches are decompressed and staged in the interim rowstore chunk, where changes are applied immediately.
These modified batches remain in row storage until they are recompressed and reintegrated into the columnstore (which happens automatically via a background process). This approach ensures updates are immediately visible, but without the expensive overhead of decompressing and rewriting entire chunks. This approach avoids:
- The rigidity of immutable storage, which requires workarounds like versioning or copy-on-write strategies
- The delays of asynchronous updates, where modified data is only visible after batch processing
- The performance hit of in-place mutability, which makes compressed storage prohibitively slow for frequent updates
- The restrictions some databases have on not altering the segmentation or ordering keys
Query optimizations
Real-time analytics isn’t just about raw speed—it’s about executing queries efficiently, reducing unnecessary work, and maximizing performance. TimescaleDB optimizes every step of the query lifecycle to ensure that queries scan only what’s necessary, make use of data locality, and execute in parallel for sub-second response times over large datasets.
Skip unnecessary data
TimescaleDB minimizes the amount of data a query touches, reducing I/O and improving execution speed:
Primary partition exclusion (row and columnar)
Queries automatically skip irrelevant partitions (chunks) based on the primary partitioning key (usually a timestamp), ensuring they only scan relevant data.
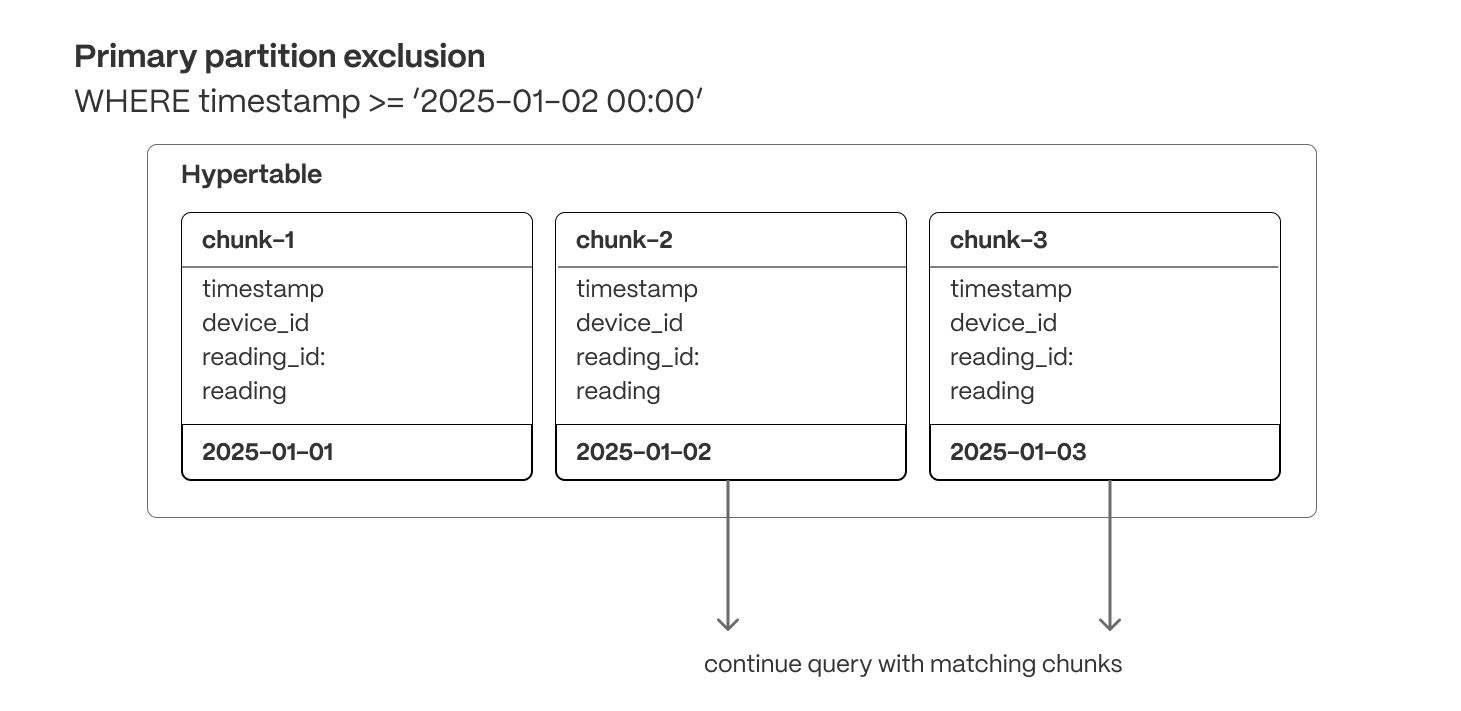
Secondary partition exclusion (columnar)
Min/max metadata allows queries filtering on correlated dimensions (e.g., order_id or secondary timestamps) to exclude chunks that don’t contain relevant data.
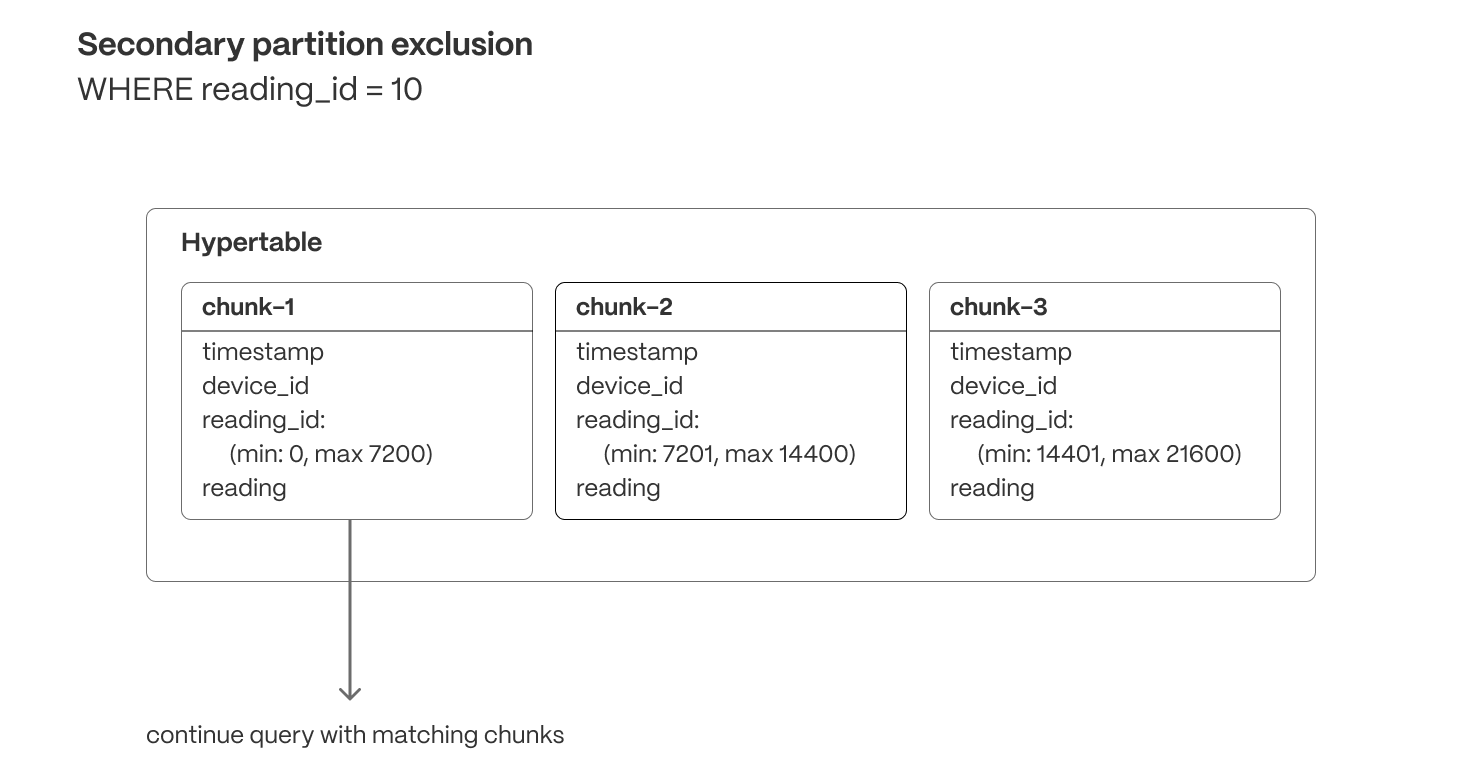
Postgres indexes (row and columnar)
Unlike many databases, TimescaleDB supports sparse indexes on columnstore data, allowing queries to efficiently locate specific values within both row-based and compressed columnar storage. These indexes enable fast lookups, range queries, and filtering operations that further reduce unnecessary data scans.
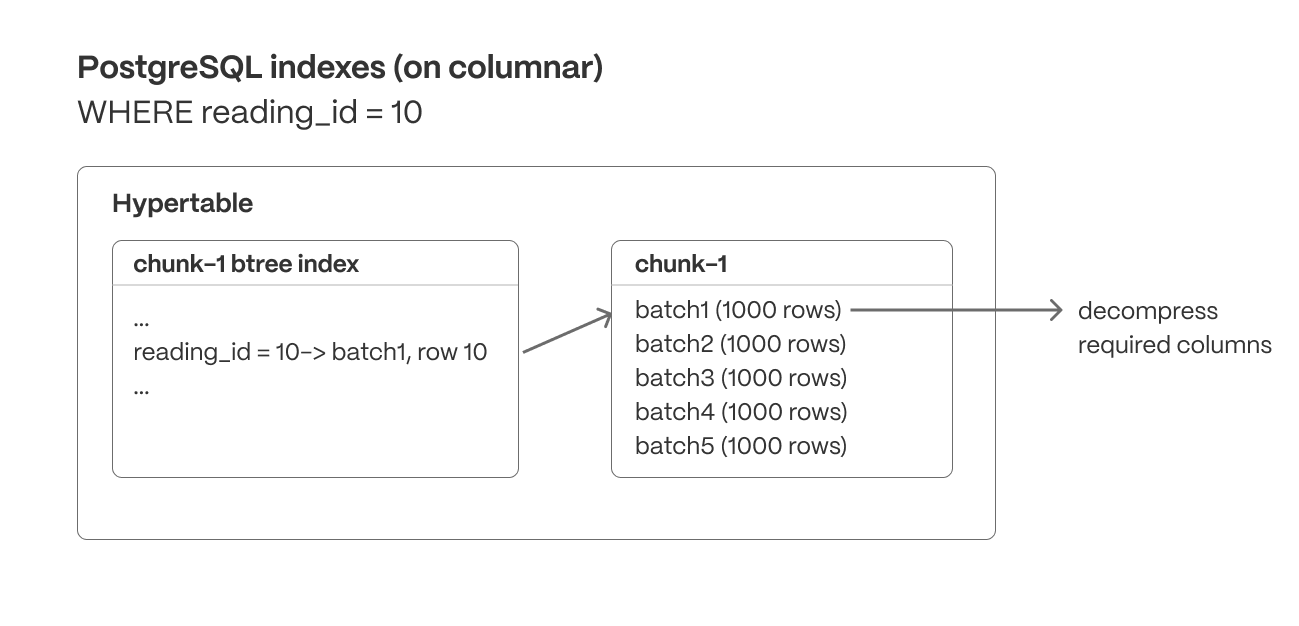
Batch-level filtering (columnar)
Within each chunk, compressed columnar batches are organized using SEGMENTBY keys and ordered by ORDERBY columns. Indexes and min/max metadata can be used to quickly exclude batches that don’t match the query criteria.
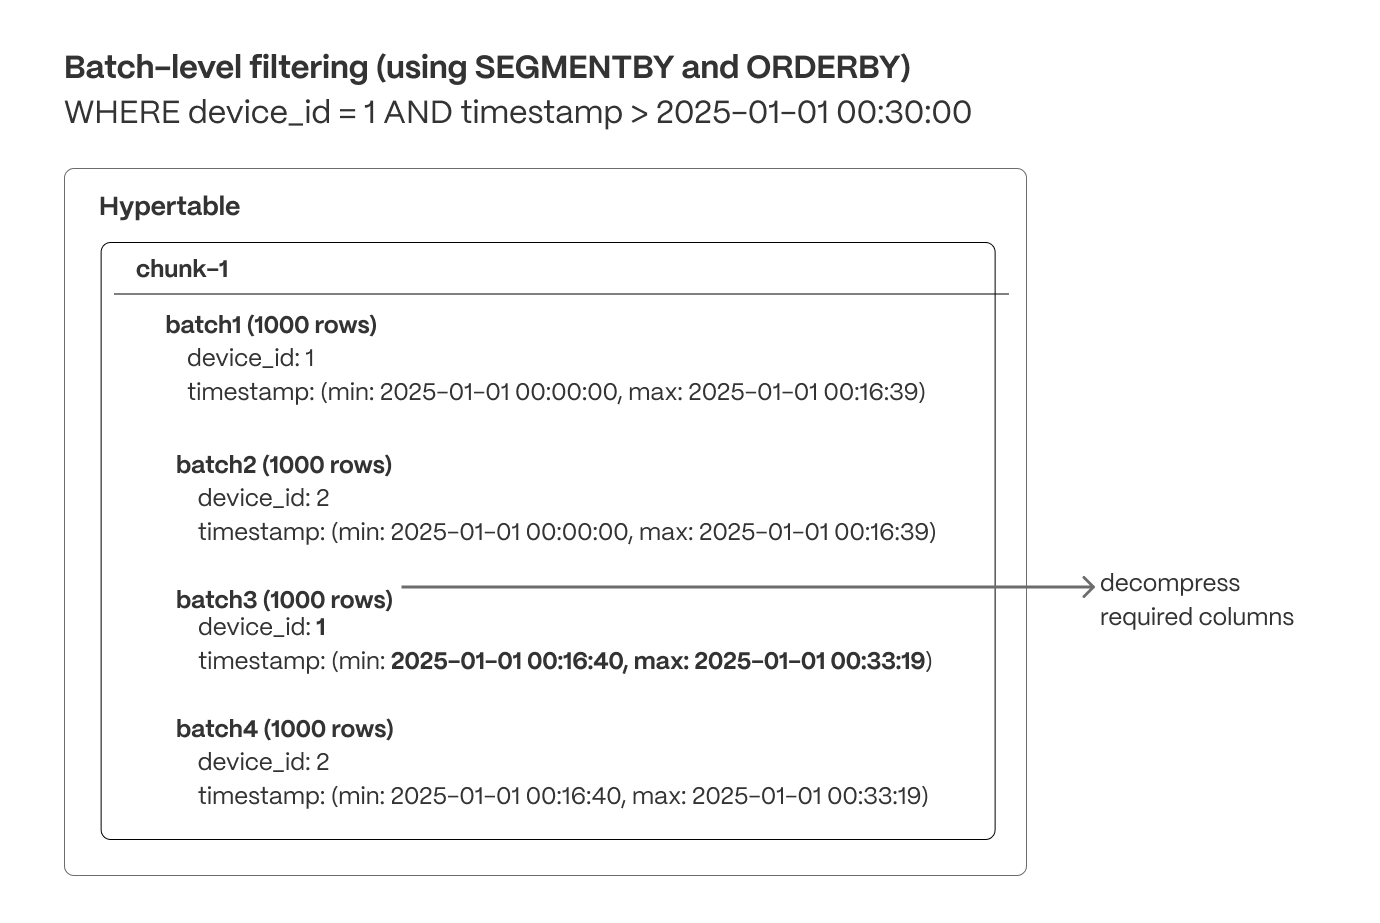
Maximize locality
Organizing data for efficient access ensures queries are read in the most optimal order, reducing unnecessary random reads and reducing scans of unneeded data.
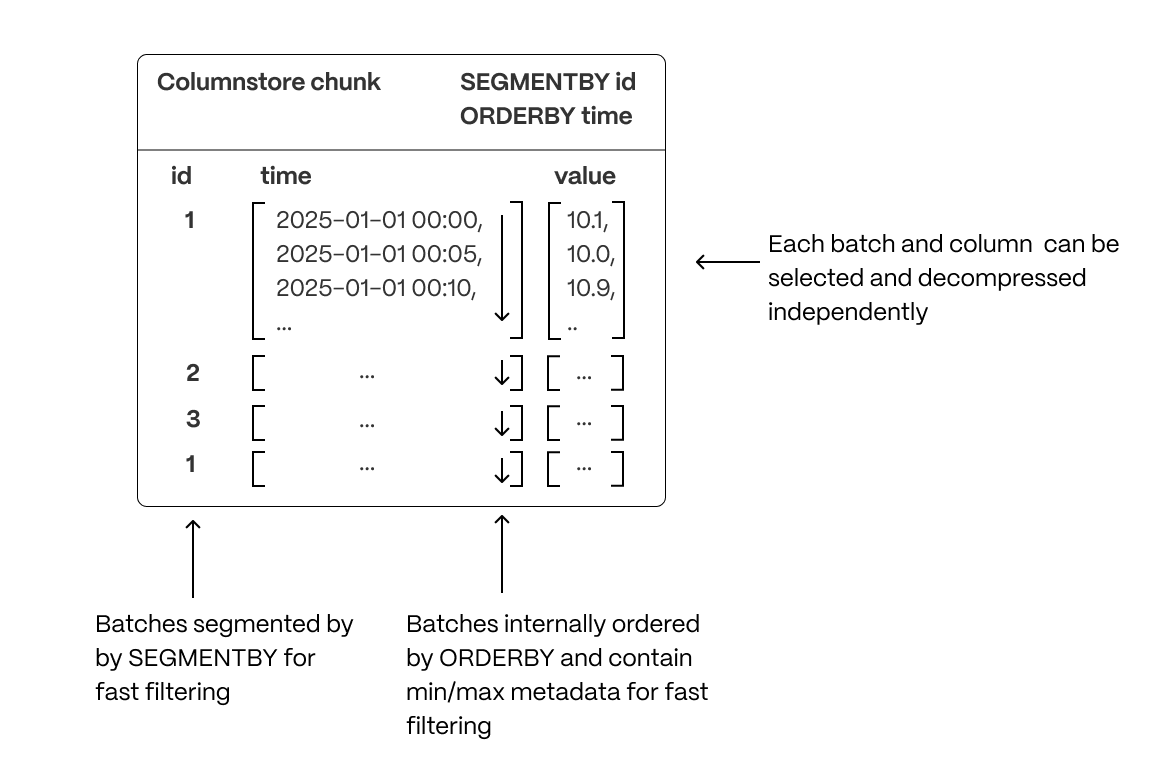
- Segmentation: Columnar batches are grouped using
SEGMENTBYto keep related data together, improving scan efficiency. - Ordering: Data within each batch is physically sorted using
ORDERBY, increasing scan efficiency (and reducing I/O operations), enabling efficient range queries, and minimizing post-query sorting. - Column selection: Queries read only the necessary columns, reducing disk I/O, decompression overhead, and memory usage.
Parallelize execution
Once a query is scanning only the required columnar data in the optimal order, TimescaleDB is able to maximize performance through parallel execution. As well as using multiple workers, TimescaleDB accelerates columnstore query execution by using Single Instruction, Multiple Data (SIMD) vectorization, allowing modern CPUs to process multiple data points in parallel.
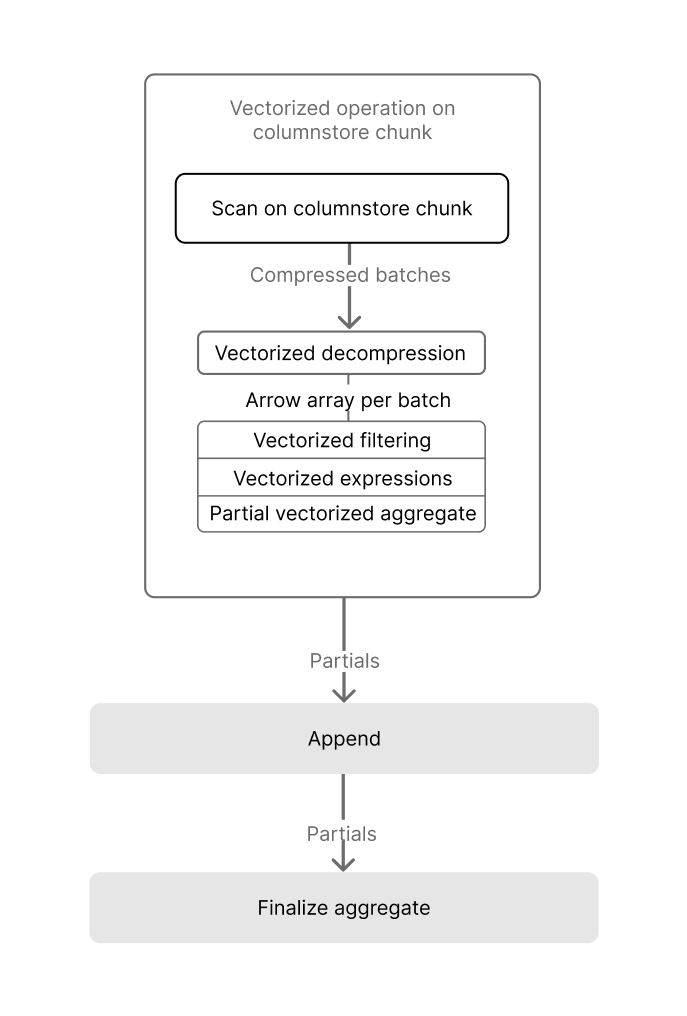
The TimescaleDB implementation of SIMD vectorization currently allows:
- Vectorized decompression, which efficiently restores compressed data into a usable form for analysis.
- Vectorized filtering, which rapidly applies filter conditions across data sets.
- Vectorized aggregation, which performs aggregate calculations, such as sum or average, across multiple data points concurrently.
Accelerating queries with continuous aggregates
Aggregating large datasets in real time can be expensive, requiring repeated scans and calculations that strain CPU and I/O. While some databases attempt to brute-force these queries at runtime, compute and I/O are always finite resources—leading to high latency, unpredictable performance, and growing infrastructure costs as data volume increases.
Continuous aggregates, the TimescaleDB implementation of incrementally updated materialized views, solve this by shifting computation from every query run to a single, asynchronous step after data is ingested. Only the time buckets that receive new or modified data are updated, and queries read precomputed results instead of scanning raw data—dramatically improving performance and efficiency.
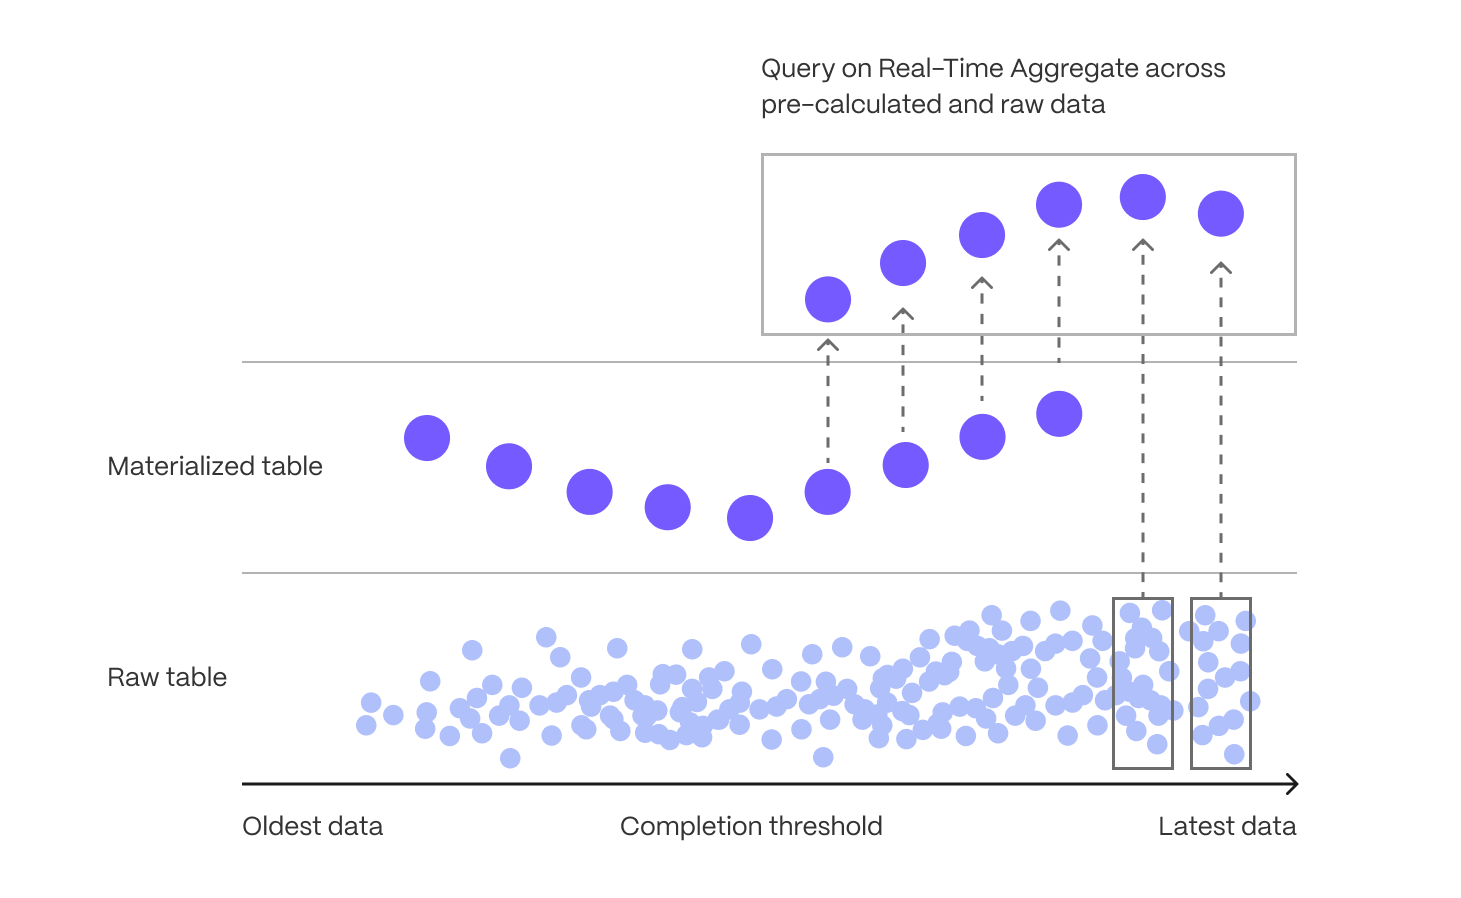
When you know the types of queries you'll need ahead of time, continuous aggregates allow you to pre-aggregate data along meaningful time intervals—such as per-minute, hourly, or daily summaries—delivering instant results without on-the-fly computation.
Continuous aggregates also avoid the time-consuming and error-prone process of maintaining manual rollups, while continuing to offer data mutability to support efficient updates, corrections, and backfills. Whenever new data is inserted or modified in chunks which have been materialized, TimescaleDB stores invalidation records reflecting that these results are stale and need to be recomputed. Then, an asynchronous process re-computes regions that include invalidated data, and updates the materialized results. TimescaleDB tracks the lineage and dependencies between continuous aggregates and their underlying data, to ensure the continuous aggregates are regularly kept up-to-date. This happens in a resource-efficient manner, and where multiple invalidations can be coalesced into a single refresh (as opposed to refreshing any dependencies at write time, such as via a trigger-based approach).
Continuous aggregates themselves are stored in hypertables, and they can be converted to columnar storage for compression, and raw data can be dropped, reducing storage footprint and processing cost. Continuous aggregates also support hierarchical rollups (e.g., hourly to daily to monthly) and real-time mode, which merges precomputed results with the latest ingested data to ensure accurate, up-to-date analytics.
This architecture enables scalable, low-latency analytics while keeping resource usage predictable—ideal for dashboards, monitoring systems, and any workload with known query patterns.
Hyperfunctions for real-time analytics
Real-time analytics requires more than basic SQL functions—efficient computation is essential as datasets grow in size and complexity. Hyperfunctions, available through the timescaledb_toolkit extension, provide high-performance, SQL-native functions tailored for time-series analysis. These include advanced tools for gap-filling, percentile estimation, time-weighted averages, counter correction, and state tracking, among others.
A key innovation of hyperfunctions is their support for partial aggregation, which allows TimescaleDB to store intermediate computational states rather than just final results. These partials can later be merged to compute rollups efficiently, avoiding expensive reprocessing of raw data and reducing compute overhead. This is especially effective when combined with continuous aggregates.
Consider a real-world example: monitoring request latencies across thousands of application instances. You might want to compute p95 latency per minute, then roll that up into hourly and daily percentiles for dashboards or alerts. With traditional SQL, calculating percentiles requires a full scan and sort of all underlying data—making multi-level rollups computationally expensive.
With TimescaleDB, you can use the percentile_agg hyperfunction in a continuous aggregate to compute and store a partial aggregation state for each minute. This state efficiently summarizes the distribution of latencies for that time bucket, without storing or sorting all individual values. Later, to produce an hourly or daily percentile, you simply combine the stored partials—no need to reprocess the raw latency values.
This approach provides a scalable, efficient solution for percentile-based analytics. By combining hyperfunctions with continuous aggregates, TimescaleDB enables real-time systems to deliver fast, resource-efficient insights across high-ingest, high-resolution datasets—without sacrificing accuracy or flexibility.
Cloud-native architecture
Real-time analytics requires a scalable, high-performance, and cost-efficient database that can handle high-ingest rates and low-latency queries without overprovisioning. Tiger Cloud is designed for elasticity, enabling independent scaling of storage and compute, workload isolation, and intelligent data tiering.
Independent storage and compute scaling
Real-time applications generate continuous data streams while requiring instant querying of both fresh and historical data. Traditional databases force users to pre-provision fixed storage, leading to unnecessary costs or unexpected limits. Tiger Cloud eliminates this constraint by dynamically scaling storage based on actual usage:
- Storage expands and contracts automatically as data is added or deleted, avoiding manual intervention.
- Usage-based billing ensures costs align with actual storage consumption, eliminating large upfront allocations.
- Compute can be scaled independently to optimize query execution, ensuring fast analytics across both recent and historical data.
With this architecture, databases grow alongside data streams, enabling seamless access to real-time and historical insights while efficiently managing storage costs.
Workload isolation for real-time performance
Balancing high-ingest rates and low-latency analytical queries on the same system can create contention, slowing down performance. Tiger Cloud mitigates this by allowing read and write workloads to scale independently:
- The primary database efficiently handles both ingestion and real-time rollups without disruption.
- Read replicas scale query performance separately, ensuring fast analytics even under heavy workloads.
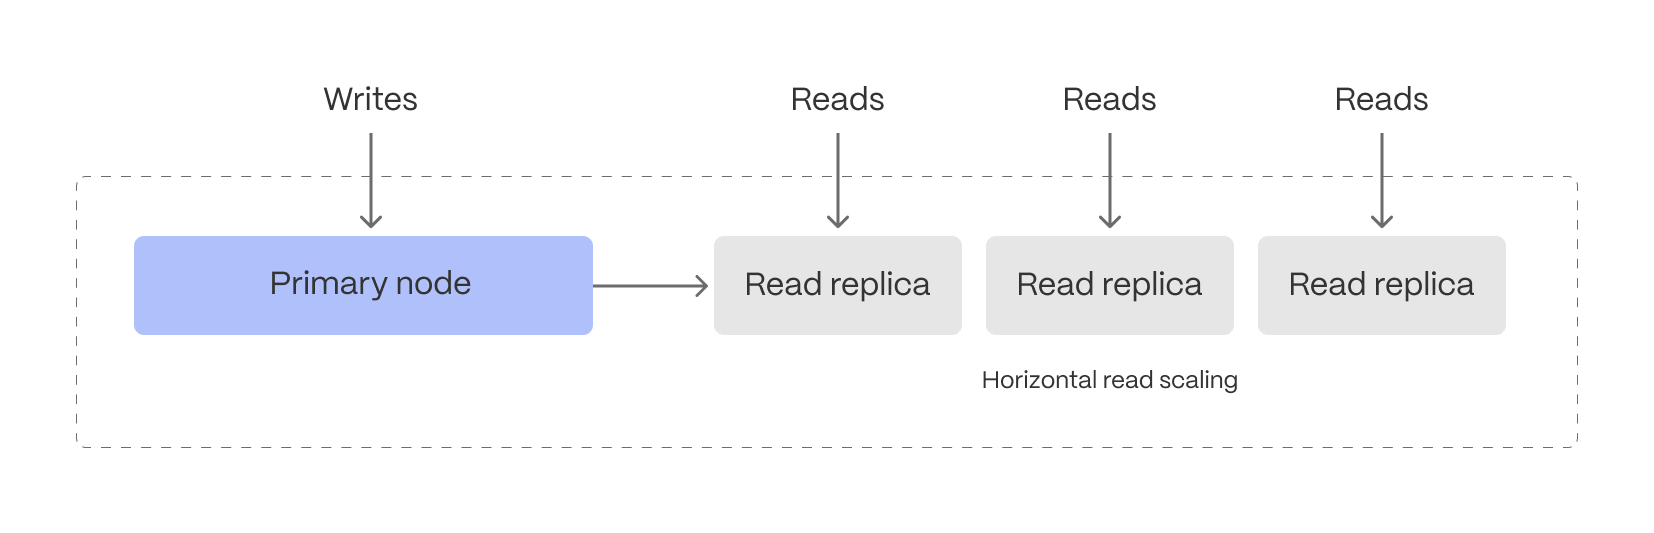
This separation ensures that frequent queries on fresh data don’t interfere with ingestion, making it easier to support live monitoring, anomaly detection, interactive dashboards, and alerting systems.
Intelligent data tiering for cost-efficient real-time analytics
Not all real-time data is equally valuable—recent data is queried constantly, while older data is accessed less frequently. Tiger Cloud can be configured to automatically tier data to cheaper bottomless object storage, ensuring that hot data remains instantly accessible, while historical data is still available.
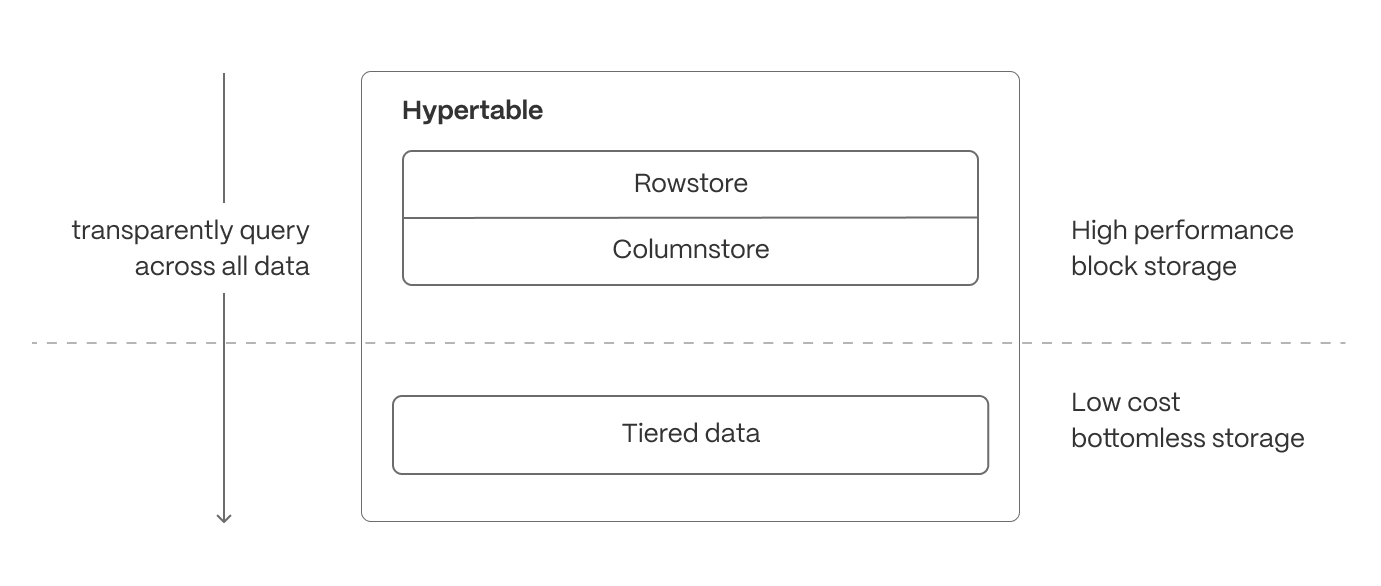
- Recent, high-velocity data stays in high-performance storage for ultra-fast queries.
- Older, less frequently accessed data is automatically moved to cost-efficient object storage but remains queryable and available for building continuous aggregates.
While many systems support this concept of data cooling, TimescaleDB ensures that the data can still be queried from the same hypertable regardless of its current location. For real-time analytics, this means applications can analyze live data streams without worrying about storage constraints, while still maintaining access to long-term trends when needed.
Cloud-native database observability
Real-time analytics doesn’t just require fast queries—it requires the ability to understand why queries are fast or slow, where resources are being used, and how performance changes over time. That’s why Tiger Cloud is built with deep observability features, giving developers and operators full visibility into their database workloads.
At the core of this observability is Insights, Tiger Cloud’s built-in query monitoring tool. Insights captures per-query statistics from our whole fleet in real time, showing you exactly how your database is behaving under load. It tracks key metrics like execution time, planning time, number of rows read and returned, I/O usage, and buffer cache hit rates—not just for the database as a whole, but for each individual query.
Insights lets you do the following:
- Identify slow or resource-intensive queries instantly
- Spot long-term performance regressions or trends
- Understand query patterns and how they evolve over time
- See the impact of schema changes, indexes, or continuous aggregates on workload performance
- Monitor and compare different versions of the same query to optimize execution
All this is surfaced through an intuitive interface, available directly in Tiger Cloud, with no instrumentation or external monitoring infrastructure required.
Beyond query-level visibility, Tiger Cloud also exposes metrics around service resource consumption, compression, continuous aggregates, and data tiering, allowing you to track how data moves through the system—and how those background processes impact storage and query performance.
Together, these observability features give you the insight and control needed to operate a real-time analytics database at scale, with confidence, clarity, and performance you can trust.
Ensuring reliability and scalability
Maintaining high availability, efficient resource utilization, and data durability is essential for real-time applications. Tiger Cloud provides robust operational features to ensure seamless performance under varying workloads.
- High-availability (HA) replicas: deploy multi-AZ HA replicas to provide fault tolerance and ensure minimal downtime. In the event of a primary node failure, replicas are automatically promoted to maintain service continuity.
- Connection pooling: optimize database connections by efficiently managing and reusing them, reducing overhead and improving performance for high-concurrency applications.
- Backup and recovery: leverage continuous backups, Point-in-Time Recovery (PITR), and automated snapshotting to protect against data loss. Restore data efficiently to minimize downtime in case of failures or accidental deletions.
These operational capabilities ensure Tiger Cloud remains reliable, scalable, and resilient, even under demanding real-time workloads.
Conclusion
Real-time analytics is critical for modern applications, but traditional databases struggle to balance high-ingest performance, low-latency queries, and flexible data mutability. Tiger Cloud extends Postgres to solve this challenge, combining automatic partitioning, hybrid row-columnar storage, and intelligent compression to optimize both transactional and analytical workloads.
With continuous aggregates, hyperfunctions, and advanced query optimizations, Tiger Cloud ensures sub-second queries even on massive datasets that combine current and historic data. Its cloud-native architecture further enhances scalability with independent compute and storage scaling, workload isolation, and cost-efficient data tiering—allowing applications to handle real-time and historical queries seamlessly.
For developers, this means building high-performance, real-time analytics applications without sacrificing SQL compatibility, transactional guarantees, or operational simplicity.
Tiger Cloud delivers the best of Postgres, optimized for real-time analytics.
===== PAGE: https://docs.tigerdata.com/about/pricing-and-account-management/ =====
Billing and account management
As we enhance our offerings and align them with your evolving needs, pricing plans provide more value, flexibility, and efficiency for your business. Whether you're a growing startup or a well-established enterprise, our plans are structured to support your journey towards greater success.
This page explains pricing plans for Tiger Cloud, and how to easily manage your Tiger Data account.
Pricing plans give you:
- Enhanced performance: with increased CPU and storage capacities, your apps run smoother and more efficiently, even under heavy loads.
- Improved scalability: as your business grows, so do your demands. Pricing plans scale with you, they provide the resources and support you need at each stage of your growth. Scale up or down based on your current needs, ensuring that you only pay for what you use.
- Better support: access to enhanced support options, including production support and dedicated account management, ensures you have the help you need when you need it.
- Greater flexibility: we know that one size doesn't fit all. Pricing plans give you the flexibility to choose the features and support levels that best match your business and engineering requirements. The ability to add features like I/O boost and customize your pricing plan means you can tailor Tiger Cloud services to fit your specific needs.
- Cost efficiency: by aligning our pricing with the value delivered, we ensure that you get the most out of every dollar spent. Our goal is to help you achieve more with less.
It’s that simple! You don't pay for automated backups or networking costs, such as data ingest or egress. There are no per-query fees, nor additional costs to read or write data. It's all completely transparent, easily understood, and up to you.
Using self-hosted TimescaleDB and our open-source products is still free.
If you create a Tiger Data account from AWS Marketplace, the pricing options are pay-as-you-go and annual commit. See AWS pricing for details.
Disaggregated, consumption-based compute and storage
With Tiger Cloud, you are not limited to pre-set compute and storage. Get as much as you need when provisioning your services or later, as your needs grow.
Compute: pay only for the compute resources you run. Compute is metered on an hourly basis, and you can scale it up to 64,000 IOPS at any time. You can also scale out using replicas as your application grows. We also provide services to help you lower your compute needs while improving query performance. Tiger Cloud is very efficient and generally needs less compute than other databases to deliver the same performance. The best way to size your needs is to sign up for a free trial and test with a realistic workload.
Storage: pay only for the storage you consume. You have high-performance storage for more-accessed data, and low-cost bottomless storage in S3 for other data. The high-performance storage offers you up to 64 TB of compressed (typically 80-100 TB uncompressed) data and is metered on your average GB consumption per hour. We can help you compress your data by up to 98% so you pay even less. For low-cost storage, Tiger Data charges only for the size of your data in S3 in the Apache Parquet format, regardless of whether it was compressed in Tiger Cloud before tiering. There are no additional expenses, such as data transfer or compute. For easy upgrades, each service stores the TimescaleDB binaries. This contributes up to 900 MB to overall storage, which amounts to less than $.80/month in additional storage costs.
Use Tiger Cloud for free
Are you just starting out with Tiger Cloud? On our Free pricing plan, you can create up to 2 zero-cost services with limited resources. When a free service reaches the resource limit, it converts to a read-only state.
The Free pricing plan and services are currently in beta.
Ready to try a more feature-rich paid plan? Activate a 30-day free trial of our Performance (no credit card required) or Scale plan. After your trial ends, we may remove your data unless you’ve added a payment method.
After you have completed your 30-day trial period, choose the pricing plan that suits your business and engineering needs. And even when you upgrade from the Free pricing plan, you can still have up to 2 zero-cost services—or convert the ones you already have into standard ones, to have more resources.
If you want to try out features in a higher pricing plan before upgrading, contact us.
Upgrade or downgrade your pricing plans at any time
You can upgrade or downgrade between the Free, Performance, and Scale plans whenever you want using Tiger Cloud Console. To downgrade to the Free plan, you must only have free services running in your project.
If you switch your pricing plan mid-month, your prices are prorated to when you switch. Your services are not interrupted when you switch, so you can keep working without any hassle. To move to Enterprise, get in touch with Tiger Data.
Monitor usage and costs
You keep track of your monthly usage in Tiger Cloud Console. Console shows your resource usage and dashboards with performance insights. This allows you to closely monitor your services’ performance, and any need to scale your services or upgrade your pricing plan.
Console also shows your month-to-date accrued charges, as well as a forecast of your expected month-end bill. Your previous invoices are also available as PDFs for download.
You are charged for all active services in your account, even if you are not actively using them. To reduce costs, pause or delete your unused services.
Tiger Data support
Tiger Data runs a global support organization with Customer Satisfaction (CSAT) scores above 99%. Support covers all timezones, and is fully staffed at weekend hours.
All paid pricing plans have free Developer Support through email with a target response time of 1 business day; we are often faster. If you need 24x7 responsiveness, talk to us about Production Support.
Charging for HA and read replicas
HA and read replicas are both charged at the same rate as your primary services, based on the compute and primary storage consumed by your replicas. Data tiered to our bottomless storage tier is shared by all database replicas; replicas accessing tiered storage do not add to your bill.
Charging over regions
Storage is priced the same across all regions. However, compute prices vary depending on the region. This is because our cloud provider (AWS) prices infrastructure differently based on region.
Features included in each pricing plan
The available pricing plans are:
- Free: for small non-production projects.
- Performance: for cost-focused, smaller projects. No credit card required to start.
- Scale: for developers handling critical and demanding apps.
- Enterprise: for enterprises with mission-critical apps.
The Free pricing plan and services are currently in beta.
The features included in each pricing plan are:
| Feature | Free | Performance | Scale | Enterprise |
|---|---|---|---|---|
| Compute and storage | ||||
| Number of services | Up to 2 free services | Up to 2 free and 4 standard services | Up to 2 free and and unlimited standard services | Up to 2 free and and unlimited standard services |
| CPU limit per service | Shared | Up to 8 CPU | Up to 32 CPU | Up to 64 CPU |
| Memory limit per service | Shared | Up to 32 GB | Up to 128 GB | Up to 256 GB |
| Storage limit per service | 750 MB | Up to 16 TB | Up to 16 TB | Up to 64 TB |
| Bottomless storage on S3 | Unlimited | Unlimited | ||
| Independently scale compute and storage | Standard services only | Standard services only | Standard services only | |
| Data services and workloads | ||||
| Relational | ✓ | ✓ | ✓ | ✓ |
| Time-series | ✓ | ✓ | ✓ | ✓ |
| Vector search | ✓ | ✓ | ✓ | ✓ |
| AI workflows (coming soon) | ✓ | ✓ | ✓ | ✓ |
| Cloud SQL editor | 3 seats | 3 seats | 10 seats | 20 seats |
| Charts | ✓ | ✓ | ✓ | ✓ |
| Dashboards | 2 | Unlimited | Unlimited | |
| Storage and performance | ||||
| IOPS | Shared | 3,000 - 5,000 | 5,000 - 8,000 | 5,000 - 8,000 |
| Bandwidth (autoscales) | Shared | 125 - 250 Mbps | 250 - 500 Mbps | Up to 500 mbps |
| I/O boost | Add-on: Up to 16K IOPS, 1000 Mbps BW |
Add-on: Up to 32K IOPS, 4000 Mbps BW |
||
| Availability and monitoring | ||||
| High-availability replicas (Automated multi-AZ failover) |
✓ | ✓ | ✓ | |
| Read replicas | ✓ | ✓ | ||
| Cross-region backup | ✓ | |||
| Backup reports | 14 days | 14 days | ||
| Point-in-time recovery and forking | 1 day | 3 days | 14 days | 14 days |
| Performance insights | Limited | ✓ | ✓ | ✓ |
| Metrics and log exporters | ✓ | ✓ | ||
| Security and compliance | ||||
| Role-based access | ✓ | ✓ | ✓ | ✓ |
| End-to-end encryption | ✓ | ✓ | ✓ | ✓ |
| Private Networking (VPC) | 1 multi-attach VPC | Unlimited multi-attach VPCs | Unlimited multi-attach VPCs | |
| AWS Transit Gateway | ✓ | ✓ | ||
| HIPAA compliance | ✓ | |||
| IP address allow list | 1 list with up to 10 IP addresses | 1 list with up to 10 IP addresses | Up to 10 lists with up to 10 IP addresses each | Up to 10 lists with up to 100 IP addresses each |
| Multi-factor authentication | ✓ | ✓ | ✓ | ✓ |
| Federated authentication (SAML) | ✓ | |||
| SOC 2 Type 2 report | ✓ | ✓ | ||
| Penetration testing report | ✓ | |||
| Security questionnaire and review | ✓ | |||
| Pay by invoice | Available at minimum spend | Available at minimum spend | ✓ | |
| Uptime SLAs | Standard | Standard | Enterprise | |
| Support and technical services | ||||
| Community support | ✓ | ✓ | ✓ | ✓ |
| Email support | ✓ | ✓ | ✓ | |
| Production support | Add-on | Add-on | ✓ | |
| Named account manager | ✓ | |||
| JOIN services (Jumpstart Onboarding and INtegration) | Available at minimum spend | ✓ |
For a personalized quote, get in touch with Tiger Data.
Example billing calculation
You are billed at the end of each month in arrears, based on your actual usage that month. Your monthly invoice includes an itemized cost accounting for each Tiger Cloud service and any additional charges.
Tiger Cloud charges are based on consumption:
- Compute: metered on an hourly basis. You can scale compute up and down at any time.
- Storage: metered based on your average GB consumption per hour. Storage grows and shrinks automatically with your data.
Your monthly price for compute and storage is computed similarly. For example, over the last month your Tiger Cloud service has been running compute for 500 hours total:
- 375 hours with 2 CPU
- 125 hours 4 CPU
Compute cost = (375 x hourly price for 2 CPU) + (125 x hourly price for 4 CPU)
Some add-ons such as tiered storage, HA replicas, and connection pooling may incur additional charges. These charges are clearly marked in your billing snapshot in Tiger Cloud Console.
Manage your Tiger Cloud pricing plan
You handle all details about your Tiger Cloud project including updates to your pricing plan, payment methods, and add-ons in the billing section in Tiger Cloud Console:
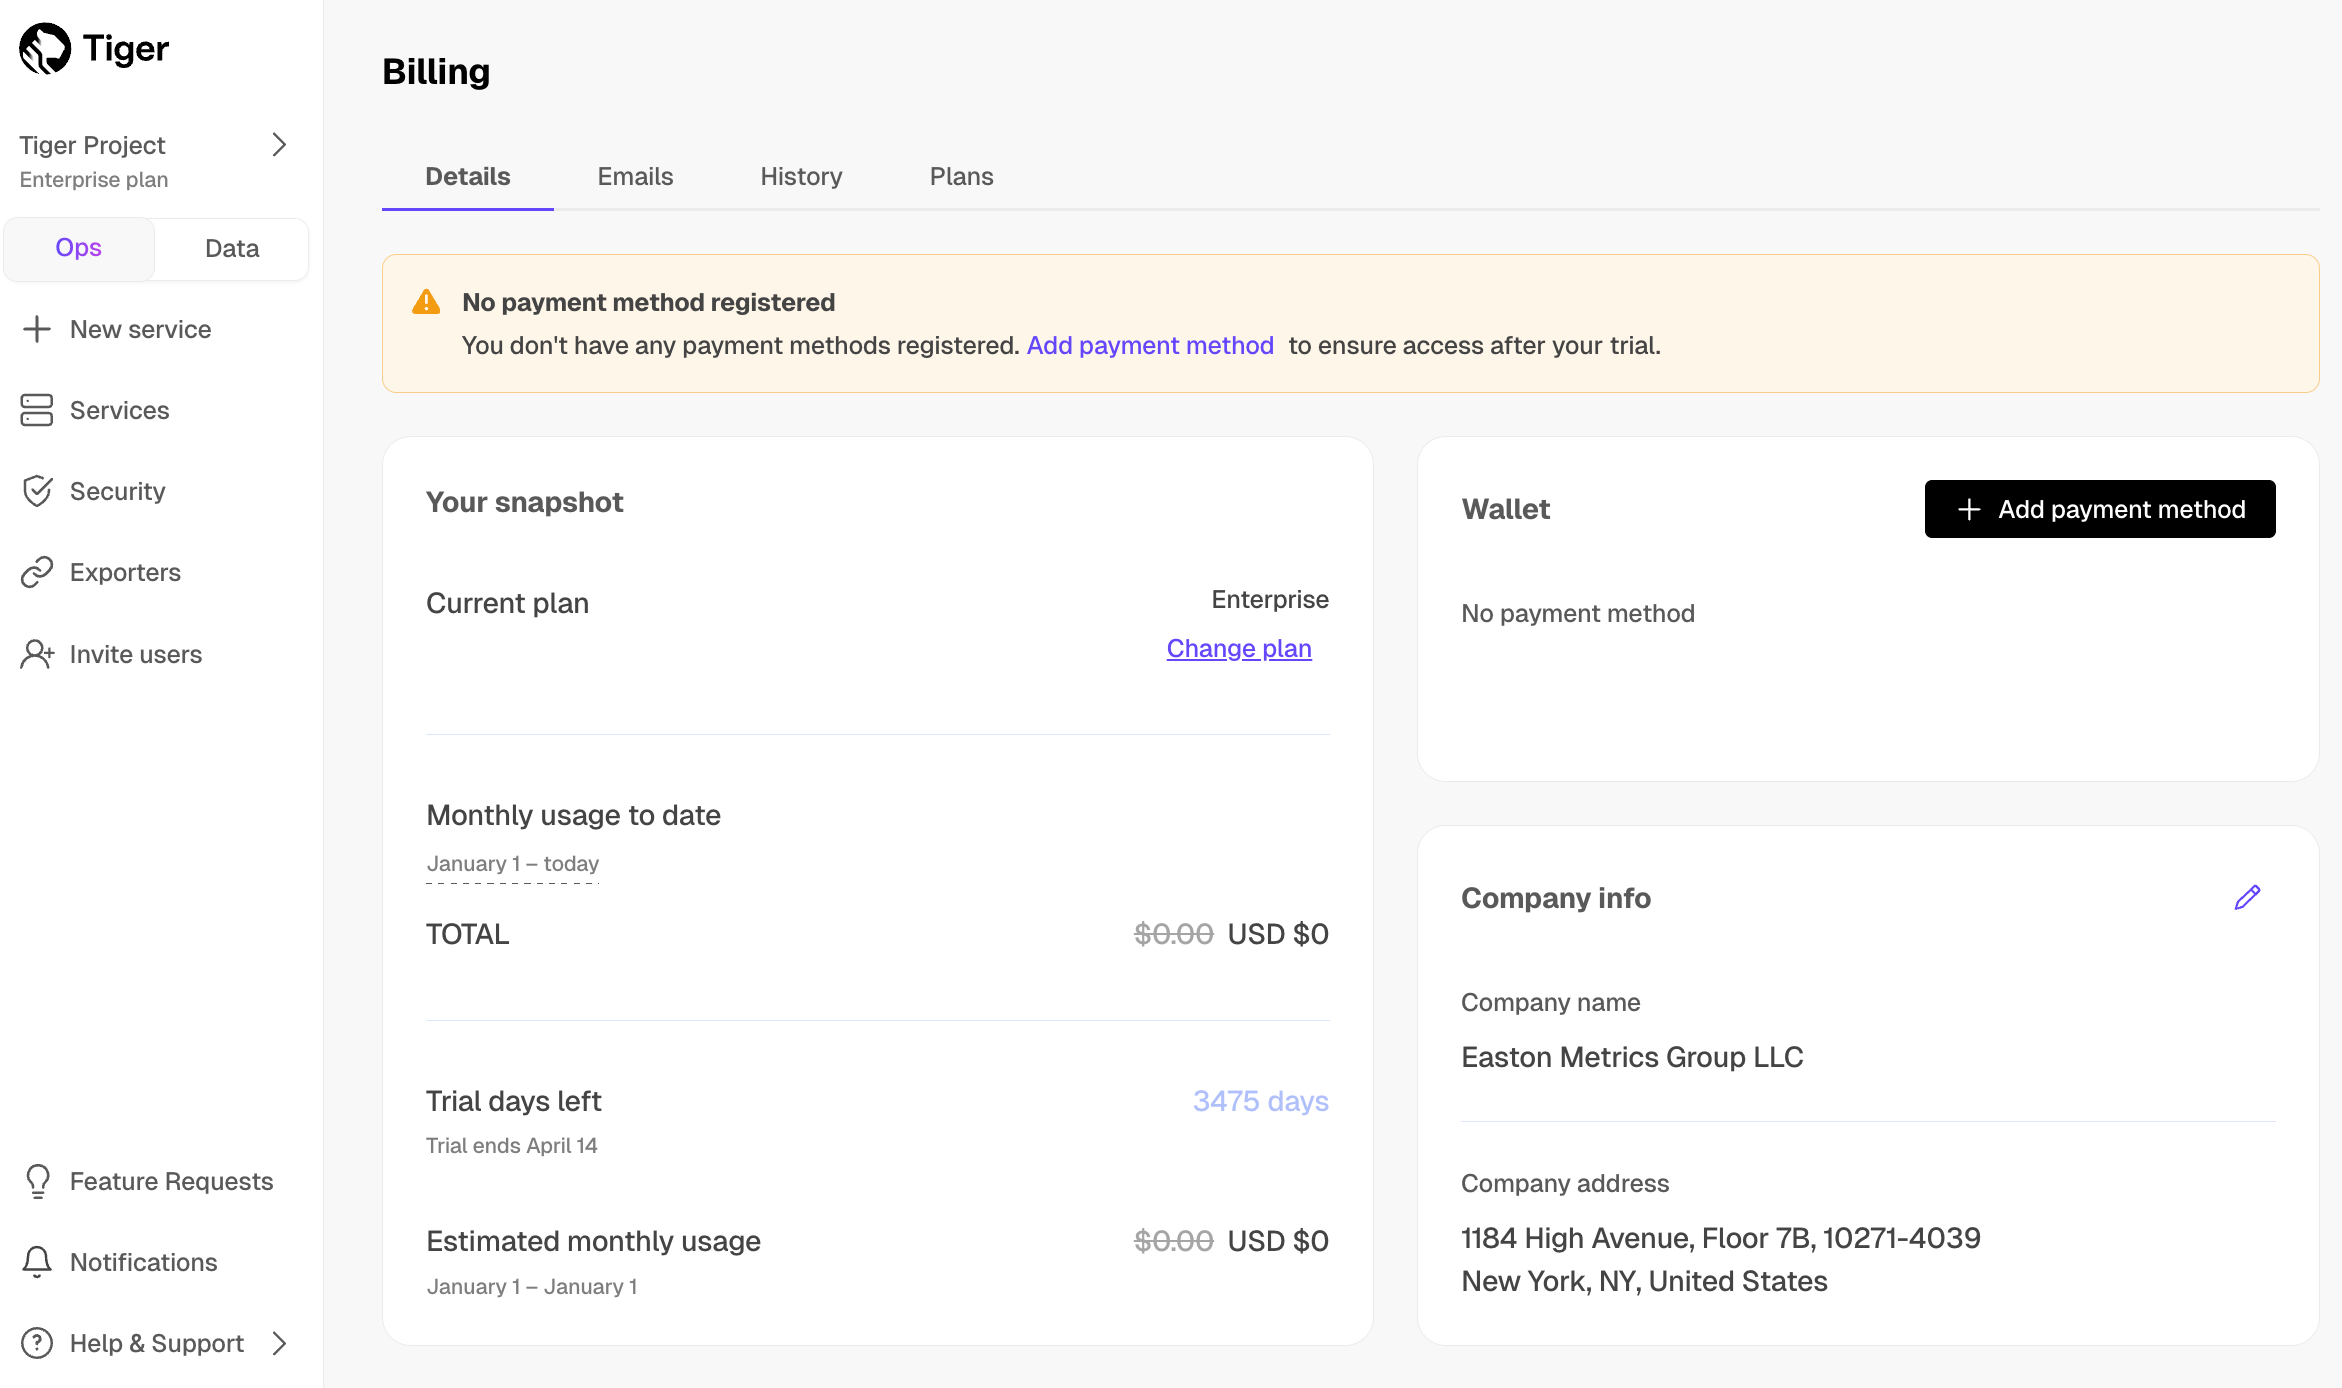
Details: an overview of your pricing plan, usage, and payment details. You can add up to three credit cards to your
Wallet. If you prefer to pay by invoice, contact Tiger Data and ask to change to corporate billing.History: the list of your downloadable Tiger Cloud invoices.
Emails: the addresses Tiger Data uses to communicate with you. Payment confirmations and alerts are sent to the email address you signed up with. Add another address to send details to other departments in your organization.
Pricing plan: choose the pricing plan supplying the features that suit your business and engineering needs.
Add-ons: add
Production supportand improved database performance for mission-critical workloads.
AWS Marketplace pricing
When you get Tiger Cloud at AWS Marketplace, the following pricing options are available:
- Pay-as-you-go: your consumption is calculated at the end of the month and included in your AWS invoice. No upfront costs, standard Tiger Cloud rates apply.
- Annual commit: your consumption is calculated at the end of the month ensuring predictable pricing and seamless billing through your AWS account. We confirm the contract terms with you before finalizing the commitment.
===== PAGE: https://docs.tigerdata.com/about/changelog/ =====
Changelog
All the latest features and updates to Tiger Cloud.
TimescaleDB 2.22.1 – configurable indexing, enhanced partitioning, and faster queries
October 10, 2025
TimescaleDB 2.22.1 introduces major performance and flexibility improvements across indexing, compression, and query execution. TimescaleDB 2.22.1 was released on September 30th and is now available to all users of Tiger.
Highlighted features
Configurable sparse indexes: manually configure sparse indexes (min-max or bloom) on one or more columns of compressed hypertables, optimizing query performance for specific workloads and reducing I/O. In previous versions, these were automatically created based on heuristics and could not be modified.
UUIDv7 support: native support for UUIDv7 for both compression and partitioning. UUIDv7 embeds a time component, improving insert locality and enabling efficient time-based range queries while maintaining global uniqueness.
Vectorized UUID compression: new vectorized compression for UUIDv7 columns doubles query performance and improves storage efficiency by up to 30%.
UUIDv7 partitioning: hypertables can now be partitioned on UUIDv7 columns, combining time-based chunking with globally unique IDs—ideal for large-scale event and log data.
Multi-column SkipScan: expands SkipScan to support multiple distinct keys, delivering millisecond-fast deduplication and
DISTINCT ONqueries across billions of rows. Learn more in our blog post and documentation.Compression improvements: default
segmentbyandorderbysettings are now applied at compression time for each chunk, automatically adapting to evolving data patterns for better performance. This was previously set at the hypertable level and fixed across all chunks.
Deprecations
The experimental Hypercore Table Access Method (TAM) has been removed in this release following advancements in the columnstore architecture.
For a comprehensive list of changes, refer to the TimescaleDB 2.22 & 2.22.1 release notes.
Kafka Source Connector (beta)
September 19, 2025
The new Kafka Source Connector enables you to connect your existing Kafka clusters directly to Tiger Cloud and ingest data from Kafka topics into hypertables. Developers often build proxies or run JDBC Sink Connectors to bridge Kafka and Tiger Cloud, which is error-prone and time-consuming. With the Kafka Source Connector, you can seamlessly start ingesting your Kafka data natively without additional middleware.
- Supported formats: AVRO
- Supported platforms: Confluent Cloud and Amazon Managed Streaming for Apache Kafka
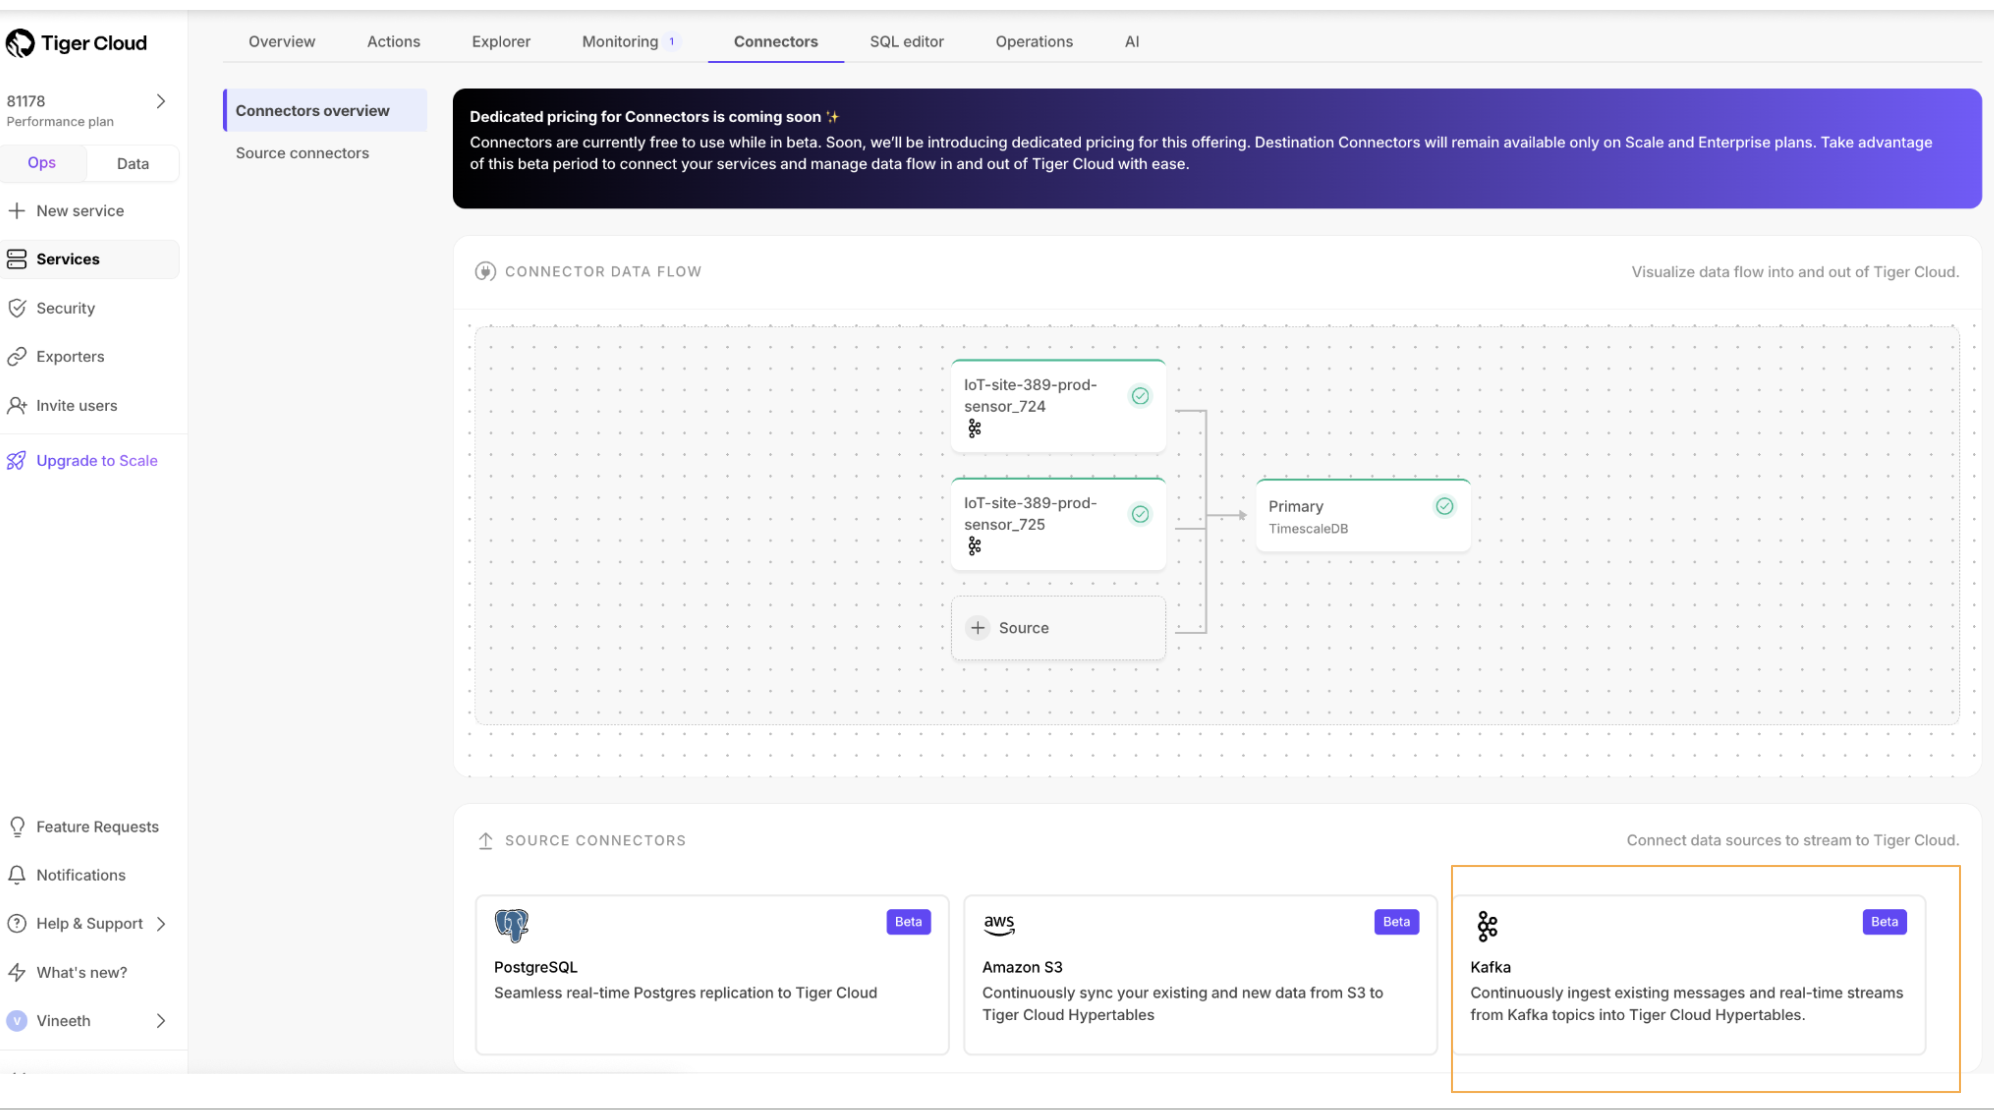
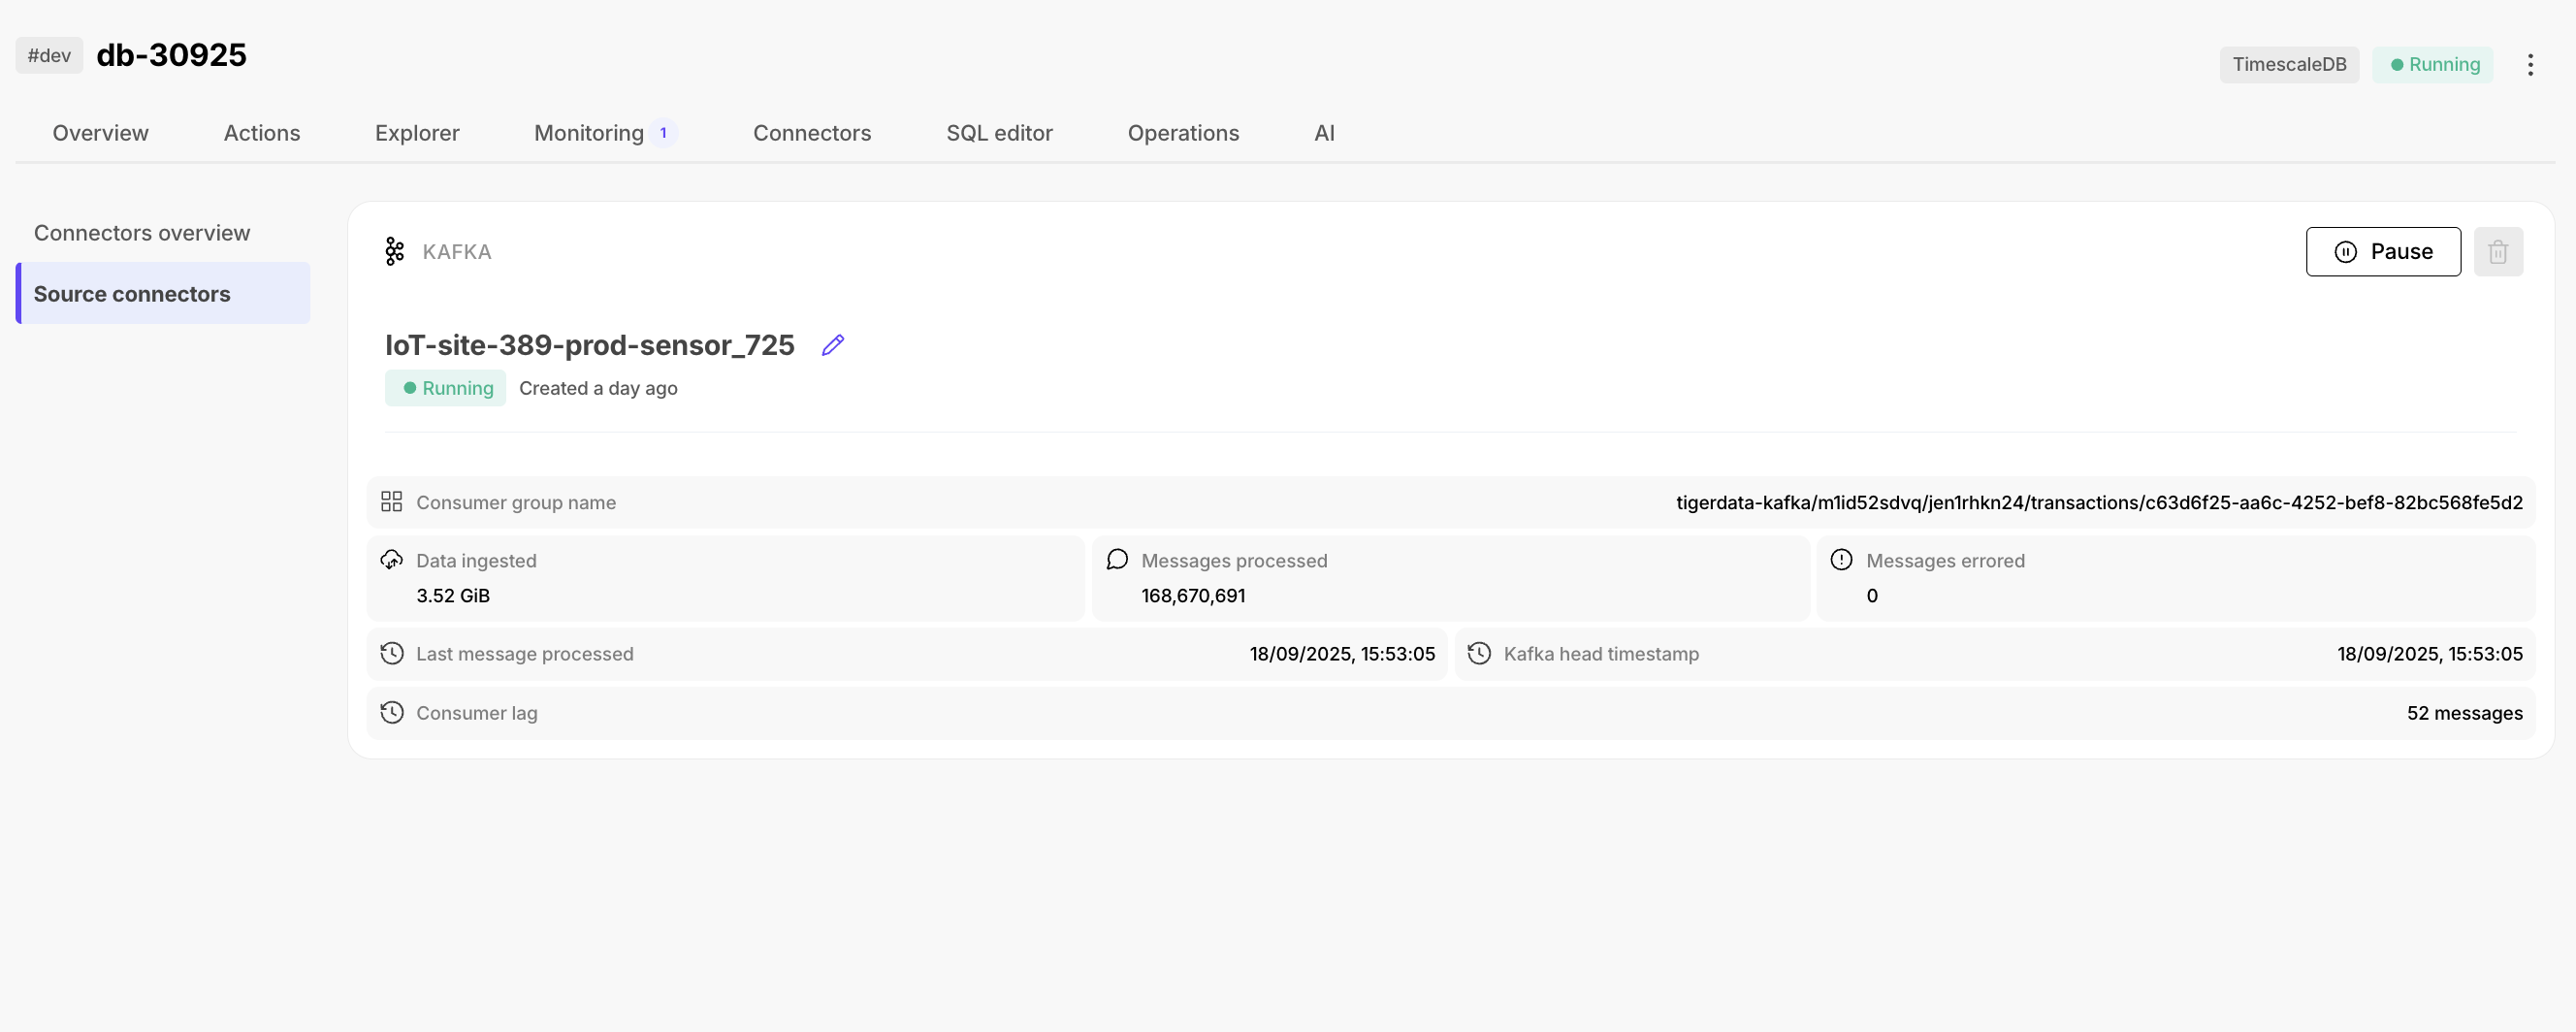
Phased update rollouts, pg_cron, larger compute options, and backup reports
September 12, 2025
🛡️ Phased rollouts for TimescaleDB minor releases
Starting with TimescaleDB 2.22.0, minor releases will now roll out in phases. Services tagged #dev will get upgraded first, followed by #prod after 21 days. This gives you time to validate upgrades in #dev before they reach #prod services. Subscribe to get an email notification before your #prod service is upgraded. See Maintenance and upgrades for details.
⏰ pg_cron extension
pg_cron is now available on Tiger Cloud! With pg_cron, you can:
- Schedule SQL commands to run automatically—like generating weekly sales reports or cleaning up old log entries every night at 2 AM.
- Automate routine maintenance tasks such as refreshing materialized views hourly to keep dashboards current.
- Eliminate external cron jobs and task schedulers, keeping all your automation logic within PostgreSQL.
To enable pg_cron on your service, contact our support team. We're working on making this self-service in future updates.
⚡️ Larger compute options: 48 and 64 CPU
For the most demanding workloads, you can now create services with 48 and 64 CPUs. These options are only available on our Enterprise plan, and they're dedicated instances that are not shared with other customers.
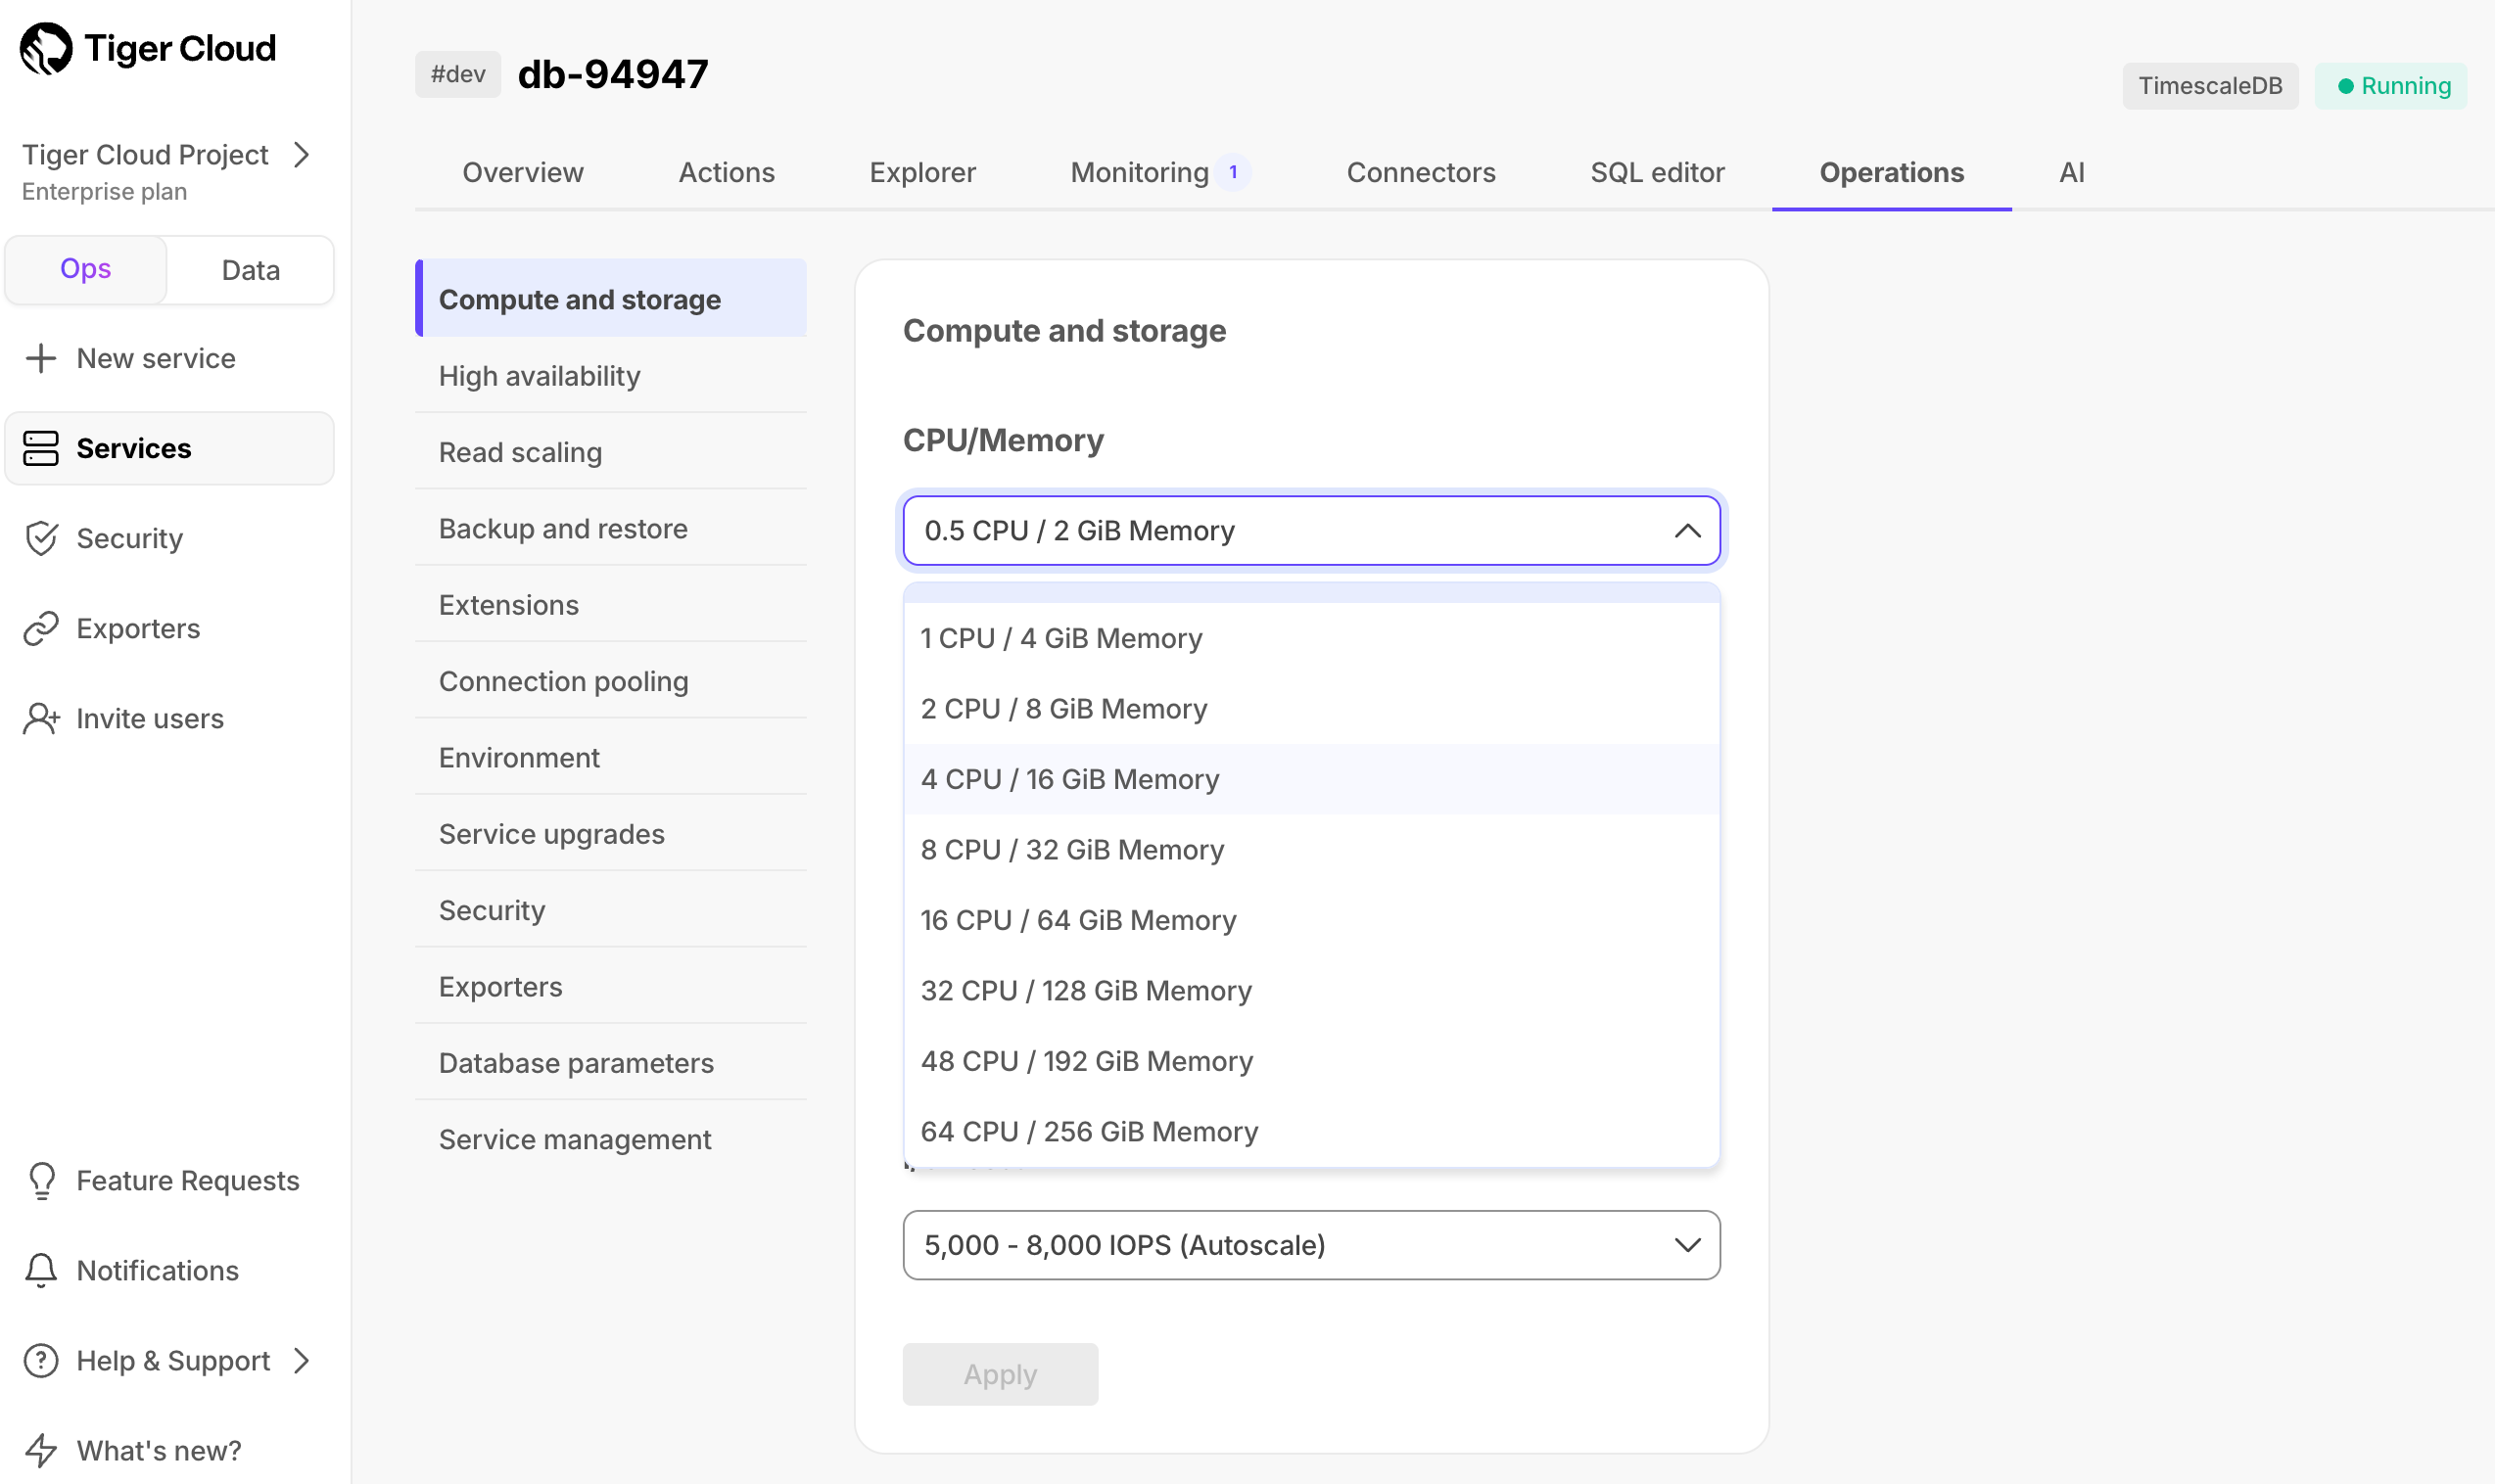
📋 Backup report for compliance
Scale and Enterprise customers can now see a list of their backups in Tiger Cloud Console. For customers with SOC 2 or other compliance needs, this serves as auditable proof of backups.
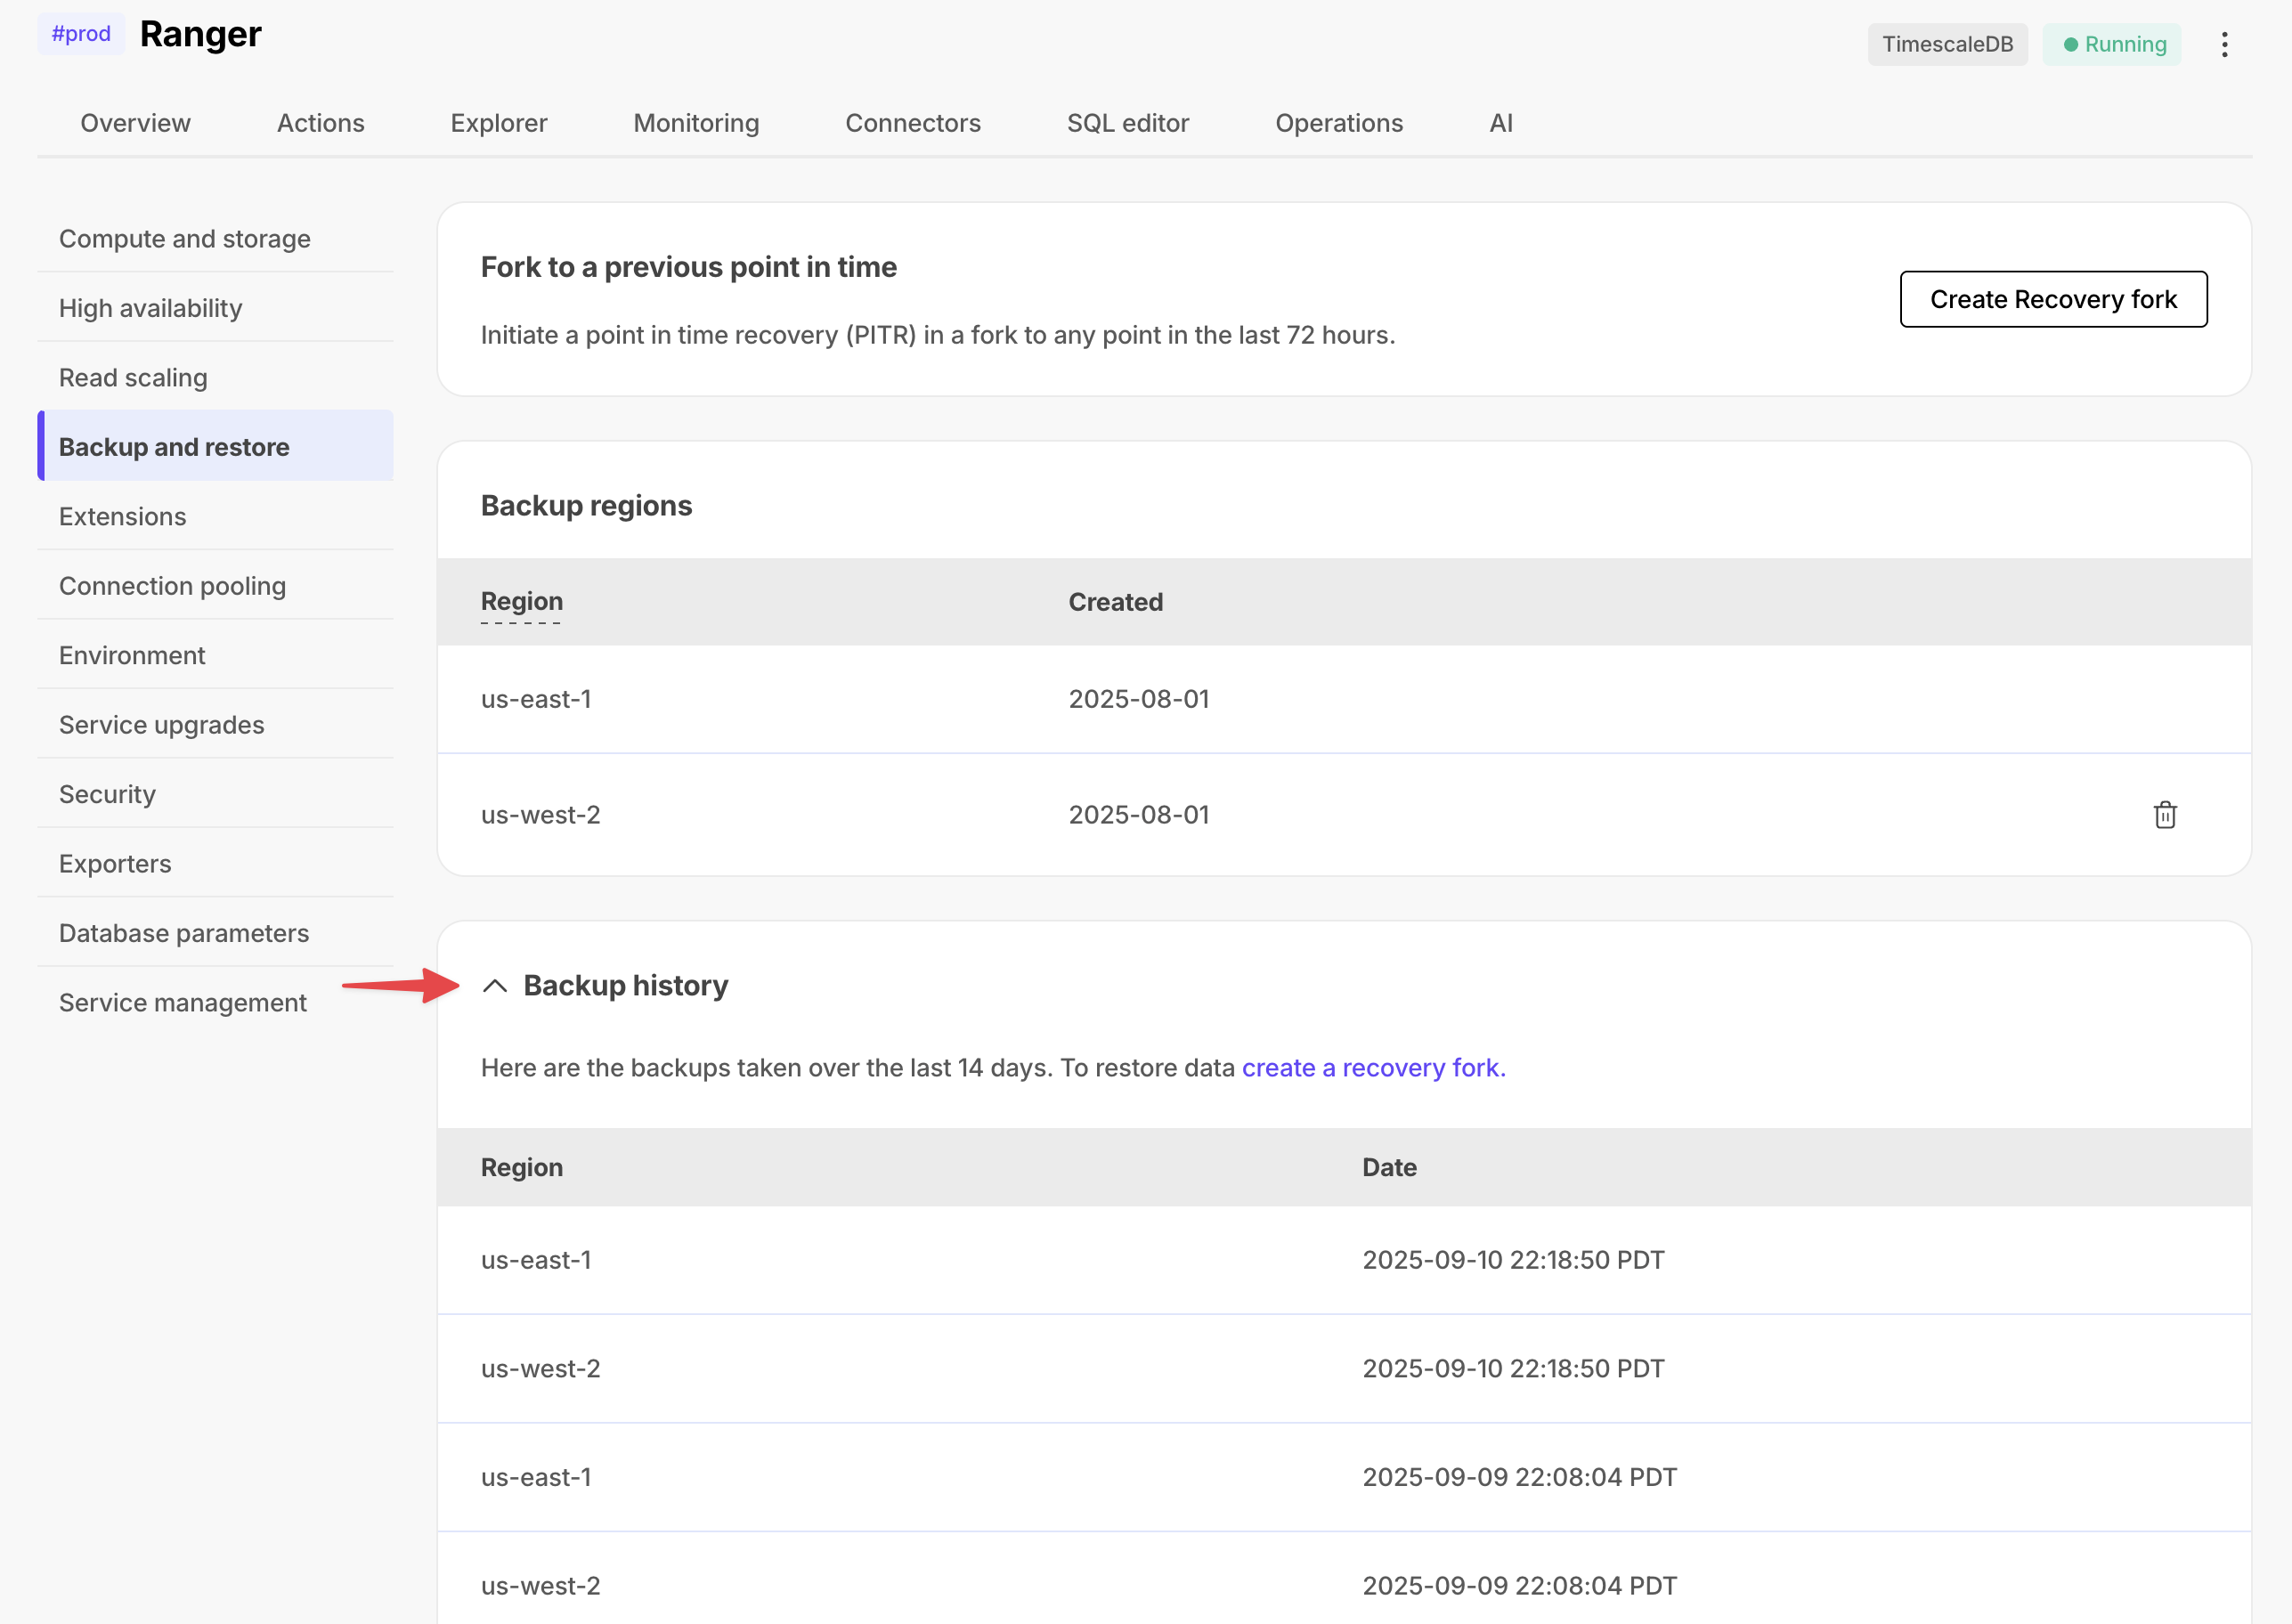
🗺️ New router for Tiger Cloud Console
The UI just got snappier and easier to navigate with improved interlinking. For example, click an object in the Jobs page to see what hypertable the job is associated with.
New data import wizard
September 5, 2025
To make navigation easier, we’ve introduced a cleaner, more intuitive UI for data import. It highlights the most common and recommended option, PostgreSQL Dump & Restore, while organizing all import options into clear categories, to make navigation easier.
The new categories include:
- PostgreSQL Dump & Restore
- Upload Files: CSV, Parquet, TXT
- Real-time Data Replication: source connectors
- Migrations & Other Options
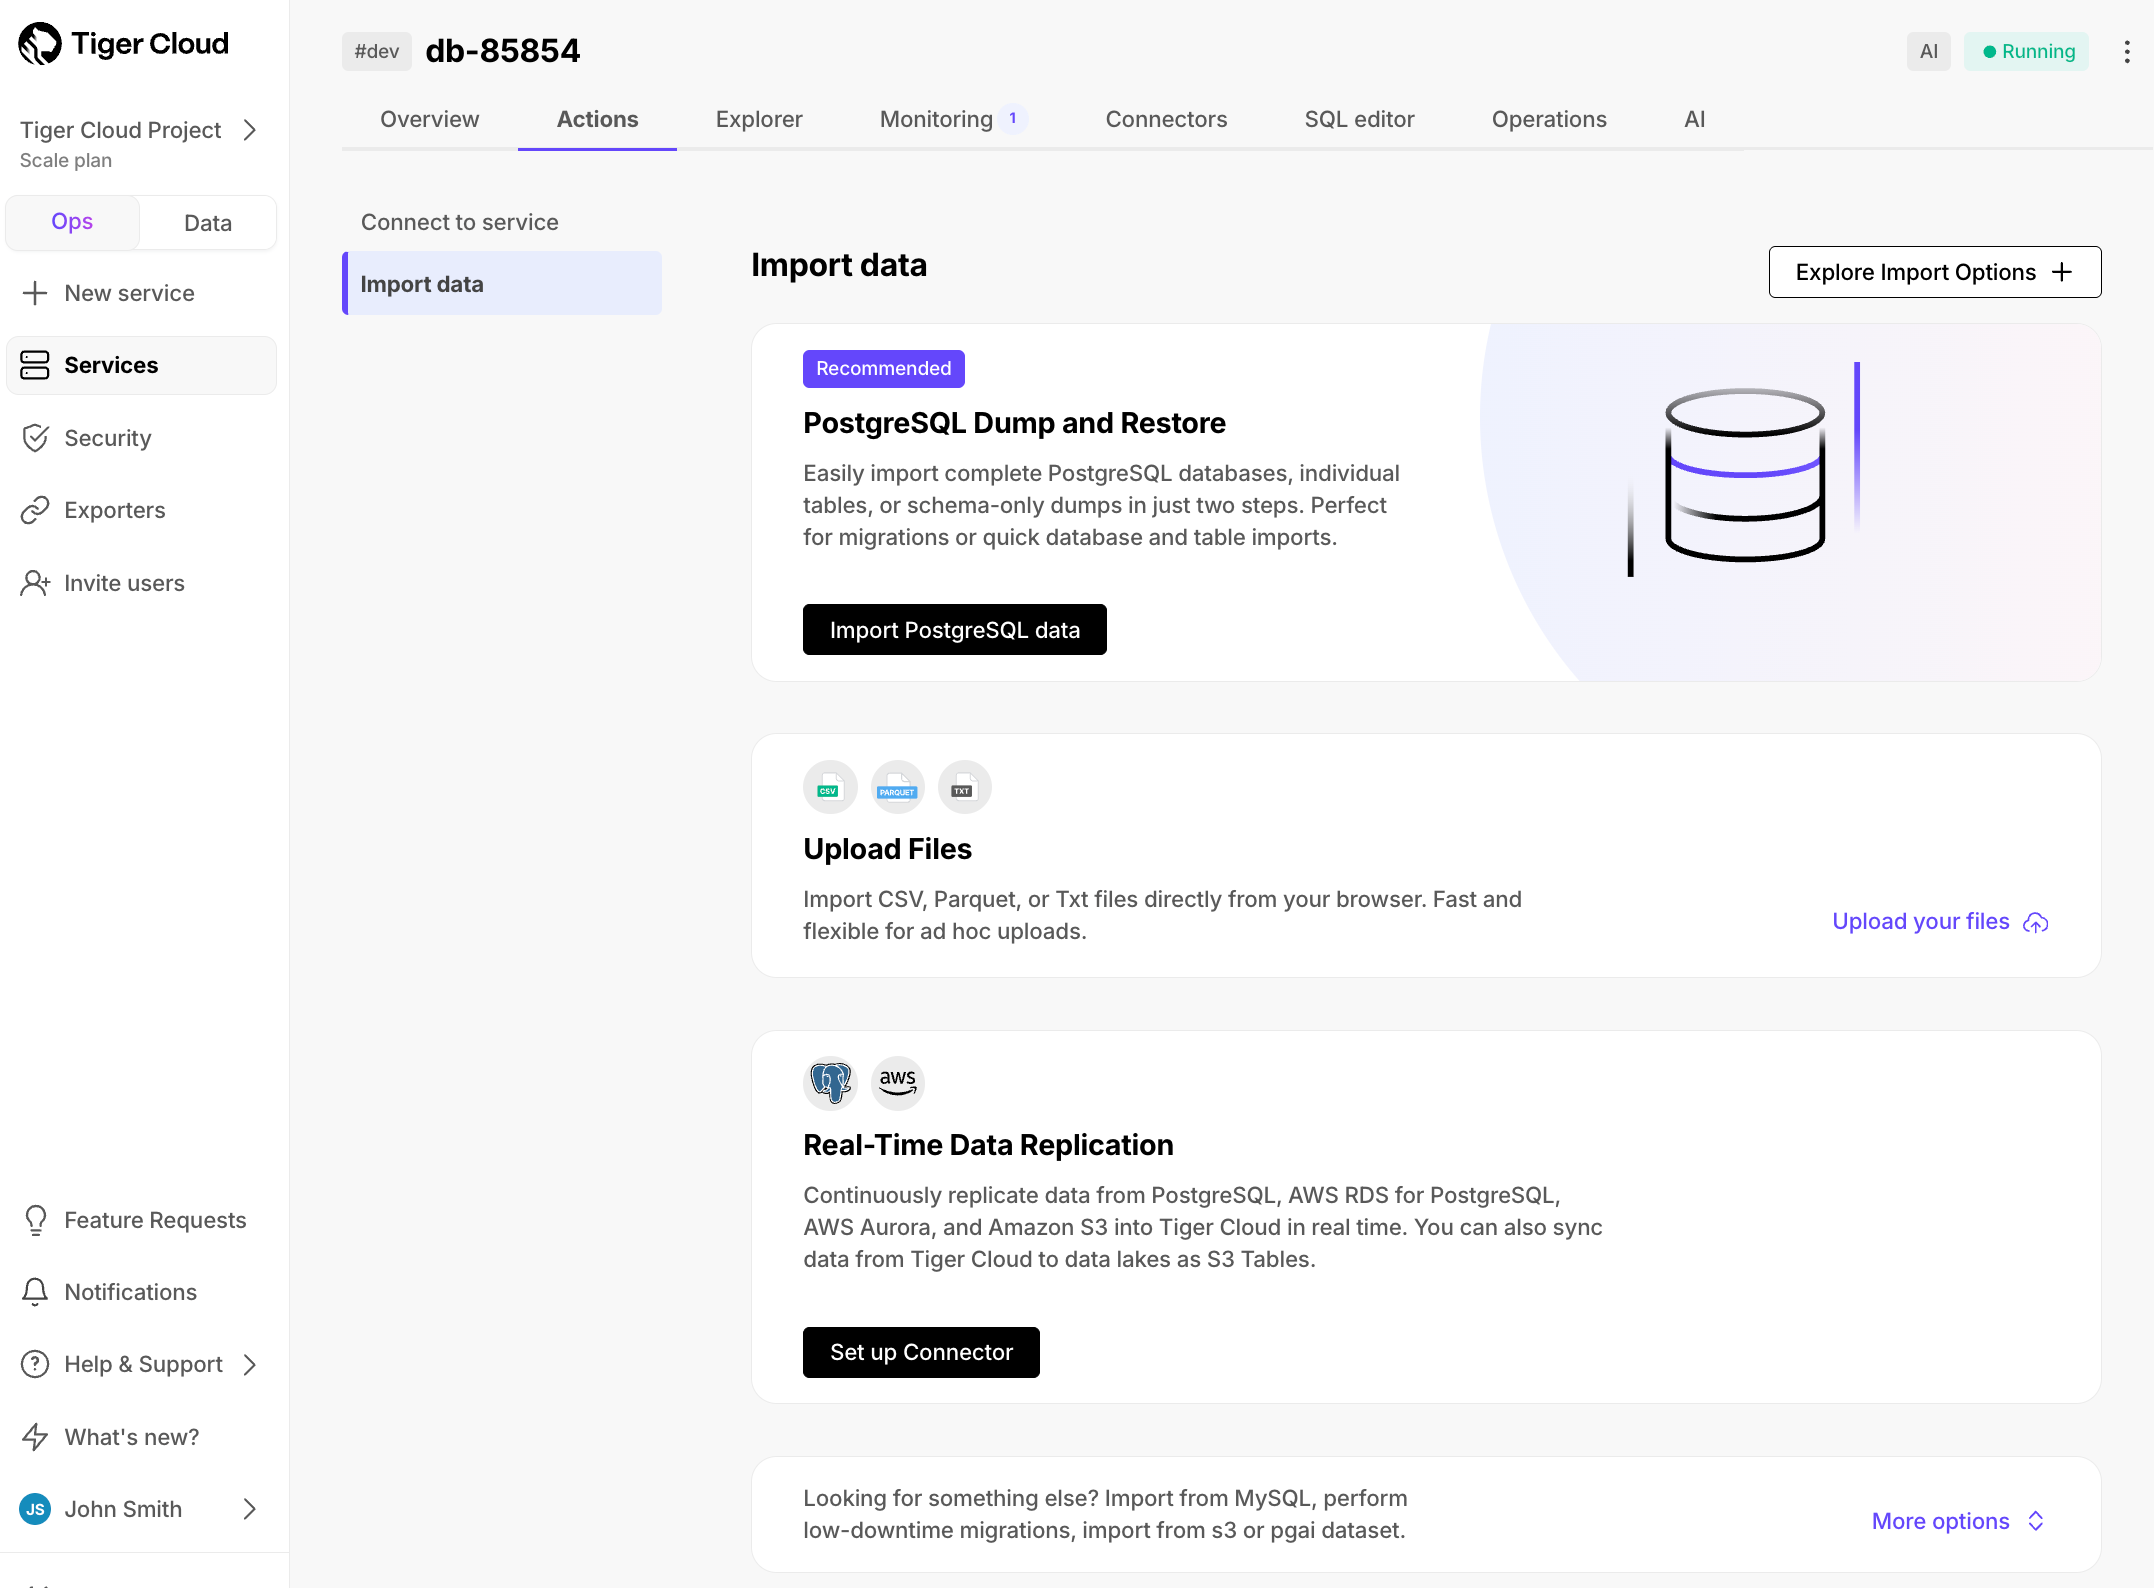
A new data import component has been added to the overview dashboard, providing a clear view of your imports. This includes quick start, in-progress status, and completed imports:
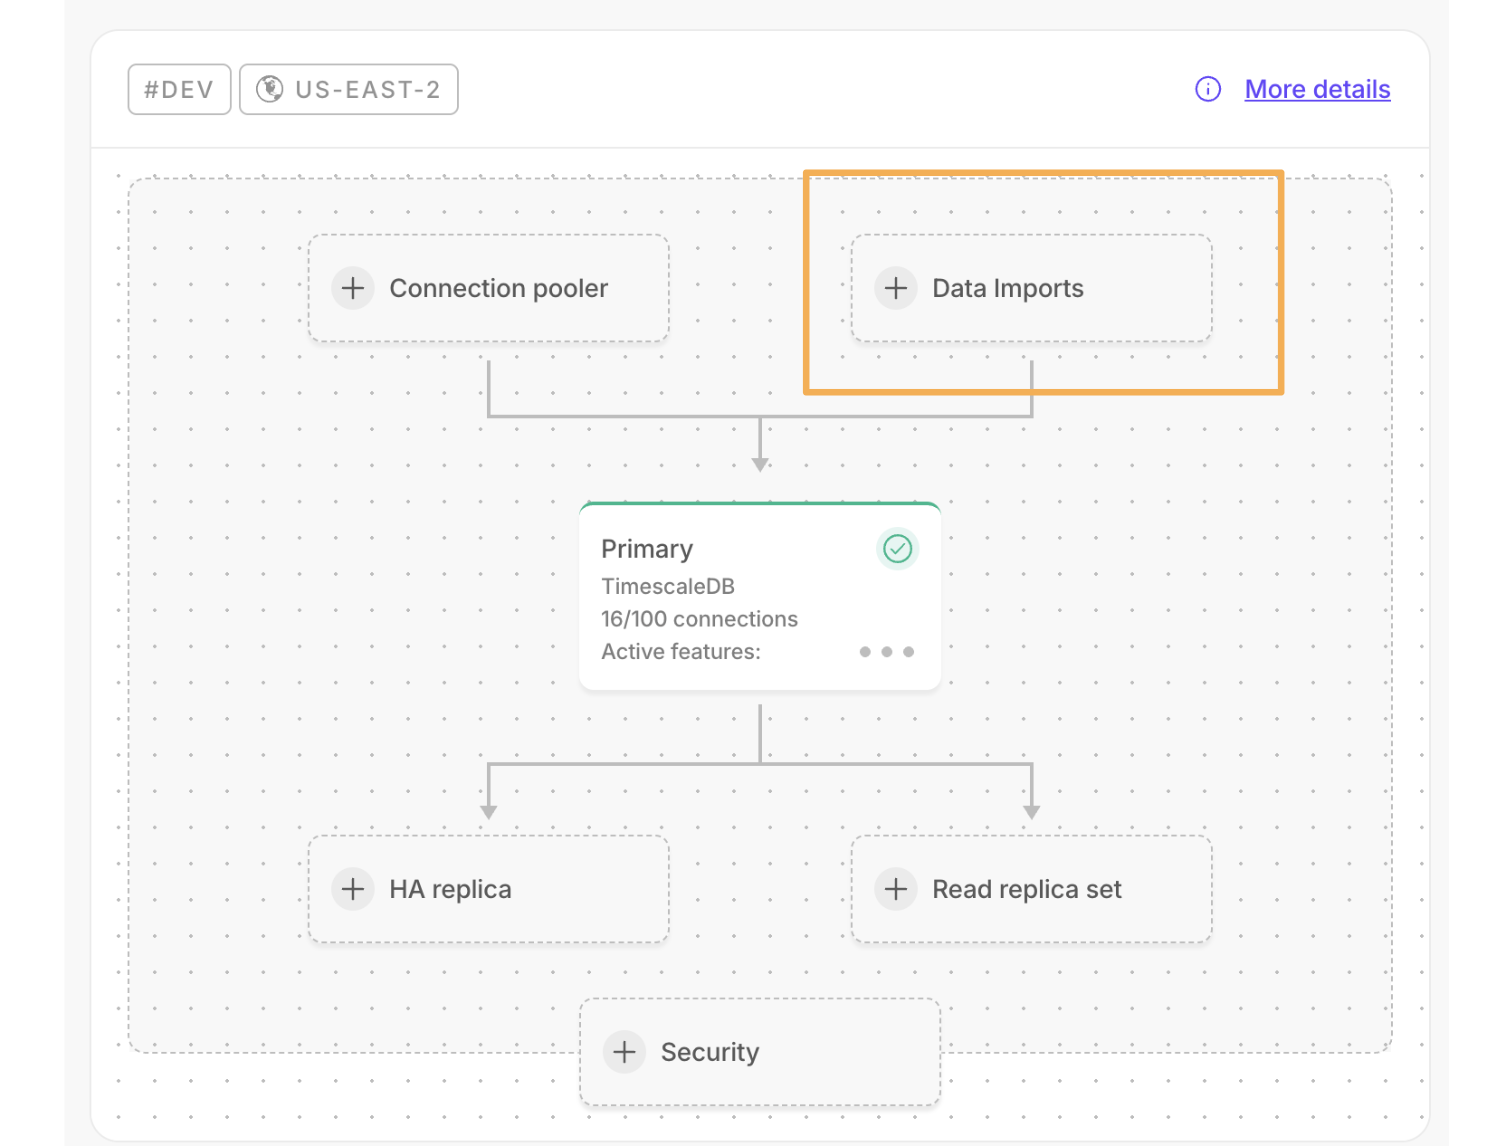
🚁 Enhancements to the Postgres source connector
August 28, 2025
- Easy table selection: You can now sync the complete source schema in one go. Select multiple tables from the drop-down menu and start the connector.
- Sync metadata: Connectors now display the following detailed metadata:
Initial data copy: The number of rows copied at any given point in time.Change data capture: The replication lag represented in time and data size.
- Improved UX design: In-progress syncs with separate sections showing the tables and metadata for
initial data copyandchange data capture, plus a dedicated tab where you can add more tables to the connector.
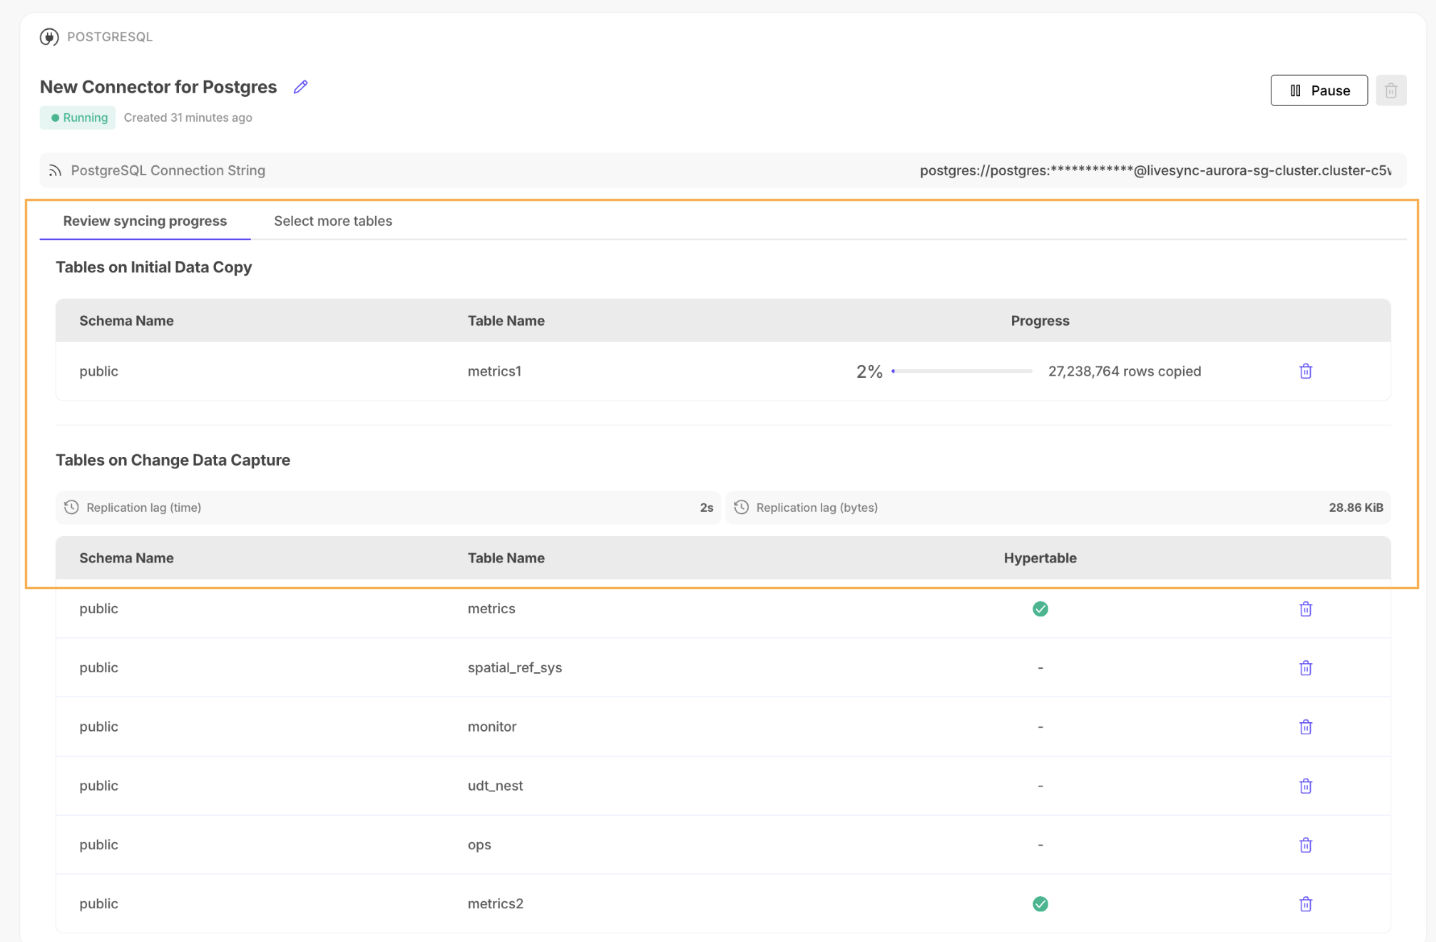
🦋 Developer role GA and hypertable transformation in Console
August 21, 2025
Developer role (GA)
The Developer role in Tiger Cloud is now generally available. It’s a project‑scoped permission set that lets technical users build and operate services, create or modify resources, run queries, and use observability—without admin or billing access. This enforces least‑privilege by default, reducing risk and audit noise, while keeping governance with Admins/Owners and billing with Finance. This means faster delivery (fewer access escalations), protected sensitive settings, and clear boundaries, so the right users can ship changes safely, while compliance and cost control remain intact.
Transform a table to a hypertable from the Explorer
In Console, you can now easily create hypertables from your regular Postgres tables directly from the Explorer. Clicking on any Postgres table shows an option to open up the hypertable action. Follow the simple steps to set up your partition key and transform the table to a hypertable.
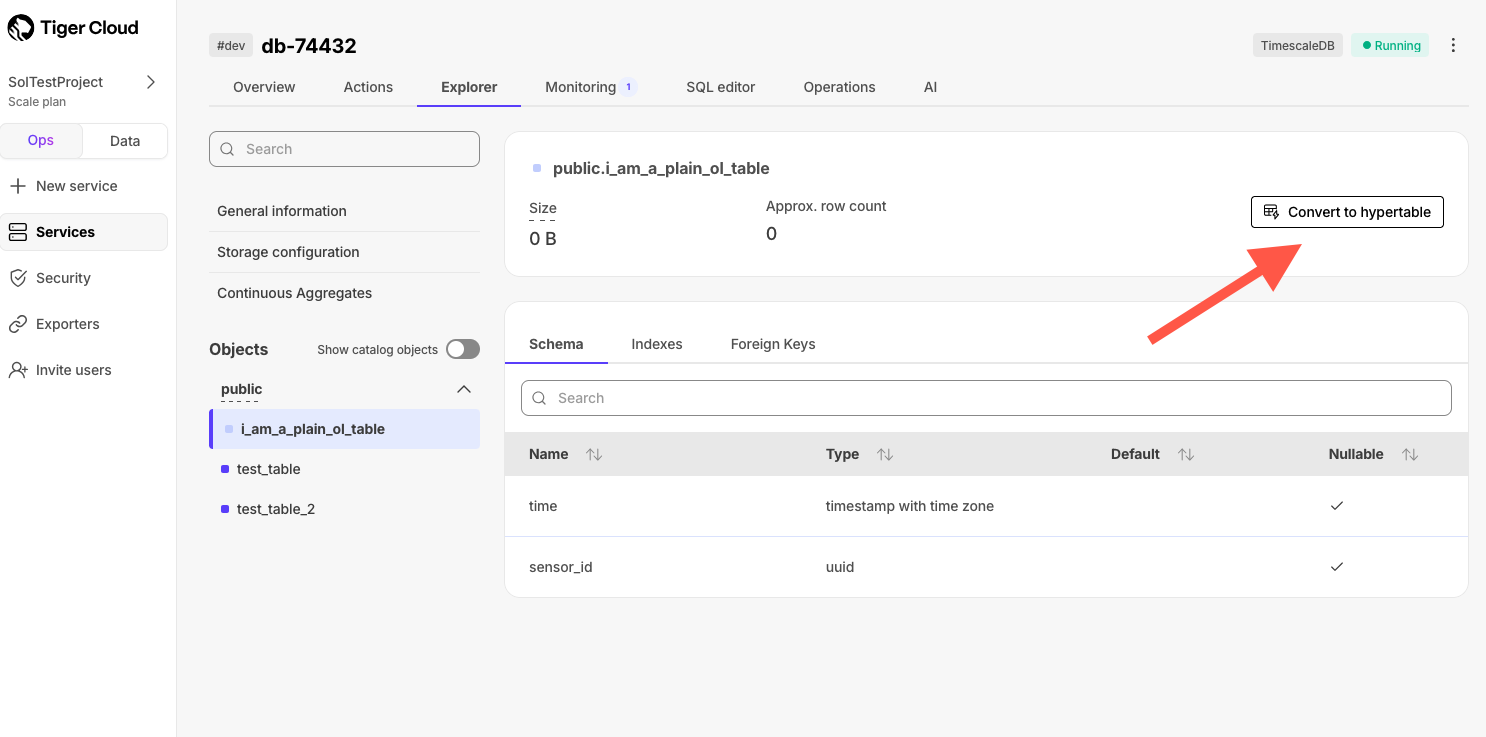
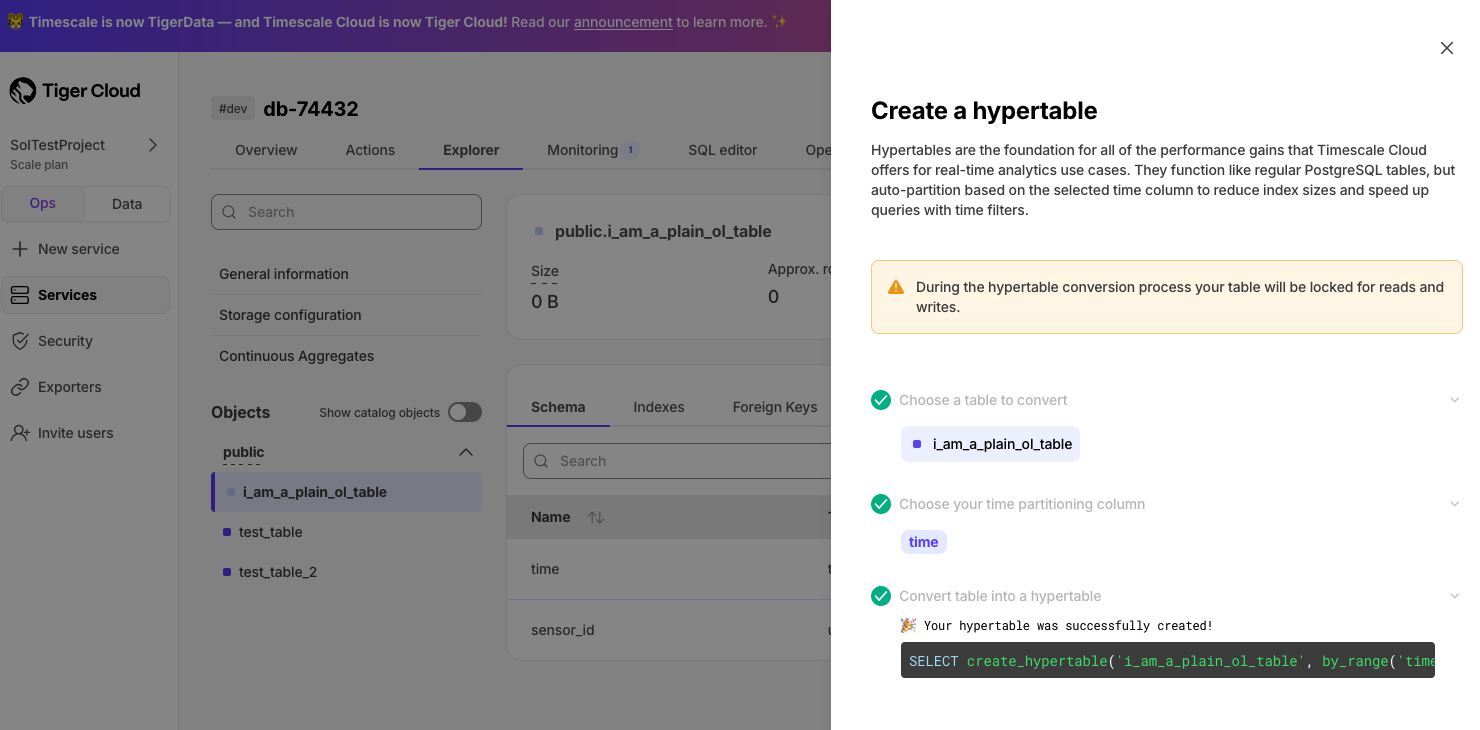
Cross-region backups, Postgres options, and onboarding
August 14, 2025
Cross-region backups
You can now store backups in a different region than your service, which improves resilience and helps meet enterprise compliance requirements. Cross‑region backups are available on our Enterprise plan for free at launch; usage‑based billing may be introduced later. For full details, please see the docs.
Standard Postgres instructions for onboarding
We have added basic instructions for INSERT, UPDATE, DELETE commands to the Tiger Cloud console. It's now shown as an option in the Import Data page.
Postgres-only service type
In Tiger Cloud, you now have an option to choose Postgres-only in the service creation flow. Just click Looking for plan PostgreSQL? on the Service Type screen.
Viewer role GA, EXPLAIN plans, and chunk index sizes in Explorer
July 31, 2025
GA release of the viewer role in role-based access
The viewer role is now generally available for all projects and organizations. It provides read-only access to services, metrics, and logs without modify permissions. Viewers cannot create, update, or delete resources, nor manage users or billing. It's ideal for auditors, analysts, and cross-functional collaborators who need visibility but not control.
EXPLAIN plans in Insights
You can now find automatically generated EXPLAIN plans on queries that take longer than 10 seconds within Insights. EXPLAIN plans can be very useful to determine how you may be able to increase the performance of your queries.
Chunk index size in Explorer
Find the index size of hypertable chunks in the Explorer. This information can be very valuable to determine if a hypertable's chunk size is properly configured.
TimescaleDB v2.21 and catalog objects in the Console Explorer
July 25, 2025
🏎️ TimescaleDB v2.21—ingest millions of rows/second and faster columnstore UPSERTs and DELETEs
TimescaleDB v2.21 was released on July 8 and is now available to all developers on Tiger Cloud.
Highlighted features in TimescaleDB v2.21 include:
- High-scale ingestion performance (tech preview): introducing a new approach that compresses data directly into the columnstore during ingestion, demonstrating over 1.2M rows/second in tests with bursts over 50M rows/second. We are actively seeking design partners for this feature.
- Faster data updates (UPSERTs): columnstore UPSERTs are now 2.5x faster for heavily constrained tables, building on the 10x improvement from v2.20.
- Faster data deletion: DELETE operations on non-segmentby columns are 42x faster, reducing I/O and bloat.
- Reduced bloat after recompression: optimized recompression processes lead to less bloat and more efficient storage.
- Enhanced continuous aggregates:
- Concurrent refresh policies enable multiple continuous aggregates to update concurrently.
- Batched refreshes are now enabled by default for more efficient processing.
- Complete chunk management: full support for splitting columnstore chunks, complementing the existing merge capabilities.
For a comprehensive list of changes, refer to the TimescaleDB v2.21 release notes.
🔬 Catalog objects available in the Console Explorer
You can now view catalog objects in the Console Explorer. Check out the internal schemas for PostgreSQL and TimescaleDB to better understand the inner workings of your database. To turn on/off visibility, select your service in Tiger Cloud Console, then click Explorer and toggle Show catalog objects.
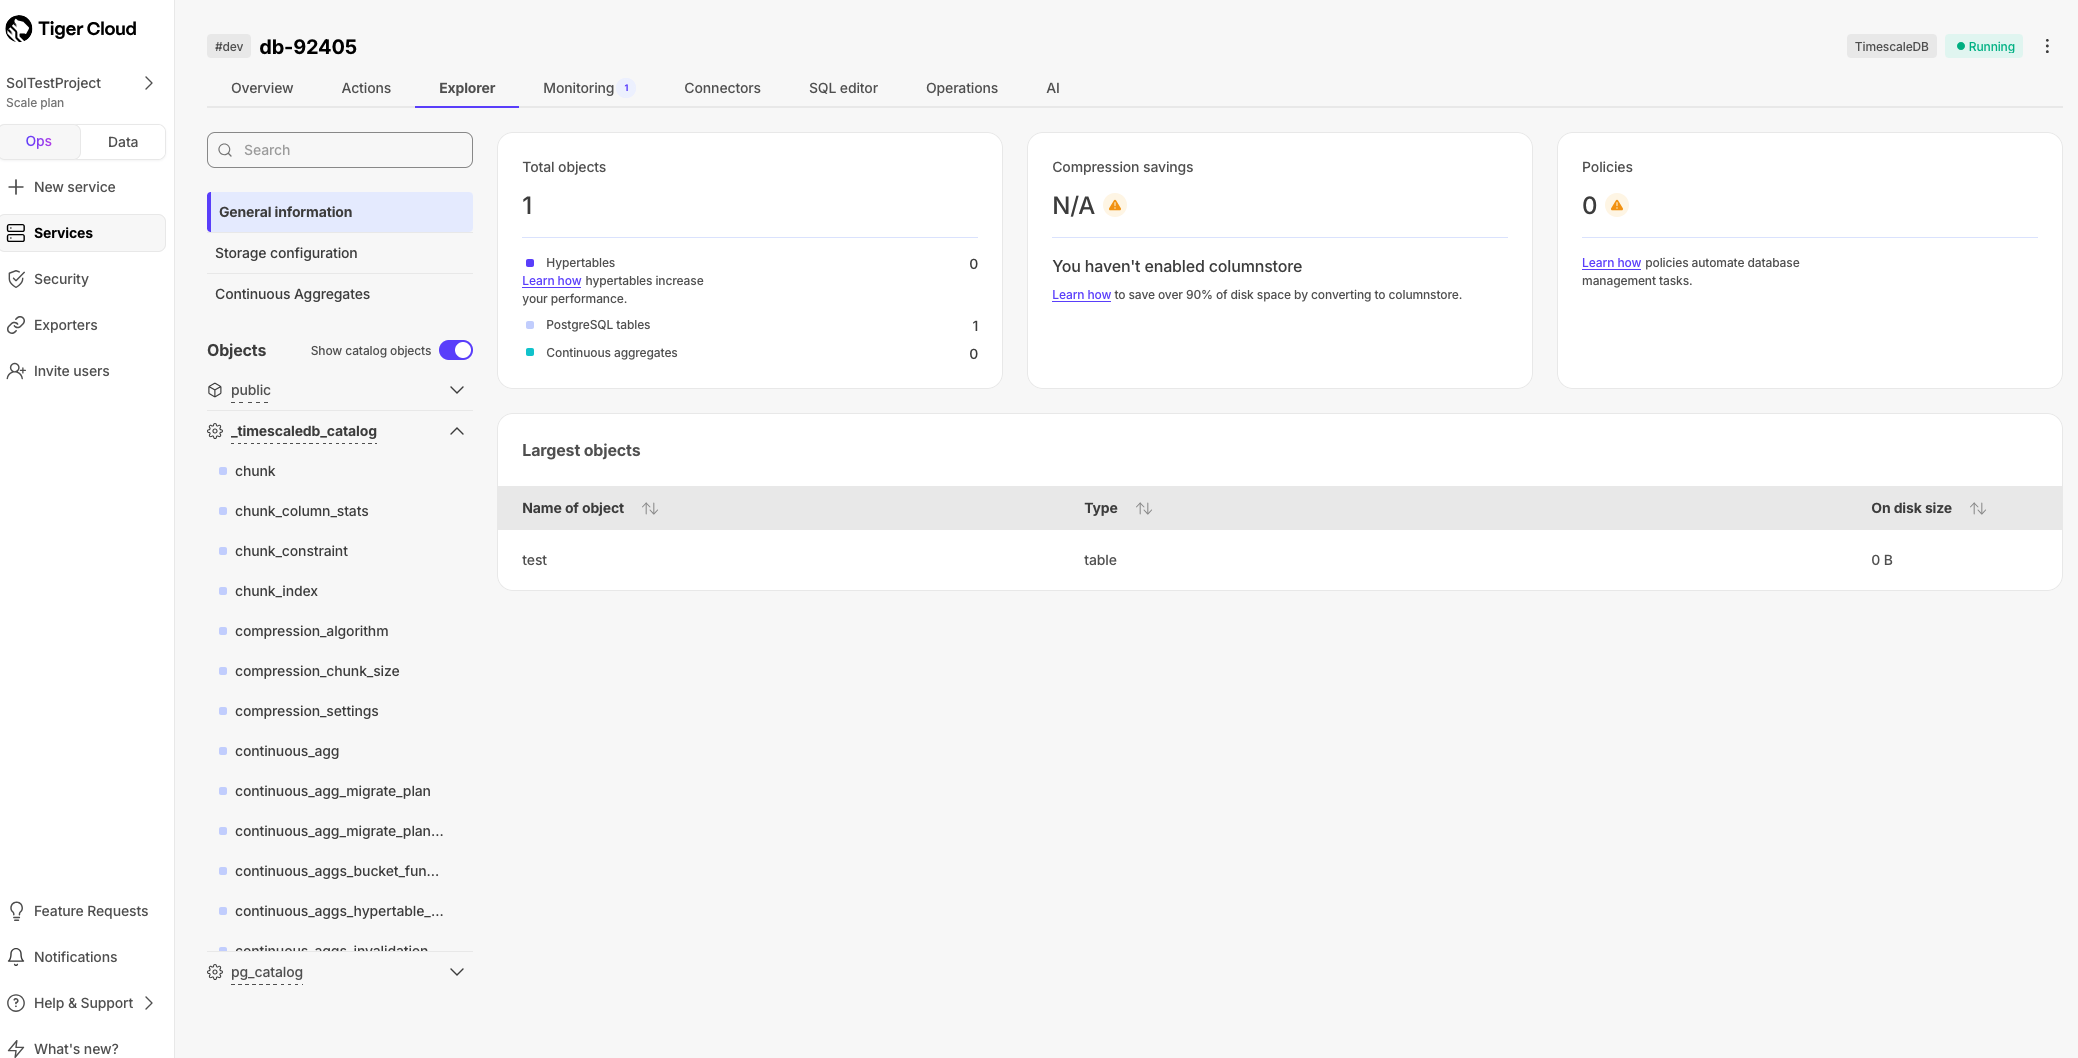
Iceberg Destination Connector (Tiger Lake)
July 18, 2025
We have released a beta Iceberg destination connector that enables Scale and Enterprise users to integrate Tiger Cloud services with Amazon S3 tables. This enables you to connect Tiger Cloud to data lakes seamlessly. We are actively developing several improvements that will make the overall data lake integration process even smoother.
To use this feature, select your service in Tiger Cloud Console, then navigate to Connectors and select the Amazon S3 Tables destination connector. Integrate the connector to your S3 table bucket by providing the ARN roles, then simply select the tables that you want to sync into S3 tables. See the documentation for details.
🔆Console just got better
July 11, 2025
✏️ Editable jobs in Console
You can now edit jobs directly in Console! We've added the handy pencil icon in the top right corner of any job view. Click a job, hit the edit button, then make your changes. This works for all jobs, even user-defined ones. Tiger Cloud jobs come with custom wizards to guide you through the right inputs. This means you can spot and fix issues without leaving the UI - a small change that makes a big difference!
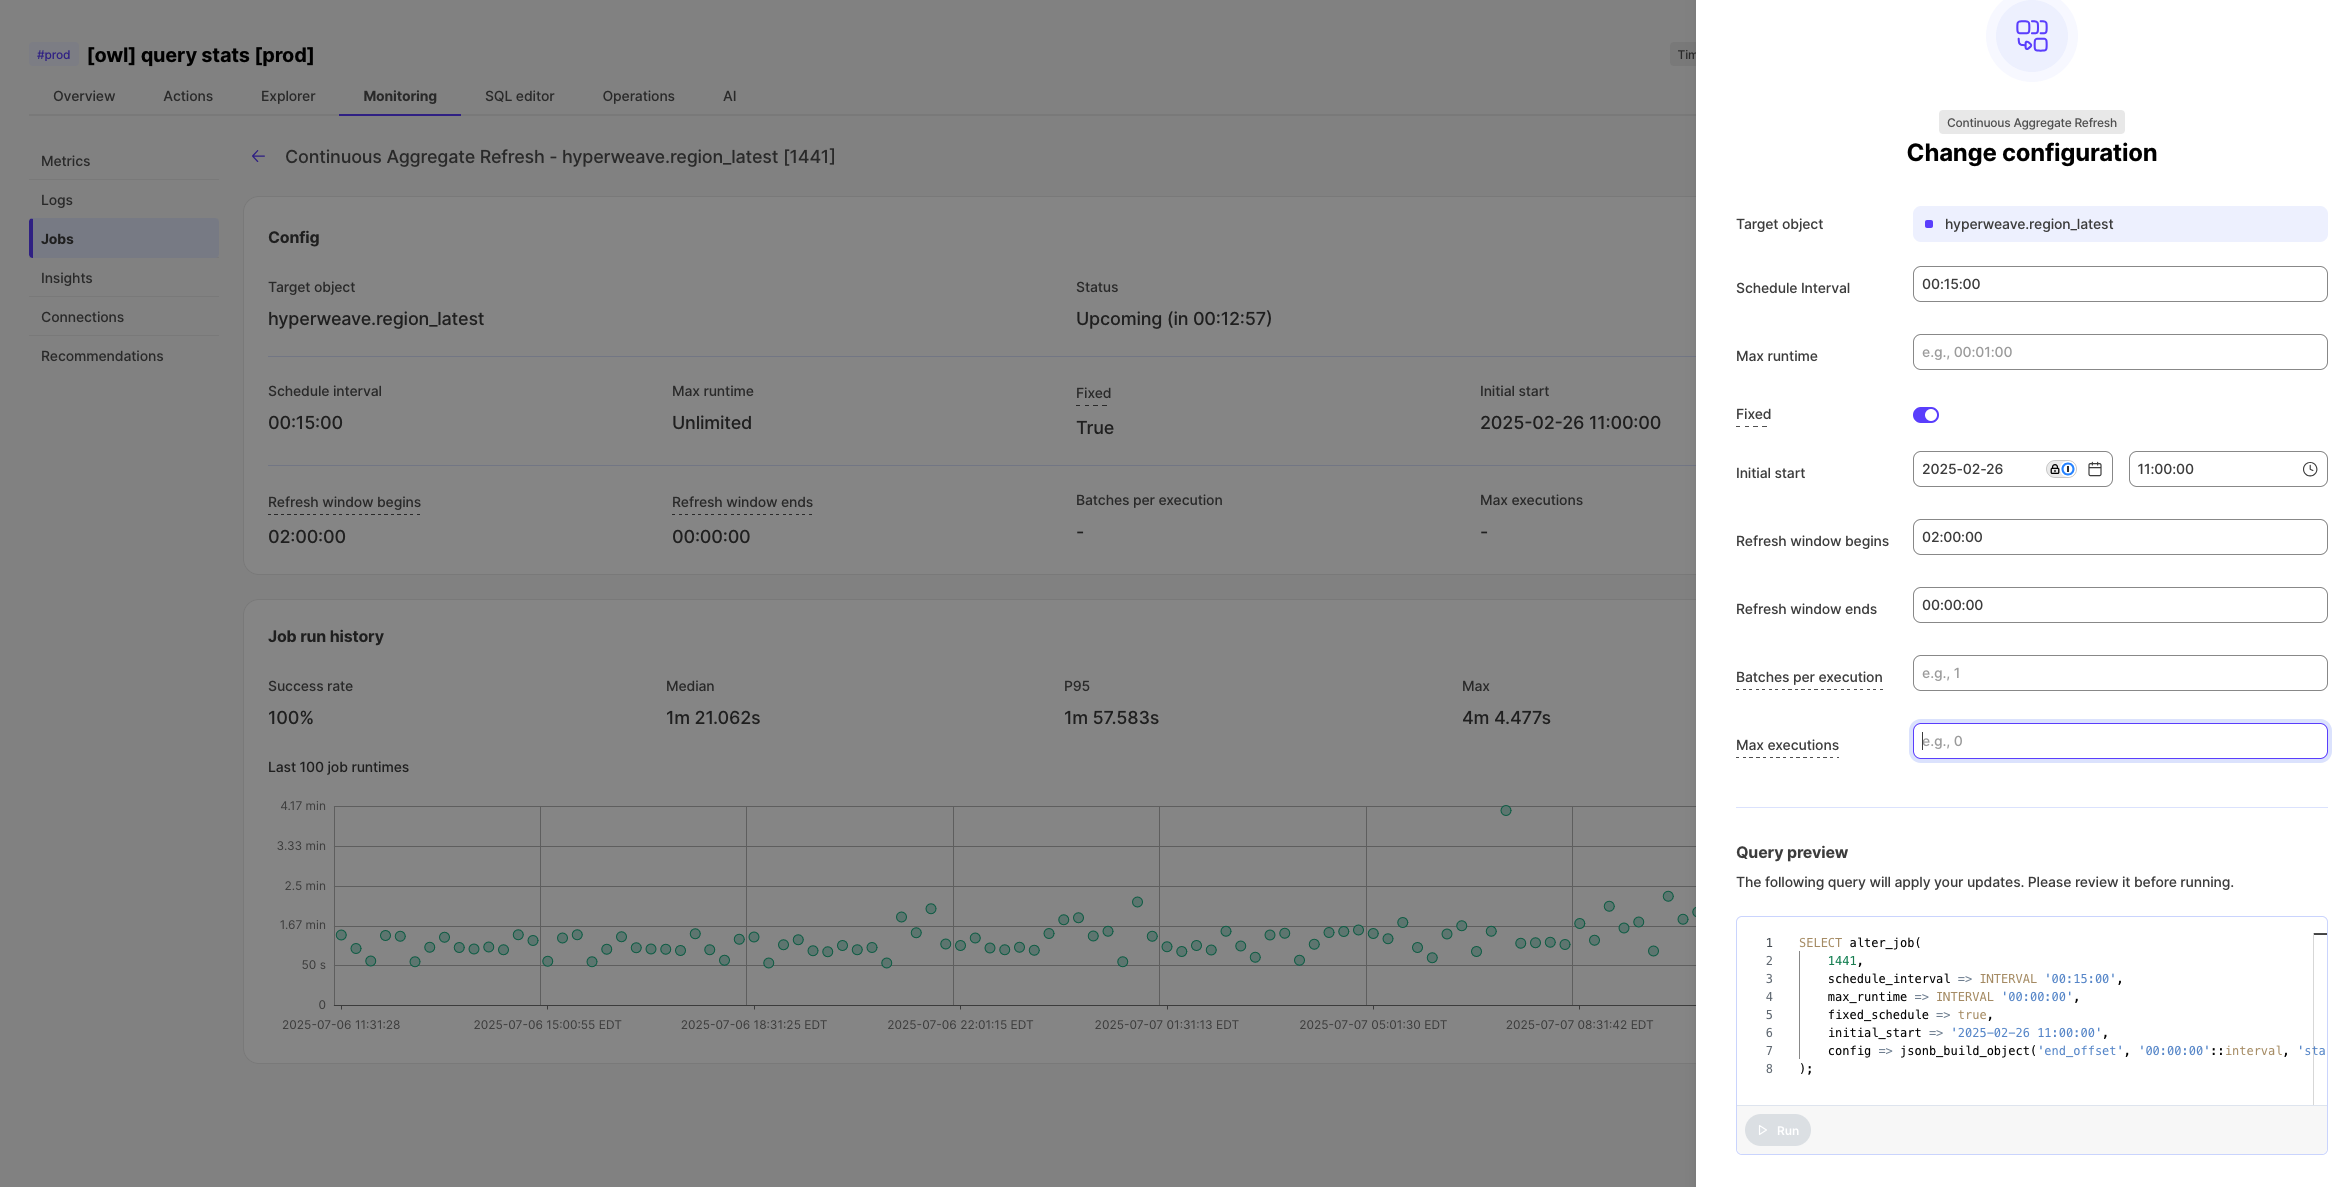
📊 Connection history
Now you can see your historical connection counts right in the Connections tab! This helps spot those pesky connection management bugs before they impact your app. We're logging max connections every hour (sampled every 5 mins) and might adjust based on your feedback. Just another way we're making the Console more powerful for troubleshooting.
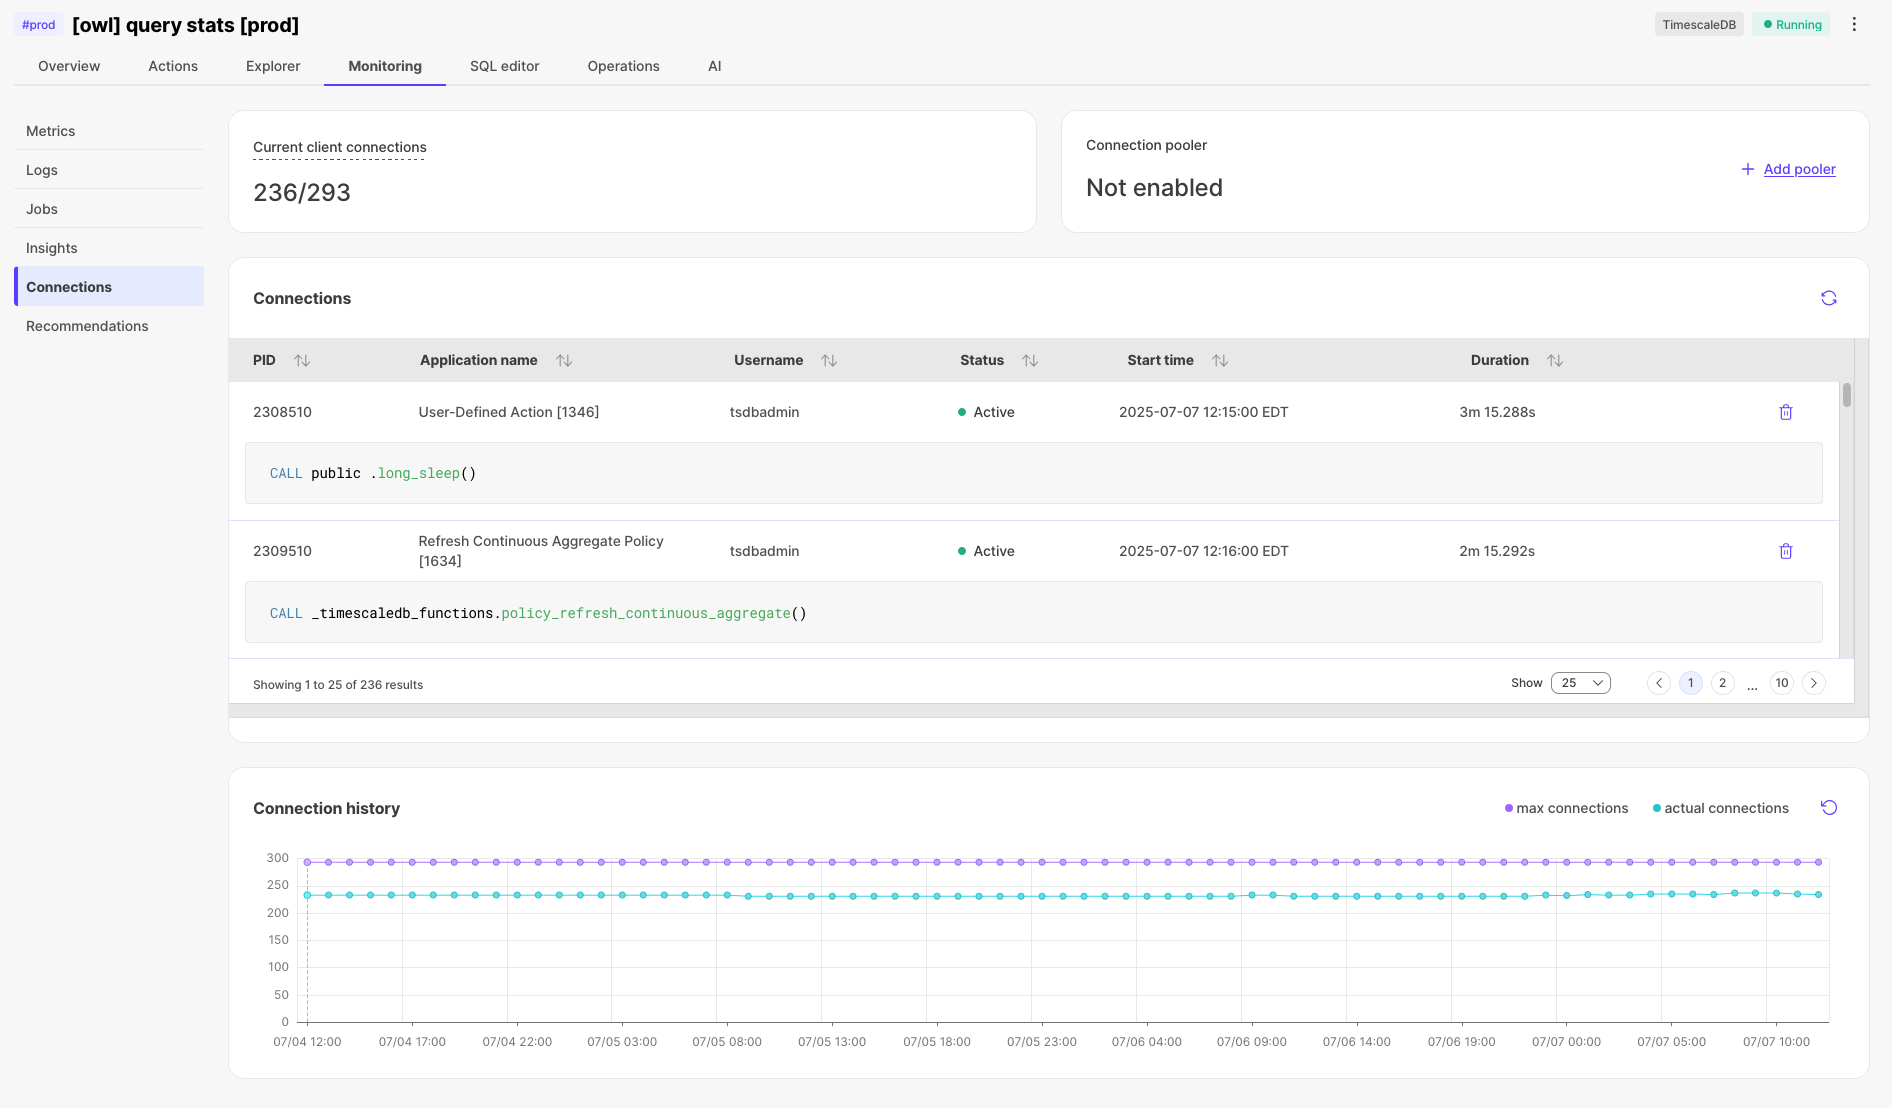
🔐 New in Public Beta: Read-Only Access through RBAC
We’ve just launched Read/Viewer-only access for Tiger Cloud projects into public beta!
You can now invite users with view-only permissions — perfect for folks who need to see dashboards, metrics, and query results, without the ability to make changes.
This has been one of our most requested RBAC features, and it's a big step forward in making Tiger Cloud more secure and collaborative.
No write access. No config changes. Just visibility.
In Console, Go to Project Settings > Users & Roles to try it out, and let us know what you think!
👀 Super useful doc updates
July 4, 2025
Updates to instructions for livesync
In the Console UI, we have clarified the step-by-step procedure for setting up your livesync from self-hosted installations by:
- Adding definitions for some flags when running your Docker container.
- Including more detailed examples of the output from the table synchronization list.
New optional argument for add_continuous_aggregate_policy API
Added the new refresh_newest_first optional argument that controls the order of incremental refreshes.
🚀 Multi-command queries in SQL editor, improved job page experience, multiple AWS Transit Gateways, and a new service creation flow
June 20, 2025
Run multiple statements in SQL editor
Execute complex queries with multiple commands in a single run—perfect for data transformations, table setup, and batch operations.
Branch conversations in SQL assistant
Start new discussion threads from any point in your SQL assistant chat to explore different approaches to your data questions more easily.
Smarter results table
- Expand JSON data instantly: turn complex JSON objects into readable columns with one click—no more digging through nested data structures.
- Filter with precision: use a new smart filter to pick exactly what you want from a dropdown of all available values.
Jobs page improvements
Individual job pages now display their corresponding configuration for TimescaleDB job types—for example, columnstore, retention, CAgg refreshes, tiering, and others.
Multiple AWS Transit Gateways
You can now connect multiple AWS Transit Gateways, when those gateways use overlapping CIDRs. Ideal for teams with zero-trust policies, this lets you keep each network path isolated.
How it works: when you create a new peering connection, Tiger Cloud reuses the existing Transit Gateway if you supply the same ID—otherwise it automatically creates a new, isolated Transit Gateway.
Updated service creation flow
The new service creation flow makes the choice of service type clearer. You can now create distinct types with Postgres extensions for real-time analytics (TimescaleDB), AI (pgvectorscale, pgai), and RTA/AI hybrid applications.
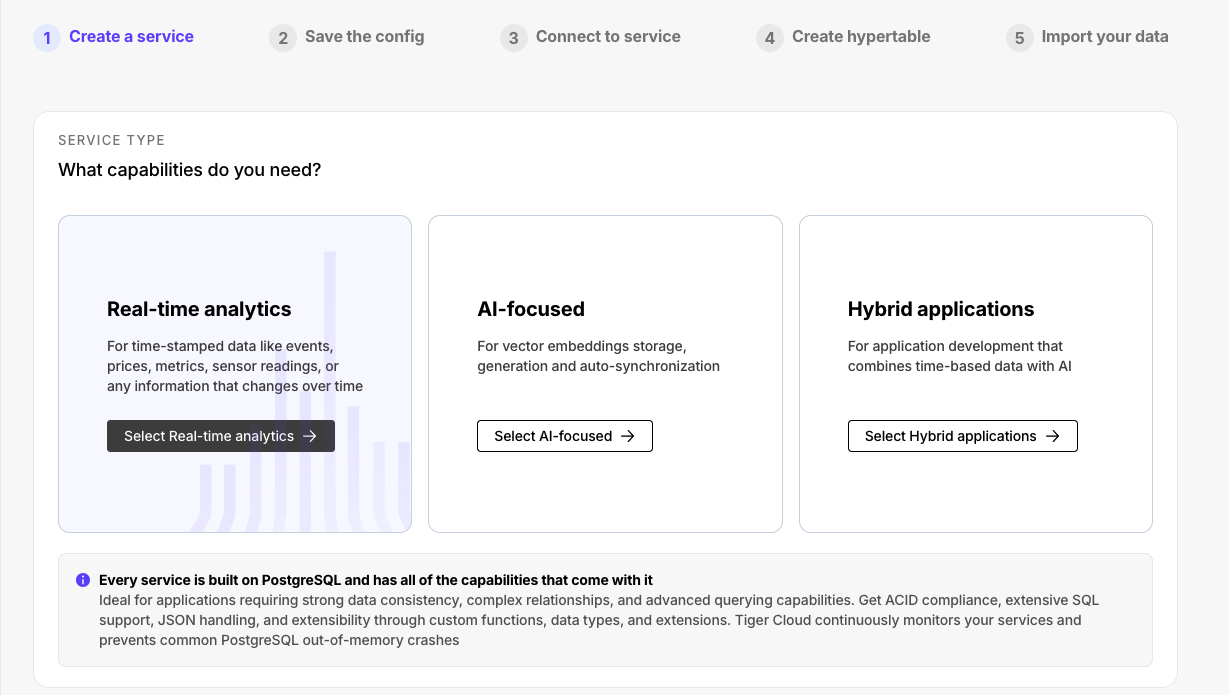
⚙️ Improved Terraform support and TimescaleDB v2.20.3
June 13, 2025
Terraform support for Exporters and AWS Transit Gateway
The latest version of the Timescale Terraform provider (2.3.0) adds support for:
- Creating and attaching observability exporters to your services.
- Securing the connections to your Timescale Cloud services with AWS Transit Gateway.
- Configuring CIDRs for VPC and AWS Transit Gateway connections.
Check the Timescale Terraform provider documentation for more details.
TimescaleDB v2.20.3
This patch release for TimescaleDB v2.20 includes several bug fixes and minor improvements. Notable bug fixes include:
- Adjustments to SkipScan costing for queries that require a full scan of indexed data.
- A fix for issues encountered during dump and restore operations when chunk skipping is enabled.
- Resolution of a bug related to dropped "quals" (qualifications/conditions) in SkipScan.
For a comprehensive list of changes, refer to the TimescaleDB 2.20.3 release notes.
🧘 Read replica sets, faster tables, new anthropic models, and VPC support in data mode
June 6, 2025
Horizontal read scaling with read replica sets
Read replica sets are an improved version of read replicas. They let you scale reads horizontally by creating up to 10 replica nodes behind a single read endpoint. Just point your read queries to the endpoint and configure the number of replicas you need without changing your application logic. You can increase or decrease the number of replicas in the set dynamically, with no impact on the endpoint.
Read replica sets are used to:
- Scale reads for read-heavy workloads and dashboards.
- Isolate internal analytics and reporting from customer-facing applications.
- Provide high availability and fault tolerance for read traffic.
All existing read replicas have been automatically upgraded to a replica set with one node—no action required. Billing remains the same.
Read replica sets are available for all Scale and Enterprise customers.
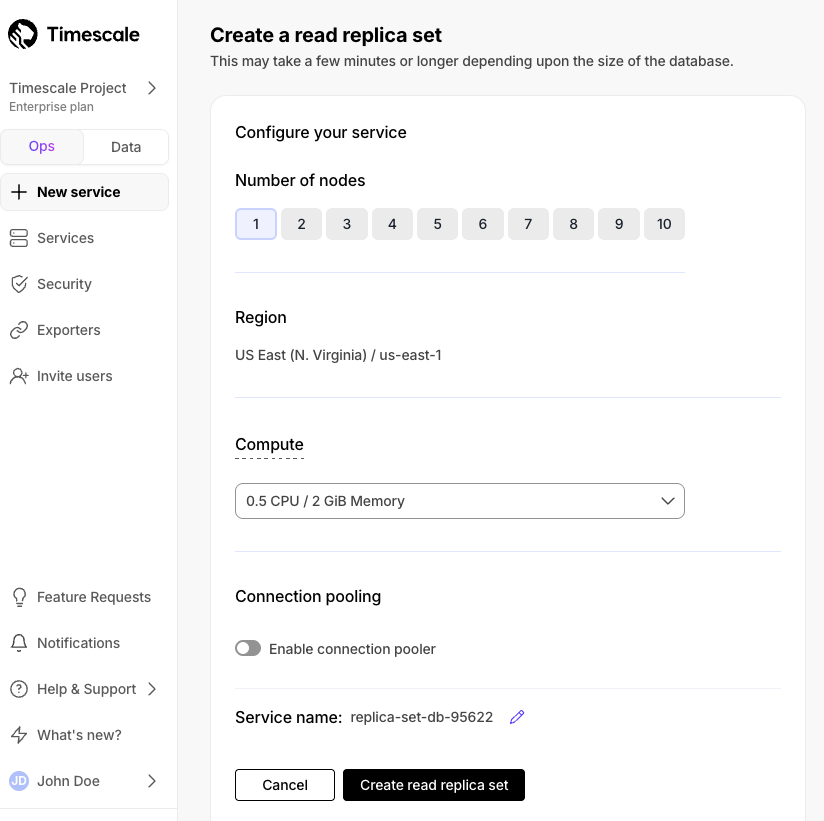
Faster, smarter results tables in data mode
We've completely rebuilt how query results are displayed in the data mode to give you a faster, more powerful way to work with your data. The new results table can handle millions of rows with smooth scrolling and instant responses when you sort, filter, or format your data. You'll find it today in notebooks and presentation pages, with more areas coming soon.
What's new:
- Your settings stick around: when you customize how your table looks—applying filters, sorting columns, or formatting data—those settings are automatically saved. Switch to another tab and come back, and everything stays exactly how you left it.
- Better ways to find what you need: filter your results by any column value, with search terms highlighted so you can quickly spot what you're looking for. The search box is now available everywhere you work with data.
- Export exactly what you want: download your entire table or just select the specific rows and columns you need. Both CSV and Excel formats are supported.
- See patterns in your data: highlight cells based on their values to quickly spot trends, outliers, or important thresholds in your results.
- Smoother navigation: click any row number to see the full details in an expanded view. Columns automatically resize to show your data clearly, and web links in your results are now clickable.
As a result, working with large datasets is now faster and more intuitive. Whether you're exploring millions of rows or sharing results with your team, the new table keeps up with how you actually work with data.
Latest anthropic models added to SQL assistant
Data mode's SQL assistant now supports Anthropic's latest models:
- Sonnet 4
- Sonnet 4 (extended thinking)
- Opus 4
- Opus 4 (extended thinking)
VPC support for passwordless data mode connections
We previously made it much easier to connect newly created services to Timescale’s data mode. We have now expanded this functionality to services using a VPC.
🕵🏻️ Enhanced service monitoring, TimescaleDB v2.20, and livesync for Postgres
May 30, 2025
Updated top-level navigation - Monitoring tab
In Timescale Console, we have consolidated multiple top-level service information tabs into the single Monitoring tab.
This tab houses information previously displayed in the Recommendations, Jobs, Connections, Metrics, Logs,
and Insights tabs.
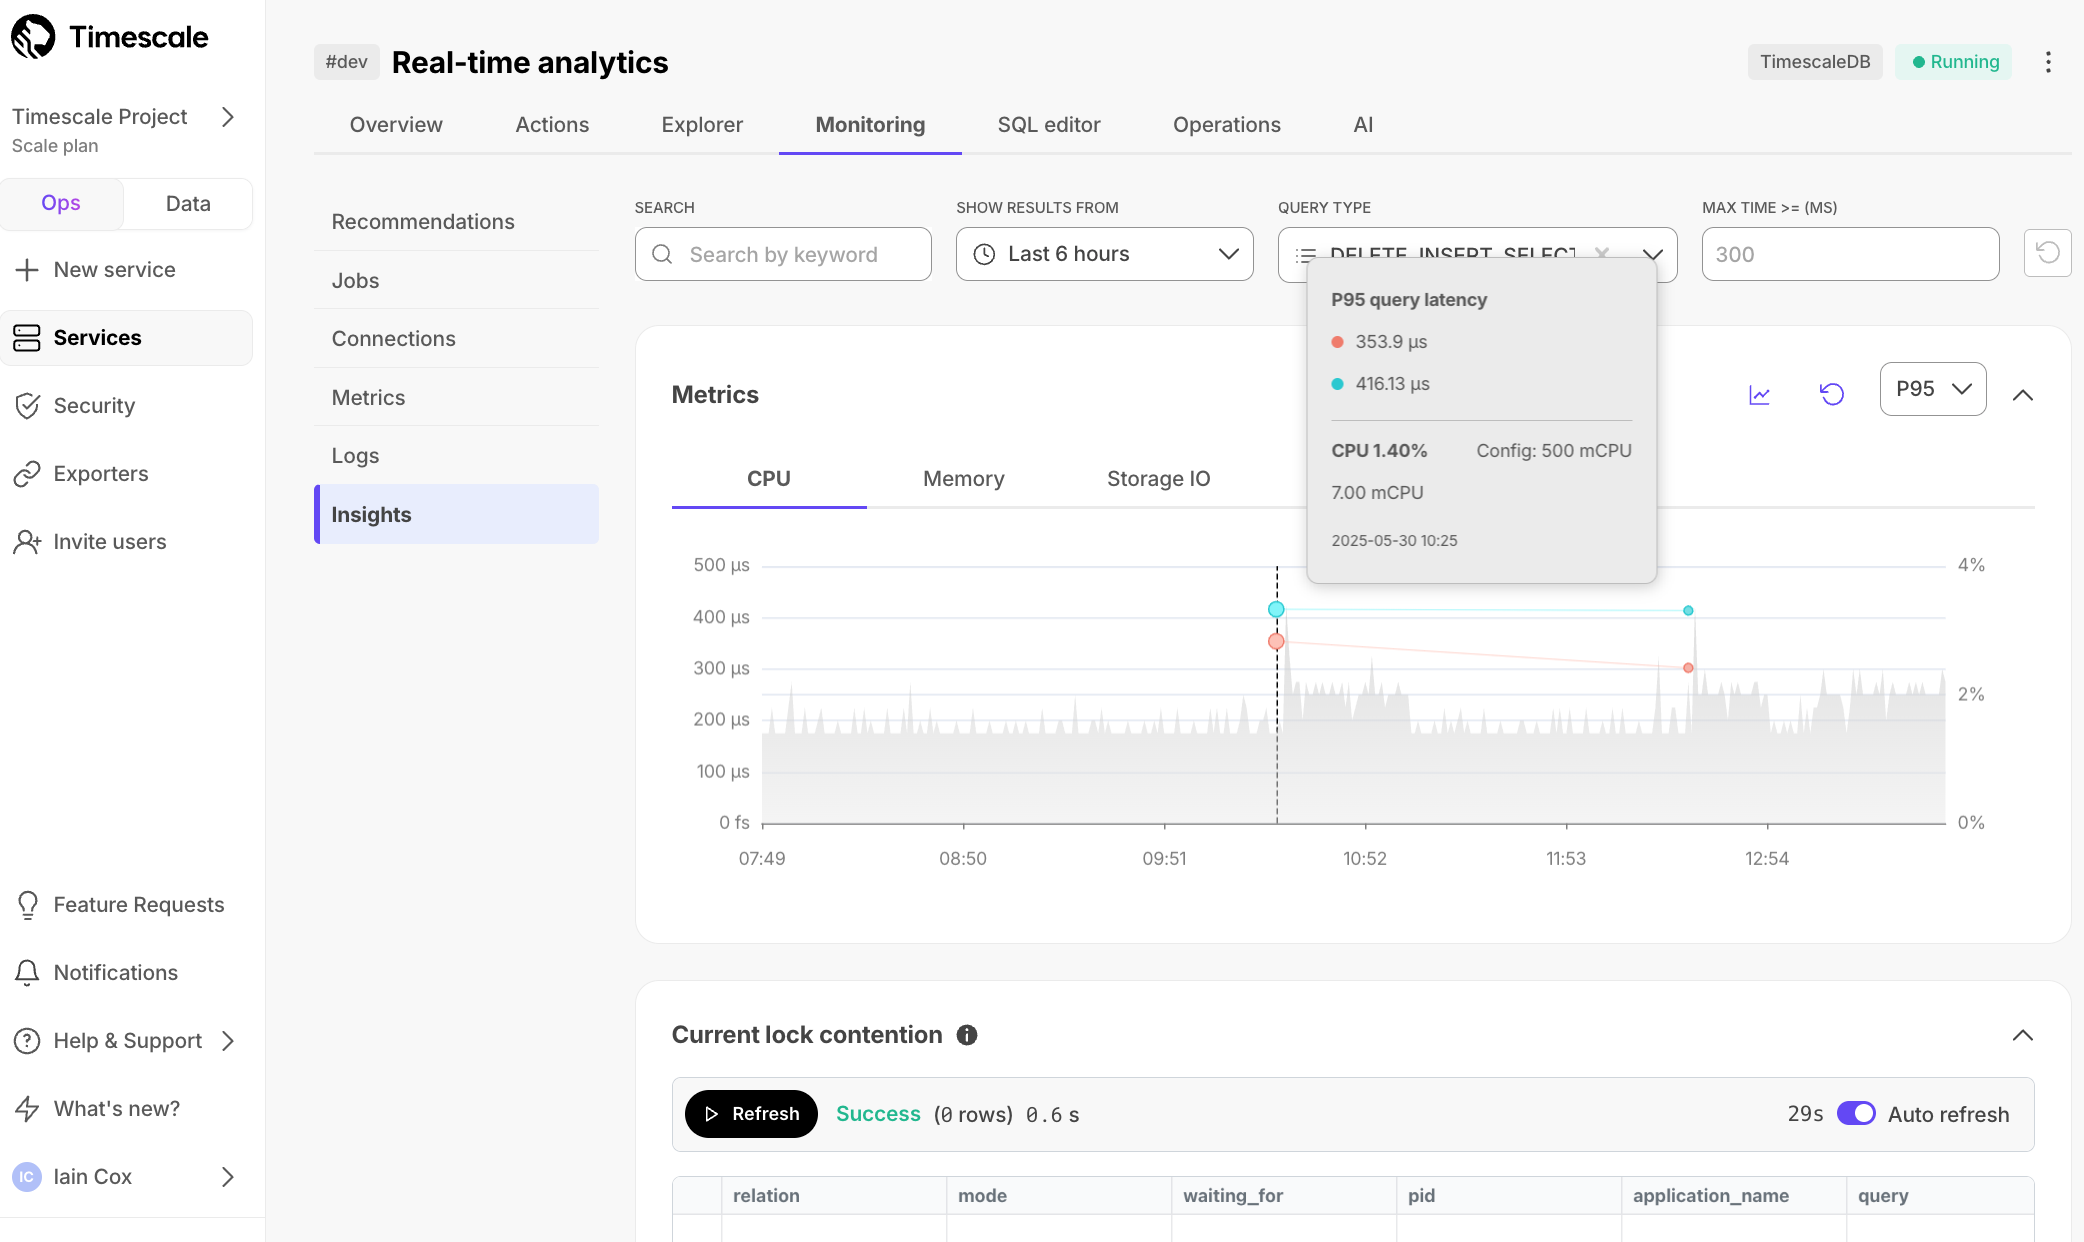
Monitor active connections
In the Connections section under Monitoring, you can now see information like the query being run, the application
name, and duration for all current connections to a service.
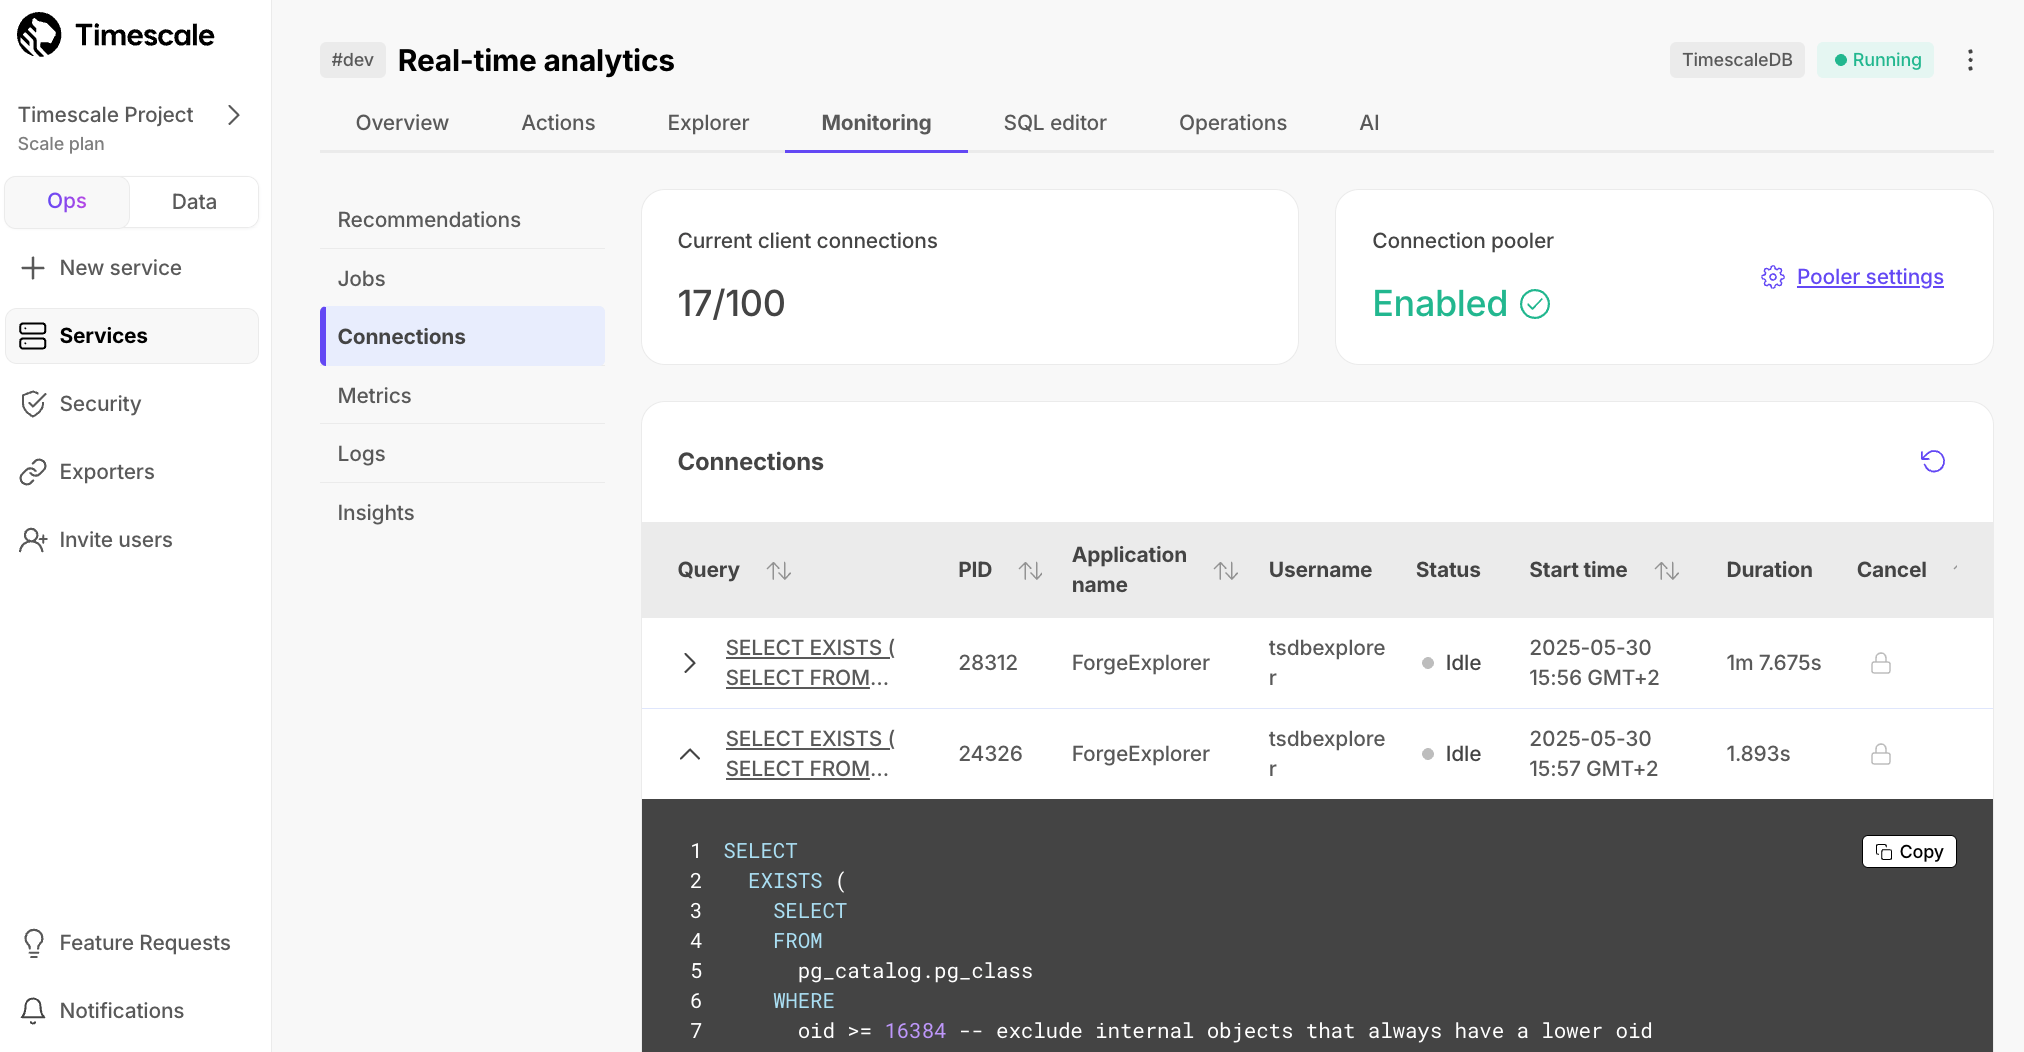
The information in Connections enables you to debug misconfigured applications, or
cancel problematic queries to free up other connections to your database.
TimescaleDB v2.20 - query performance and faster data updates
All new services created on Timescale Cloud are created using TimescaleDB v2.20. Existing services will be automatically upgraded during their maintenance window.
Highlighted features in TimescaleDB v2.20 include:
- Efficiently handle data updates and upserts (including backfills, that are now up to 10x faster).
- Up to 6x faster point queries on high-cardinality columns using new bloom filters.
- Up to 2500x faster DISTINCT operations with SkipScan, perfect for quickly getting a unique list or the latest reading from any device, event, or transaction.
- 8x more efficient Boolean column storage with vectorized processing, resulting in 30-45% faster queries.
- Enhanced developer flexibility with continuous aggregates now supporting window and mutable functions, plus customizable refresh orders.
Postgres 13 and 14 deprecated on Tiger Cloud
TimescaleDB version 2.20 is not compatible with Postgres versions v14 and below. TimescaleDB 2.19.3 is the last bug-fix release for Postgres 14. Future fixes are for Postgres 15+ only. To continue receiving critical fixes and security patches, and to take advantage of the latest TimescaleDB features, you must upgrade to Postgres 15 or newer. This deprecation affects all Tiger Cloud services currently running Postgres 13 or Postgres 14.
The timeline for the Postgres 13 and 14 deprecation is as follows:
- Deprecation notice period begins: starting in early June 2025, you will receive email communication.
- Customer self-service upgrade window: June 2025 through September 14, 2025. We strongly encourage you to manually upgrade Postgres during this period.
- Automatic upgrade deadline: your service will be automatically upgraded from September 15, 2025.
Enhancements to livesync for Postgres
You now can:
- Edit a running livesync to add and drop tables from an existing configuration:
- For existing tables, Timescale Console stops the livesync while keeping the target table intact.
- Newly added tables sync their existing data and transition into the Change Data Capture (CDC) state.
- Create multiple livesync instances for Postgres per service. This is an upgrade from our initial launch which limited users to one LiveSync per service.
This enables you to sync data from multiple Postgres source databases into a single Timescale Cloud service.
- No more hassle looking up schema and table names for livesync configuration from the source. Starting today, all schema and table names are available in a dropdown menu for seamless source table selection.
➕ More storage types and IOPS
May 22, 2025
🚀 Enhanced storage: scale to 64 TB and 32,000 IOPS
We're excited to introduce enhanced storage, a new storage type in Timescale Cloud that significantly boosts both capacity and performance. Designed for customers with mission-critical workloads.
With enhanced storage, Timescale Cloud now supports:
- Up to 64 TB of storage per Timescale Cloud service (4x increase from the previous limit)
- Up to 32,000 IOPS, enabling high-throughput ingest and low-latency queries
Powered by AWS io2 volumes, enhanced storage gives your workloads the headroom they need—whether you're building financial data pipelines, developing IoT platforms, or processing billions of rows of telemetry. No more worrying about storage ceilings or IOPS bottlenecks.
Enable enhanced storage in Timescale Console under Operations → Compute & Storage. Enhanced storage is currently available on the Enterprise pricing plan only. Learn more here.
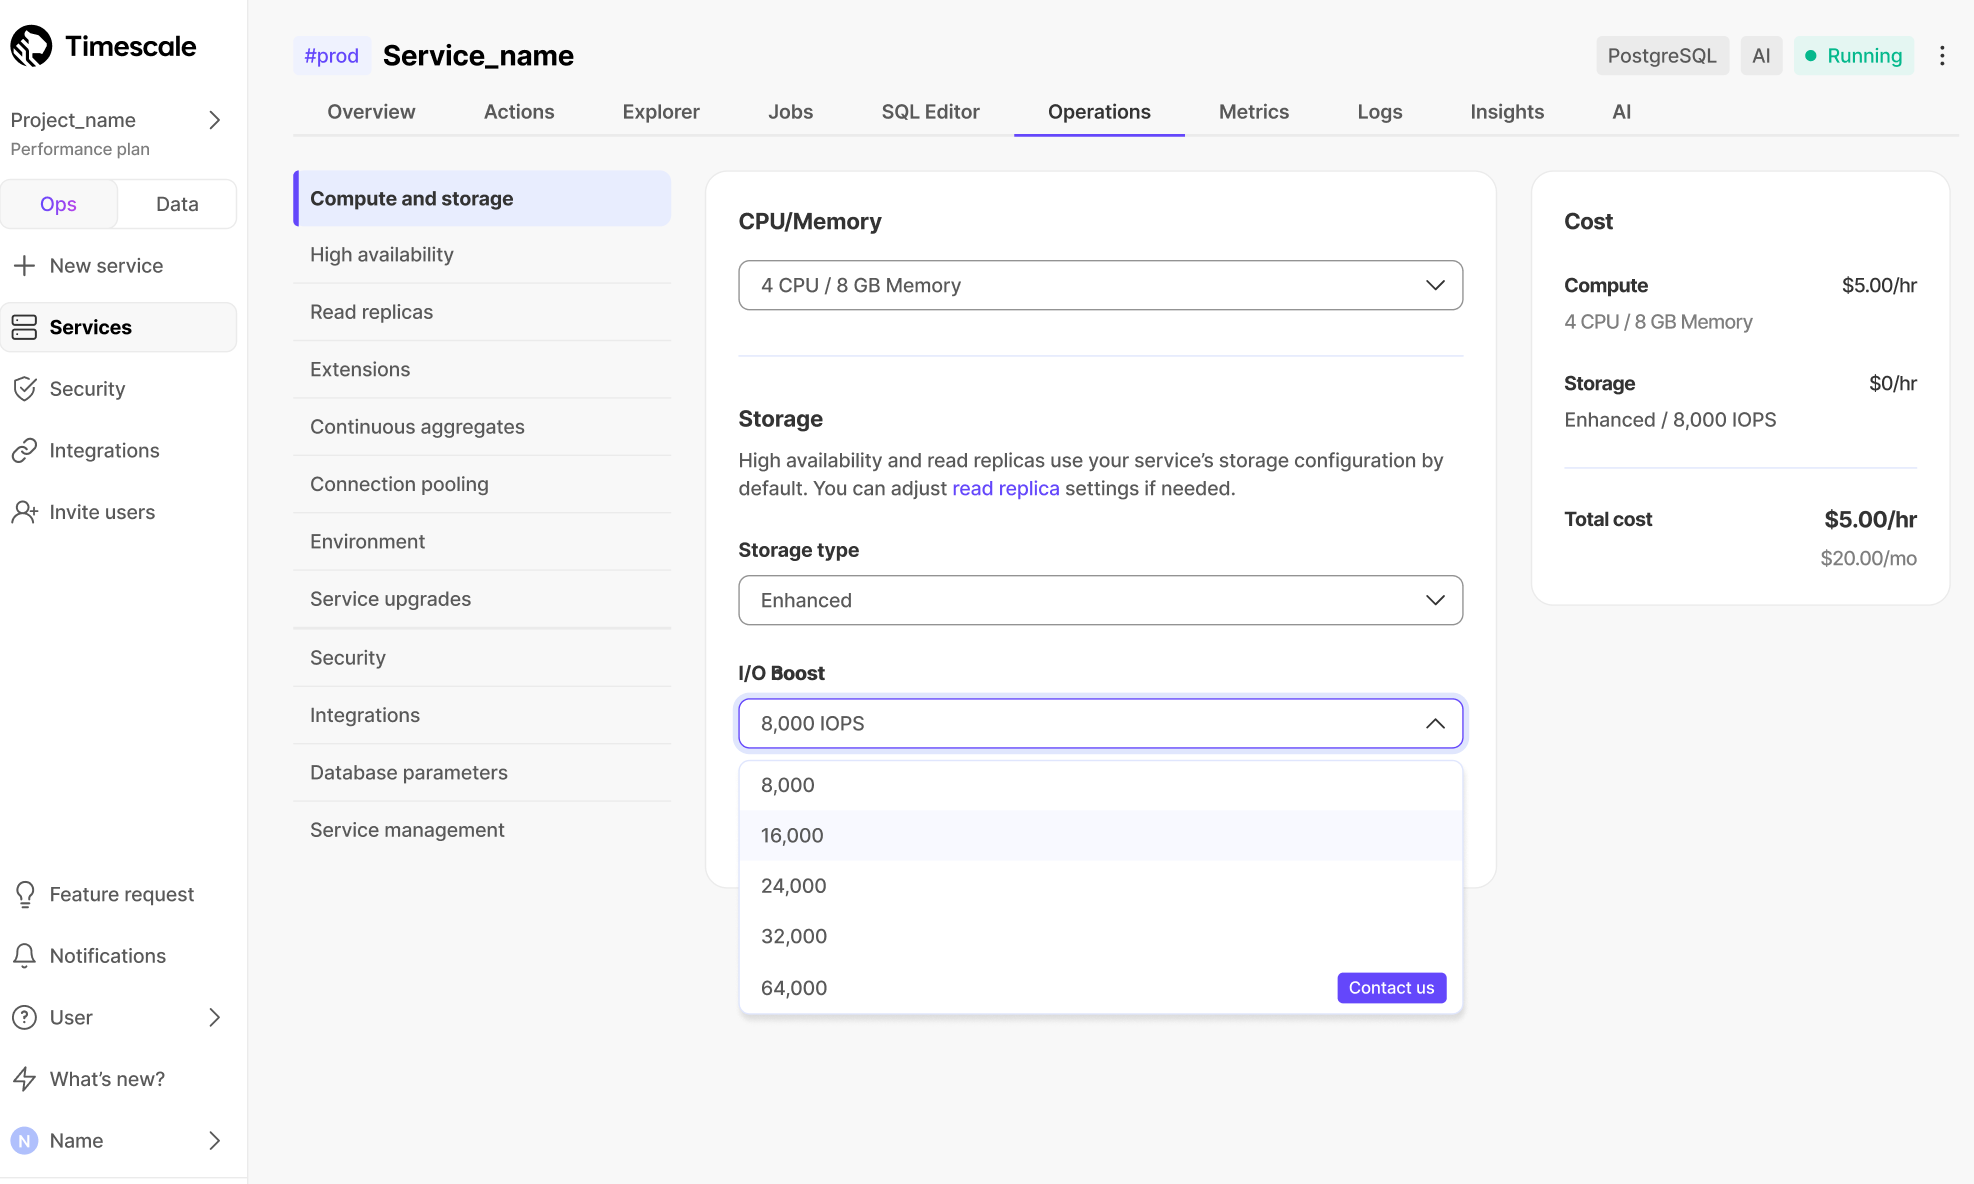
↔️ New export and import options
May 15, 2025
🔥 Ship TimescaleDB metrics to Prometheus
We’re excited to release the Prometheus Exporter for Timescale Cloud, making it easy to ship TimescaleDB metrics to your Prometheus instance. With the Prometheus Exporter, you can:
- Export TimescaleDB metrics like CPU, memory, and storage
- Visualize usage trends with your own Grafana dashboards
- Set alerts for high CPU load, low memory, or storage nearing capacity
To get started, create a Prometheus Exporter in the Timescale Console, attach it to your service, and configure Prometheus to scrape from the exposed URL. Metrics are secured with basic auth. Available on Scale and Enterprise plans. Learn more here.
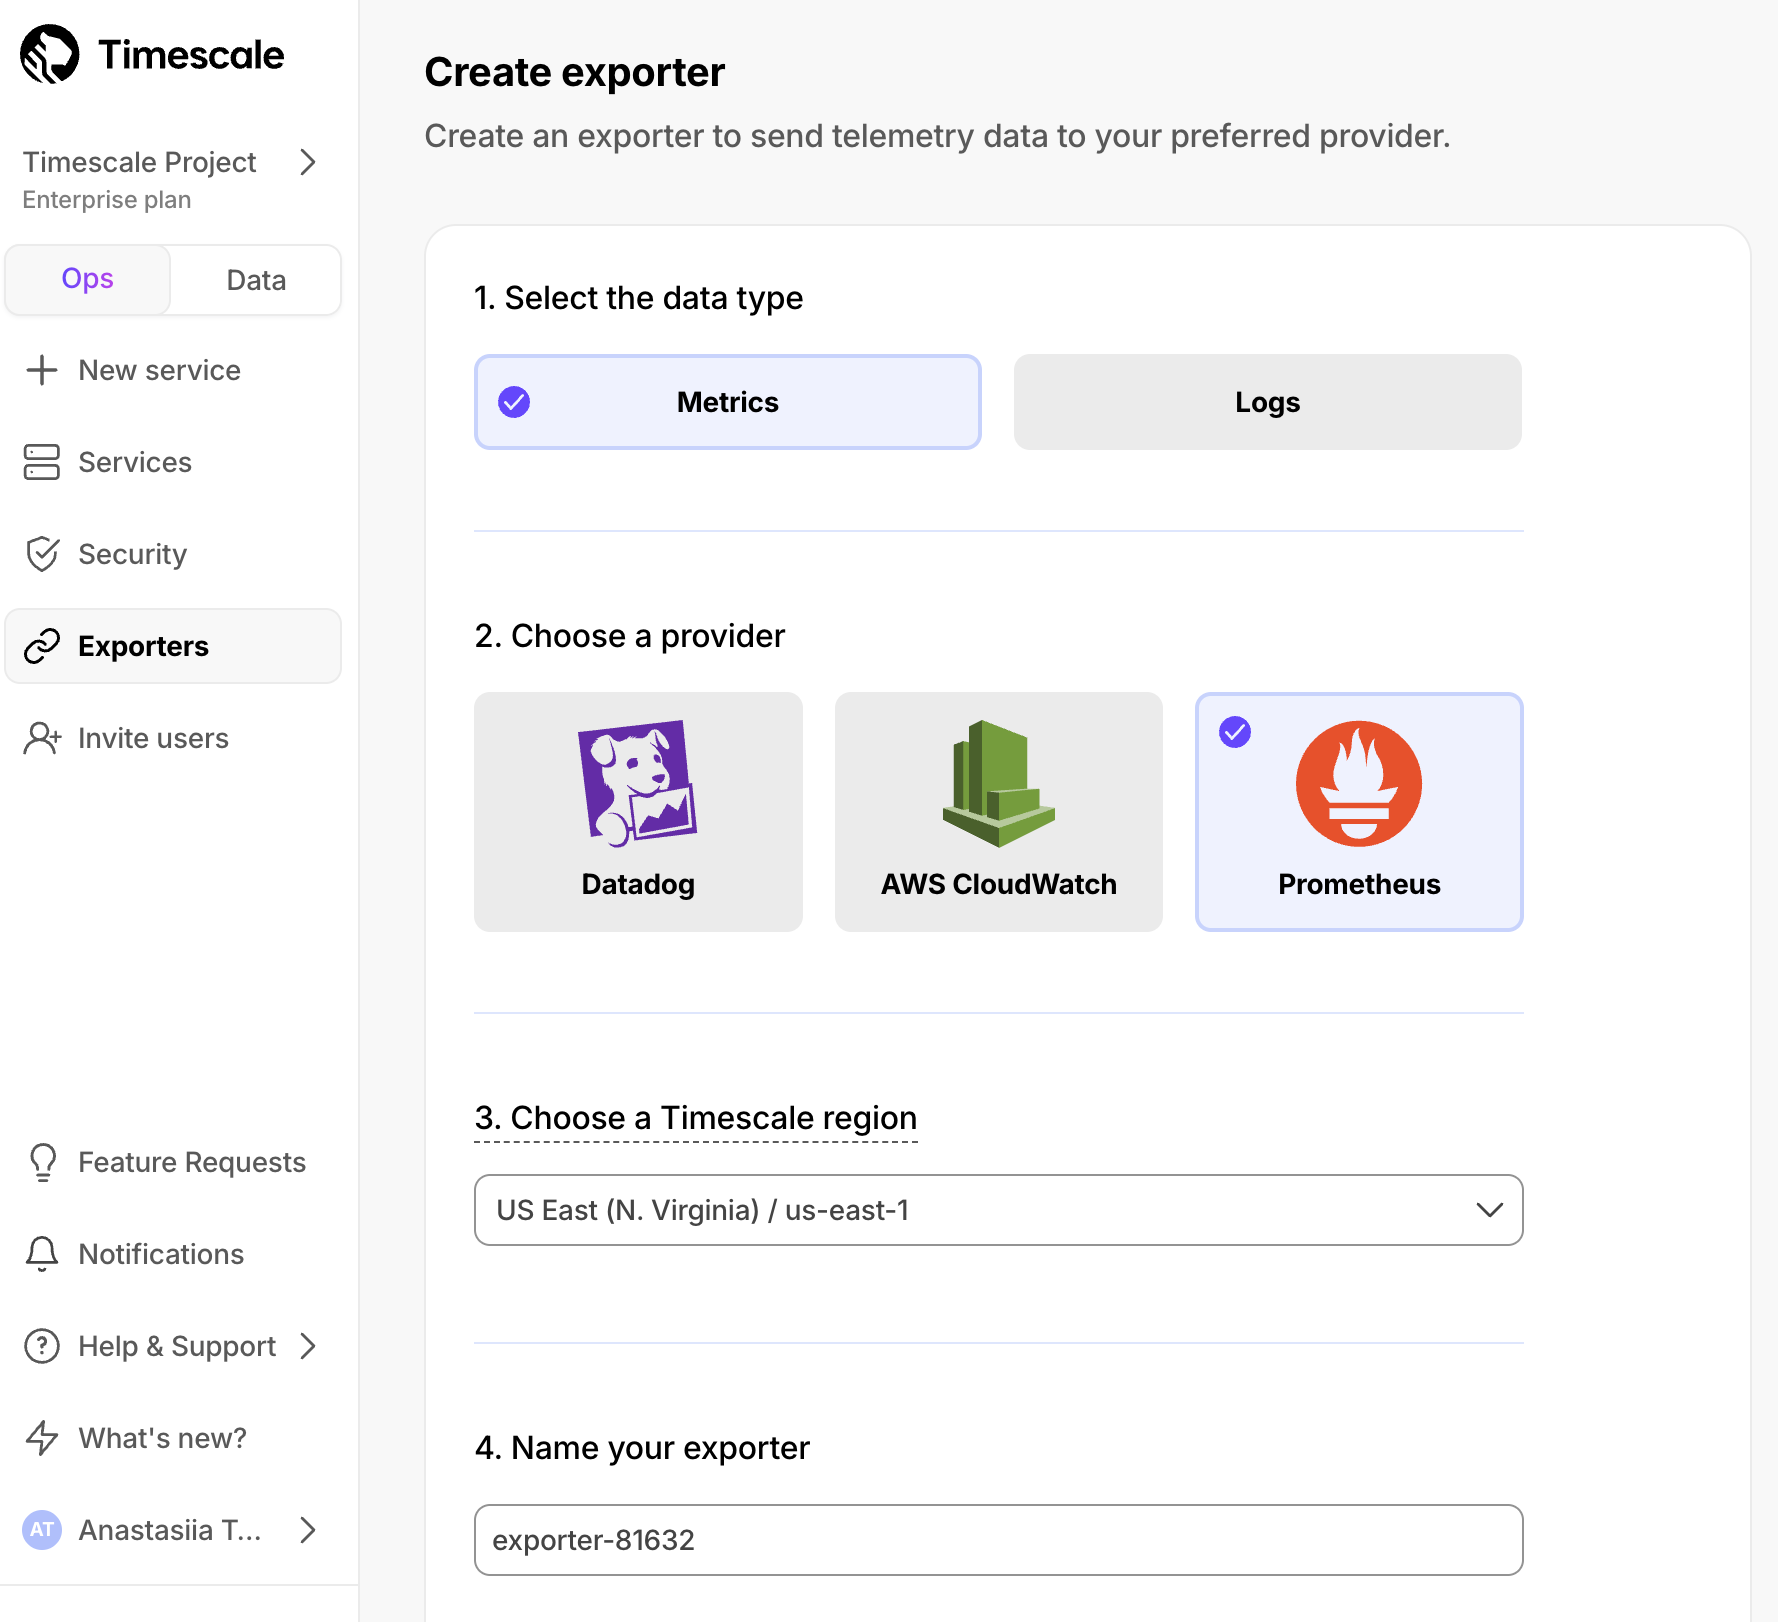
📥 Import text files into Postgres tables
Our import options in Timescale Console have expanded to include local text files. You can add the content of multiple text files (one file per row) into a Postgres table for use with Vectorizers while creating embeddings for evaluation and development. This new option is located in Service > Actions > Import Data.
🤖 Automatic document embeddings from S3 and a sample dataset for AI testing
May 09, 2025
Automatic document embeddings from S3
pgai vectorizer now supports automatic document vectorization. This makes it dramatically easier to build RAG and semantic search applications on top of unstructured data stored in Amazon S3. With just a SQL command, developers can create, update, and synchronize vector embeddings from a wide range of document formats—including PDFs, DOCX, XLSX, HTML, and more—without building or maintaining complex ETL pipelines.
Instead of juggling multiple systems and syncing metadata, vectorizer handles the entire process: downloading documents from S3, parsing them, chunking text, and generating vector embeddings stored right in Postgres using pgvector. As documents change, embeddings stay up-to-date automatically—keeping your Postgres database the single source of truth for both structured and semantic data.
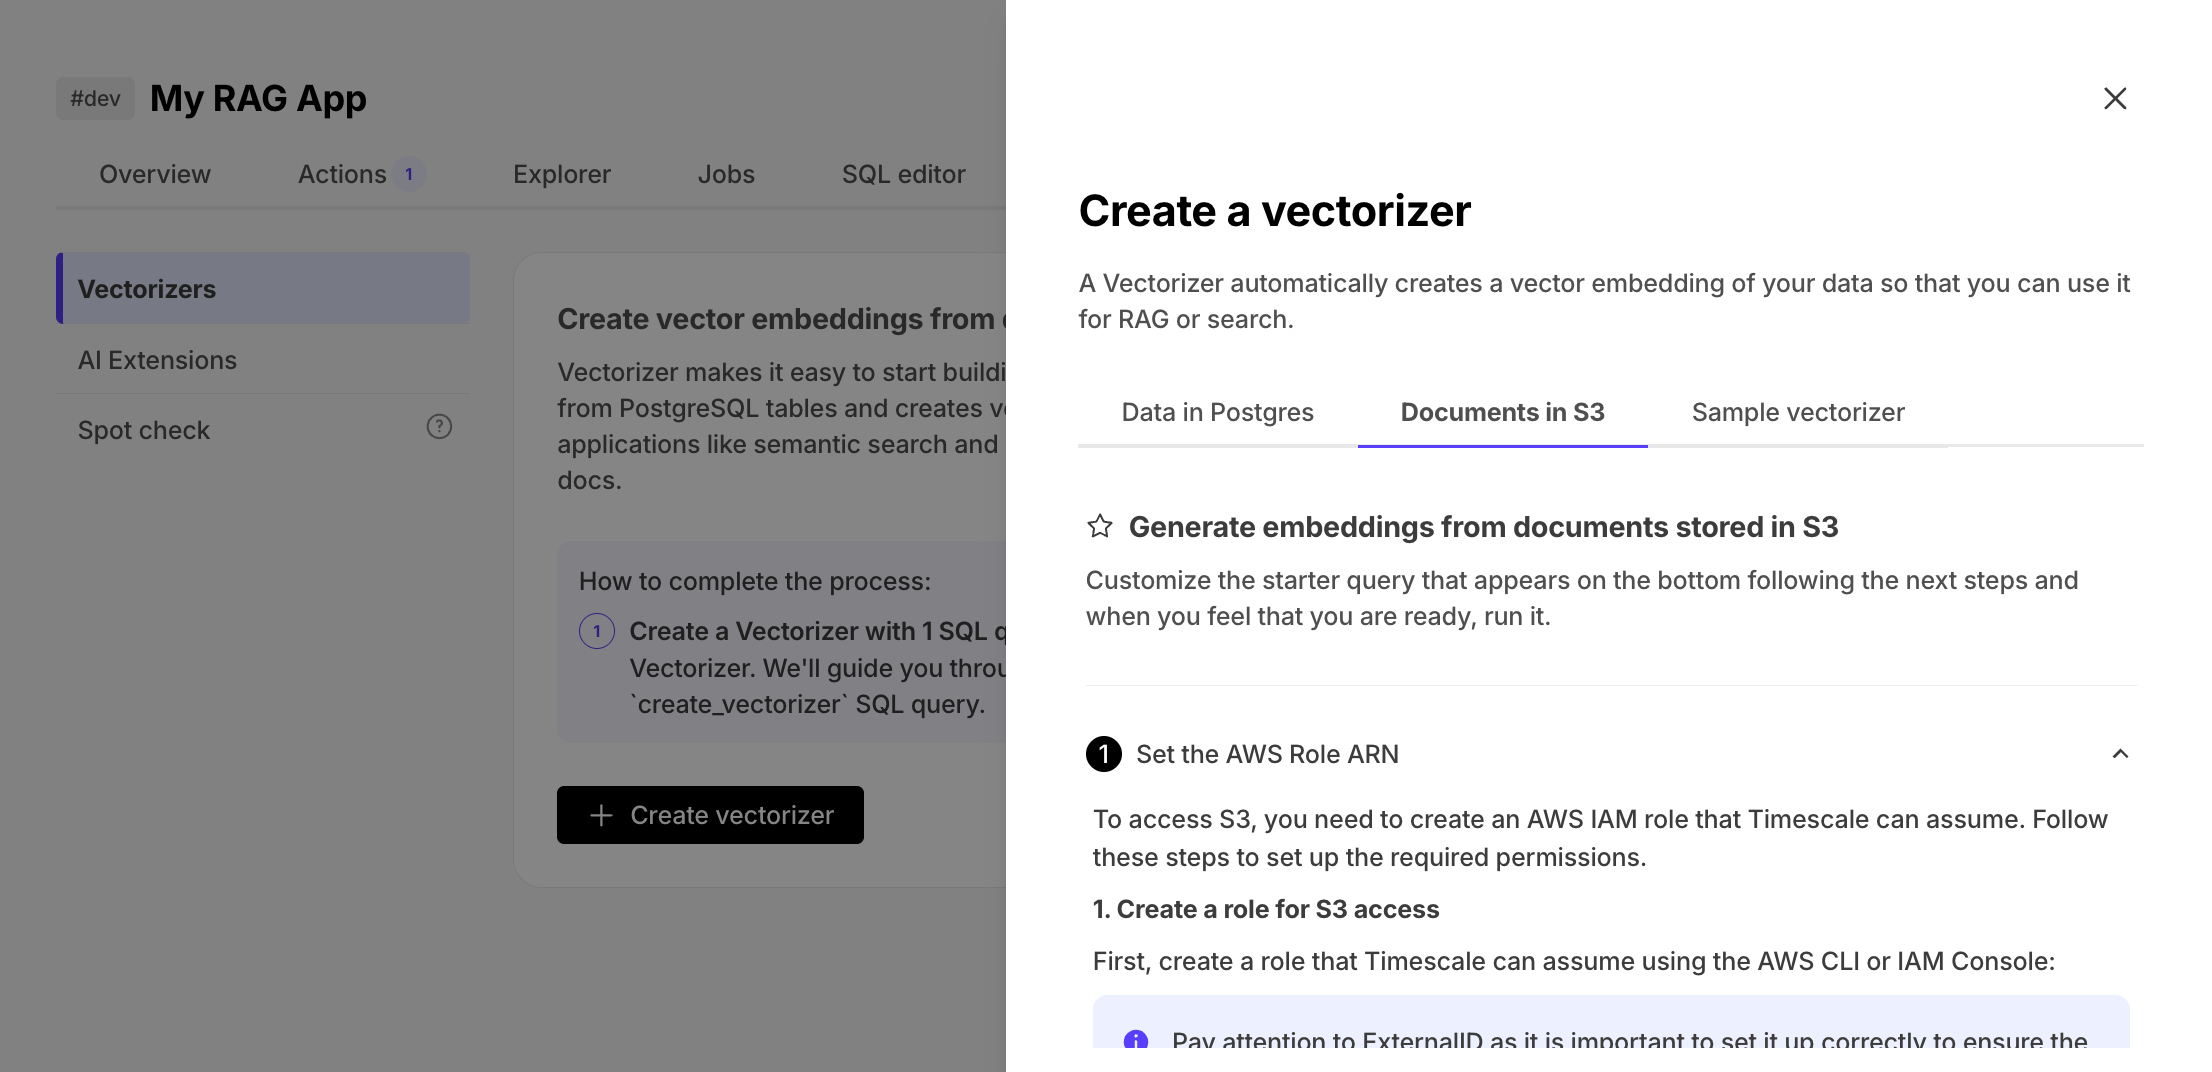
Sample dataset for AI testing
You can now import a dataset directly from Hugging Face using Timescale Console. This dataset is ideal for testing vectorizers, you find it in the Import Data page under the Service > Actions tab.
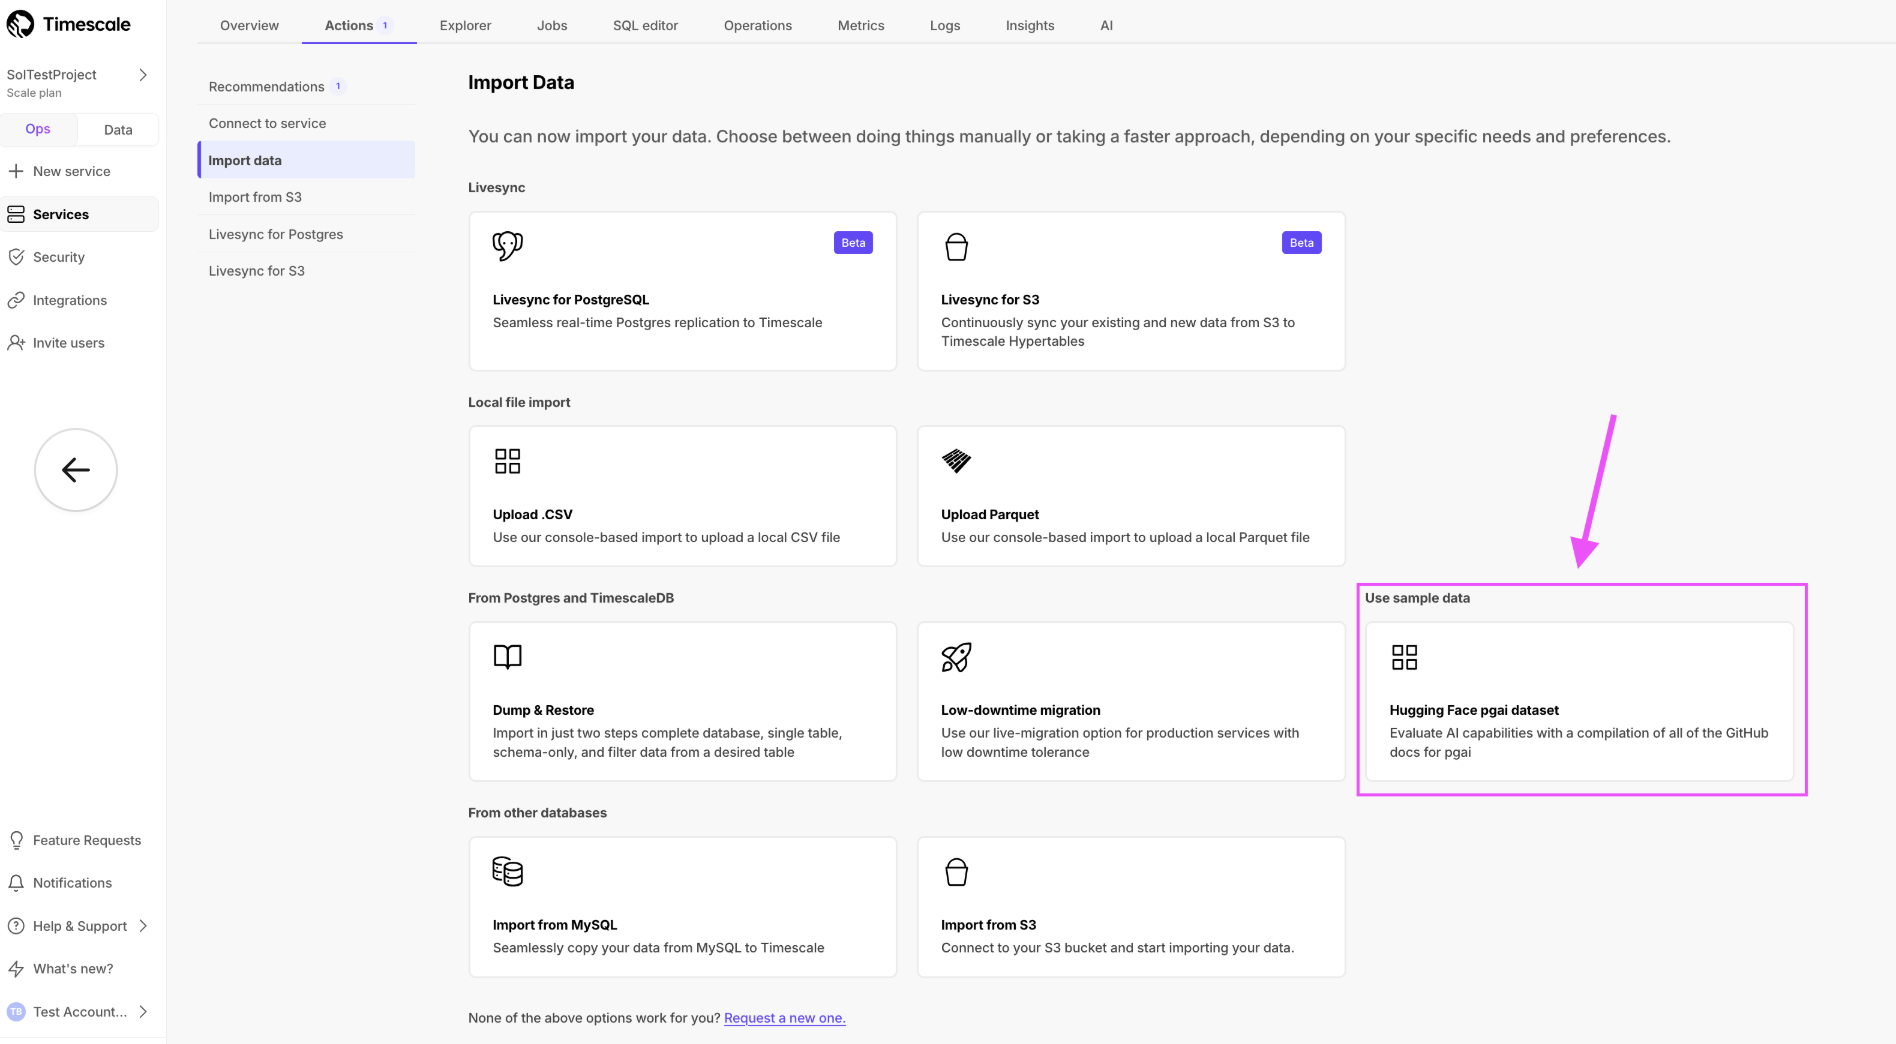
🔁 Livesync for S3 and passwordless connections for data mode
April 25, 2025
Livesync for S3 (beta)
Livesync for S3 is our second livesync offering in Timescale Console, following livesync for Postgres. This feature helps users sync data in their S3 buckets to a Timescale Cloud service, and simplifies data importing. Livesync handles both existing and new data in real time, automatically syncing everything into a Timescale Cloud service. Users can integrate Timescale Cloud alongside S3, where S3 stores data in raw form as the source for multiple destinations.

With livesync, users can connect Timescale Cloud with S3 in minutes, rather than spending days setting up and maintaining an ingestion layer.
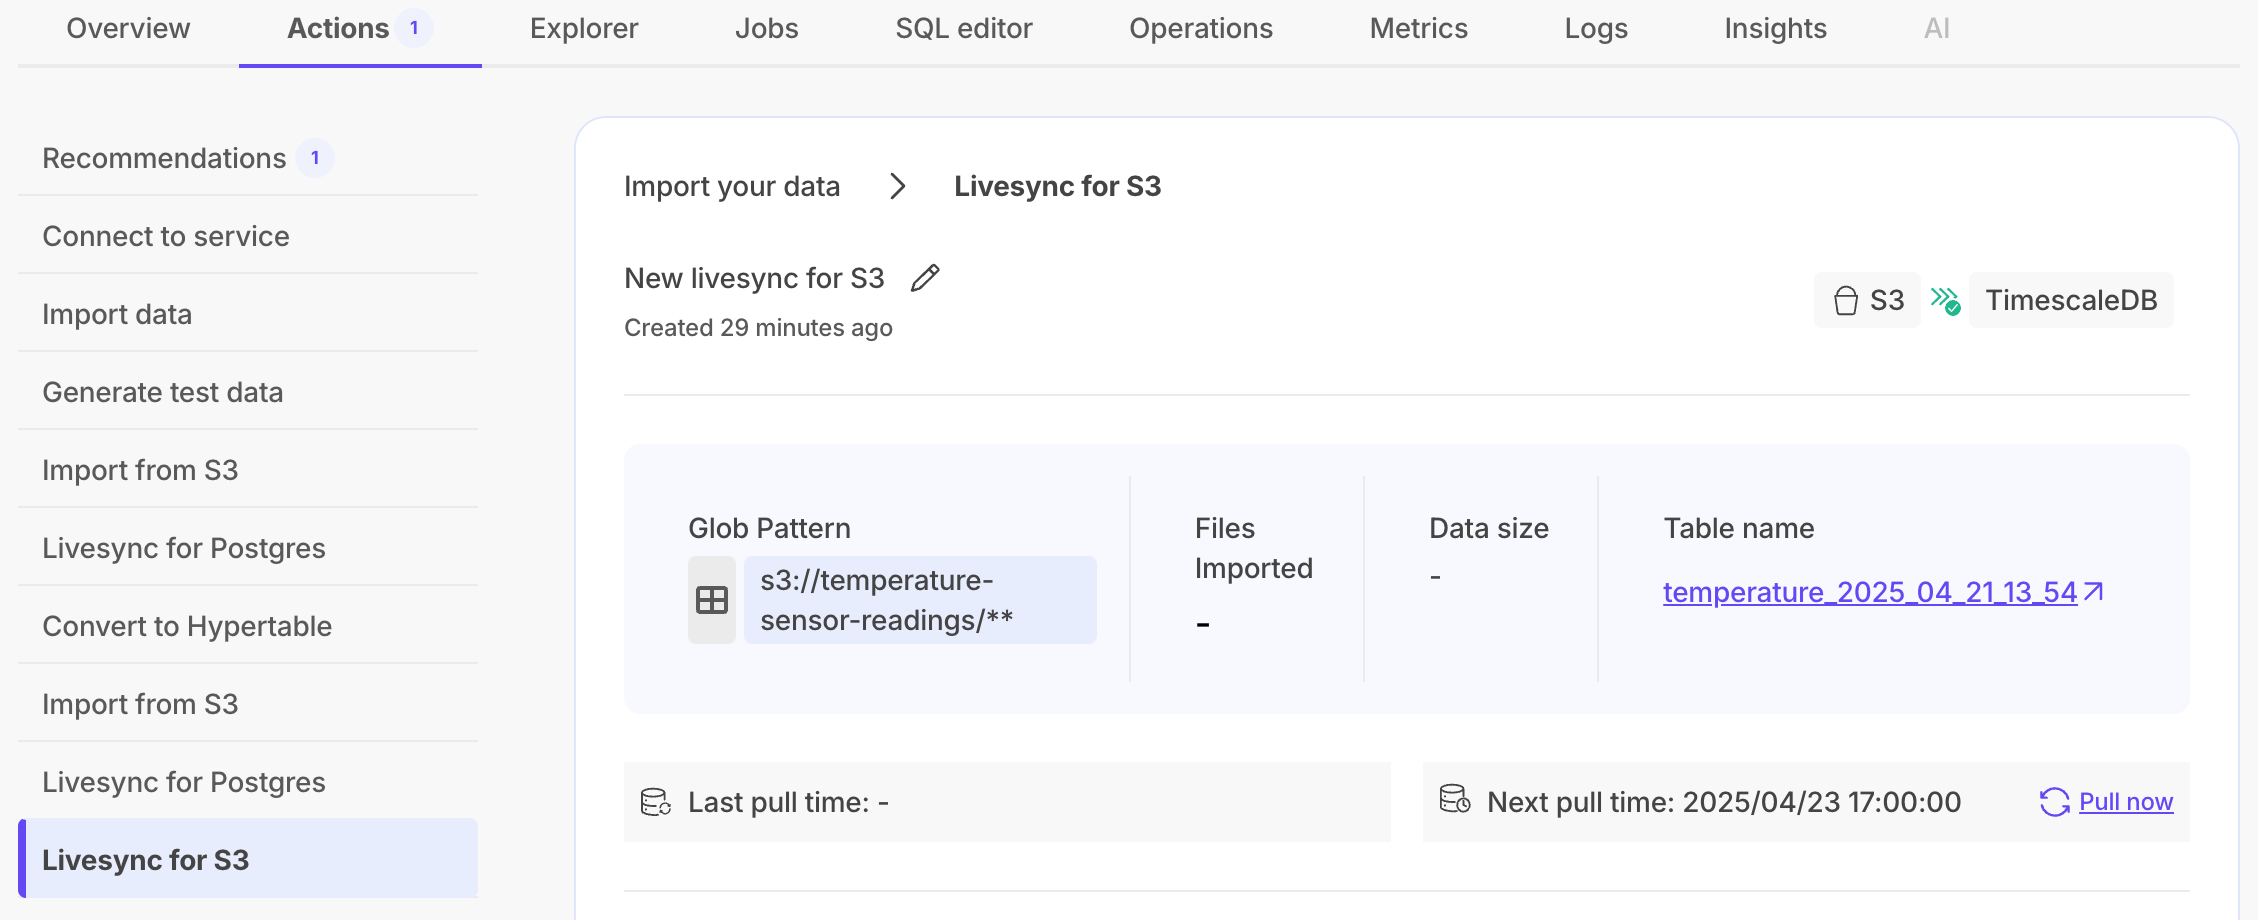
UX improvements to livesync for Postgres
In livesync for Postgres, getting started
requires setting the WAL_LEVEL to logical, and granting specific permissions to start a publication
on the source database. To simplify this setup process, we have added a detailed two-step checklist with comprehensive
configuration instructions to Timescale Console.
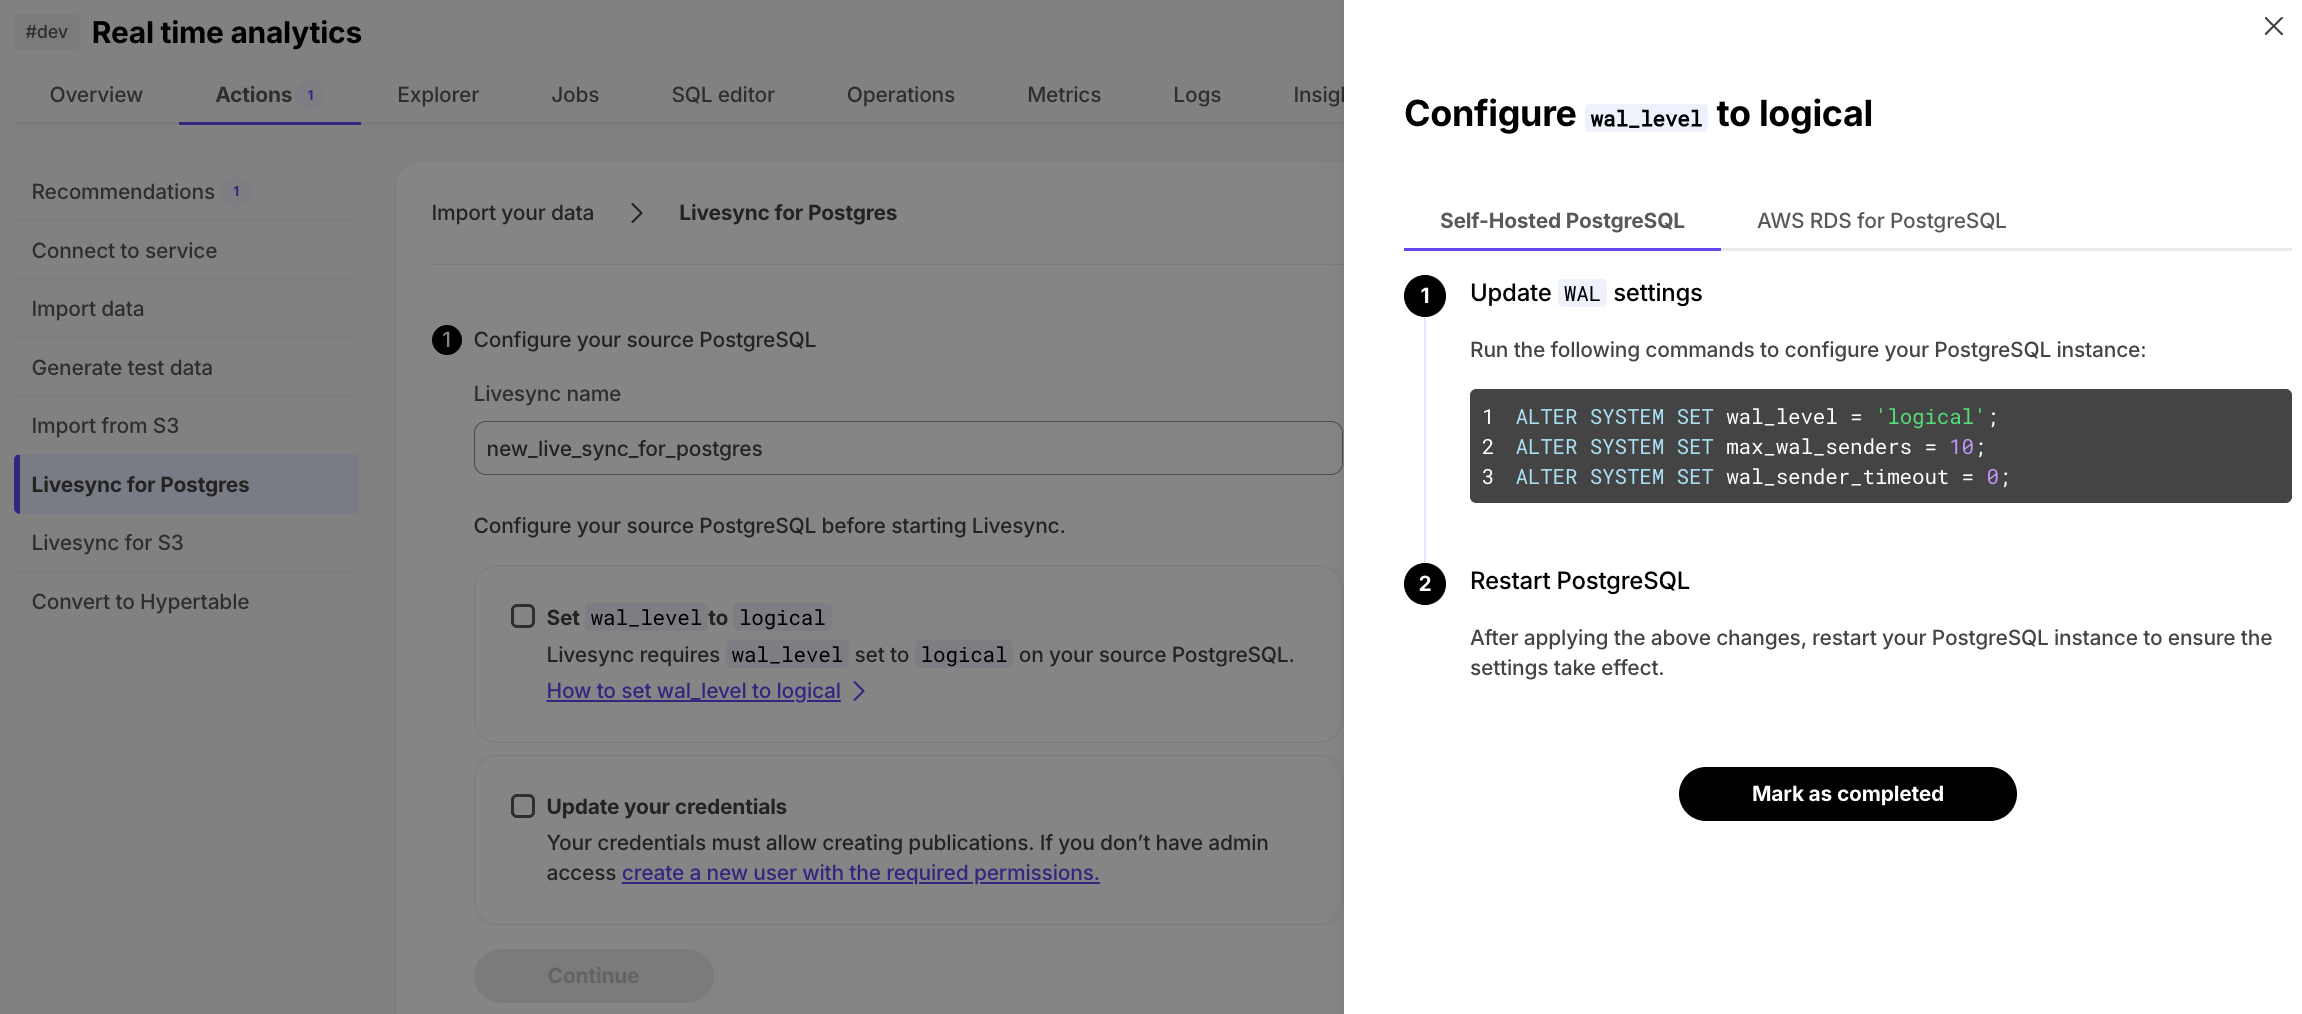
Passwordless data mode connections
We’ve made connecting to your Timescale Cloud services from data mode in Timescale Console even easier! All new services created in Timescale Cloud are now automatically accessible from data mode without requiring you to enter your service credentials. Just open data mode, select your service, and start querying.
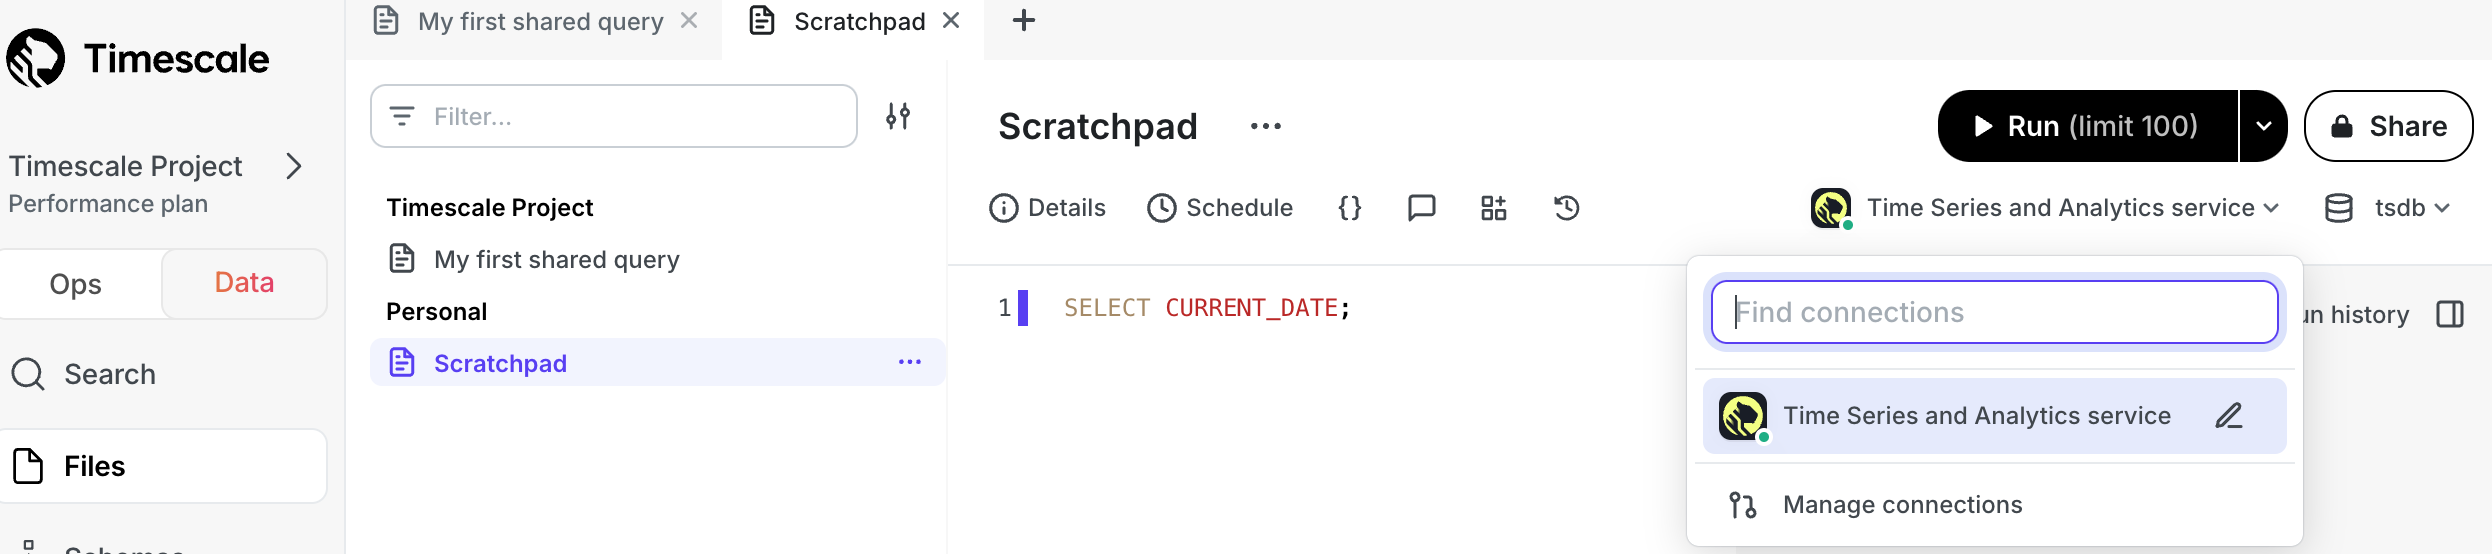
We will be expanding this functionality to existing services in the coming weeks (including services using VPC peering), so stay tuned.
☑️ Embeddings spot checks, TimescaleDB v2.19.3, and new models in SQL Assistant
April 18, 2025
Embeddings spot checks
In Timescale Cloud, you can now quickly check the quality of the embeddings from the vectorizers' outputs. Construct a similarity search query with additional filters on source metadata using a simple UI. Run the query right away, or copy it to the SQL editor or data mode and further customize it to your needs. Run the check in Timescale Console > Services > AI:
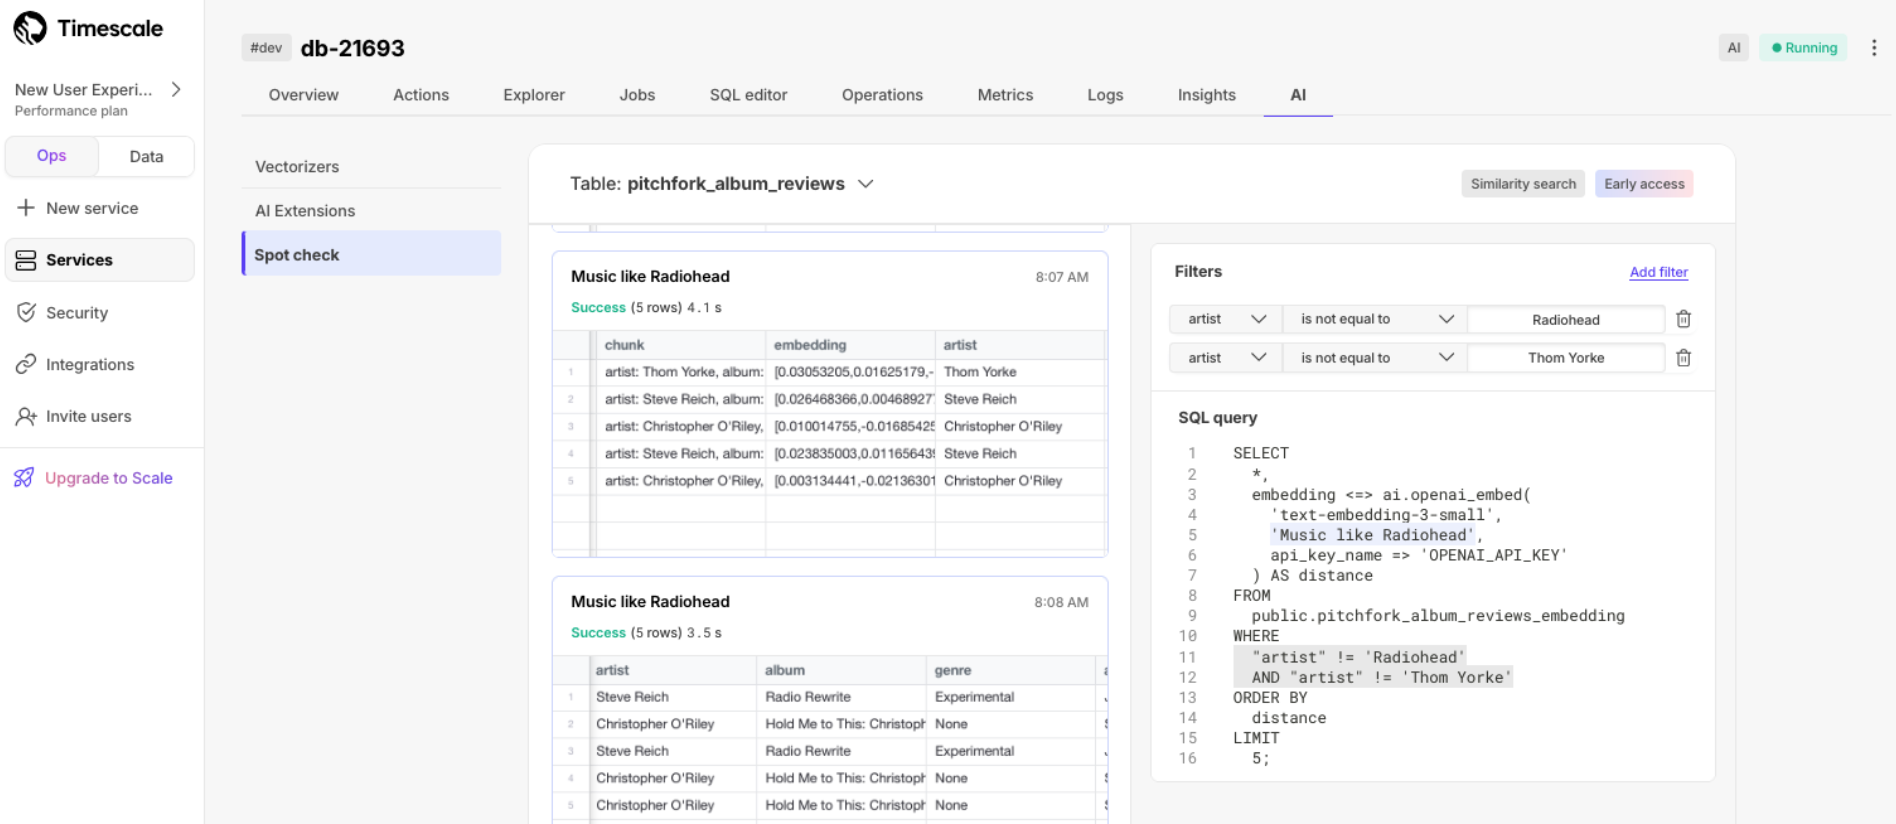
TimescaleDB v2.19.3
New services created in Timescale Cloud now use TimescaleDB v2.19.3. Existing services are in the process of being automatically upgraded to this version.
This release adds a number of bug fixes including:
- Fix segfault when running a query against columnstore chunks that group by multiple columns, including UUID segmentby columns.
- Fix hypercore table access method segfault on DELETE operations using a segmentby column.
New OpenAI, Llama, and Gemini models in SQL Assistant
The data mode's SQL Assistant now includes support for the latest models from OpenAI and Llama: GPT-4.1 (including mini and nano) and Llama 4 (Scout and Maverick). Additionally, we've added support for Gemini models, in particular Gemini 2.0 Nano and 2.5 Pro (experimental and preview). With the new additions, SQL Assistant supports more than 20 language models so you can select the one best suited to your needs.
🪵 TimescaleDB v2.19, new service overview page, and log improvements
April 11, 2025
TimescaleDB v2.19—query performance and concurrency improvements
Starting this week, all new services created on Timescale Cloud use TimescaleDB v2.19. Existing services will be upgraded gradually during their maintenance window.
Highlighted features in TimescaleDB v2.19 include:
- Improved concurrency of
INSERT,UPDATE, andDELETEoperations on the columnstore by no longer blocking DML statements during the recompression of a chunk. - Improved system performance during continuous aggregate refreshes by breaking them into smaller batches. This reduces systems pressure and minimizes the risk of spilling to disk.
- Faster and more up-to-date results for queries against continuous aggregates by materializing the most recent data first, as opposed to old data first in prior versions.
- Faster analytical queries with SIMD vectorization of aggregations over text columns and
GROUP BYover multiple columns. - Enable chunk size optimization for better query performance in the columnstore by merging them with
merge_chunk.
New service overview page
The service overview page in Timescale Console has been overhauled to make it simpler and easier to use. Navigate to the Overview tab for any of your services and you will find an architecture diagram and general information pertaining to it. You may also see recommendations at the top, for how to optimize your service.
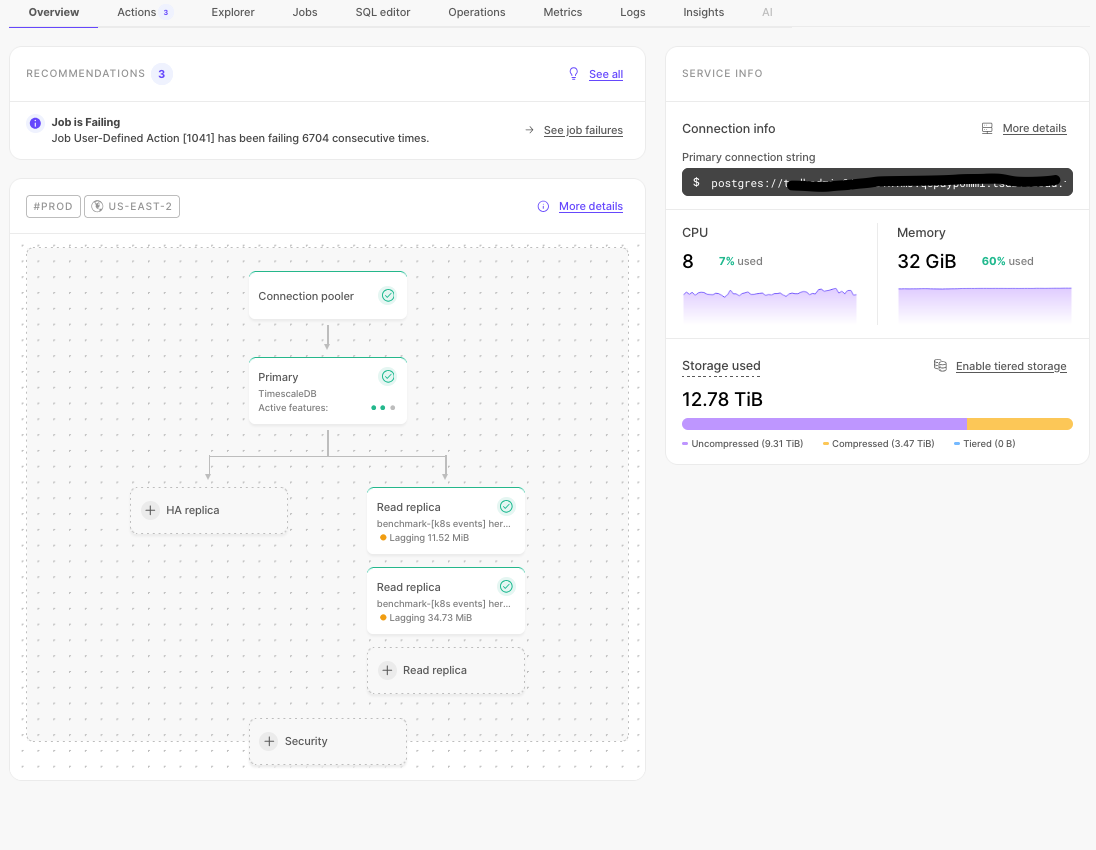
To leave the product team your feedback, open Help & Support on the left and select Send feedback to the product team.
Find logs faster
Finding logs just got easier! We've added a date, time, and timezone picker, so you can jump straight to the exact moment you're interested in—no more endless scrolling.
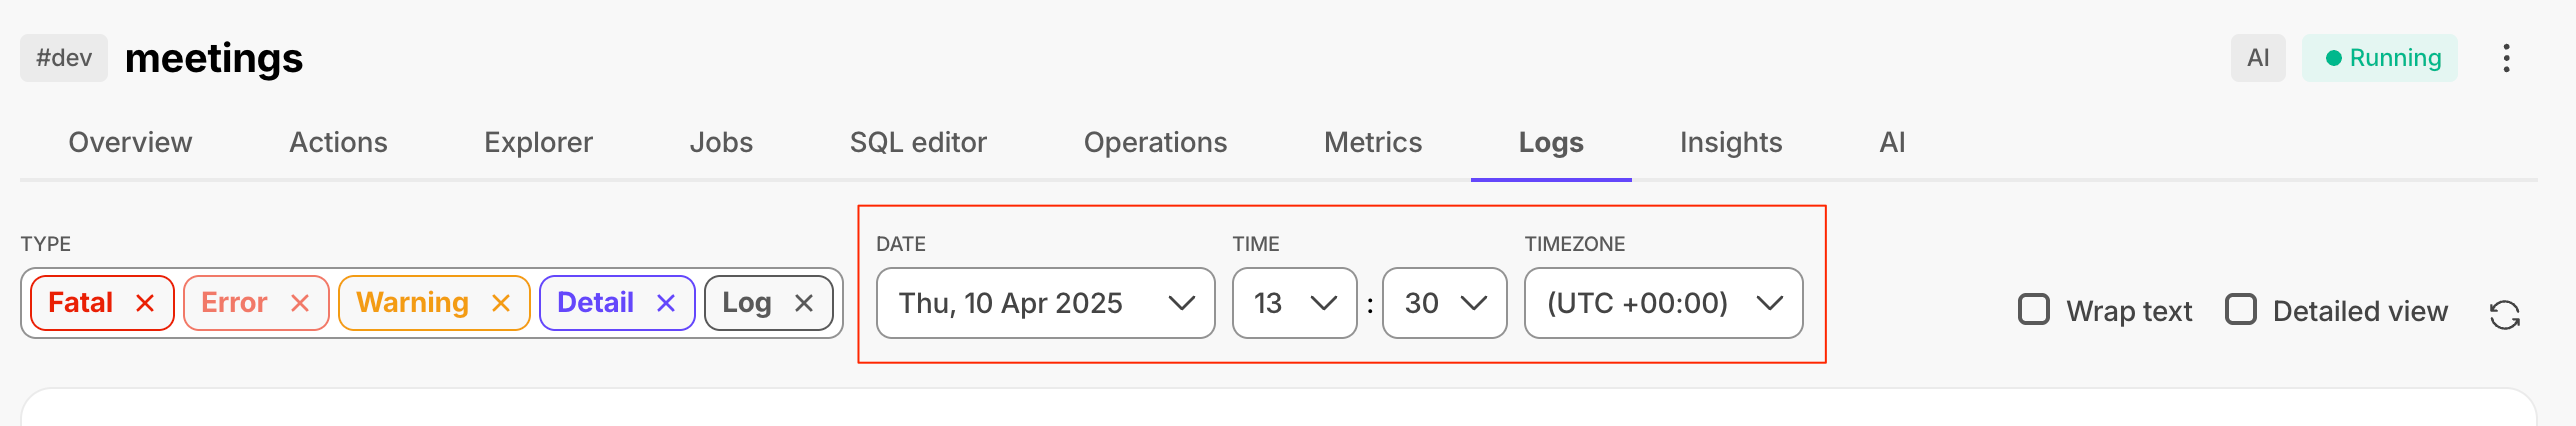
📒Faster vector search and improved job information
April 4, 2025
pgvectorscale 0.7.0: faster filtered filtered vector search with filtered indexes
This pgvectorscale release adds label-based filtered vector search to the StreamingDiskANN index. This enables you to return more precise and efficient results by combining vector similarity search with label filtering while still uitilizing the ANN index. This is a common need for large-scale RAG and Agentic applications that rely on vector searches with metadata filters to return relevant results. Filtered indexes add even more capabilities for filtered search at scale, complementing the high accuracy streaming filtering already present in pgvectorscale. The implementation is inspired by Microsoft's Filtered DiskANN research. For more information, see the pgvectorscale release notes and a usage example.
Job errors and individual job pages
Each job now has an individual page in Timescale Console, and displays additional details about job errors. You use this information to debug failing jobs.
To see the job information page, in Timescale Console, select the service to check, then click Jobs > job ID to investigate.
- Successful jobs:
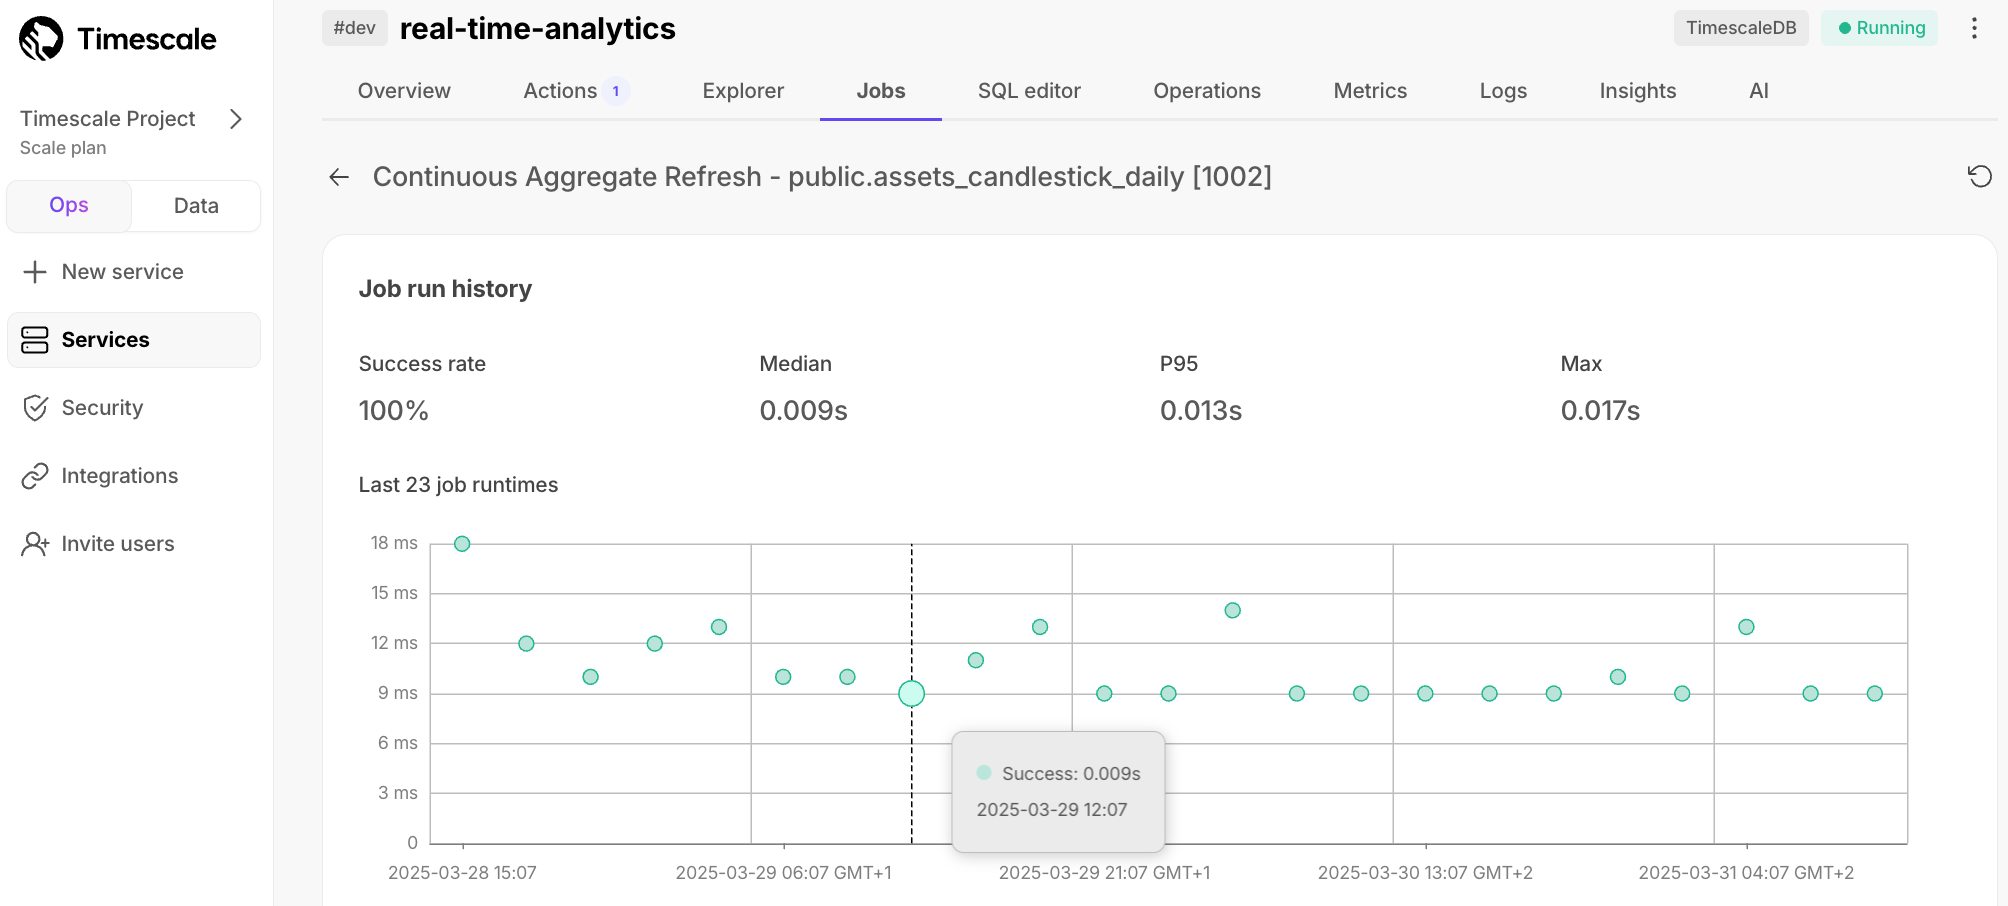
- Unsuccessful jobs with errors:
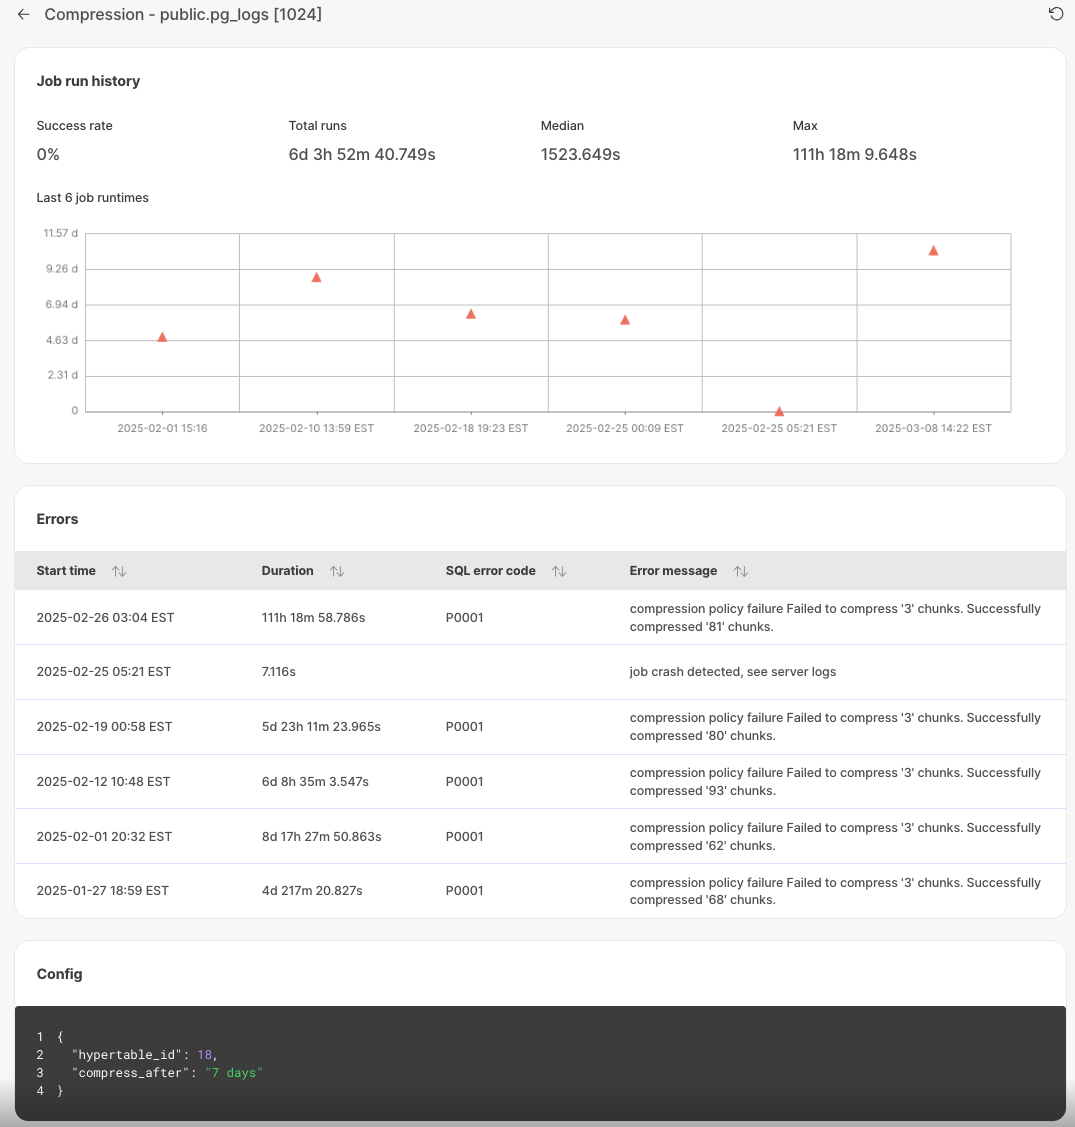
🤩 In-Console Livesync for Postgres
March 21, 2025
You can now set up an active data ingestion pipeline with livesync for Postgres in Timescale Console. This tool enables you to replicate your source database tables into Timescale's hypertables indefinitely. Yes, you heard that right—keep livesync running for as long as you need, ensuring that your existing source Postgres tables stay in sync with Timescale Cloud. Read more about setting up and using Livesync for Postgres.
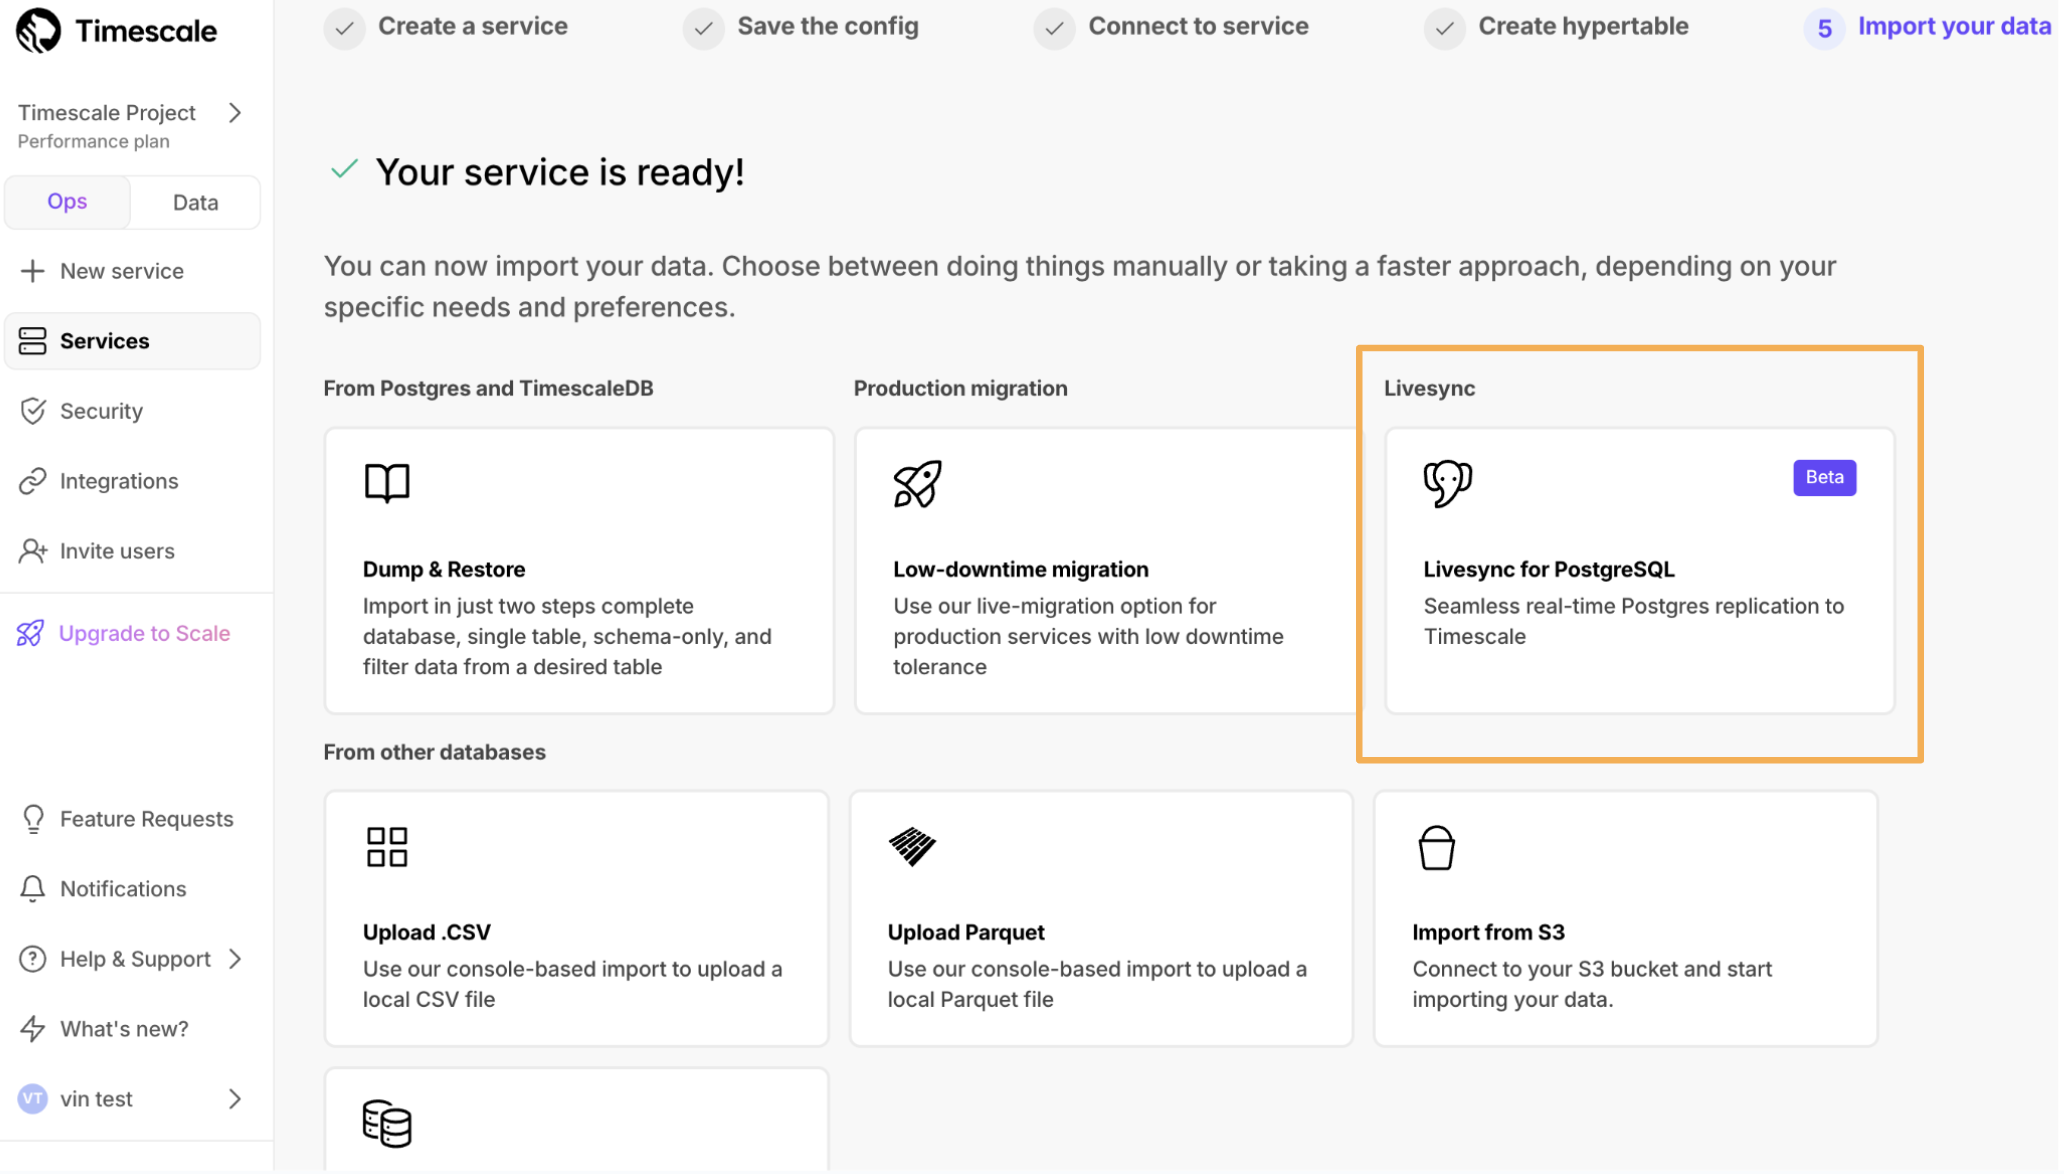
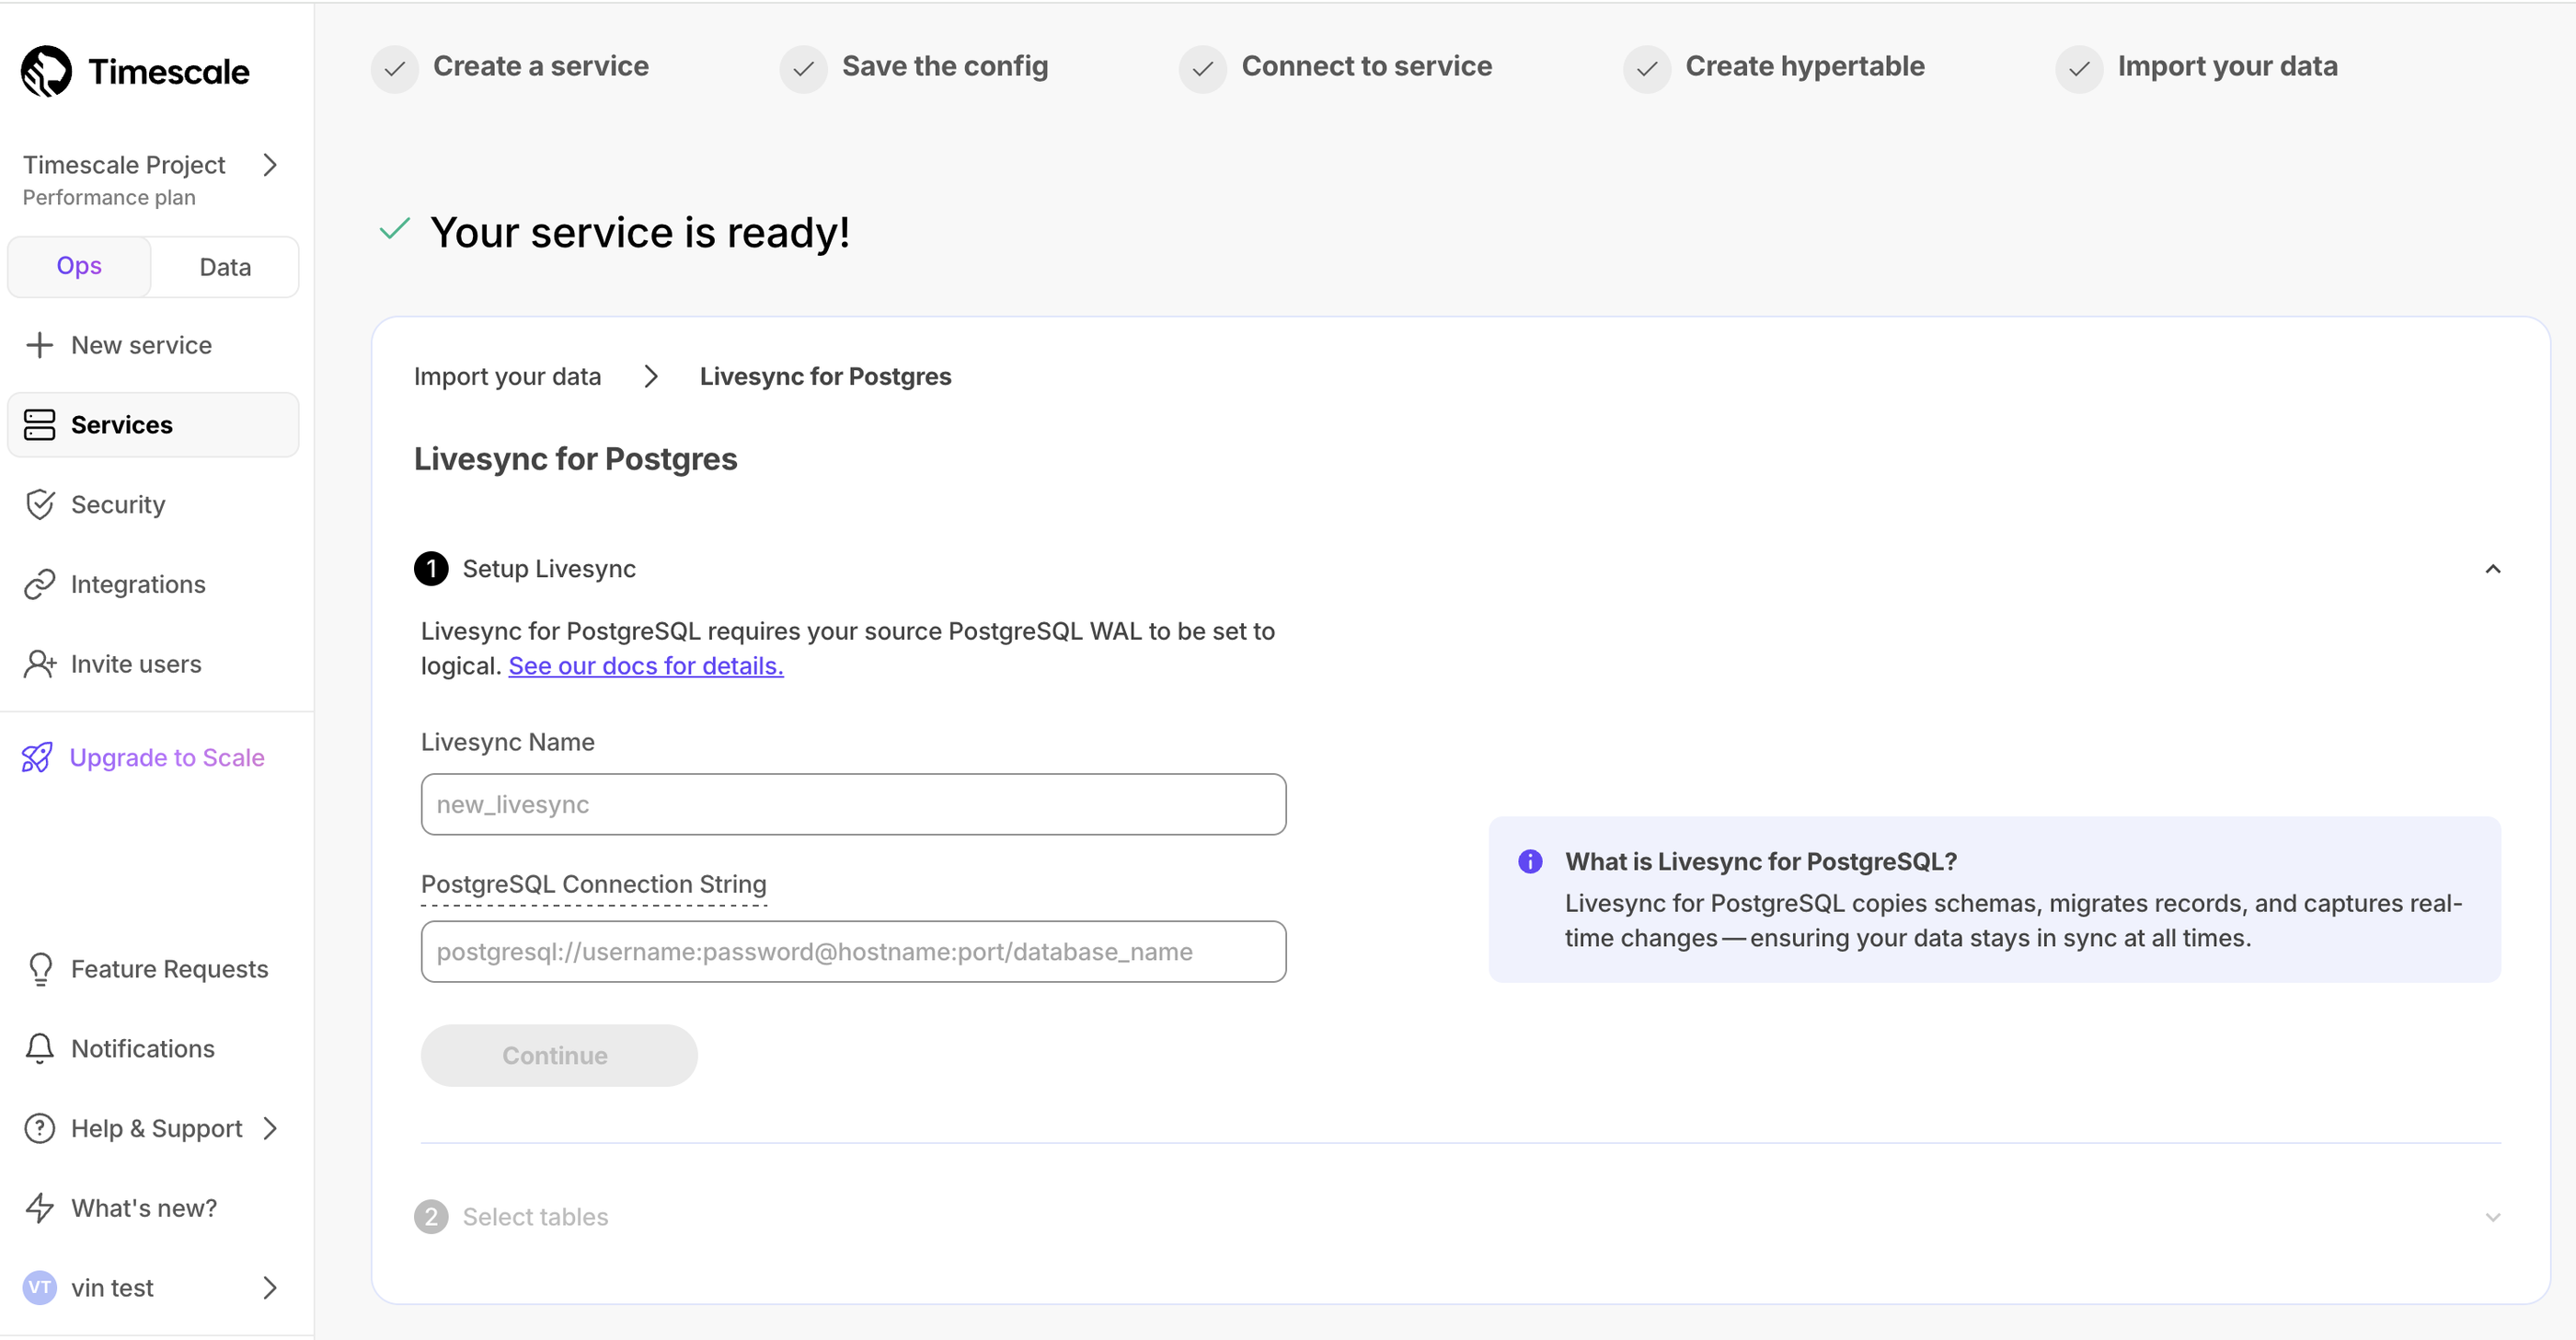
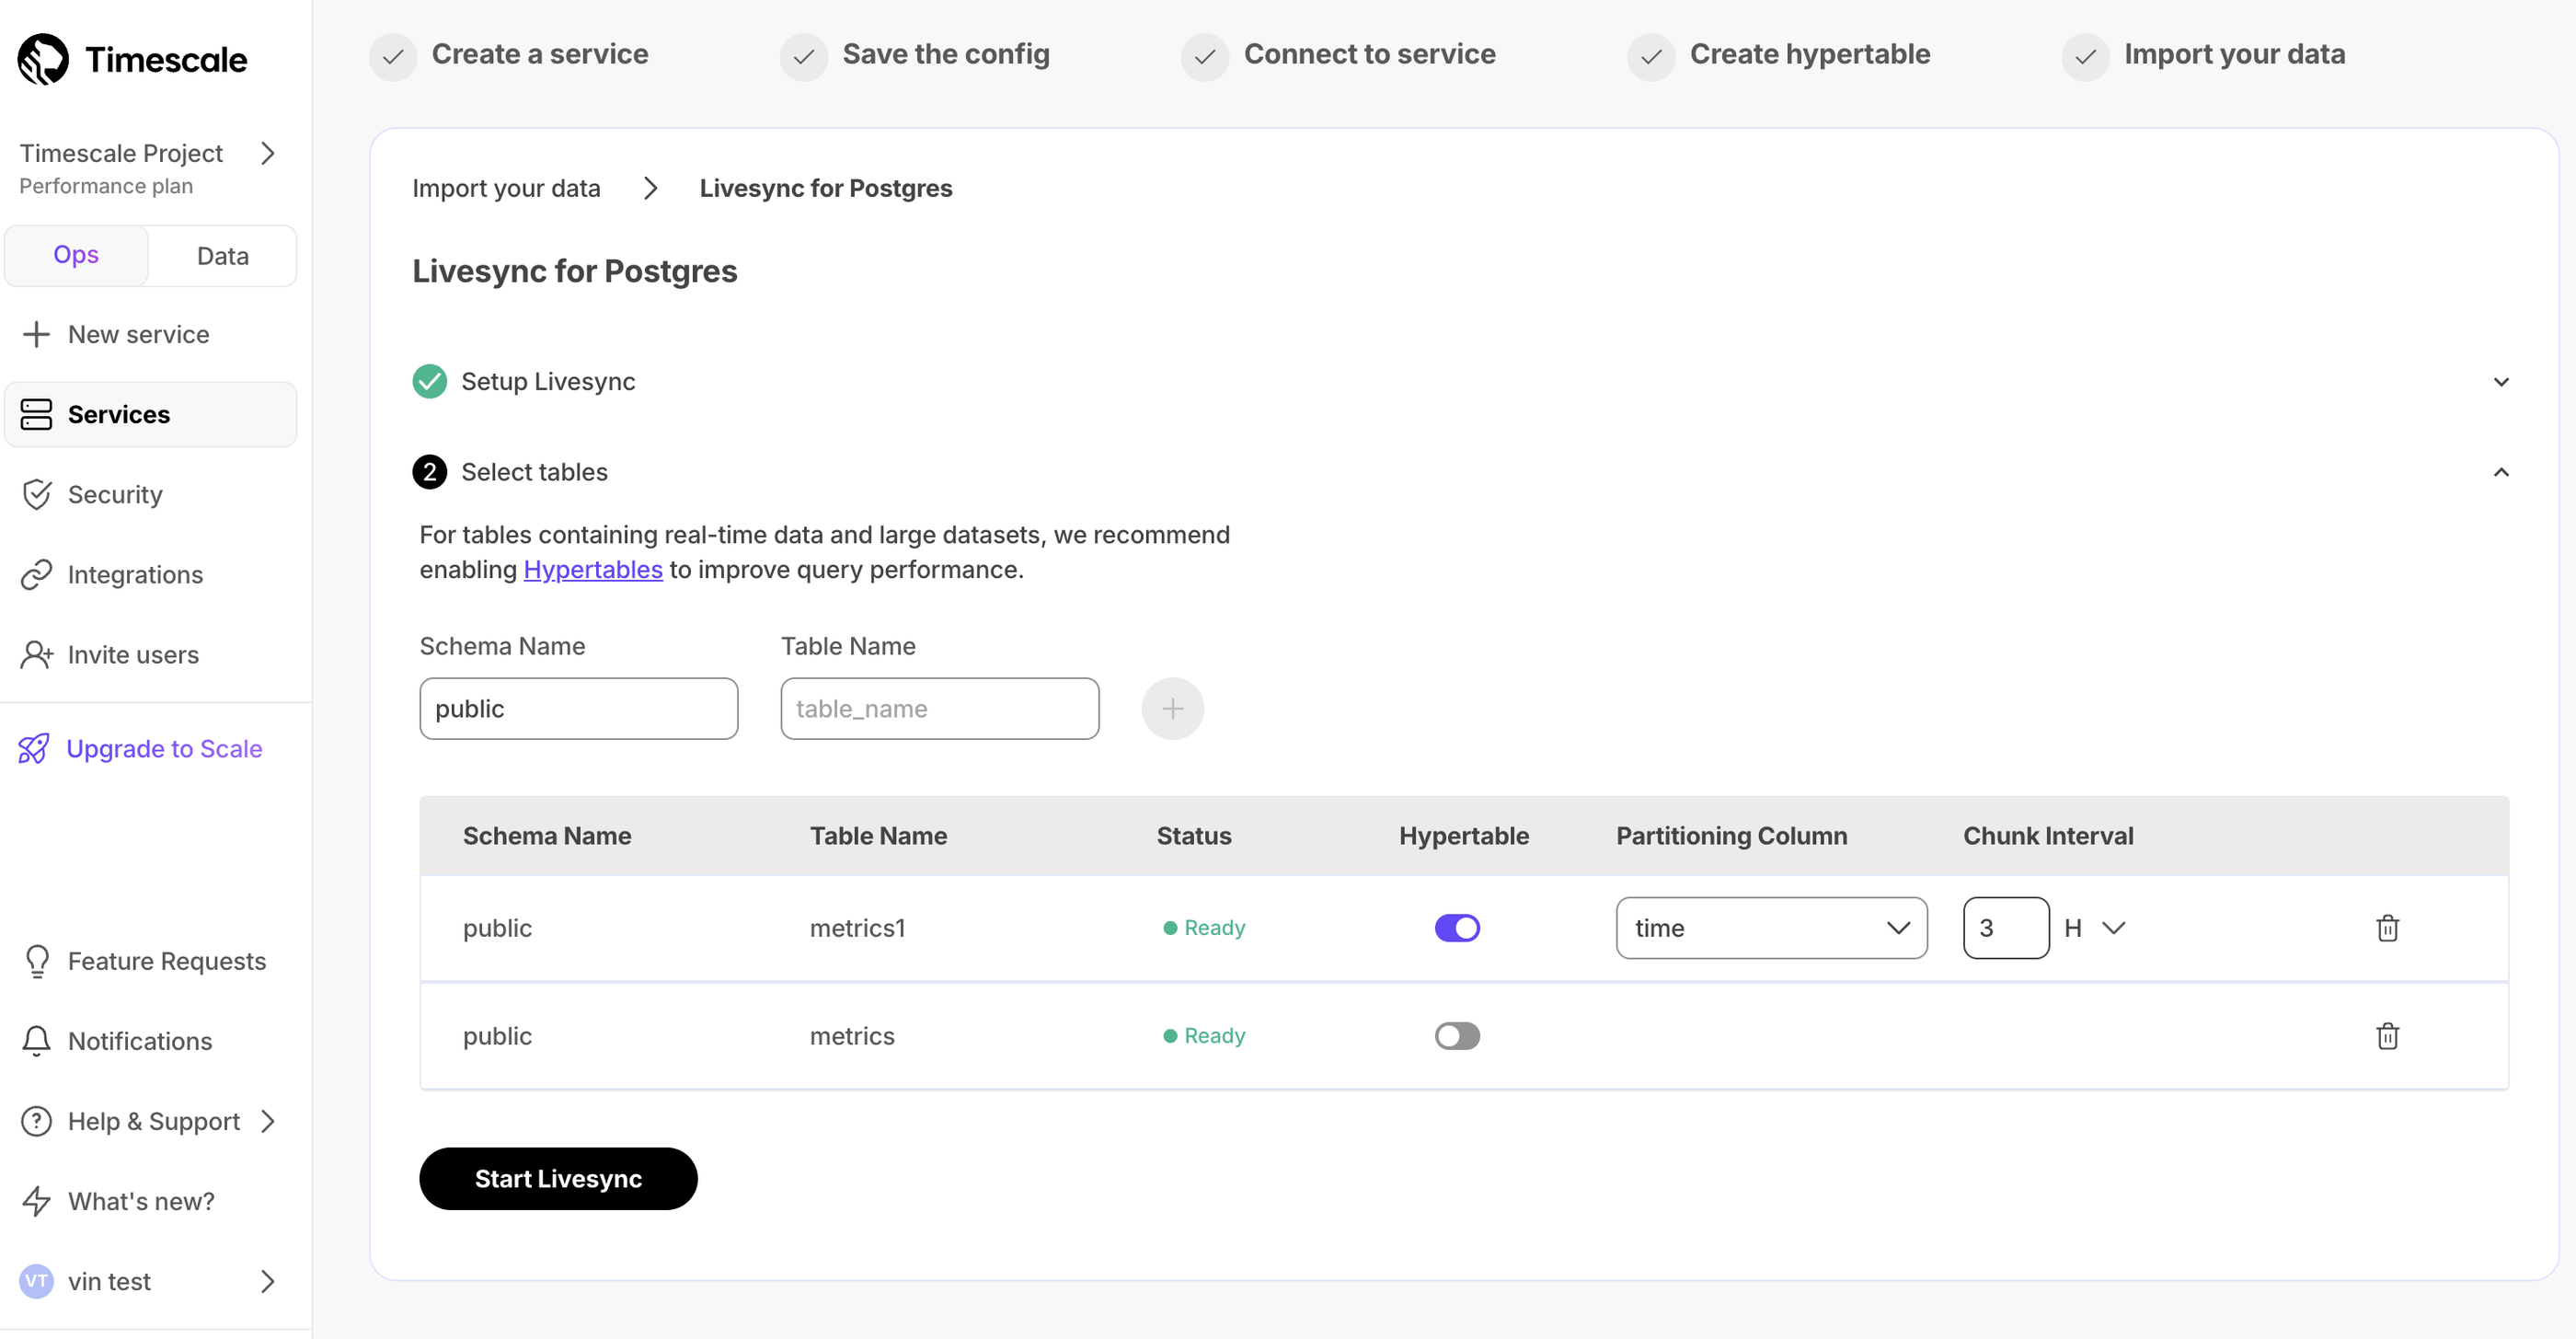
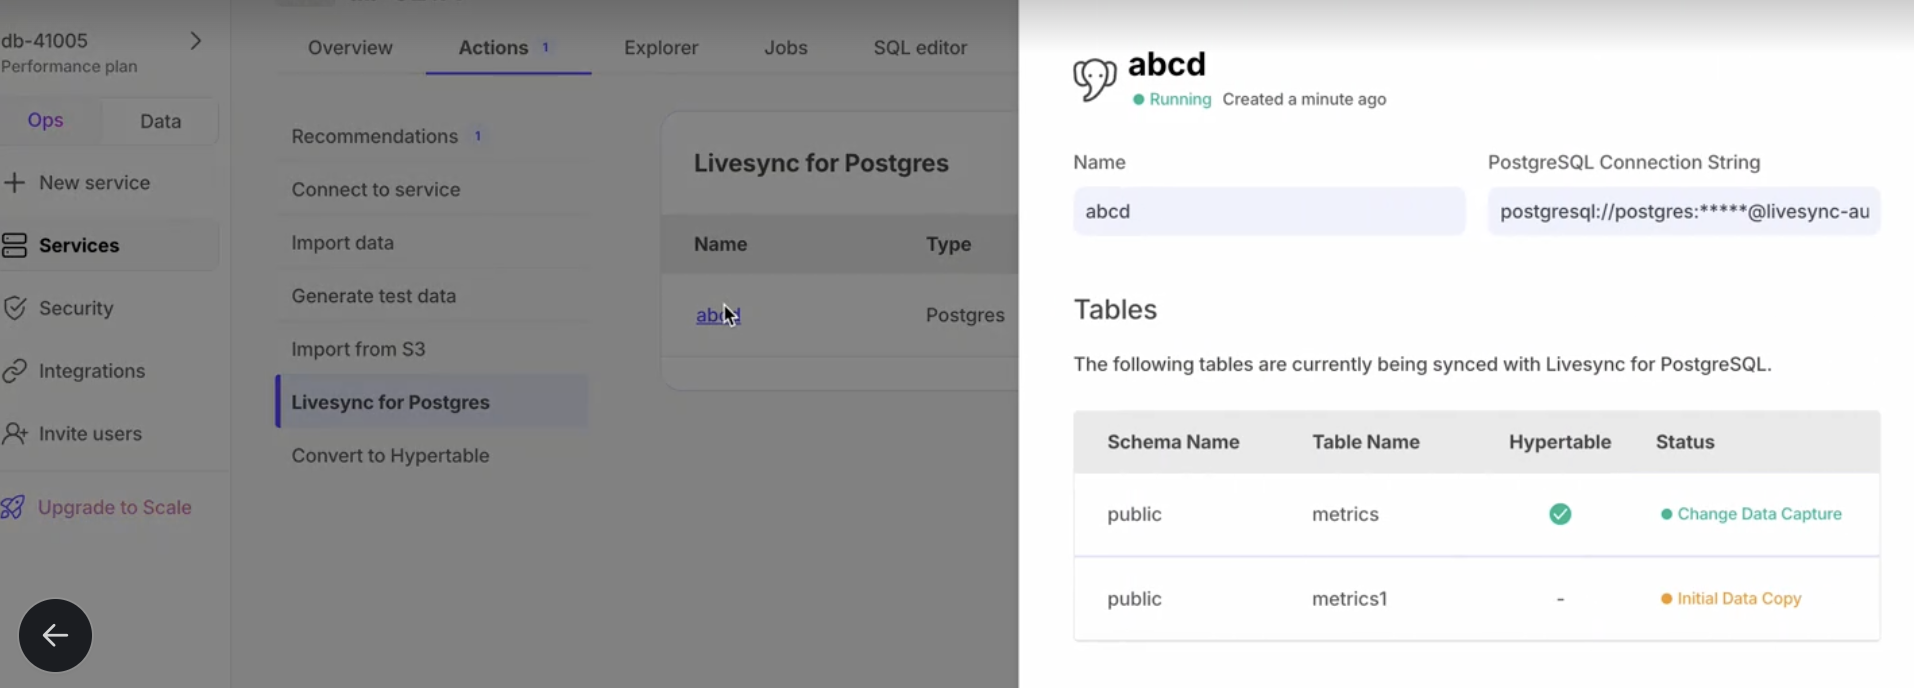
💾 16K dimensions on pgvectorscale plus new pgai Vectorizer support
March 14, 2025
pgvectorscale 0.6 — store up to 16K dimension embeddings
pgvectorscale 0.6.0 now supports storing vectors with up to 16,000 dimensions, removing the previous limitation of 2,000 from pgvector. This lets you use larger embedding models like OpenAI's text-embedding-3-large (3072 dim) with Postgres as your vector database. This release also includes key performance and capability enhancements, including NEON support for SIMD distance calculations on aarch64 processors, improved inner product distance metric implementation, and improved index statistics. See the release details here.
pgai Vectorizer supports models from AWS Bedrock, Azure AI, Google Vertex via LiteLLM
Access embedding models from popular cloud model hubs like AWS Bedrock, Azure AI Foundry, Google Vertex, as well as HuggingFace and Cohere as part of the LiteLLM integration with pgai Vectorizer. To use these models with pgai Vectorizer on Timescale Cloud, select Other when adding the API key in the credentials section of Timescale Console.
🤖 Agent Mode for PopSQL and more
March 7, 2025
Agent Mode for PopSQL
Introducing Agent Mode, a new feature in Timescale Console SQL Assistant. SQL Assistant lets you query your database using natural language. However, if you ran into errors, you have to approve the implementation of the Assistant's suggestions.
With Agent Mode on, SQL Assistant automatically adjusts and executes your query without intervention. It runs, diagnoses, and fixes any errors that it runs into until you get your desired results.
Below you can see SQL Assistant run into an error, identify the resolution, execute the fixed query, display results, and even change the title of the query:
To use Agent Mode, make sure you have SQL Assistant enabled, then click on the model selector dropdown, and tick the Agent Mode checkbox.
Improved AWS Marketplace integration for a smoother experience
We've enhanced the AWS Marketplace workflow to make your experience even better! Now, everything is fully automated, ensuring a seamless process from setup to billing. If you're using the AWS Marketplace integration, you'll notice a smoother transition and clearer billing visibility—your Timescale Cloud subscription will be reflected directly in AWS Marketplace!
Timescale Console recommendations
Sometimes it can be hard to know if you are getting the best use out of your service. To help with this, Timescale Cloud now provides recommendations based on your service's context, assisting with onboarding or notifying if there is a configuration concern with your service, such as consistently failing jobs.
To start, recommendations are focused primarily on onboarding or service health, though we will regularly add new ones. You can see if you have any existing recommendations for your service by going to the Actions tab in Timescale Console.
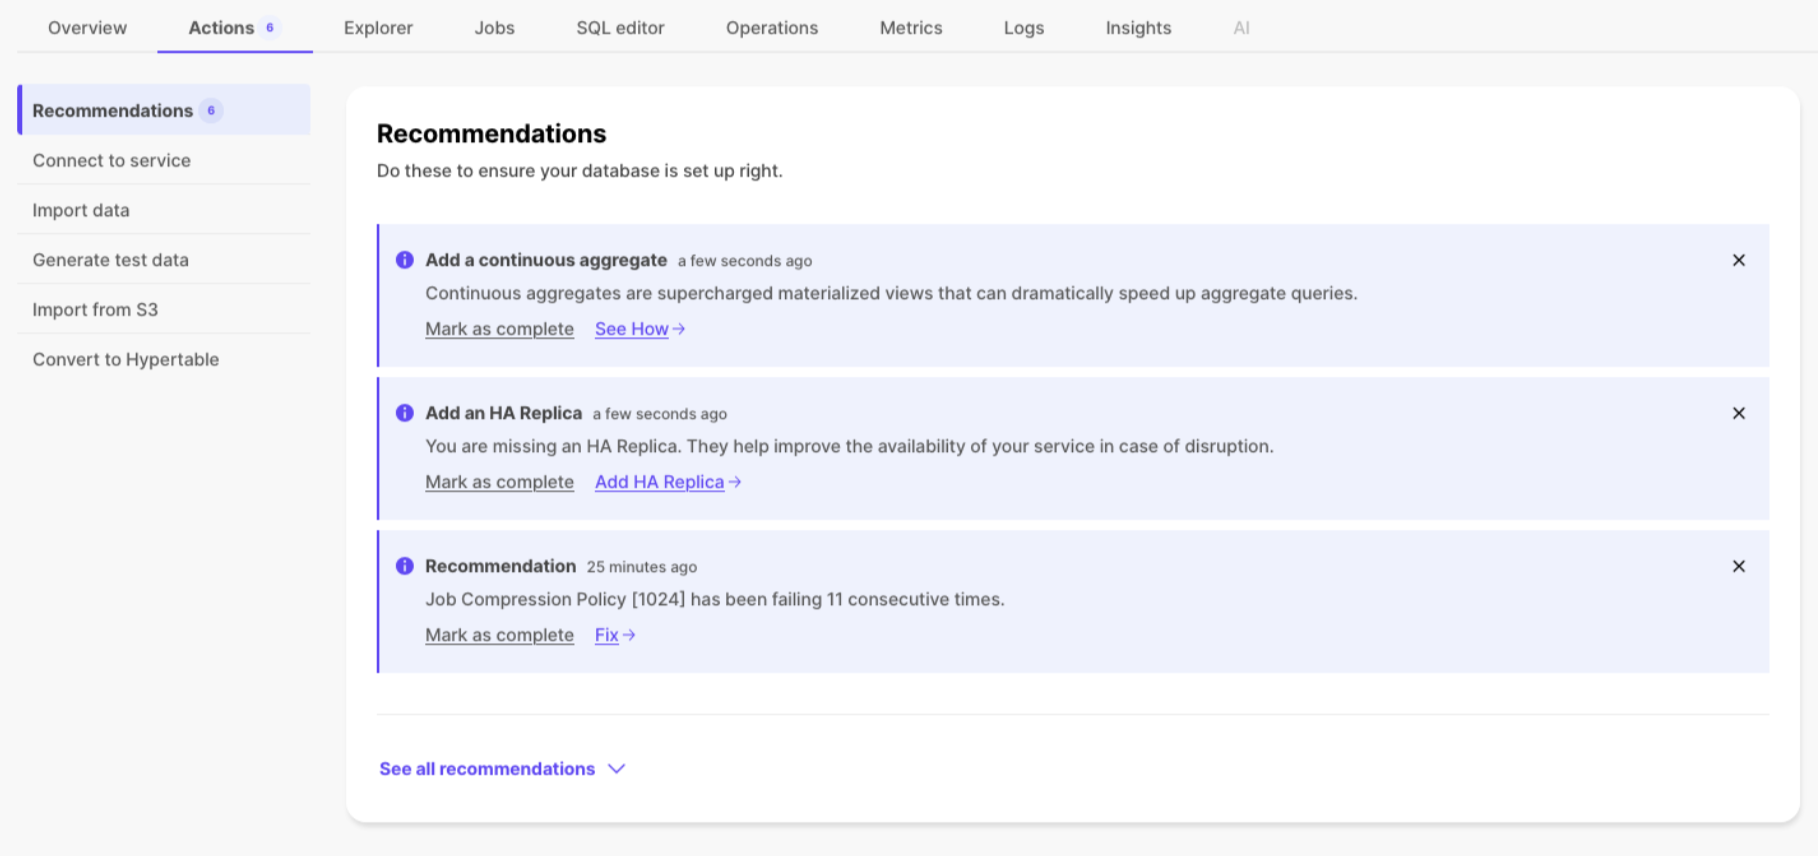
🛣️ Configuration Options for Secure Connections and More
February 28, 2025
Edit VPC and AWS Transit Gateway CIDRs
You can now modify the CIDRs blocks for your VPC or Transit Gateway directly from Timescale Console, giving you greater control over network access and security. This update makes it easier to adjust your private networking setup without needing to recreate your VPC or contact support.
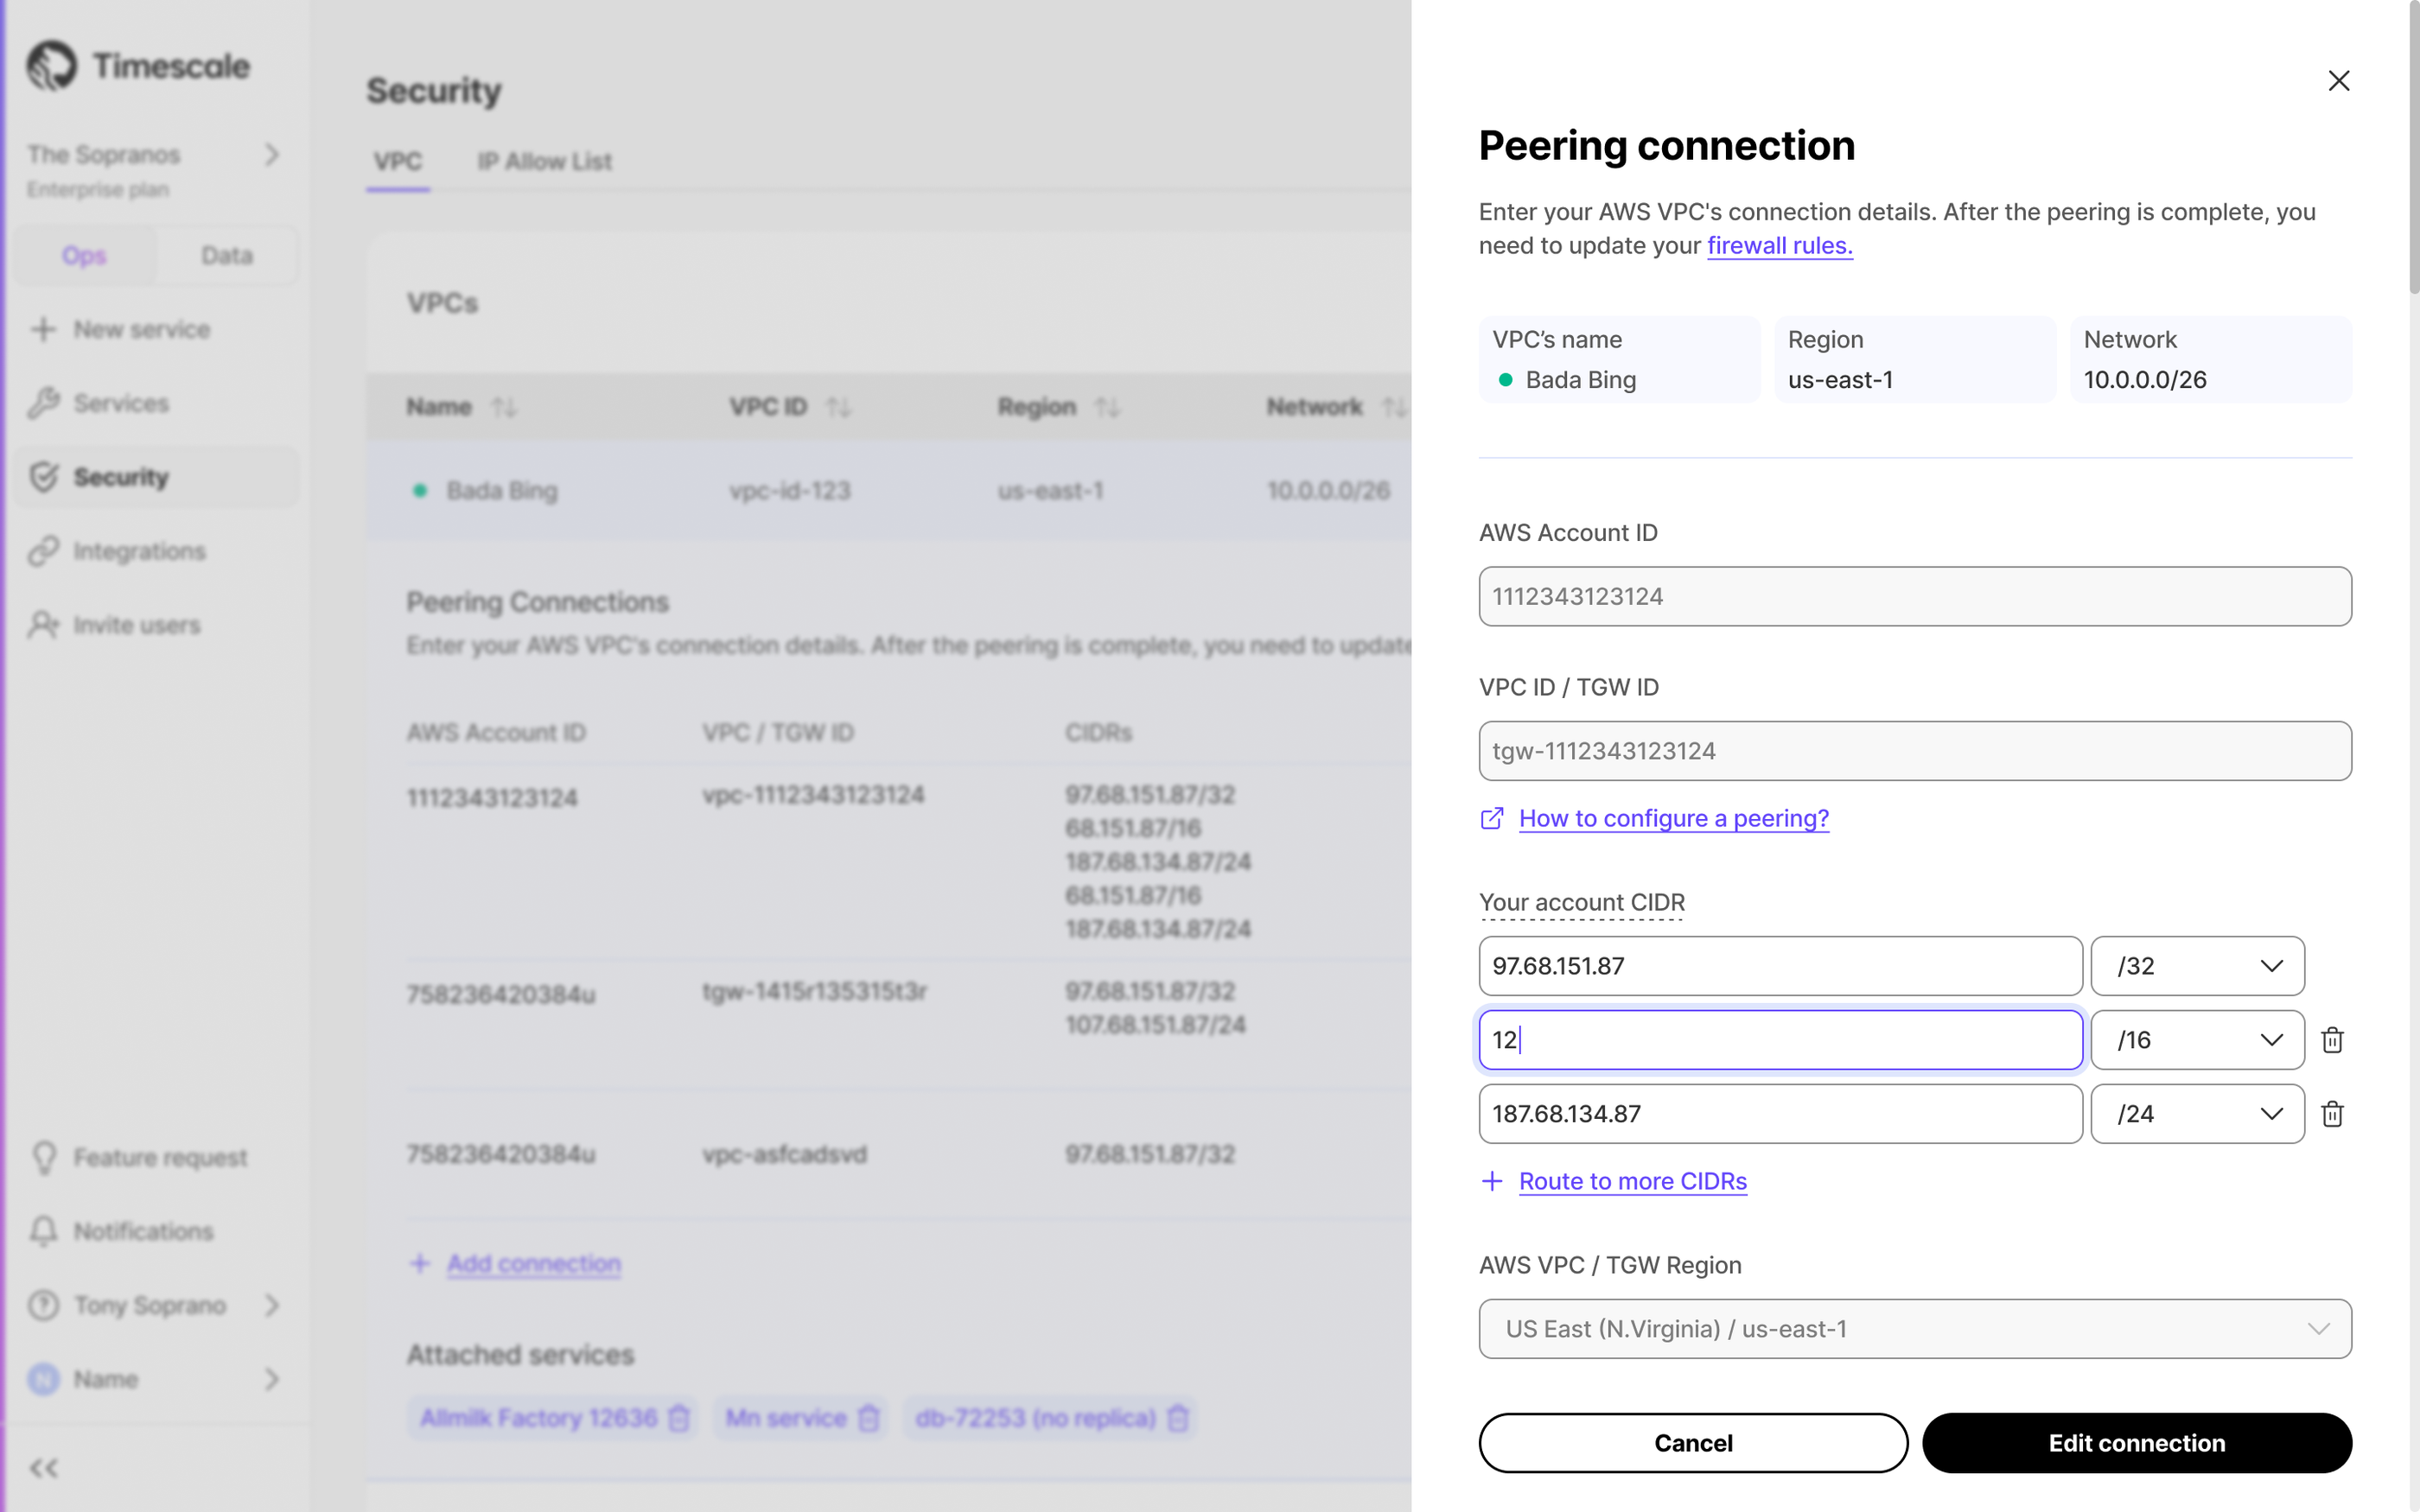
Improved log filtering
We’ve enhanced the Logs screen with the new Warning and Log filters to help you quickly find the logs you need. These additions complement the existing Fatal, Error, and Detail filters, making it easier to pinpoint specific events and troubleshoot issues efficiently.
TimescaleDB v2.18.2 on Timescale Cloud
New services created in Timescale Cloud now use TimescaleDB v2.18.2. Existing services are in the process of being automatically upgraded to this version.
This new release fixes a number of bugs including:
- Fix
ExplainHookbreaking the call chain. - Respect
ExecutorStarthooks of other extensions. - Block dropping internal compressed chunks with
drop_chunk().
SQL Assistant improvements
- Support for Claude 3.7 Sonnet and extended thinking including reasoning tokens.
- Ability to abort SQL Assistant requests while the response is streaming.
🤖 SQL Assistant Improvements and Pgai Docs Reorganization
February 21, 2025
New models and improved UX for SQL Assistant
We have added fireworks.ai and Groq as service providers, and several new LLM options for SQL Assistant:
- OpenAI o1
- DeepSeek R1
- Llama 3.3 70B
- Llama 3.1 405B
- DeepSeek R1 Distill - Llama 3.3
We've also improved the model picker by adding descriptions for each model:
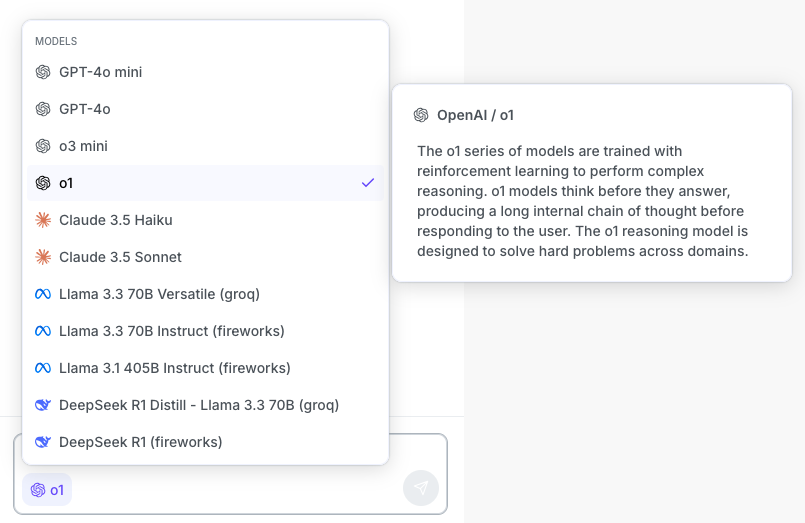
Updated and reorganized docs for pgai
We have improved the GitHub docs for pgai. Now relevant sections have been grouped into their own folders and we've created a comprehensive summary doc. Check it out here.
💘 TimescaleDB v2.18.1 and AWS Transit Gateway Support Generally Available
February 14, 2025
TimescaleDB v2.18.1
New services created in Timescale Cloud now use TimescaleDB v2.18.1. Existing services will be automatically upgraded in their next maintenance window starting next week.
This new release includes a number of bug fixes and small improvements including:
- Faster columnar scans when using the hypercore table access method
- Ensure all constraints are always applied when deleting data on the columnstore
- Pushdown all filters on scans for UPDATE/DELETE operations on the columnstore
AWS Transit Gateway support is now generally available!
Timescale Cloud now fully supports AWS Transit Gateway, making it even easier to securely connect your database to multiple VPCs across different environments—including AWS, on-prem, and other cloud providers.
With this update, you can establish a peering connection between your Timescale Cloud services and an AWS Transit Gateway in your AWS account. This keeps your Timescale Cloud services safely behind a VPC while allowing seamless access across complex network setups.
🤖 TimescaleDB v2.18 and SQL Assistant Improvements in Data Mode and PopSQL
February 6, 2025
TimescaleDB v2.18 - dense indexes in the columnstore and query vectorization improvements
Starting this week, all new services created on Timescale Cloud use TimescaleDB v2.18. Existing services will be upgraded gradually during their maintenance window.
Highlighted features in TimescaleDB v2.18.0 include:
- The ability to add dense indexes (btree and hash) to the columnstore through the new hypercore table access method.
- Significant performance improvements through vectorization (SIMD) for aggregations using a group by with one column and/or using a filter clause when querying the columnstore.
- Hypertables support triggers for transition tables, which is one of the most upvoted community feature requests.
- Updated methods to manage Timescale's hybrid row-columnar store (hypercore). These methods highlight columnstore usage. The columnstore includes an optimized columnar format as well as compression.
SQL Assistant improvements
We made a few improvements to SQL Assistant:
Dedicated SQL Assistant threads 🧵
Each query, notebook, and dashboard now gets its own conversation thread, keeping your chats organized.
Delete messages ❌
Made a typo? Asked the wrong question? You can now delete individual messages from your thread to keep the conversation clean and relevant.
Support for OpenAI o3-mini ⚡
We’ve added support for OpenAI’s latest o3-mini model, bringing faster response times and improved reasoning for SQL queries.
🌐 IP Allowlists in Data Mode and PopSQL
January 31, 2025
For enhanced network security, you can now also create IP allowlists in the Timescale Console data mode and PopSQL. Similarly to the ops mode IP allowlists, this feature grants access to your data only to certain IP addresses. For example, you might require your employees to use a VPN and add your VPN static egress IP to the allowlist.
This feature is available in:
- Timescale Console data mode, for all pricing tiers
- PopSQL web
- PopSQL desktop
Enable this feature in PopSQL/Timescale Console data mode > Project > Settings > IP Allowlist:
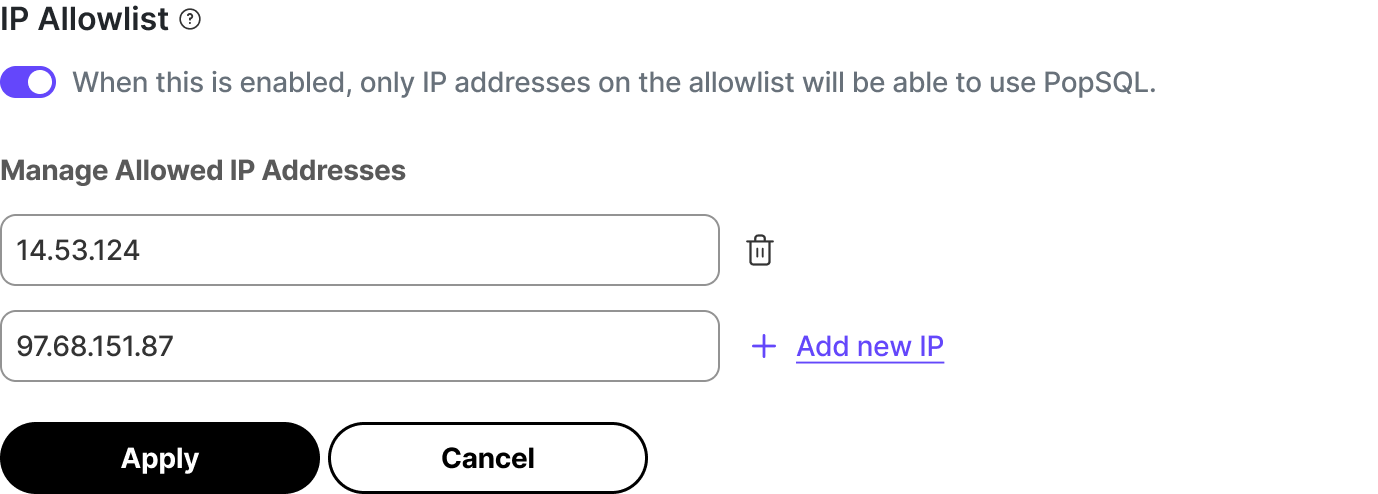
🤖 pgai Extension and Python Library Updates
January 24, 2025
AI — pgai Postgres extension 0.7.0
This release enhances the Vectorizer functionality by adding configurable base_url support for OpenAI API. This enables pgai Vectorizer to use all OpenAI-compatible models and APIs via the OpenAI integration simply by changing the base_url. This release also includes public granting of vectorizers, superuser creation on any table, an upgrade to the Ollama client to 0.4.5, a new docker-start command, and various fixes for struct handling, schema qualification, and system package management. See all changes on Github.
AI - pgai python library 0.5.0
This release adds comprehensive SQLAlchemy and Alembic support for vector embeddings, including operations for migrations and improved model inheritance patterns. You can now seamlessly integrate vector search capabilities with SQLAlchemy models while utilizing Alembic for database migrations. This release also adds key improvements to the Ollama integration and self-hosted Vectorizer configuration. See all changes on Github.
AWS Transit Gateway Support
January 17, 2025
AWS Transit Gateway Support (Early Access)
Timescale Cloud now enables you to connect to your Timescale Cloud services through AWS Transit Gateway. This feature is available to Scale and Enterprise customers. It will be in Early Access for a short time and available in the Timescale Console very soon. If you are interested in implementing this Early Access Feature, reach out to your Rep.
🇮🇳 New region in India, Postgres 17 upgrades, and TimescaleDB on AWS Marketplace
January 10, 2025
Welcome India! (Support for a new region: Mumbai)
Timescale Cloud now supports the Mumbai region. Starting today, you can run Timescale Cloud services in Mumbai, bringing our database solutions closer to users in India.
Postgres major version upgrades to PG 17
Timescale Cloud services can now be upgraded directly to Postgres 17 from versions 14, 15, or 16. Users running versions 12 or 13 must first upgrade to version 15 or 16, before upgrading to 17.
Timescale Cloud available on AWS Marketplace
Timescale Cloud is now available in the AWS Marketplace. This allows you to keep billing centralized on your AWS account, use your already committed AWS Enterprise Discount Program spend to pay your Timescale Cloud bill and simplify procurement and vendor management.
🎅 Postgres 17, feature requests, and Postgres Livesync
December 20, 2024
Postgres 17
All new Timescale Cloud services now come with Postgres 17.2, the latest version. Upgrades to Postgres 17 for services running on prior versions will be available in January. Postgres 17 adds new capabilities and improvements to Timescale like:
- System-wide Performance Improvements. Significant performance boosts, particularly in high-concurrency workloads. Enhancements in the I/O layer, including improved Write-Ahead Log (WAL) processing, can result in up to a 2x increase in write throughput under heavy loads.
- Enhanced JSON Support. The new JSON_TABLE allows developers to convert JSON data directly into relational tables, simplifying the integration of JSON and SQL. The release also adds new SQL/JSON constructors and query functions, offering powerful tools to manipulate and query JSON data within a traditional relational schema.
- More Flexible MERGE Operations. The MERGE command now includes a RETURNING clause, making it easier to track and work with modified data. You can now also update views using MERGE, unlocking new use cases for complex queries and data manipulation.
Submit feature requests from Timescale Console
You can now submit feature requests directly from Console and see the list of feature requests you have made. Just click on Feature Requests on the right sidebar.
All feature requests are automatically published to the Timescale Forum and are reviewed by the product team, providing more visibility and transparency on their status as well as allowing other customers to vote for them.
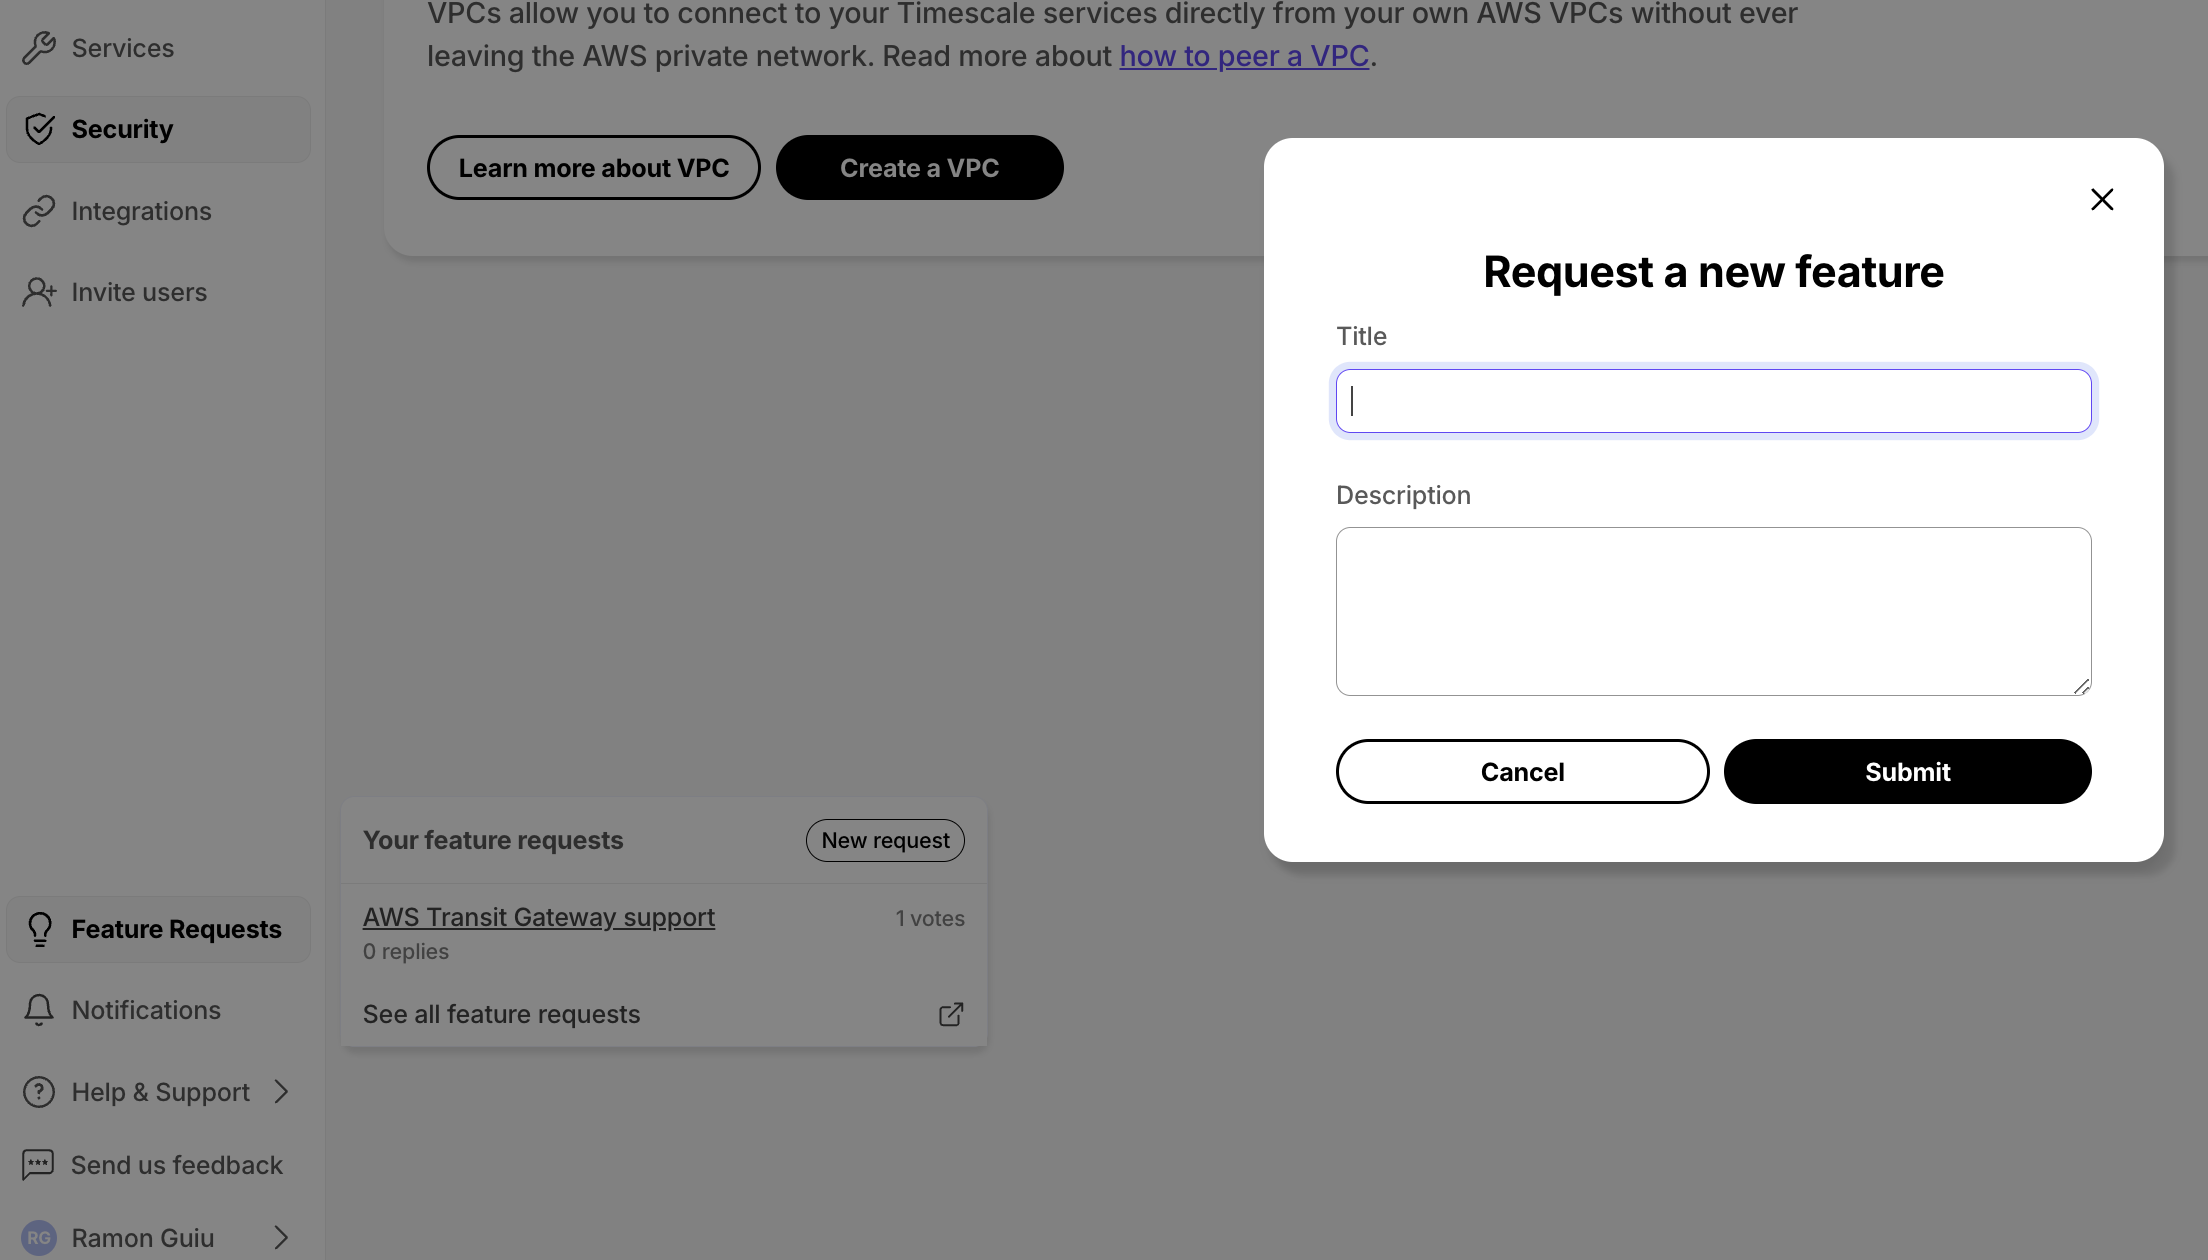
Postgres Livesync (Alpha release)
We have built a new solution that helps you continuously replicate all or some of your Postgres tables directly into Timescale Cloud.
Livesync allows you to keep a current Postgres instance such as RDS as your primary database, and easily offload your real-time analytical queries to Timescale Cloud to boost their performance. If you have any questions or feedback, talk to us in #livesync in Timescale Community.
This is just the beginning—you'll see more from livesync in 2025!
In-Console import from S3, I/O Boost, and Jobs Explorer
December 13, 2024
In-Console import from S3 (CSV and Parquet files)
Connect your S3 buckets to import data into Timescale Cloud. We support CSV (including .zip and .gzip) and Parquet files, with a 10 GB size limit in this initial release. This feature is accessible in the Import your data section right after service creation and through the Actions tab.
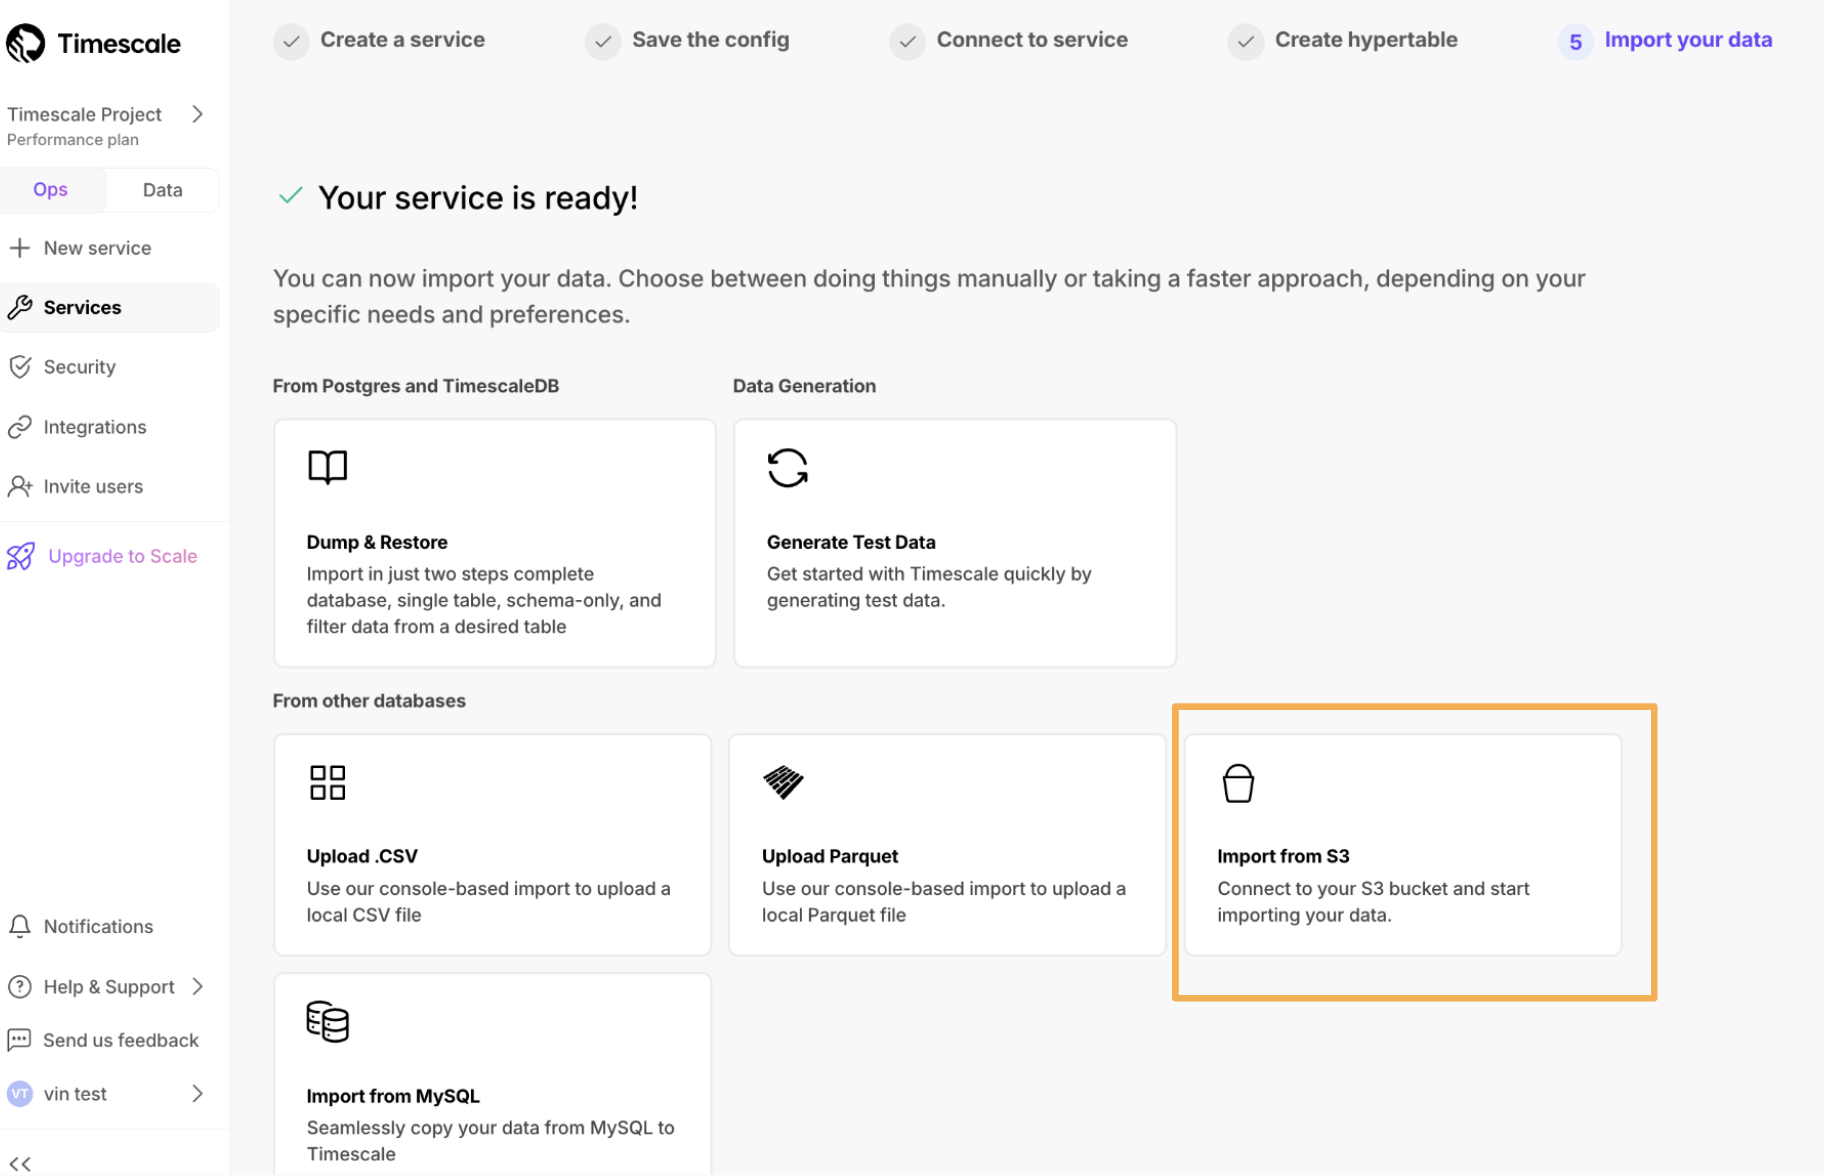
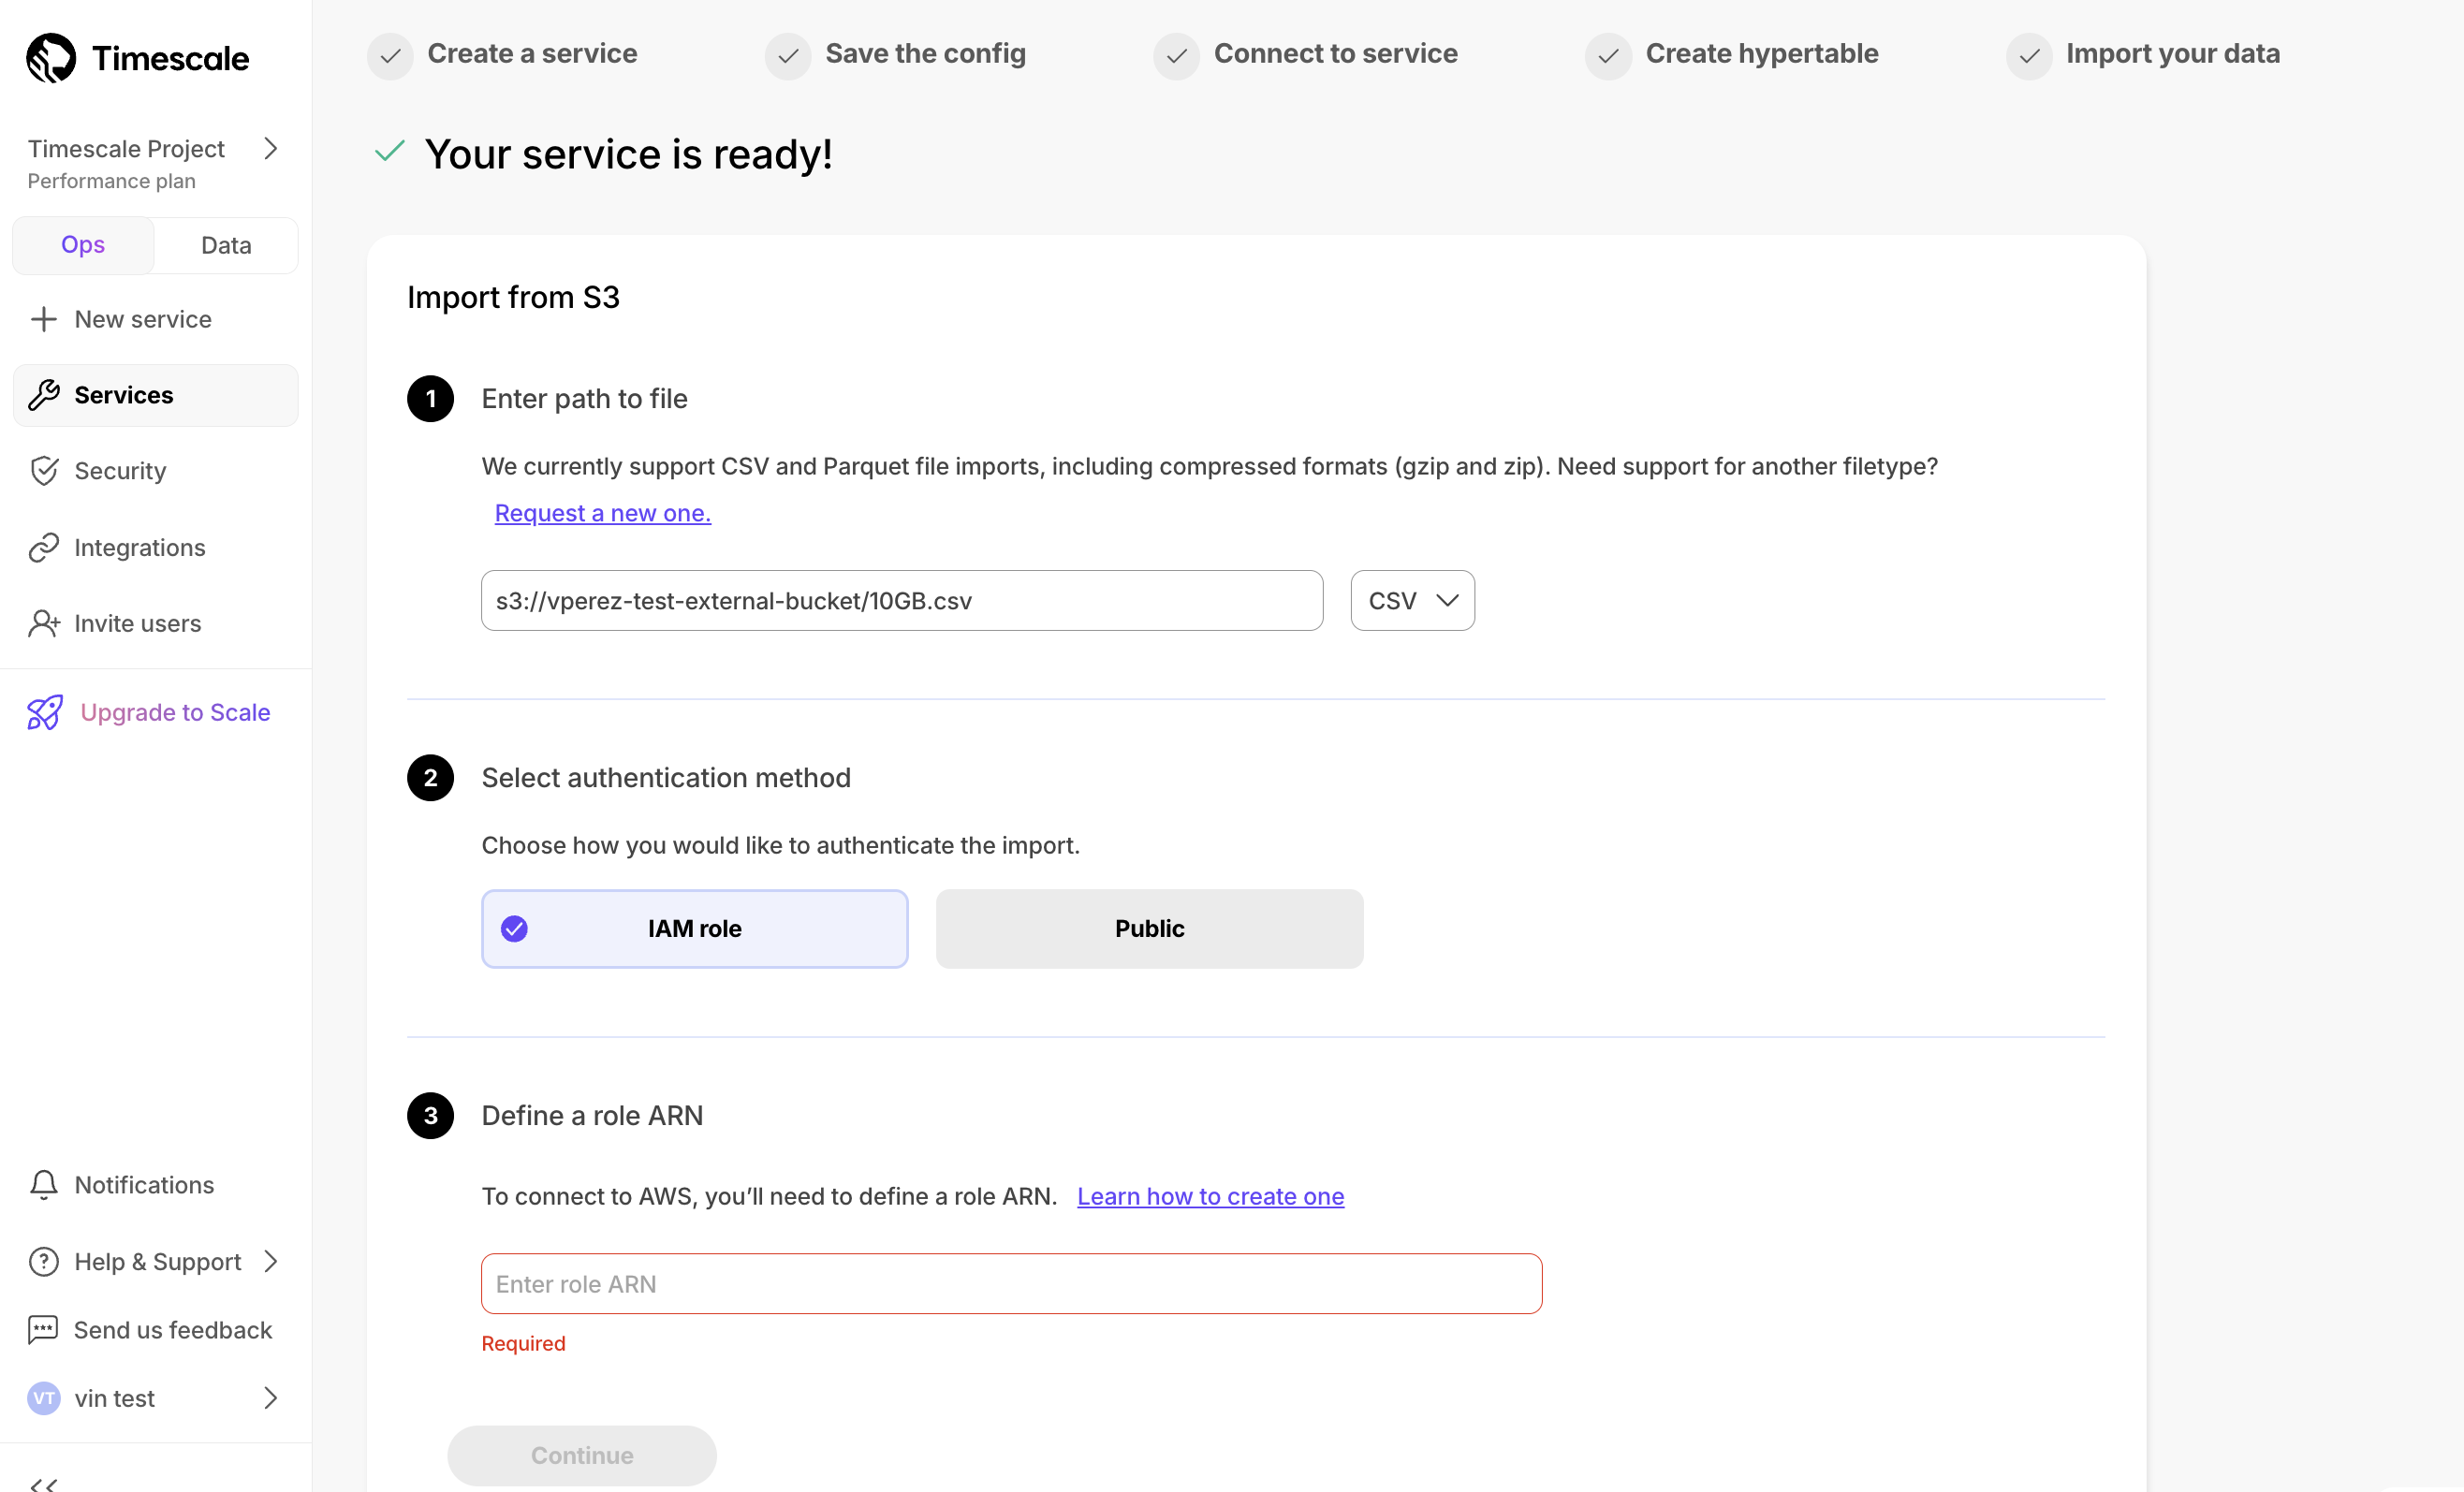
Self-Serve I/O Boost 📈
I/O Boost is an add-on for customers on Scale or Enterprise tiers that maximizes the I/O capacity of EBS storage to 16,000 IOPS and 1,000 MBps throughput per service. To enable I/O Boost, navigate to Services > Operations in Timescale Console. A simple toggle allows you to enable the feature, with pricing clearly displayed at $0.41/hour per node.
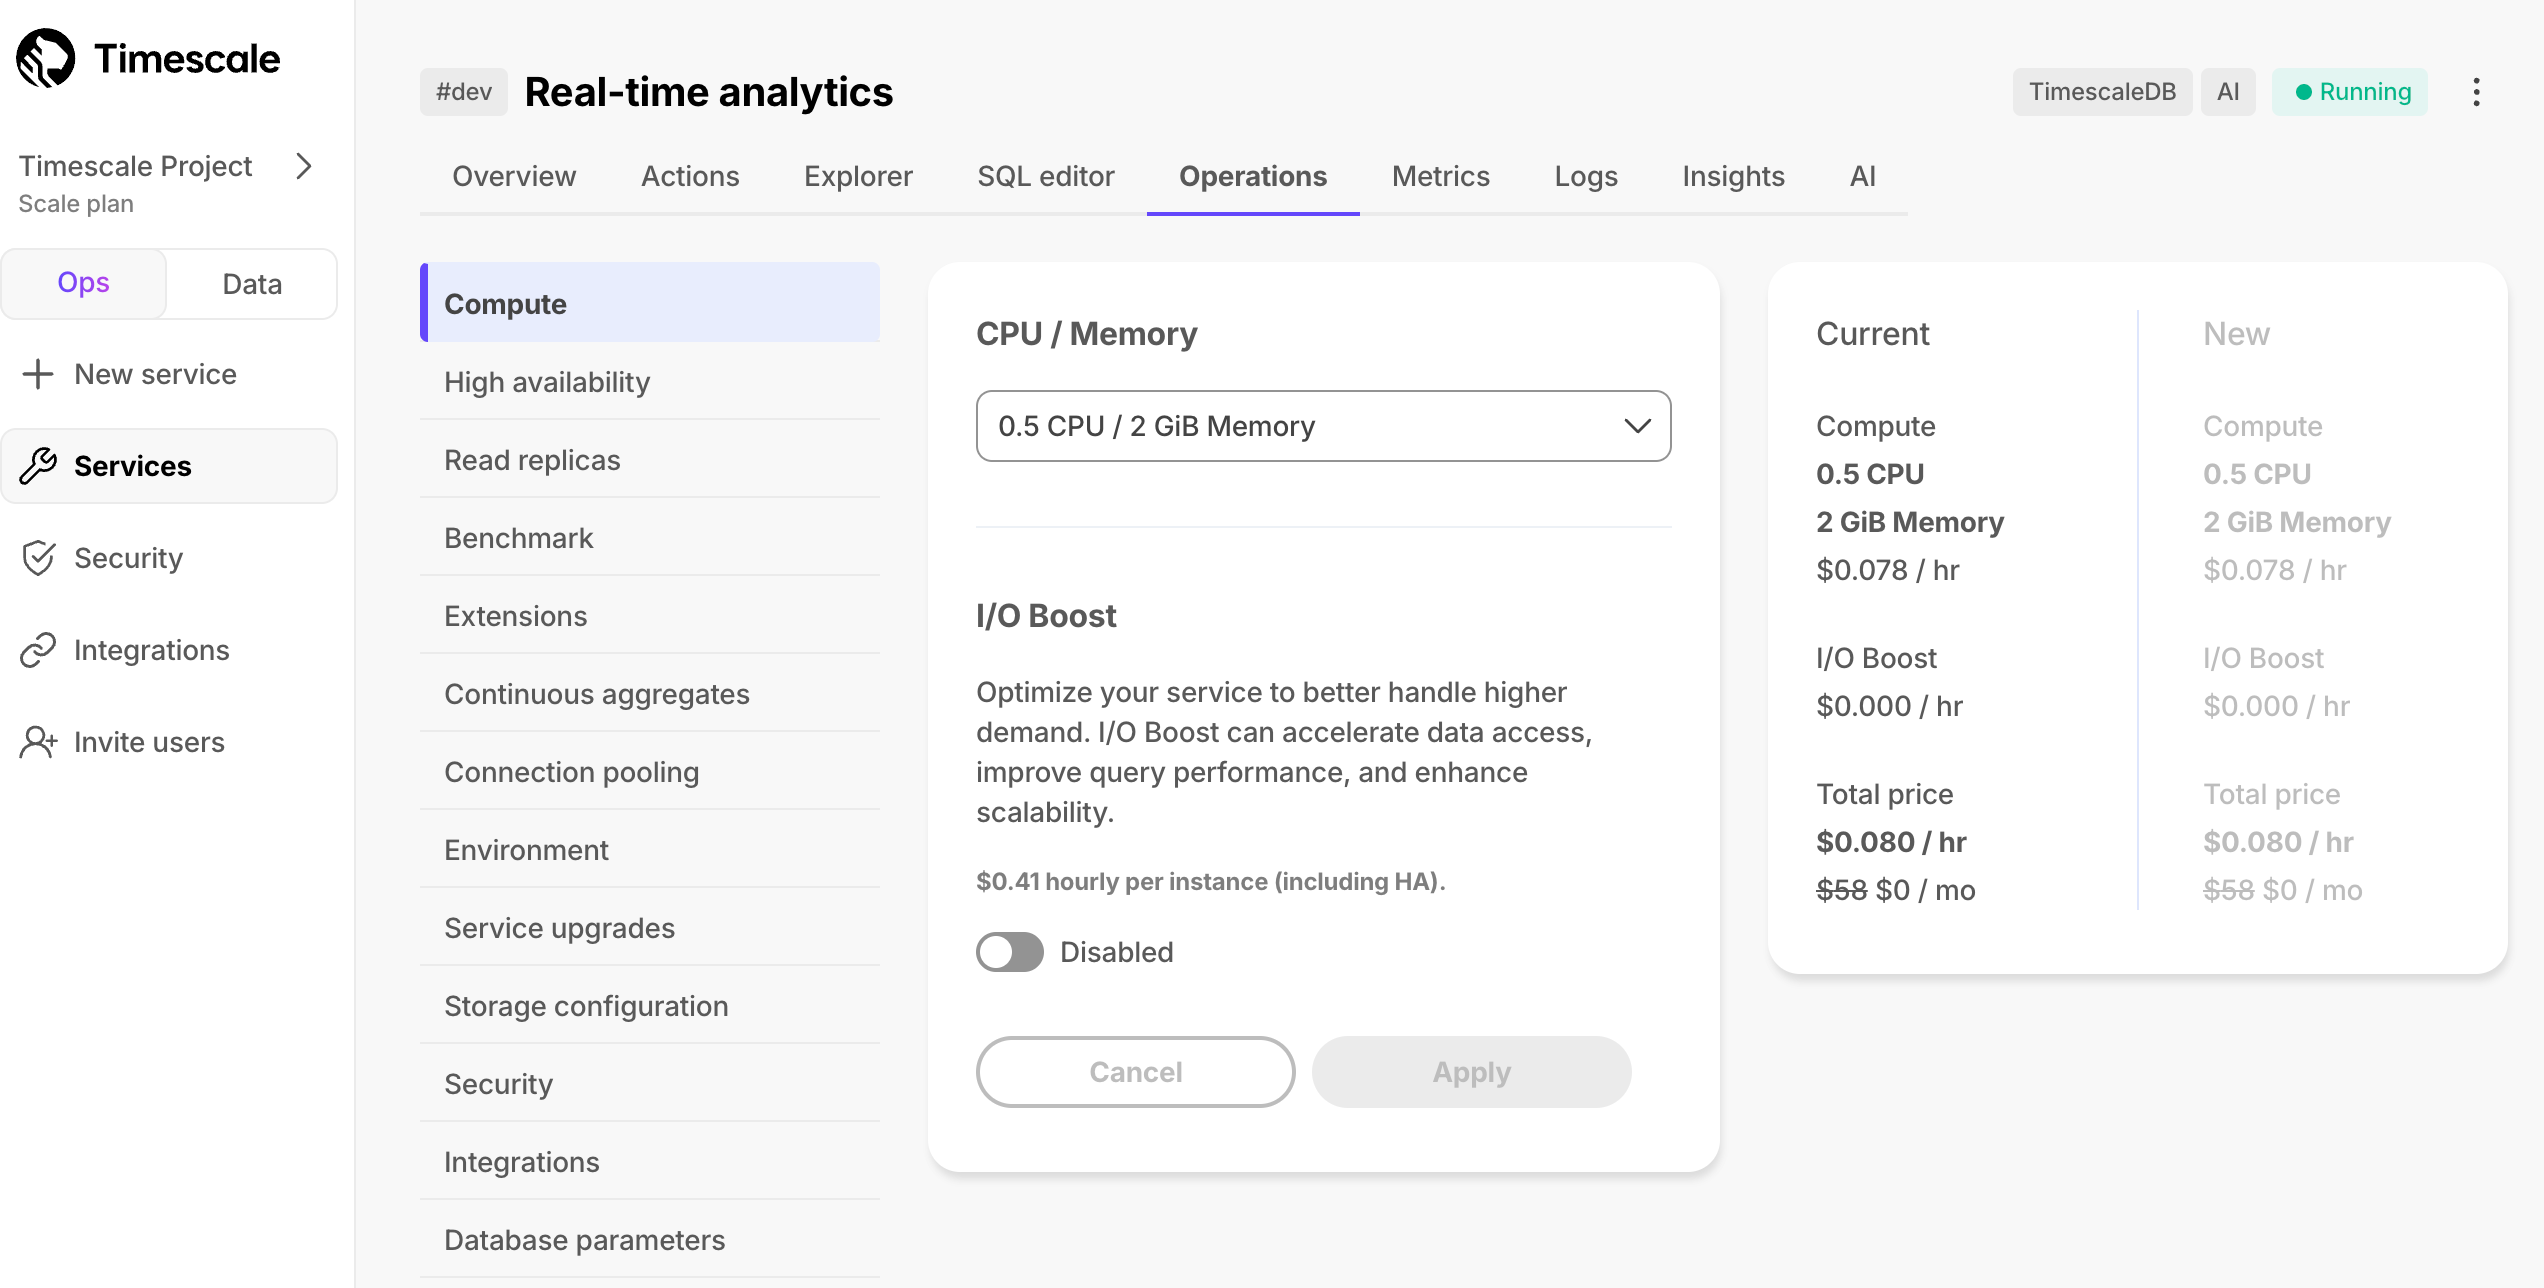
Jobs Explorer
See all the jobs associated with your service through a new Jobs tab. You can see the type of job, its status (Running, Paused, and others), and a detailed history of the last 100 runs, including success rates and runtime statistics.
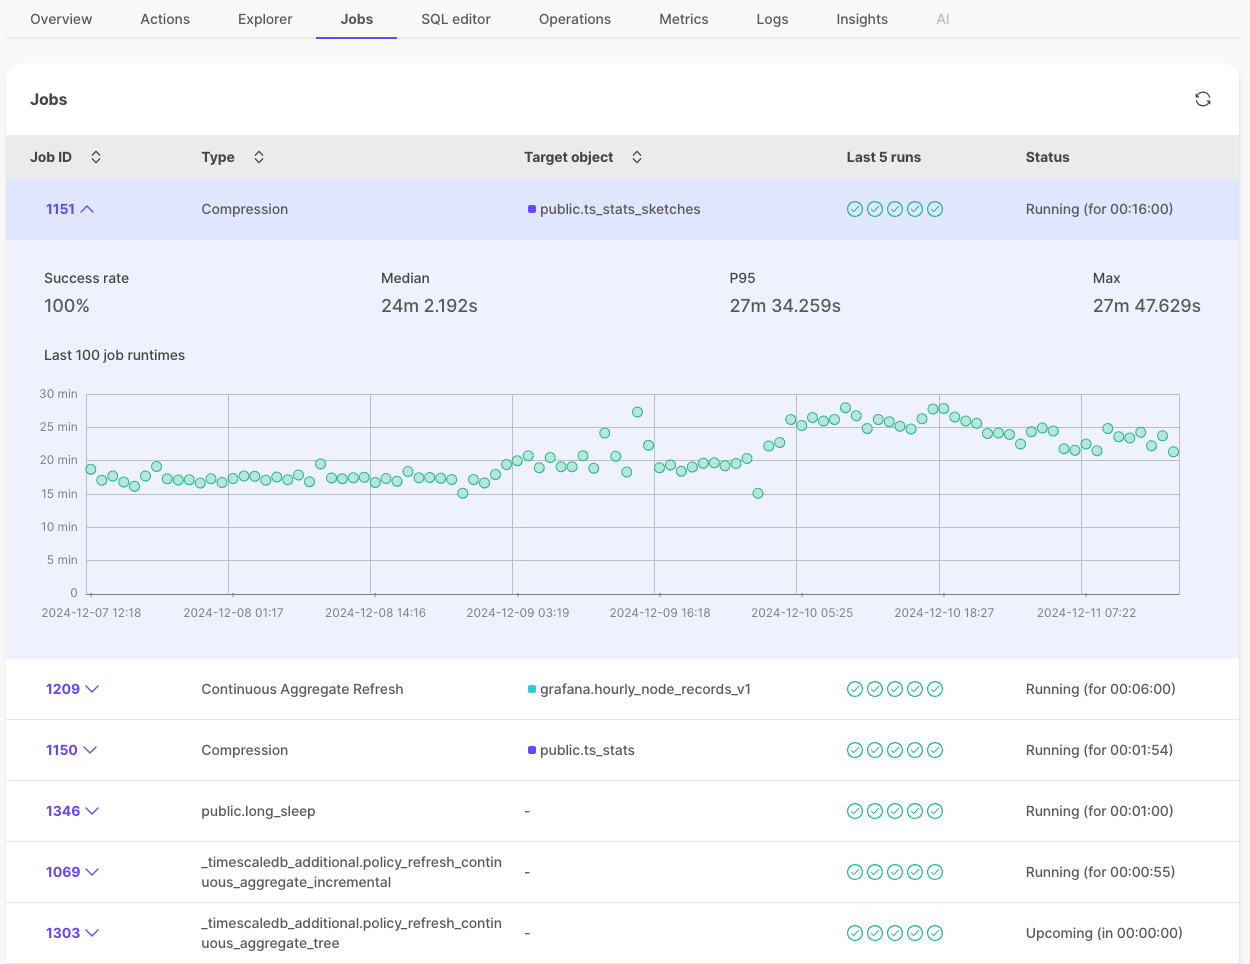
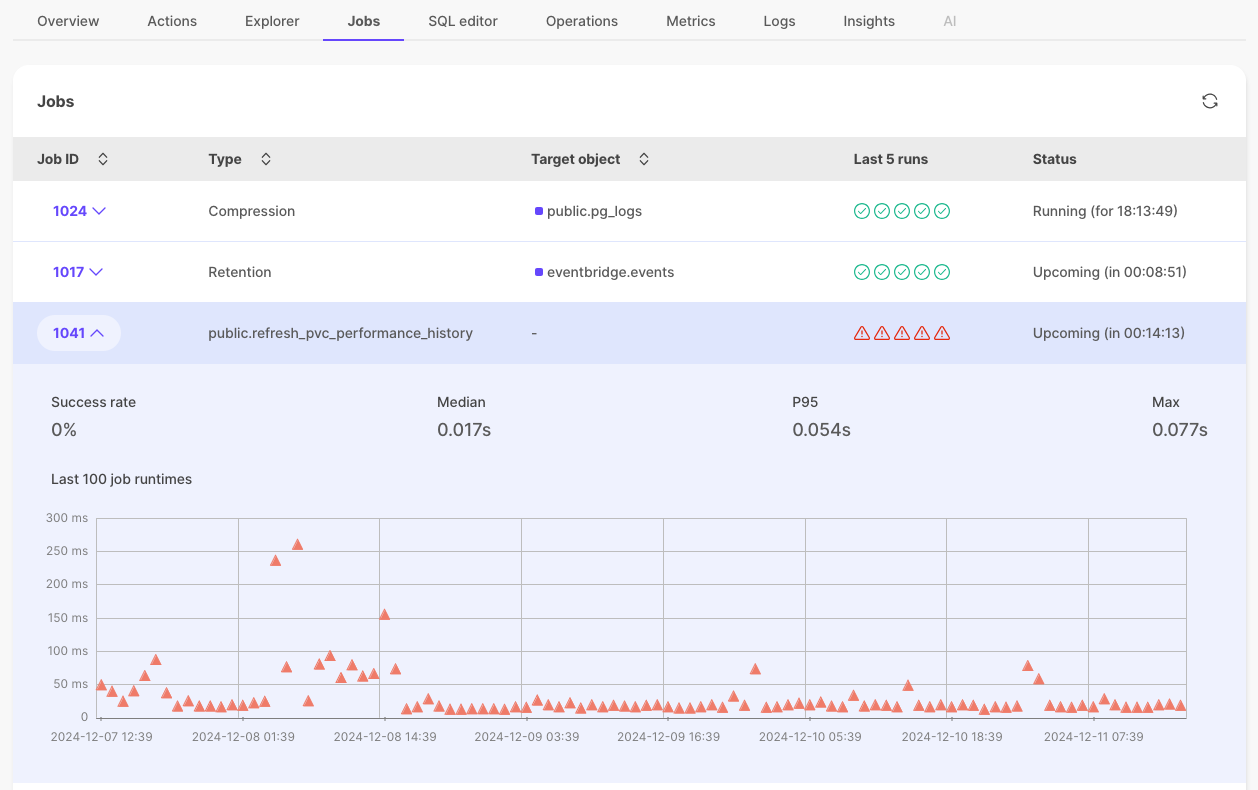
🛝 New service creation flow
December 6, 2024
- AI and Vector: the UI now lets you choose an option for creating AI and Vector-ready services right from the start. You no longer need to add the pgai, pgvector, and pgvectorscale extensions manually. You can combine this with time-series capabilities as well!
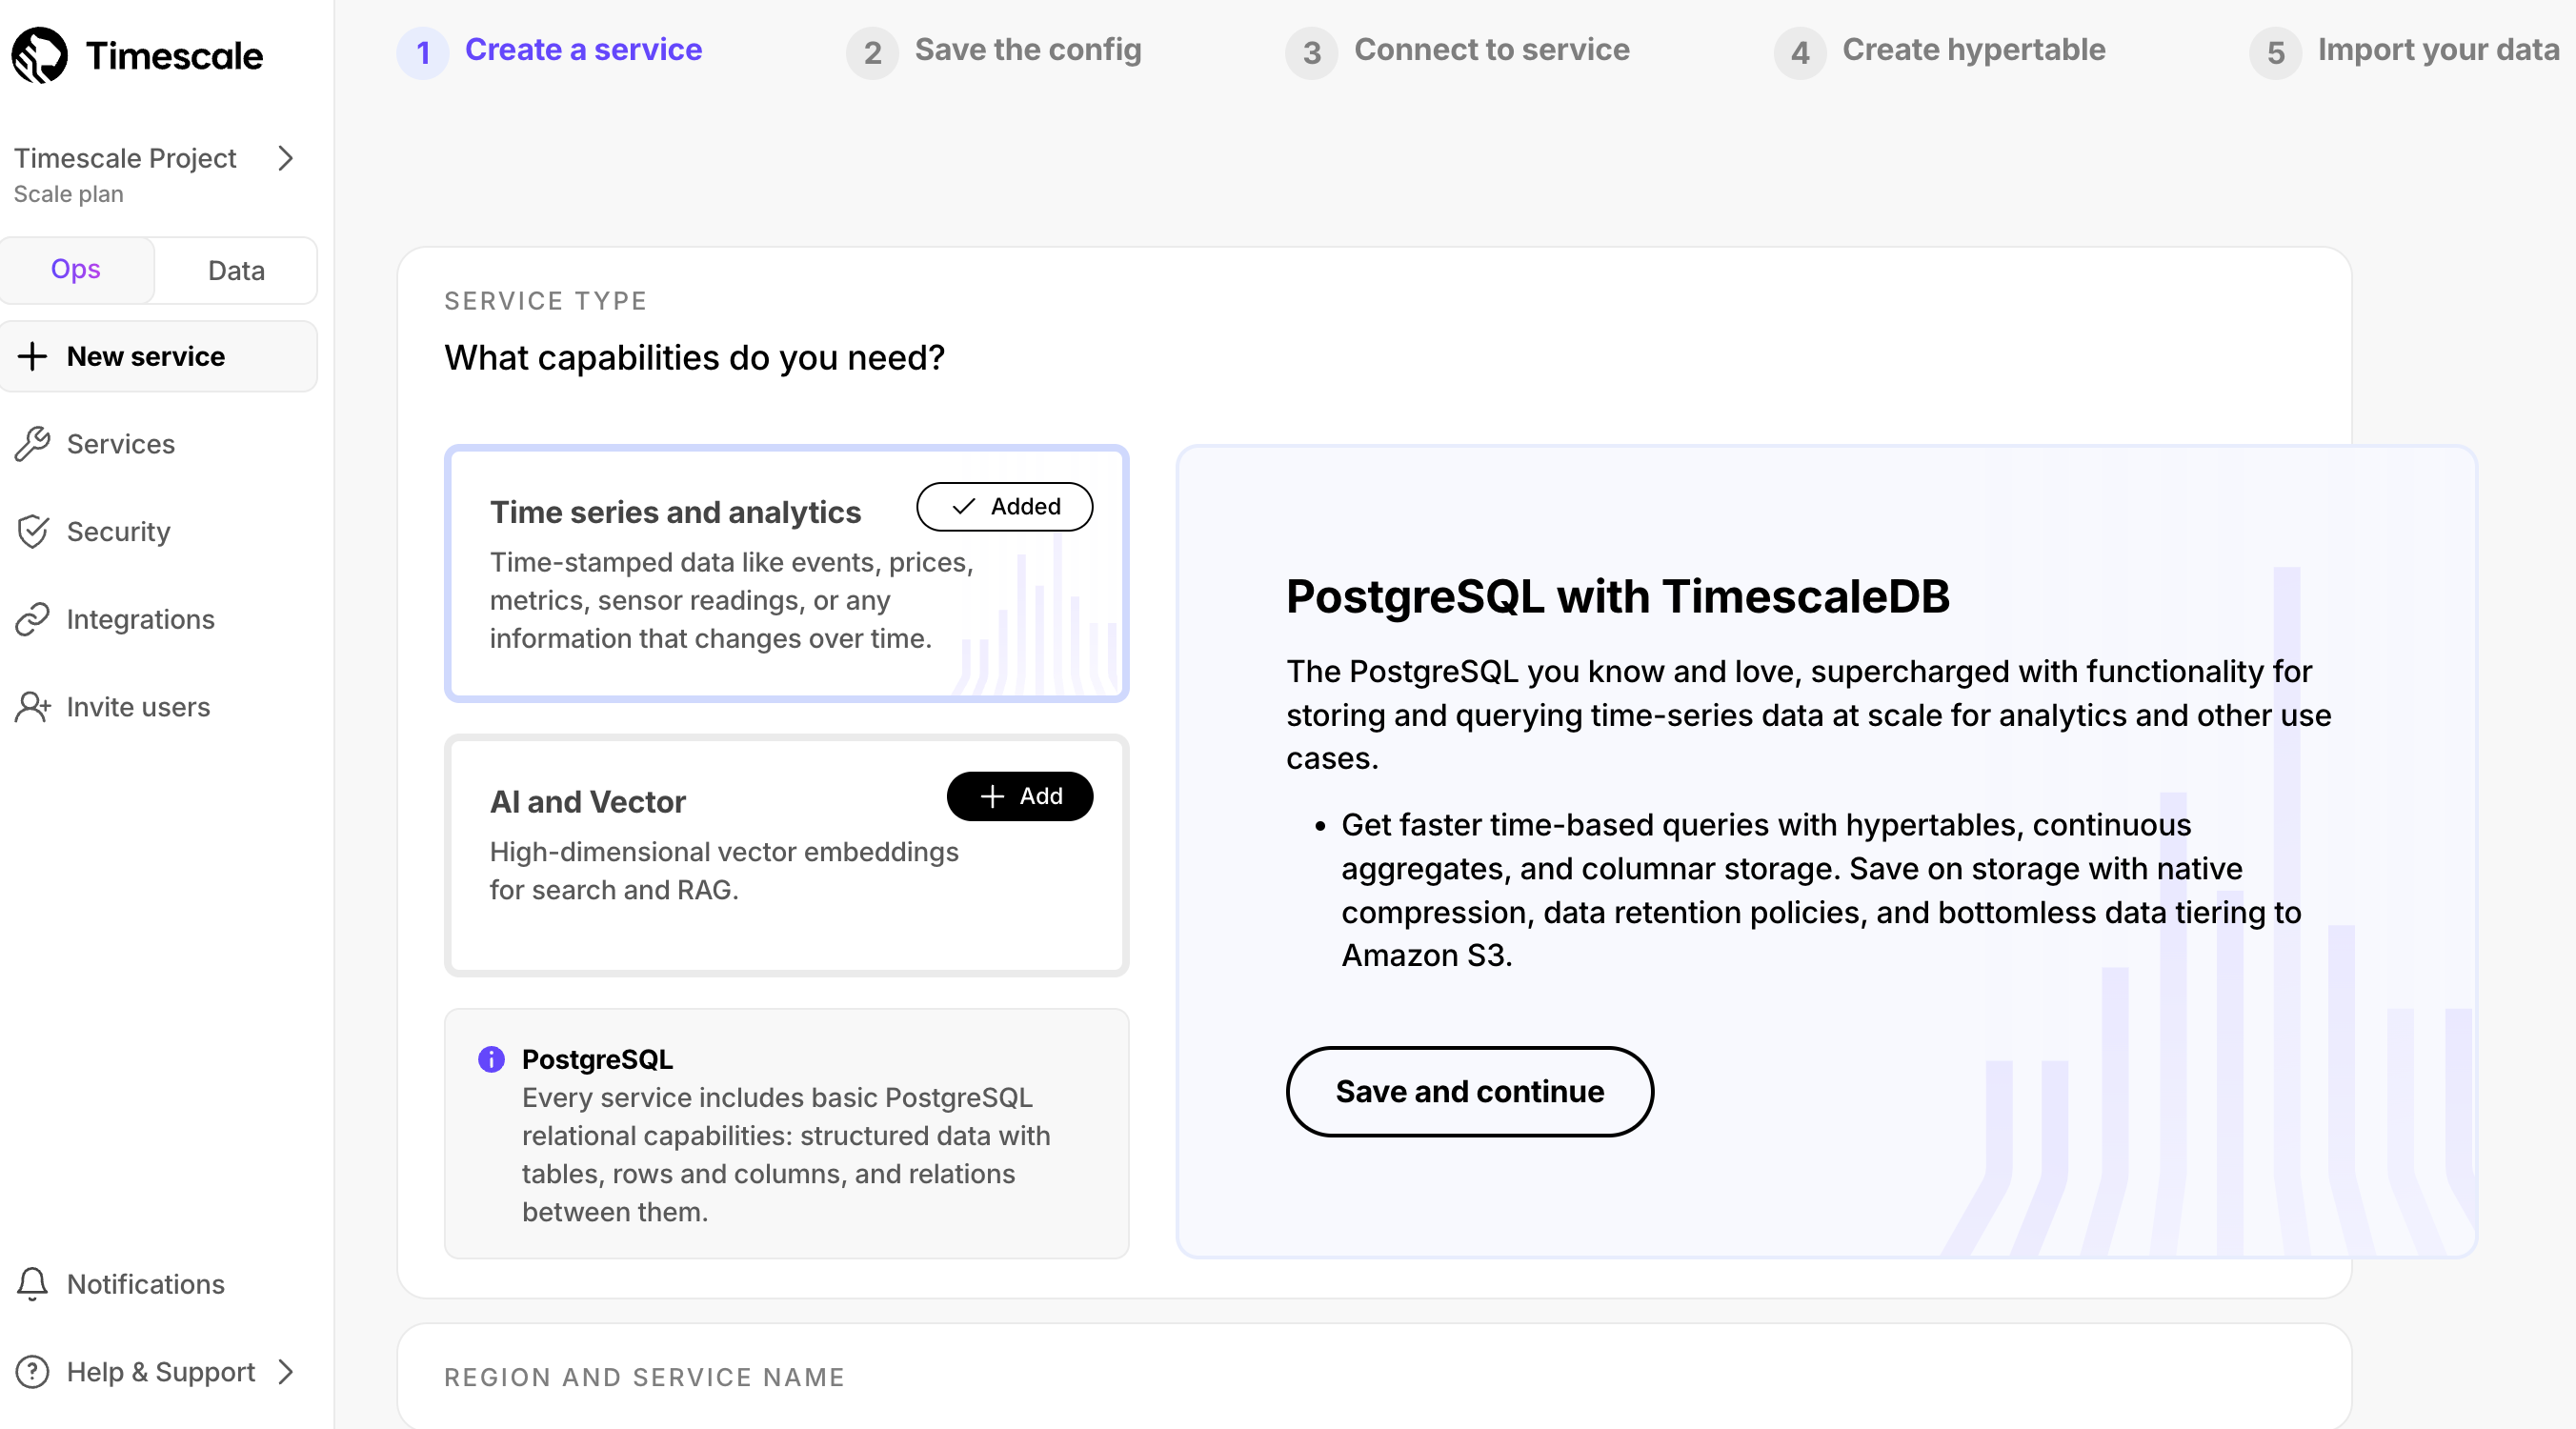
- Compute size recommendations: new (and old) users were sometimes unsure about what compute size to use for their workload. We now offer compute size recommendations based on how much data you plan to have in your service.
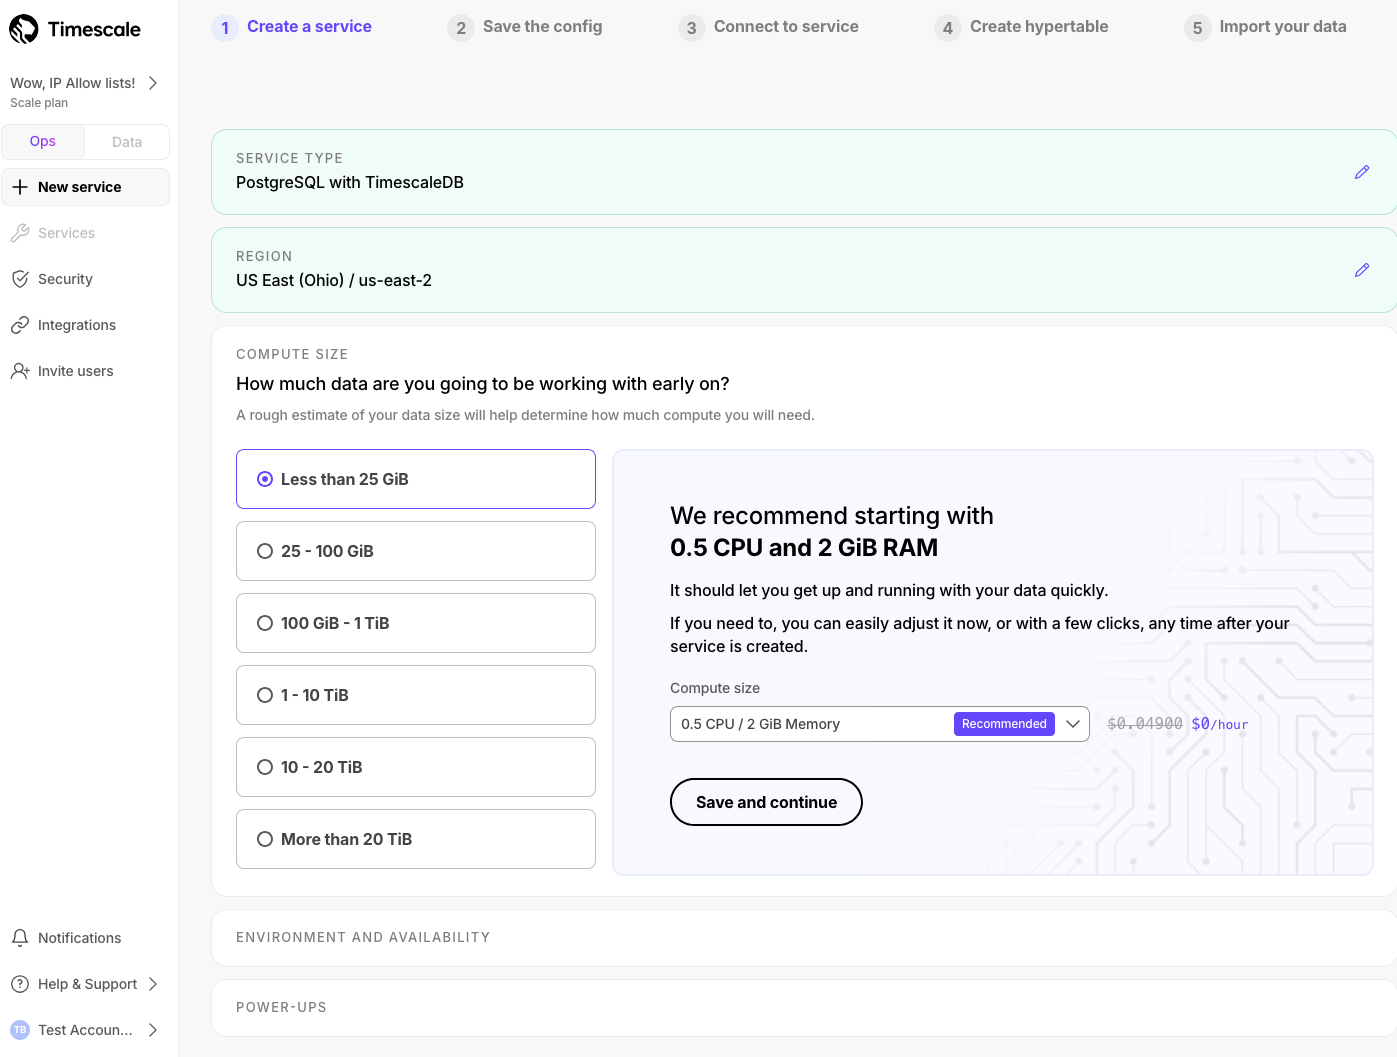
- More information about configuration options: we've made it clearer what each configuration option does, so that you can make more informed choices about how you want your service to be set up.
🗝️ IP Allow Lists!
November 21, 2024
IP Allow Lists let you specify a list of IP addresses that have access to your Timescale Cloud services and block any others. IP Allow Lists are a lightweight but effective solution for customers concerned with security and compliance. They enable you to prevent unauthorized connections without the need for a Virtual Private Cloud (VPC).
To get started, in Timescale Console, select a service, then click Operations > Security > IP Allow List, then create an IP Allow List.
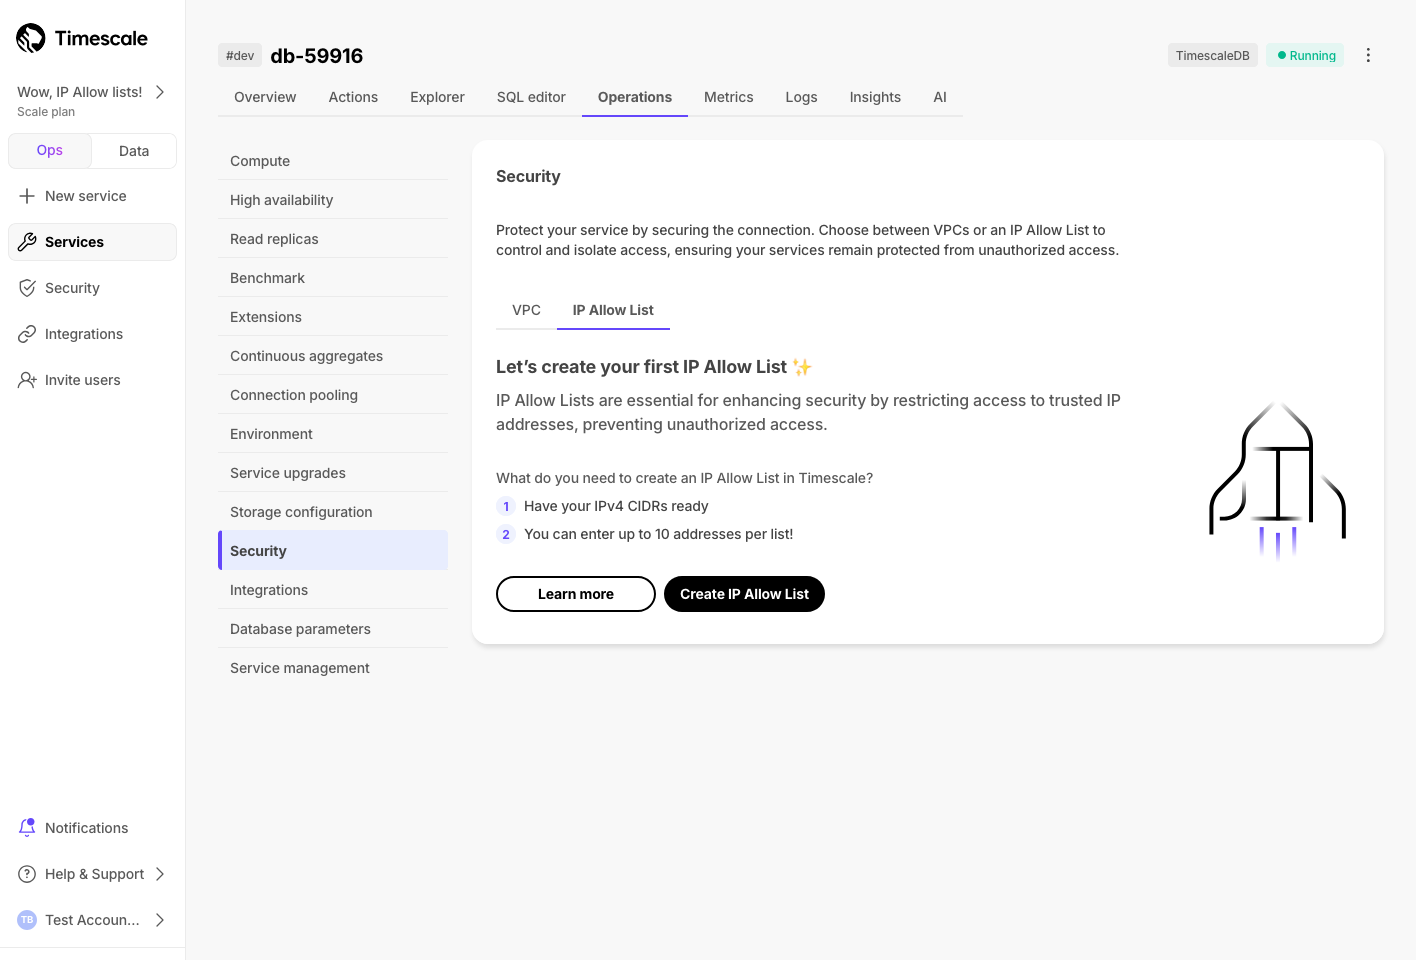
For more information, see our docs.
🤩 SQL Assistant, TimescaleDB v2.17, HIPAA compliance, and better logging
November 14, 2024
🤖 New AI companion: SQL Assistant
SQL Assistant uses AI to help you write SQL faster and more accurately.
- Real-time help: chat with models like OpenAI 4o and Claude 3.5 Sonnet to get help writing SQL. Describe what you want in natural language and have AI write the SQL for you.
Error resolution: when you run into an error, SQL Assistant proposes a recommended fix that you can choose to accept.
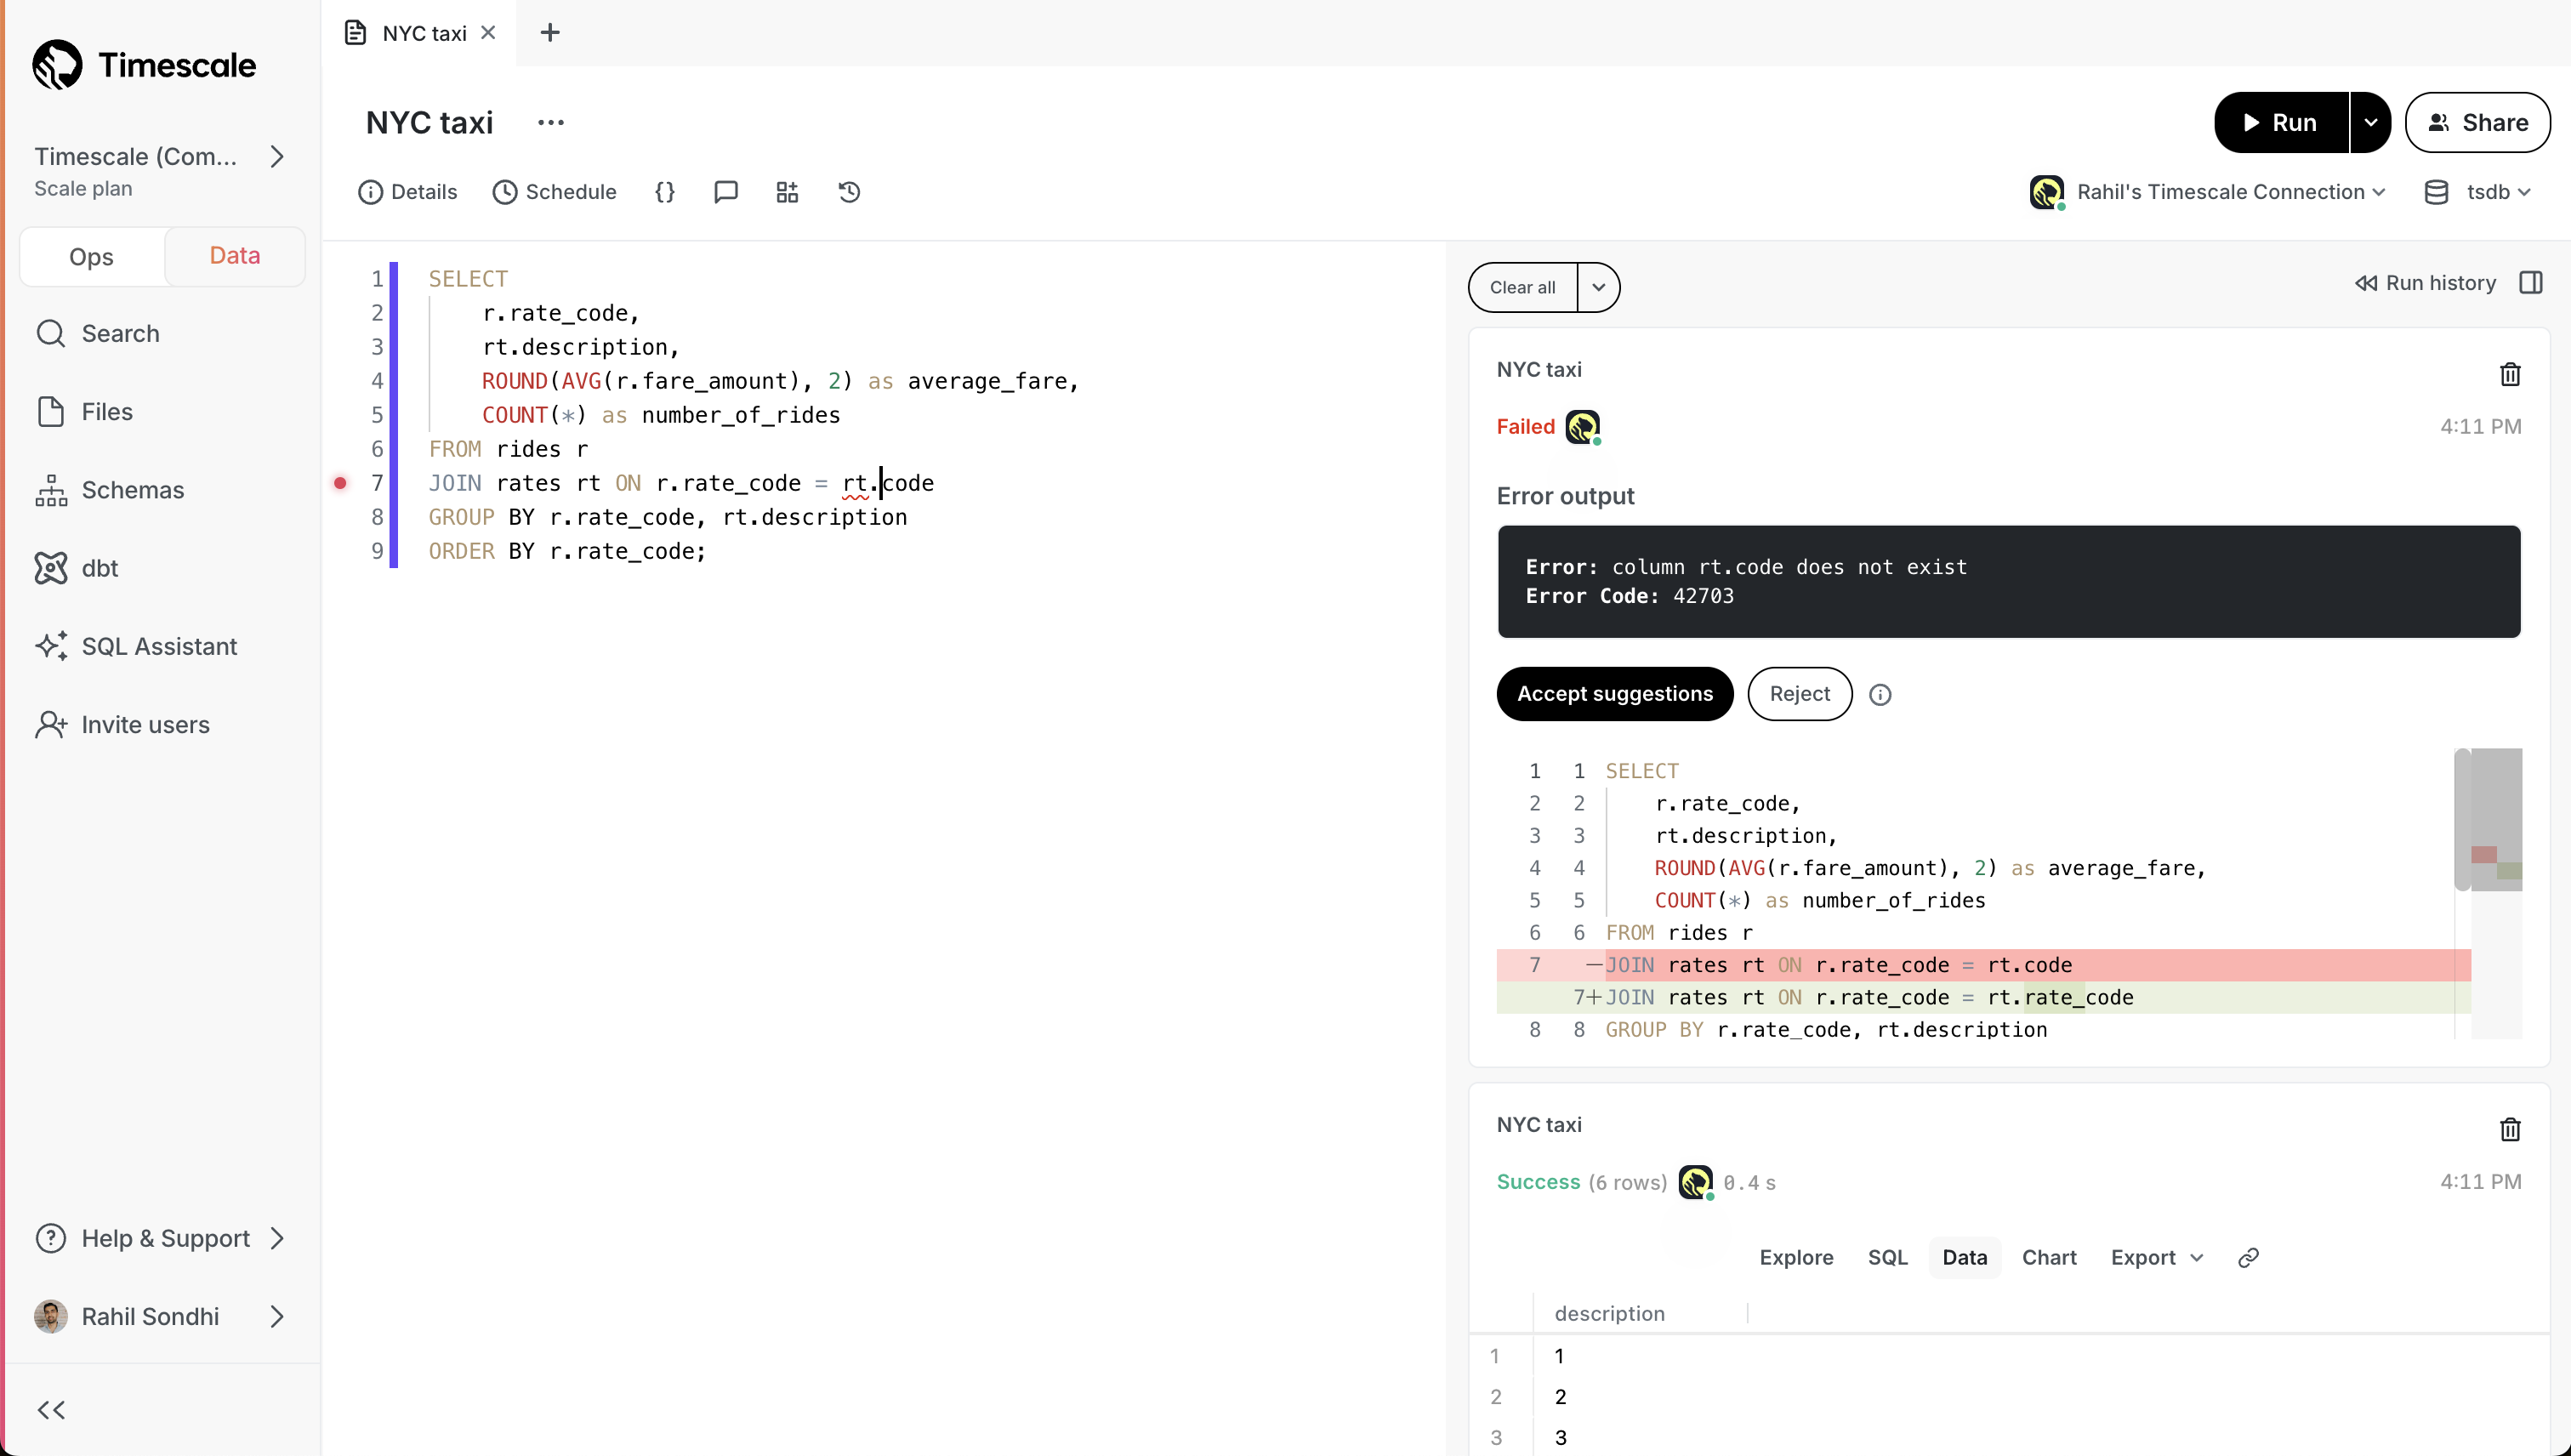
Generate titles and descriptions: click a button and SQL Assistant generates a title and description for your query. No more untitled queries!
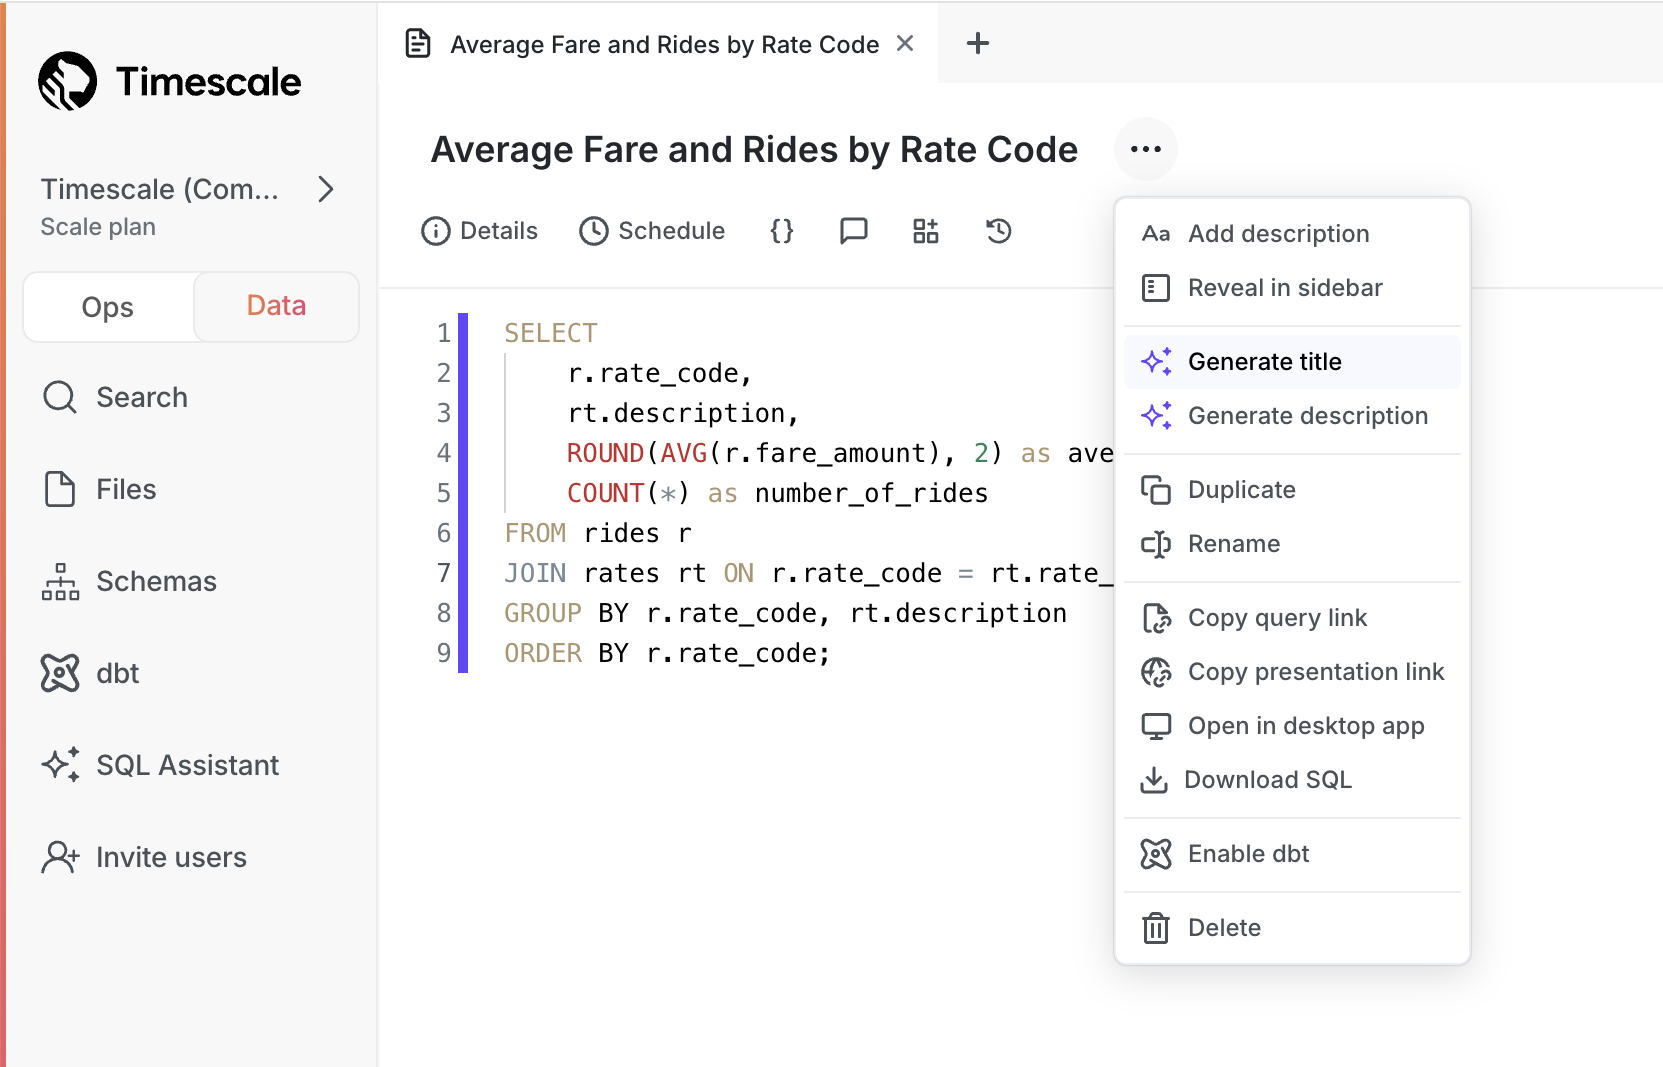
See our blog post or docs for full details!
🏄 TimescaleDB v2.17 - performance improvements for analytical queries and continuous aggregate refreshes
Starting this week, all new services created on Timescale Cloud use TimescaleDB v2.17. Existing services are upgraded gradually during their maintenance windows.
TimescaleDB v2.17 significantly improves the performance of continuous aggregate refreshes, and contains performance improvements for analytical queries and delete operations over compressed hypertables.
Best practice is to upgrade at the next available opportunity.
Highlighted features in TimescaleDB v2.17 are:
Significant performance improvements for continuous aggregate policies:
Continuous aggregate refresh now uses
mergeinstead of deleting old materialized data and re-inserting.Continuous aggregate policies are now more lightweight, use less system resources, and complete faster. This update:
- Decreases dramatically the amount of data that must be written on the continuous aggregate in the presence of a small number of changes
- Reduces the i/o cost of refreshing a continuous aggregate
- Generates fewer Write-Ahead Logs (
WAL)
Increased performance for real-time analytical queries over compressed hypertables:
We are excited to introduce additional Single Instruction, Multiple Data (SIMD) vectorization optimization to TimescaleDB. This release supports vectorized execution for queries that group by using the
segment_bycolumn(s), and aggregate using thesum,count,avg,min, andmaxbasic aggregate functions.Stay tuned for more to come in follow-up releases! Support for grouping on additional columns, filtered aggregation, vectorized expressions, and
time_bucketis coming soon.Improved performance of deletes on compressed hypertables when a large amount of data is affected.
This improvement speeds up operations that delete whole segments by skipping the decompression step. It is enabled for all deletes that filter by the
segment_bycolumn(s).
HIPAA compliance
Timescale Cloud's Enterprise plan is now HIPAA (Health Insurance Portability and Accountability Act) compliant. This allows organizations to securely manage and analyze sensitive healthcare data, ensuring they meet regulatory requirements while building compliant applications.
Expanded logging within Timescale Console
Customers can now access more than just the most recent 500 logs within the Timescale Console. We've updated the user experience, including scrollbar with infinite scrolling capabilities.
✨ Connect to Timescale from .NET Stack and check status of recent jobs
November 07, 2024
Connect to Timescale with your .NET stack
We've added instructions for connecting to Timescale using your .NET workflow. In Console after service creation, or in the Actions tab, you can now select .NET from the developer library list. The guide demonstrates how to use Npgsql to integrate Timescale with your existing software stack.
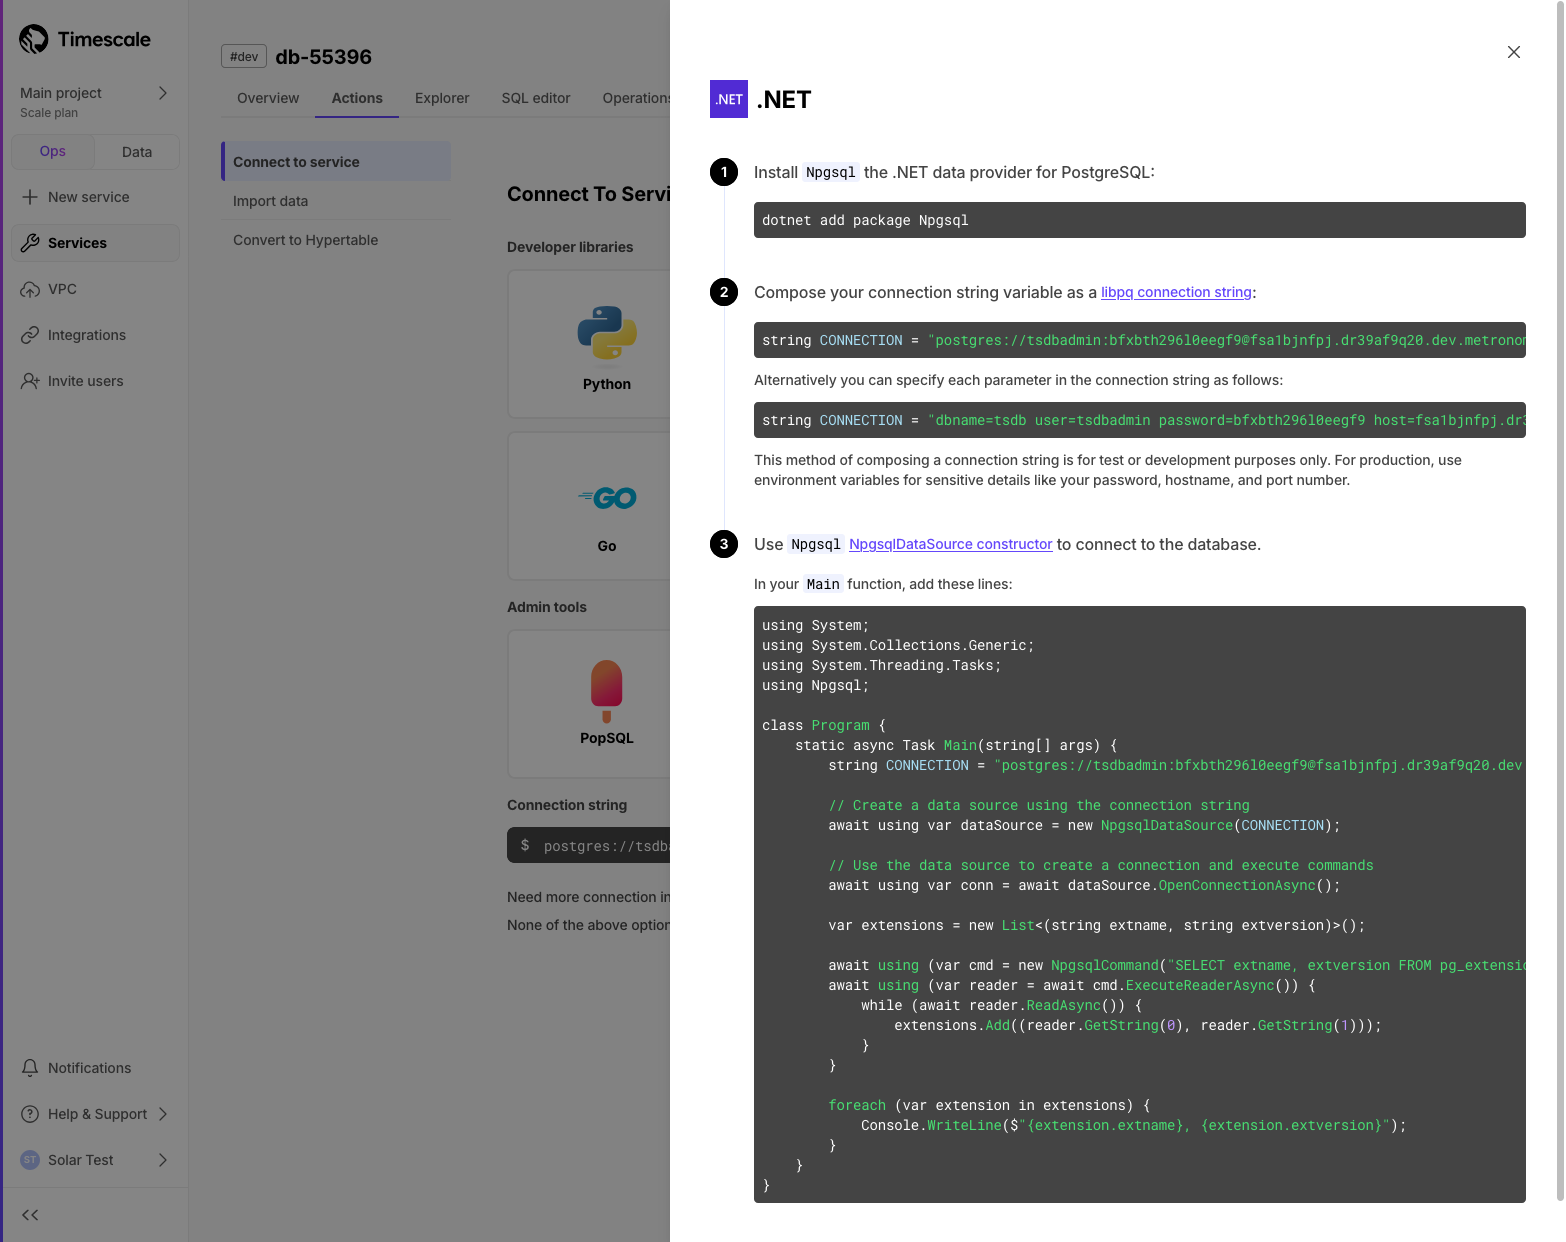
✅ Last 5 jobs status
In the Jobs section of the Explorer, users can now see the status (completed/failed) of the last 5 runs of each job.
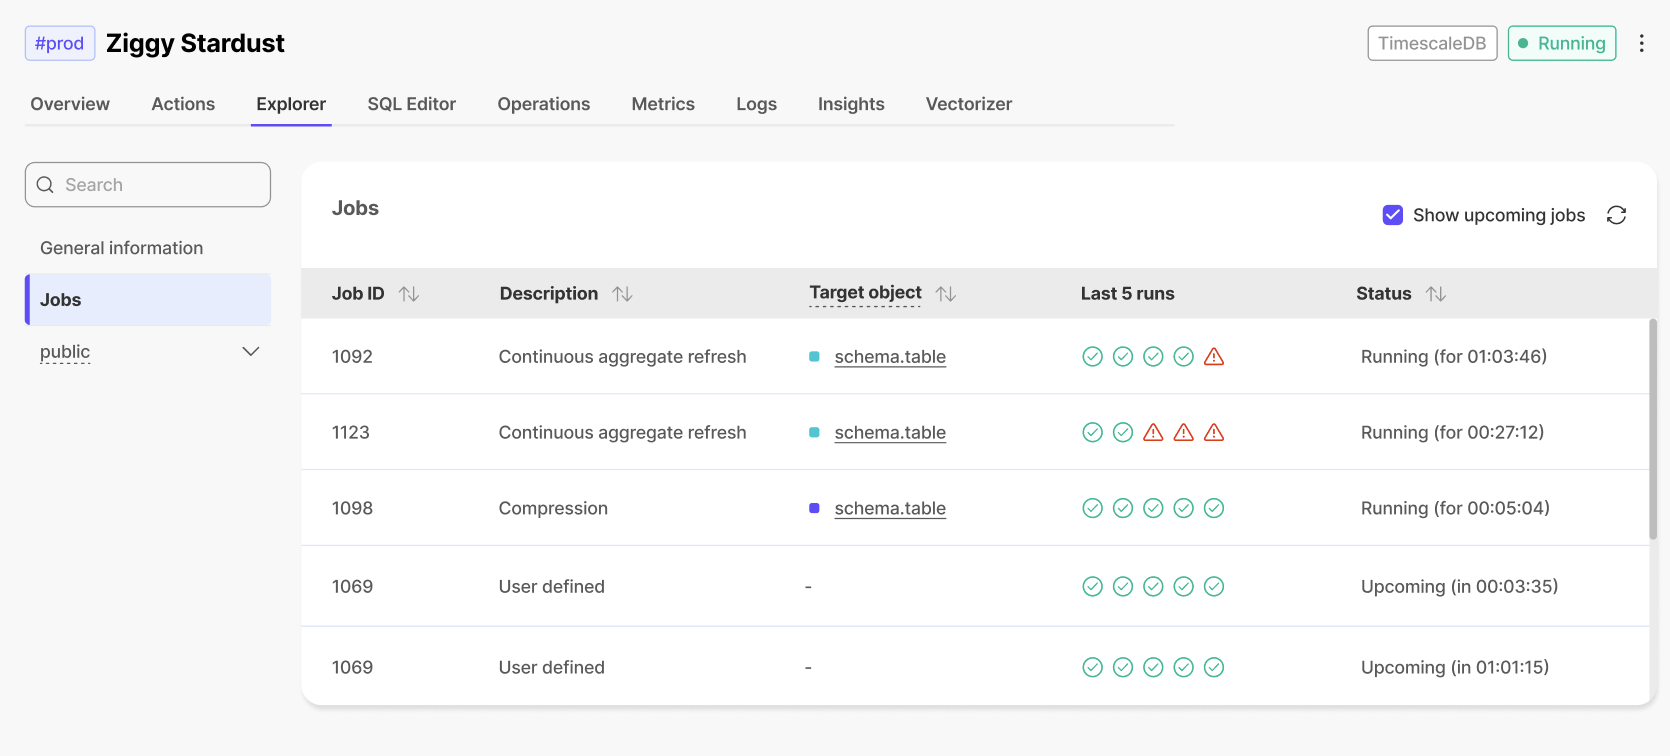
🎃 New AI, data integration, and performance enhancements
October 31, 2024
Pgai Vectorizer: vector embeddings as database indexes (early access)
This early access feature enables you to automatically create, update, and maintain embeddings as your data changes. Just like an index, Timescale handles all the complexity: syncing, versioning, and cleanup happen automatically. This means no manual tracking, zero maintenance burden, and the freedom to rapidly experiment with different embedding models and chunking strategies without building new pipelines. Navigate to the AI tab in your service overview and follow the instructions to add your OpenAI API key and set up your first vectorizer or read our guide to automate embedding generation with pgai Vectorizer for more details.

Postgres-to-Postgres foreign data wrappers:
Fetch and query data from multiple Postgres databases, including time-series data in hypertables, directly within Timescale Cloud using foreign data wrappers (FDW). No more complicated ETL processes or external tools—just seamless integration right within your SQL editor. This feature is ideal for developers who manage multiple Postgres and time-series instances and need quick, easy access to data across databases.
Faster queries over tiered data
This release adds support for runtime chunk exclusion for queries that need to access tiered storage. Chunk exclusion now works with queries that use stable expressions in the WHERE clause. The most common form of this type of query is:
SELECT * FROM hypertable WHERE timestamp_col > now() - '100 days'::interval
For more info on queries with immutable/stable/volatile filters, check our blog post on Implementing constraint exclusion for faster query performance.
If you no longer want to use tiered storage for a particular hypertable, you can now disable tiering and drop the associated tiering metadata on the hypertable with a call to disable_tiering function.
Chunk interval recommendations
Timescale Console now shows recommendations for services with too many small chunks in their hypertables. Recommendations for new intervals that improve service performance are displayed for each underperforming service and hypertable. Users can then change their chunk interval and boost performance within Timescale Console.

💡 Help with hypertables and faster notebooks
October 18, 2024
🧙Hypertable creation wizard
After creating a service, users can now create a hypertable directly in Timescale Console by first creating a table, then converting it into a hypertable. This is possible using the in-console SQL editor. All standard hypertable configuration options are supported, along with any customization of the underlying table schema.
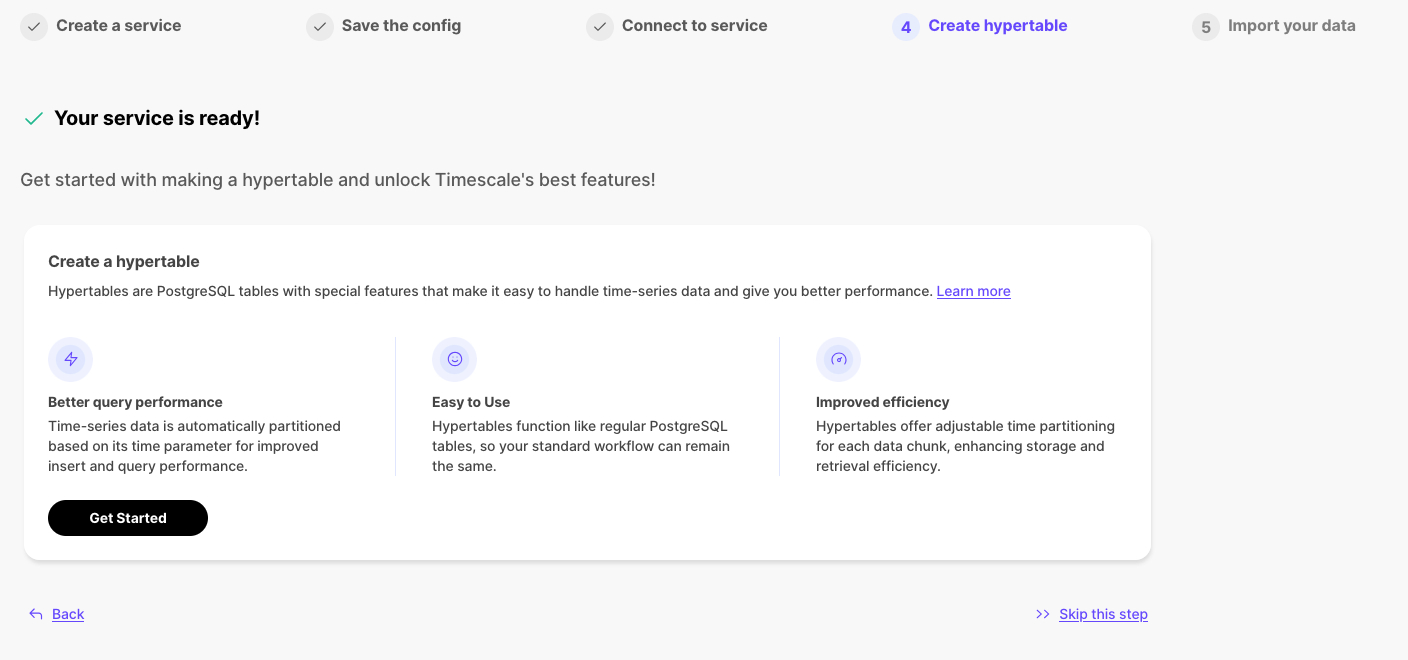
🍭 PopSQL Notebooks
The newest version of Data Mode Notebooks is now waaaay faster. Why? We've incorporated the newly developed v3 of our query engine that currently powers Timescale Console's SQL Editor. Check out the difference in query response times.
✨ Production-Ready Low-Downtime Migrations, MySQL Import, Actions Tab, and Current Lock Contention Visibility in SQL Editor
October 10, 2024
🏗️ Live Migrations v1.0 Release
Last year, we began developing a solution for low-downtime migration from Postgres and TimescaleDB. Since then, this solution has evolved significantly, featuring enhanced functionality, improved reliability, and performance optimizations. We're now proud to announce that live migration is production-ready with the release of version 1.0.
Many of our customers have successfully migrated databases to Timescale using live migration, with some databases as large as a few terabytes in size.
🔁 Actions Tab
As part of the service creation flow, we offer the following:
- Connect to services from different sources
- Import and migrate data from various sources
- Create hypertables
Previously, these actions were only visible during the service creation process and couldn't be accessed later. Now, these actions are persisted within the service, allowing users to leverage them on-demand whenever they're ready to perform these tasks.
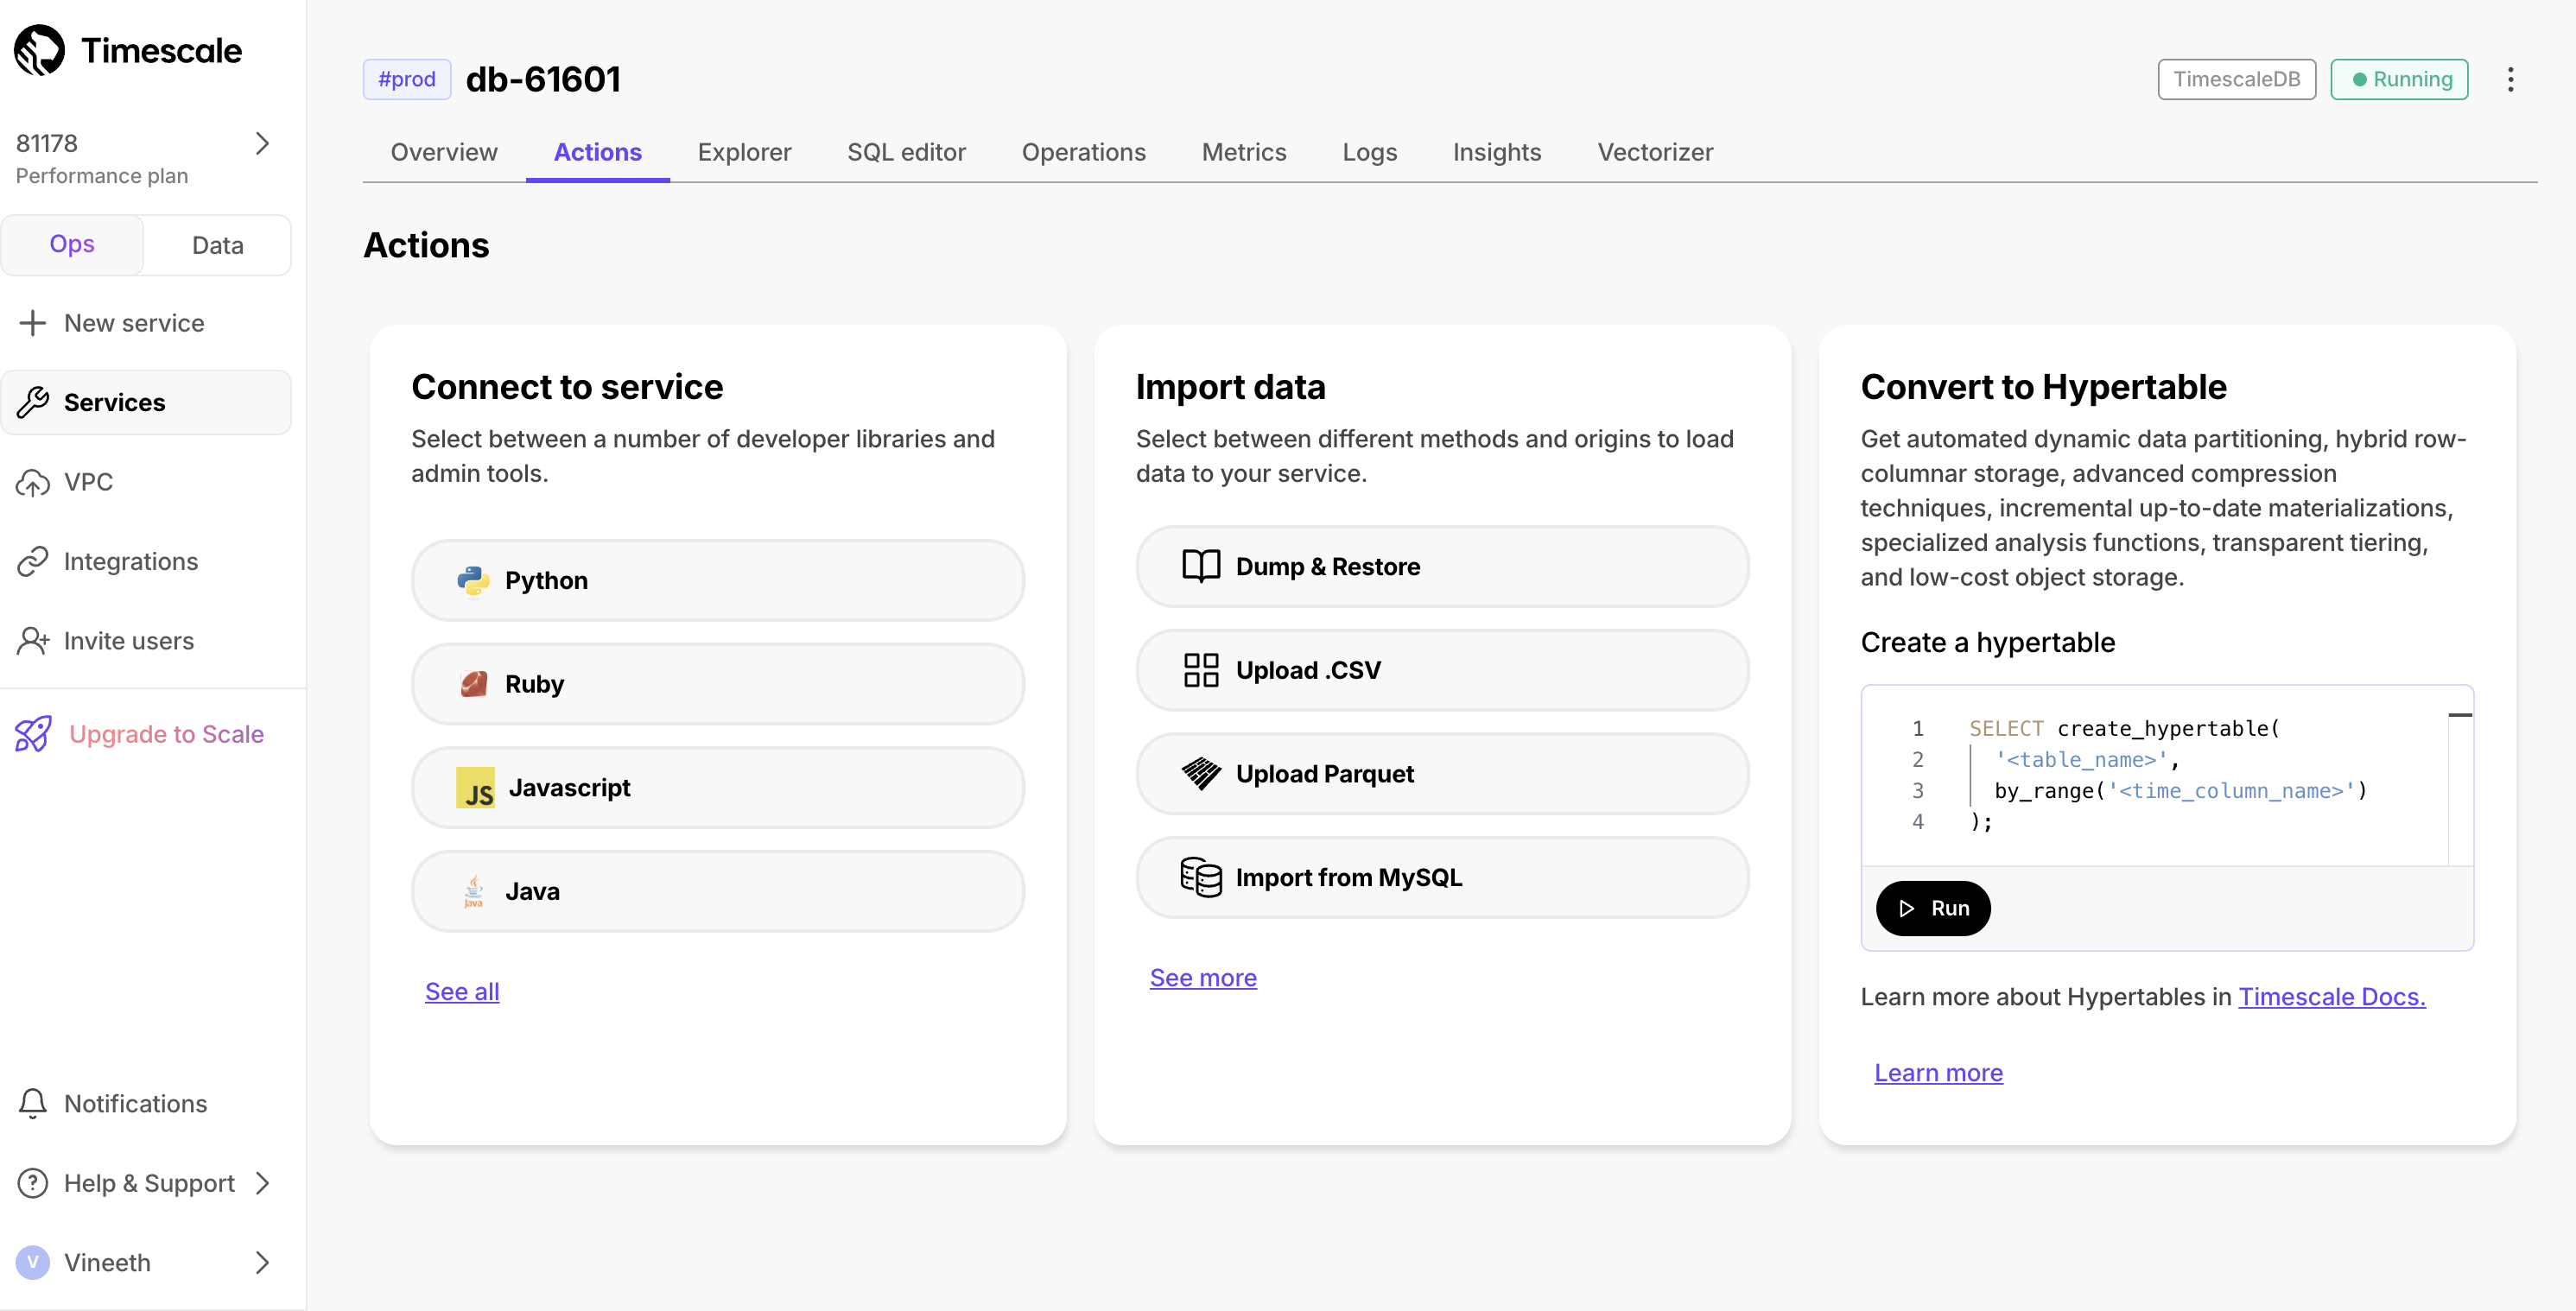
🧭 Import Data from MySQL
We've noticed users struggling to convert their MySQL schema and data into their Timescale Cloud services. This was due to the semantic differences between MySQL and Postgres. To simplify this process, we now offer easy-to-follow instructions to import data from MySQL to Timescale Cloud. This feature is available as part of the data import wizard, under the Import from MySQL option.
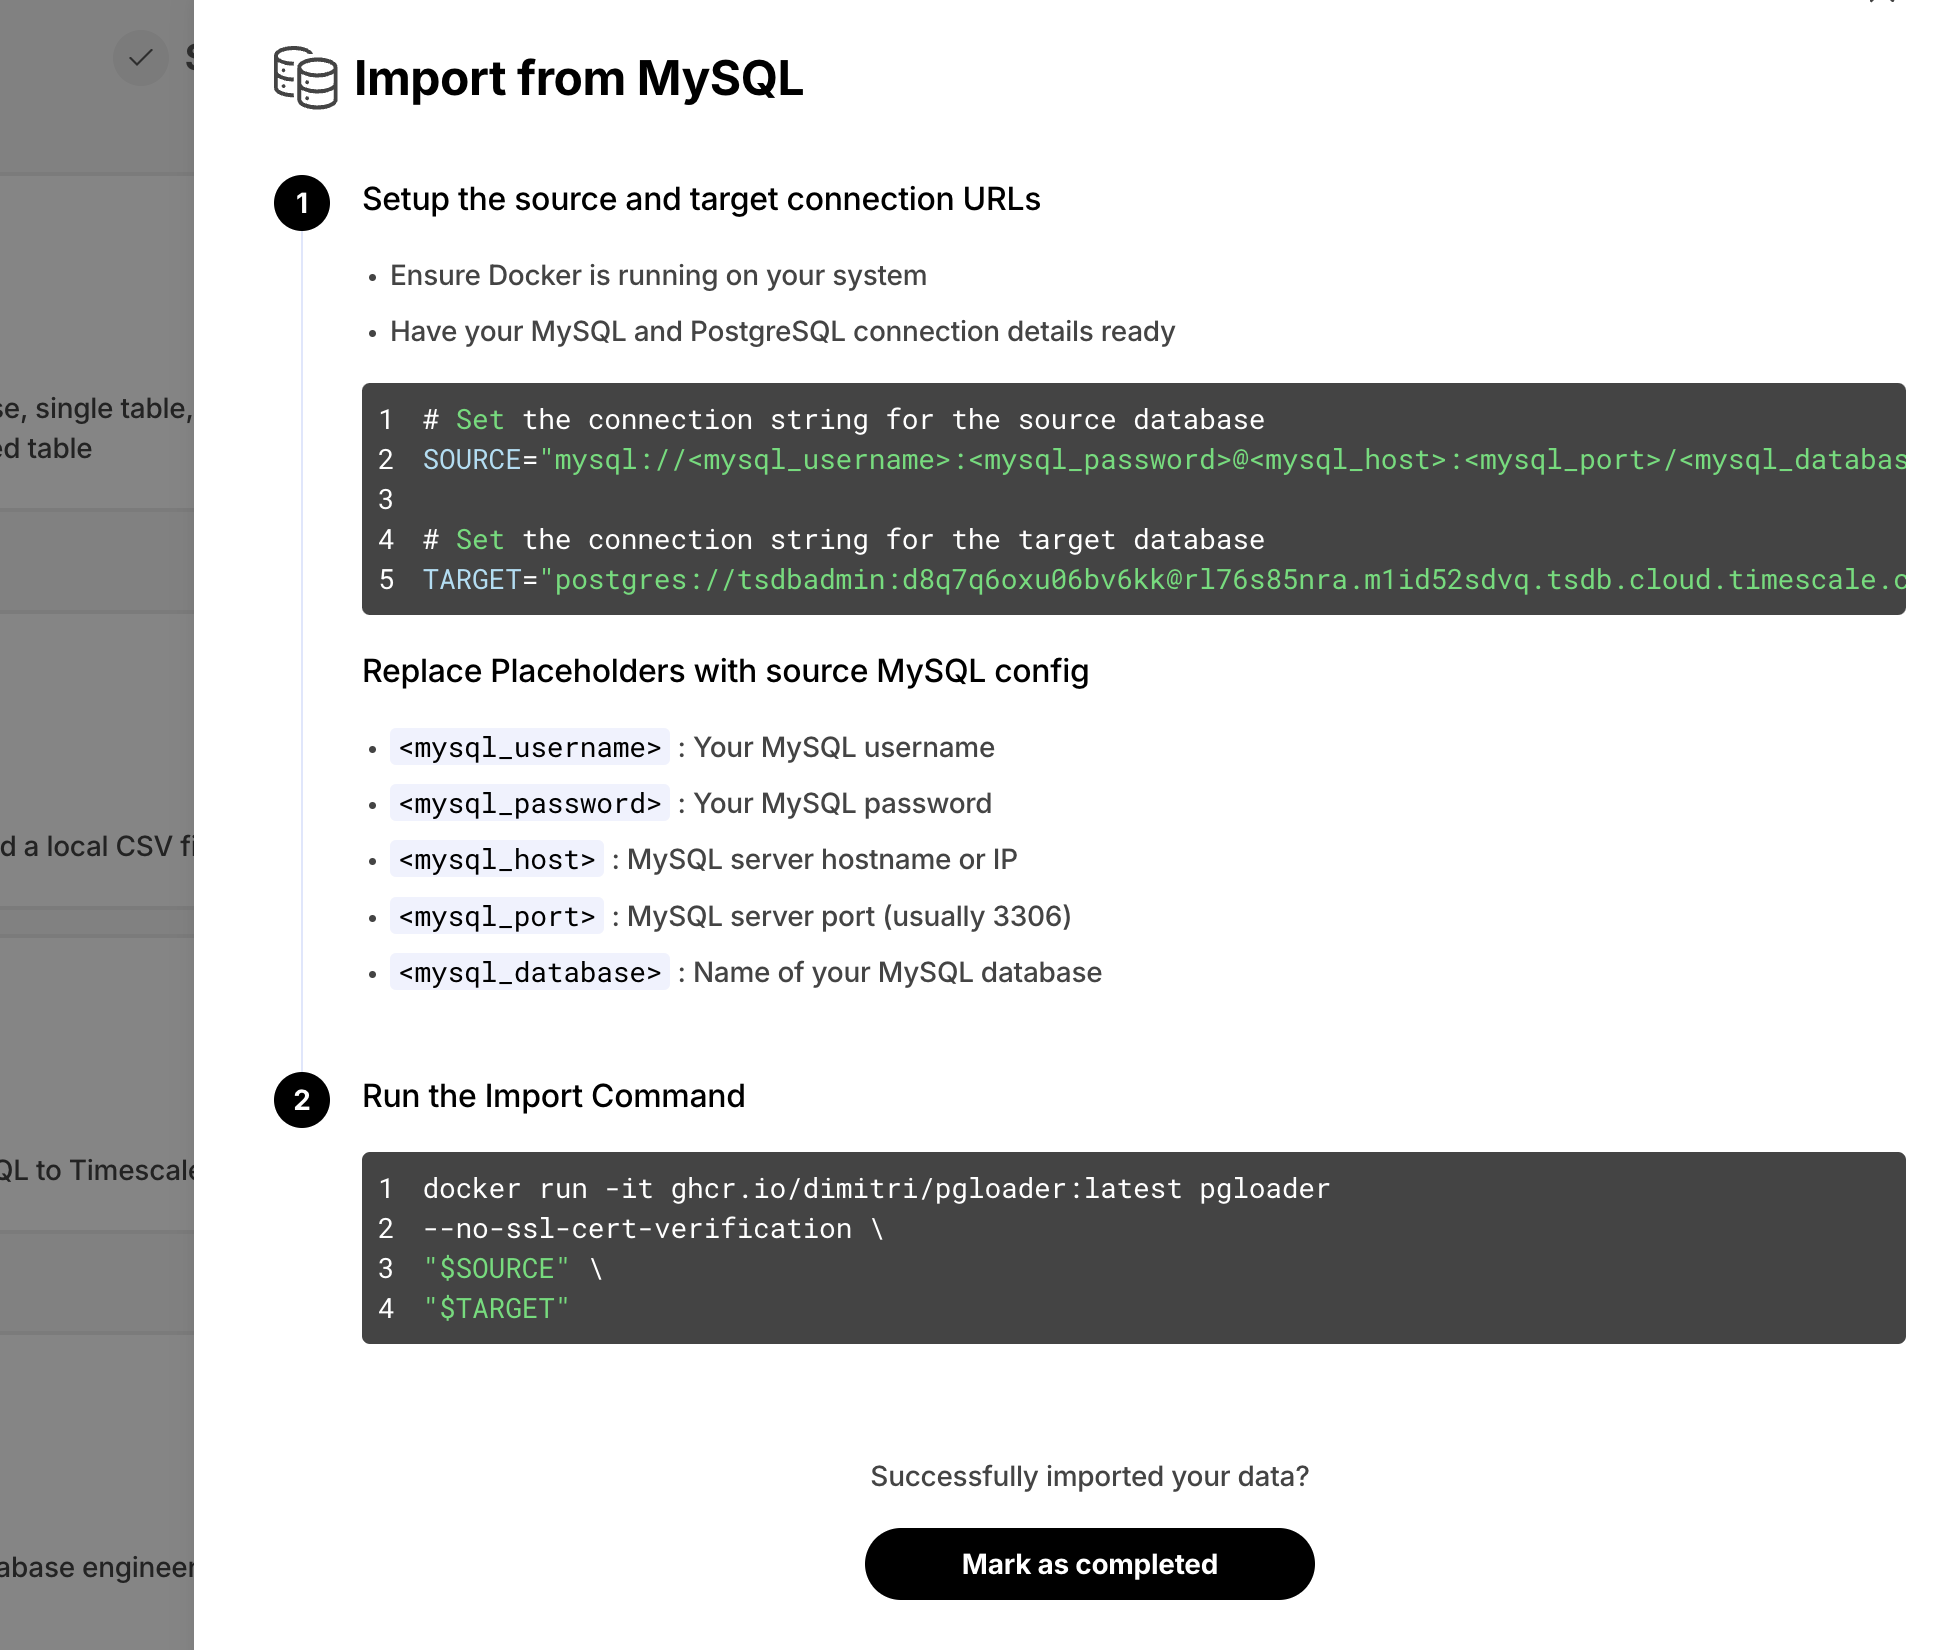
🔐 Current Lock Contention
In Timescale Console, we offer the SQL editor so you can directly querying your service. As a new improvement, if a query is waiting on locks and can't complete execution, Timescale Console now displays the current lock contention in the results section .
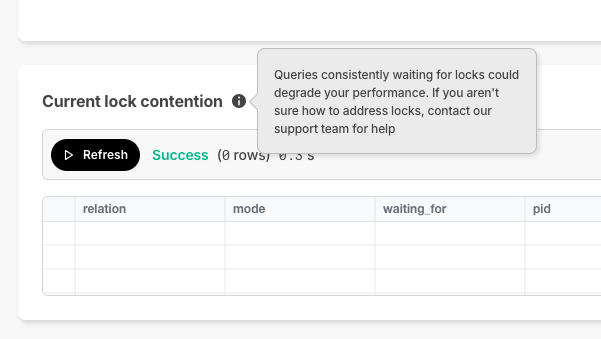
CIDR & VPC Updates
October 3, 2024
Timescale now supports multiple CIDRs on the customer VPC. Customers who want to take advantage of multiple CIDRs will need to recreate their peering.
🤝 New modes in Timescale Console: Ops and Data mode, and Console based Parquet File Import
September 19, 2024
We've been listening to your feedback and noticed that Timescale Console users have diverse needs. Some of you are focused on operational tasks like adding replicas or changing parameters, while others are diving deep into data analysis to gather insights.
To better serve you, we've introduced new modes to the Timescale Console UI—tailoring the experience based on what you're trying to accomplish.
Ops mode is where you can manage your services, add replicas, configure compression, change parameters, and so on.
Data mode is the full PopSQL experience: write queries with autocomplete, visualize data with charts and dashboards, schedule queries and dashboards to create alerts or recurring reports, share queries and dashboards, and more.
Try it today and let us know what you think!
Console based Parquet File Import
Now users can upload from Parquet to Timescale Cloud by uploading the file from their local file system. For files larger than 250 MB, or if you want to do it yourself, follow the three-step process to upload Parquet files to Timescale.
SQL editor improvements
- In the Ops mode SQL editor, you can now highlight a statement to run a specific statement.
High availability, usability, and migrations improvements
September 12, 2024
Multiple HA replicas
Scale and Enterprise customers can now configure two new multiple high availability (HA) replica options directly through Timescale Console:
- Two HA replicas (both asynchronous) - our highest availability configuration.
- Two HA replicas (one asynchronous, one synchronous) - our highest data integrity configuration.
Previously, Timescale offered only a single synchronous replica for customers seeking high availability. The single HA option is still available.


For more details on multiple HA replicas, see Manage high availability.
Other improvements
- In the Console SQL editor, we now indicate if your database session is healthy or has been disconnected. If it's been disconnected, the session will reconnect on your next query execution.

- Released live-migration v0.0.26 and then v0.0.27 which includes multiple performance improvements and bugfixes as well as better support for Postgres 12.
One-click SQL statement execution from Timescale Console, and session support in the SQL editor
September 05, 2024
One-click SQL statement execution from Timescale Console
Now you can simply click to run SQL statements in various places in the Console. This requires that the SQL Editor is enabled for the service.
Enable Continuous Aggregates from the CAGGs wizard by clicking Run below the SQL statement.

Enable database extensions by clicking Run below the SQL statement.

Query data instantly with a single click in the Console after successfully uploading a CSV file.

Session support in the SQL editor
Last week we announced the new in-console SQL editor. However, there was a limitation where a new database session was created for each query execution.
Today we removed that limitation and added support for keeping one database session for each user logged in, which means you can do things like start transactions:
begin;
insert into users (name, email) values ('john doe', 'john@example.com');
abort; -- nothing inserted
Or work with temporary tables:
create temporary table temp_users (email text);
insert into temp_sales (email) values ('john@example.com');
-- table will automatically disappear after your session ends
Or use the set command:
set search_path to 'myschema', 'public';
😎 Query your database directly from the Console and enhanced data import and migration options
August 30, 2024
SQL Editor in Timescale Console
We've added a new tab to the service screen that allows users to query their database directly, without having to leave the console interface.
- For existing services on Timescale, this is an opt-in feature. For all newly created services, the SQL Editor will be enabled by default.
- Users can disable the SQL Editor at any time by toggling the option under the Operations tab.
- The editor supports all DML and DDL operations (any single-statement SQL query), but doesn't support multiple SQL statements in a single query.

Enhanced Data Import Options for Quick Evaluation
After service creation, we now offer a dedicated section for data import, including options to import from Postgres as a source or from CSV files.
The enhanced Postgres import instructions now offer several options: single table import, schema-only import, partial data import (allowing selection of a specific time range), and complete database import. Users can execute any of these data imports with just one or two simple commands provided in the data import section.

Improvements to Live migration
We've released v0.0.25 of Live migration that includes the following improvements:
- Support migrating tsdb on non public schema to public schema
- Pre-migration compatibility checks
- Docker compose build fixes
🛠️ Improved tooling in Timescale Cloud and new AI and Vector extension releases
August 22, 2024
CSV import
We have added a CSV import tool to the Timescale Console. For all TimescaleDB services, after service creation you can:
- Choose a local file
- Select the name of the data collection to be uploaded (default is file name)
- Choose data types for each column
- Upload the file as a new hypertable within your service
Look for the
Import data from .csvtile in theImport your datastep of service creation.

Replica lag
Customers now have more visibility into the state of replicas running on Timescale Cloud. We’ve released a new parameter called Replica Lag within the Service Overview for both Read and High Availability Replicas. Replica lag is measured in bytes against the current state of the primary database. For questions or concerns about the relative lag state of your replica, reach out to Customer Support.

Adjust chunk interval
Customers can now adjust their chunk interval for their hypertables and continuous aggregates through the Timescale UI. In the Explorer, select the corresponding hypertable you would like to adjust the chunk interval for. Under Chunk information, you can change the chunk interval. Note that this only changes the chunk interval going forward, and does not retroactively change existing chunks.

CloudWatch permissions via role assumption
We've released permission granting via role assumption to CloudWatch. Role assumption is both more secure and more convenient for customers who no longer need to rotate credentials and update their exporter config.
For more details take a look at our documentation.

Two-factor authentication (2FA) indicator
We’ve added a 2FA status column to the Members page, allowing customers to easily see whether each project member has 2FA enabled or disabled.

Anthropic and Cohere integrations in pgai
The pgai extension v0.3.0 now supports embedding creation and LLM reasoning using models from Anthropic and Cohere. For details and examples, see this post for pgai and Cohere, and this post for pgai and Anthropic.
pgvectorscale extension: ARM builds and improved recall for low dimensional vectors
pgvectorscale extension v0.3.0 adds support for ARM processors and improves recall when using StreamingDiskANN indexes with low dimensionality vectors. We recommend updating to this version if you are self-hosting.
🏄 Optimizations for compressed data and extended join support in continuous aggregates
August 15, 2024
TimescaleDB v2.16.0 contains significant performance improvements when working with compressed data, extended join support in continuous aggregates, and the ability to define foreign keys from regular tables towards hypertables. We recommend upgrading at the next available opportunity.
Any new service created on Timescale Cloud starting today uses TimescaleDB v2.16.0.
In TimescaleDB v2.16.0 we:
- Introduced multiple performance focused optimizations for data manipulation operations (DML) over compressed chunks.
Improved upsert performance by more than 100x in some cases and more than 500x in some update/delete scenarios.
- Added the ability to define chunk skipping indexes on non-partitioning columns of compressed hypertables.
TimescaleDB v2.16.0 extends chunk exclusion to use these skipping (sparse) indexes when queries filter on the relevant columns, and prune chunks that do not include any relevant data for calculating the query response.
- Offered new options for use cases that require foreign keys defined.
You can now add foreign keys from regular tables towards hypertables. We have also removed some really annoying locks in the reverse direction that blocked access to referenced tables while compression was running.
- Extended Continuous Aggregates to support more types of analytical queries.
More types of joins are supported, additional equality operators on join clauses, and support for joins between multiple regular tables.
Highlighted features in this release
- Improved query performance through chunk exclusion on compressed hypertables.
You can now define chunk skipping indexes on compressed chunks for any column with one of the following
integer data types: smallint, int, bigint, serial, bigserial, date, timestamp, timestamptz.
After calling enable_chunk_skipping on a column, TimescaleDB tracks the min and max values for
that column, using this information to exclude chunks for queries filtering on that
column, where no data would be found.
- Improved upsert performance on compressed hypertables.
By using index scans to verify constraints during inserts on compressed chunks, TimescaleDB speeds up some ON CONFLICT clauses by more than 100x.
- Improved performance of updates, deletes, and inserts on compressed hypertables.
By filtering data while accessing the compressed data and before decompressing, TimescaleDB has improved performance for updates and deletes on all types of compressed chunks, as well as inserts into compressed chunks with unique constraints.
By signaling constraint violations without decompressing, or decompressing only when matching records are found in the case of updates, deletes and upserts, TimescaleDB v2.16.0 speeds up those operations more than 1000x in some update/delete scenarios, and 10x for upserts.
You can add foreign keys from regular tables to hypertables, with support for all types of cascading options. This is useful for hypertables that partition using sequential IDs, and need to reference these IDs from other tables.
Lower locking requirements during compression for hypertables with foreign keys
Advanced foreign key handling removes the need for locking referenced tables when new chunks are compressed. DML is no longer blocked on referenced tables while compression runs on a hypertable.
- Improved support for queries on Continuous Aggregates
INNER/LEFT and LATERAL joins are now supported. Plus, you can now join with multiple regular tables,
and have more than one equality operator on join clauses.
Postgres 13 support removal announcement
Following the deprecation announcement for Postgres 13 in TimescaleDB v2.13, Postgres 13 is no longer supported in TimescaleDB v2.16.
The currently supported Postgres major versions are 14, 15, and 16.
📦 Performance, packaging and stability improvements for Timescale Cloud
August 8, 2024
New plans
To support evolving customer needs, Timescale Cloud now offers three plans to provide more value, flexibility, and efficiency.
- Performance: for cost-focused, smaller projects. No credit card required to start.
- Scale: for developers handling critical and demanding apps.
- Enterprise: for enterprises with mission-critical apps.
Each plan continues to bill based on hourly usage, primarily for compute you run and storage you consume. You can upgrade or downgrade between Performance and Scale plans via the Console UI at any time. More information about the specifics and differences between these pricing plans can be found here in the docs.
Improvements to the Timescale Console
The individual tiles on the services page have been enhanced with new information, including high-availability status. This will let you better assess the state of your services at a glance.
Live migration release v0.0.24
Improvements:
- Automatic retries are now available for the initial data copy of the migration
- Now uses pgcopydb for initial data copy for PG to TSDB migrations also (already did for TS to TS) which has a significant performance boost.
- Fixes issues with TimescaleDB v2.13.x migrations
- Support for chunk mapping for hypertables with custom schema and table prefixes
⚡ Performance and stability improvements for Timescale Cloud and TimescaleDB
July 12, 2024
The following improvements have been made to Timescale products:
Timescale Cloud:
- The connection pooler has been updated and now avoids multiple reloads
- The tsdbadmin user can now grant the following roles to other users:
pg_checkpoint,pg_monitor,pg_signal_backend,pg_read_all_stats,pg_stat_scan_tables - Timescale Console is far more reliable.
TimescaleDB
- The TimescaleDB v2.15.3 patch release improves handling of multiple unique indexes in a compressed INSERT, removes the recheck of ORDER when querying compressed data, improves memory management in DML functions, improves the tuple lock acquisition for tiered chunks on replicas, and fixes an issue with ORDER BY/GROUP BY in our HashAggregate optimization on PG16. For more information, see the release note.
- The TimescaleDB v2.15.2 patch release improves sort pushdown for partially compressed chunks, and compress_chunk with a primary space partition. The metadata function is removed from the update script, and hash partitioning on a primary column is disallowed. For more information, see the release note.
⚡ Performance improvements for live migration to Timescale Cloud
June 27, 2024
The following improvements have been made to the Timescale live-migration docker image:
- Table-based filtering is now available during live migration.
- Improvements to pbcopydb increase performance and remove unhelpful warning messages.
- The user notification log enables you to always select the most recent release for a migration run.
For improved stability and new features, update to the latest timescale/live-migration docker image. To learn more, see the live migration docs.
🦙Ollama integration in pgai
June 21, 2024
Ollama is now integrated with pgai.
Ollama is the easiest and most popular way to get up and running with open-source language models. Think of Ollama as Docker for LLMs, enabling easy access and usage of a variety of open-source models like Llama 3, Mistral, Phi 3, Gemma, and more.
With the pgai extension integrated in your database, embed Ollama AI into your app using SQL. For example:
select ollama_generate
( 'llava:7b'
, 'Please describe this image.'
, _images=> array[pg_read_binary_file('/pgai/tests/postgresql-vs-pinecone.jpg')]
, _system=>'you are a helpful assistant'
, _options=> jsonb_build_object
( 'seed', 42
, 'temperature', 0.9
)
)->>'response'
;
To learn more, see the pgai Ollama documentation.
🧙 Compression Wizard
June 13, 2024
The compression wizard is now available on Timescale Cloud. Select a hypertable and be guided through enabling compression through the UI!
To access the compression wizard, navigate to Explorer, and select the hypertable you would like to compress. In the top right corner, hover where it says Compression off, and open the wizard. You will then be guided through the process of configuring compression for your hypertable, and can compress it directly through the UI.

🏎️💨 High Performance AI Apps With pgvectorscale
June 11, 2024
The vectorscale extension is now available on Timescale Cloud.
pgvectorscale complements pgvector, the open-source vector data extension for Postgres, and introduces the following key innovations for pgvector data:
- A new index type called StreamingDiskANN, inspired by the DiskANN algorithm, based on research from Microsoft.
- Statistical Binary Quantization: developed by Timescale researchers, This compression method improves on standard Binary Quantization.
On benchmark dataset of 50 million Cohere embeddings (768 dimensions each), Postgres with pgvector and pgvectorscale achieves 28x lower p95 latency and 16x higher query throughput compared to Pinecone's storage optimized (s1) index for approximate nearest neighbor queries at 99% recall, all at 75% less cost when self-hosted on AWS EC2.
To learn more, see the pgvectorscale documentation.
🧐Integrate AI Into Your Database Using pgai
June 11, 2024
The pgai extension is now available on Timescale Cloud.
pgai brings embedding and generation AI models closer to the database. With pgai, you can now do the following directly from within Postgres in a SQL query:
- Create embeddings for your data.
- Retrieve LLM chat completions from models like OpenAI GPT4o.
- Reason over your data and facilitate use cases like classification, summarization, and data enrichment on your existing relational data in Postgres.
To learn more, see the pgai documentation.
🐅Continuous Aggregate and Hypertable Improvements for TimescaleDB
June 7, 2024
The 2.15.x releases contains performance improvements and bug fixes. Highlights in these releases are:
- Continuous Aggregate now supports
time_bucketwith origin and/or offset. - Hypertable compression has the following improvements:
- Recommend optimized defaults for segment by and order by when configuring compression through analysis of table configuration and statistics.
- Added planner support to check more kinds of WHERE conditions before decompression. This reduces the number of rows that have to be decompressed.
- You can now use minmax sparse indexes when you compress columns with btree indexes.
- Vectorize filters in the WHERE clause that contain text equality operators and LIKE expressions.
To learn more, see the TimescaleDB release notes.
🔍 Database Audit Logging with pgaudit
May 31, 2024
The Postgres Audit extension(pgaudit) is now available on Timescale Cloud. pgaudit provides detailed database session and object audit logging in the Timescale Cloud logs.
If you have strict security and compliance requirements and need to log all operations on the database level, pgaudit can help. You can also export these audit logs to Amazon CloudWatch.
To learn more, see the pgaudit documentation.
🌡 International System of Unit Support with postgresql-unit
May 31, 2024
The SI Units for Postgres extension(unit) provides support for the ISU in Timescale Cloud.
You can use Timescale Cloud to solve day-to-day questions. For example, to see what 50°C is in °F, run the following query in your Timescale Cloud service:
SELECT '50°C'::unit @ '°F' as temp;
temp
--------
122 °F
(1 row)
To learn more, see the postgresql-unit documentation.
===== PAGE: https://docs.tigerdata.com/about/timescaledb-editions/ =====
Compare TimescaleDB editions
The following versions of TimescaleDB are available:
- TimescaleDB Apache 2 Edition
- TimescaleDB Community Edition
TimescaleDB Apache 2 Edition
TimescaleDB Apache 2 Edition is available under the Apache 2.0 license. This is a classic open source license, meaning that it is completely unrestricted - anyone can take this code and offer it as a service.
You can install TimescaleDB Apache 2 Edition on your own on-premises or cloud infrastructure and run it for free.
You can sell TimescaleDB Apache 2 Edition as a service, even if you're not the main contributor.
You can modify the TimescaleDB Apache 2 Edition source code and run it for production use.
TimescaleDB Community Edition
TimescaleDB Community Edition is the advanced, best, and most feature complete version of TimescaleDB, available under the terms of the Tiger Data License (TSL).
For more information about the Tiger Data license, see this blog post.
Many of the most recent features of TimescaleDB are only available in TimescaleDB Community Edition.
You can install TimescaleDB Community Edition in your own on-premises or cloud infrastructure and run it for free. TimescaleDB Community Edition is completely free if you manage your own service.
You cannot sell TimescaleDB Community Edition as a service, even if you are the main contributor.
You can modify the TimescaleDB Community Edition source code and run it for production use. Developers using TimescaleDB Community Edition have the "right to repair" and make modifications to the source code and run it in their own on-premises or cloud infrastructure. However, you cannot make modifications to the TimescaleDB Community Edition source code and offer it as a service.
You can access a hosted version of TimescaleDB Community Edition through Tiger Cloud, a cloud-native platform for time-series and real-time analytics.
Feature comparison
<th>Features</th>
<th>TimescaleDB Apache 2 Edition</th>
<th>TimescaleDB Community Edition</th>
<td><strong>Hypertables and chunks</strong></td>
<td><a href="https://docs.timescale.com/api/latest/hypertable/create_table/">CREATE TABLE</a></td>
<td>✅</td>
<td>✅</td>
<td><a href="https://docs.timescale.com/api/latest/hypertable/create_hypertable/">create_hypertable</a></td>
<td>✅</td>
<td>✅</td>
<td><a href="https://docs.timescale.com/api/latest/hypertable/show_chunks/">show_chunks</a></td>
<td>✅</td>
<td>✅</td>
<td><a href="https://docs.timescale.com/api/latest/hypertable/drop_chunks/">drop_chunks</a></td>
<td>✅</td>
<td>✅</td>
<td><a href="https://docs.timescale.com/api/latest/hypertable/split_chunk/">split_chunk</a></td>
<td>❌</td>
<td>✅</td>
<td><a href="https://docs.timescale.com/api/latest/hypertable/reorder_chunk/">reorder_chunk</a></td>
<td>❌</td>
<td>✅</td>
<td><a href="https://docs.timescale.com/api/latest/hypertable/move_chunk/">move_chunk</a></td>
<td>❌</td>
<td>✅</td>
<td><a href="https://docs.timescale.com/api/latest/hypertable/add_reorder_policy/">add_reorder_policy</a></td>
<td>❌</td>
<td>✅</td>
<td><a href="https://docs.timescale.com/api/latest/hypertable/attach_tablespace/">attach_tablespace</a></td>
<td>✅</td>
<td>✅</td>
<td><a href="https://docs.timescale.com/api/latest/hypertable/detach_tablespace/">detach_tablespace()</a></td>
<td>✅</td>
<td>✅</td>
<td><a href="https://docs.timescale.com/api/latest/hypertable/detach_tablespaces/">detach_tablespaces()</a></td>
<td>✅</td>
<td>✅</td>
<td><a href="https://docs.timescale.com/api/latest/hypertable/show_tablespaces/">show_tablespaces</a></td>
<td>✅</td>
<td>✅</td>
<td><a href="https://docs.timescale.com/api/latest/hypertable/set_chunk_time_interval/">set_chunk_time_interval</a></td>
<td>✅</td>
<td>✅</td>
<td><a href="https://docs.timescale.com/api/latest/hypertable/set_integer_now_func/">set_integer_now_func</a></td>
<td>✅</td>
<td>✅</td>
<td><a href="https://docs.timescale.com/api/latest/hypertable/add_dimension/">add_dimension()</a></td>
<td>✅</td>
<td>✅</td>
<td><a href="https://docs.timescale.com/api/latest/hypertable/create_index/">create_index (Transaction Per Chunk)</a></td>
<td>✅</td>
<td>✅</td>
<td><a href="https://docs.timescale.com/api/latest/hypertable/hypertable_size/">hypertable_size</a></td>
<td>✅</td>
<td>✅</td>
<td><a href="https://docs.timescale.com/api/latest/hypertable/hypertable_detailed_size/">hypertable_detailed_size</a></td>
<td>✅</td>
<td>✅</td>
<td><a href="https://docs.timescale.com/api/latest/hypertable/hypertable_index_size/">hypertable_index_size</a></td>
<td>✅</td>
<td>✅</td>
<td><a href="https://docs.timescale.com/api/latest/hypertable/chunks_detailed_size/">chunks_detailed_size</a></td>
<td>✅</td>
<td>✅</td>
<td><a href="https://docs.tigerdata.com/use-timescale/latest/query-data/skipscan/">SkipScan</a></td>
<td>❌</td>
<td>✅</td>
<td colspan="3"><strong>Distributed hypertables</strong>: This feature is <a href="https://github.com/timescale/timescaledb/blob/2.14.0/docs/MultiNodeDeprecation.md">sunsetted in all editions</a> in TimescaleDB v2.14.x</td>
<td><strong>Hypercore</strong> Since [TimescaleDB v2.18.0](https://github.com/timescale/timescaledb/releases/tag/2.18.0)</td>
<td><a href="https://docs.timescale.com/api/latest/hypercore/alter_table/">ALTER TABLE (Hypercore)</a></td>
<td>❌</td>
<td>✅</td>
<td><a href="https://docs.timescale.com/api/latest/hypercore/add_columnstore_policy/">add_columnstore_policy</a></td>
<td>❌</td>
<td>✅</td>
<td><a href="https://docs.timescale.com/api/latest/hypercore/remove_columnstore_policy/">remove_columnstore_policy</a></td>
<td>❌</td>
<td>✅</td>
<td><a href="https://docs.timescale.com/api/latest/hypercore/convert_to_columnstore/">convert_to_columnstore</a></td>
<td>❌</td>
<td>✅</td>
<td><a href="https://docs.timescale.com/api/latest/hypercore/convert_to_rowstore/">convert_to_rowstore</a></td>
<td>❌</td>
<td>✅</td>
<td><a href="https://docs.timescale.com/api/latest/hypercore/hypertable_columnstore_settings/">hypertable_columnstore_settings</a></td>
<td>❌</td>
<td>✅</td>
<td><a href="https://docs.timescale.com/api/latest/hypercore/hypertable_columnstore_stats/">hypertable_columnstore_stats</a></td>
<td>❌</td>
<td>✅</td>
<td><a href="https://docs.timescale.com/api/latest/hypercore/chunk_columnstore_settings/">chunk_columnstore_settings</a></td>
<td>❌</td>
<td>✅</td>
<td><a href="https://docs.timescale.com/api/latest/hypercore/chunk_columnstore_stats/">chunk_columnstore_stats</a></td>
<td>❌</td>
<td>✅</td>
<td><strong>Continuous aggregates</strong></td>
<td><a href="https://docs.timescale.com/api/latest/continuous-aggregates/create_materialized_view/">CREATE MATERIALIZED VIEW (Continuous Aggregate)</a></td>
<td>❌</td>
<td>✅</td>
<td><a href="https://docs.timescale.com/api/latest/continuous-aggregates/alter_materialized_view/">ALTER MATERIALIZED VIEW (Continuous Aggregate)</a></td>
<td>❌</td>
<td>✅</td>
<td><a href="https://docs.timescale.com/api/latest/continuous-aggregates/drop_materialized_view/">DROP MATERIALIZED VIEW (Continuous Aggregate)</a></td>
<td>❌</td>
<td>✅</td>
<td><a href="https://docs.timescale.com/api/latest/continuous-aggregates/add_continuous_aggregate_policy/">add_continuous_aggregate_policy()</a></td>
<td>❌</td>
<td>✅</td>
<td><a href="https://docs.timescale.com/api/latest/continuous-aggregates/refresh_continuous_aggregate/">refresh_continuous_aggregate</a></td>
<td>❌</td>
<td>✅</td>
<td><a href="https://docs.timescale.com/api/latest/continuous-aggregates/remove_continuous_aggregate_policy/">remove_continuous_aggregate_policy()</a></td>
<td>❌</td>
<td>✅</td>
<td><strong>Data retention</strong></td>
<td><a href="https://docs.timescale.com/api/latest/data-retention/add_retention_policy/">add_retention_policy</a></td>
<td>❌</td>
<td>✅</td>
<td><a href="https://docs.timescale.com/api/latest/data-retention/remove_retention_policy/">remove_retention_policy</a></td>
<td>❌</td>
<td>✅</td>
<td><strong>Jobs and automation</strong></td>
<td><a href="https://docs.timescale.com/api/latest/jobs-automation/add_job/">add_job</a></td>
<td>❌</td>
<td>✅</td>
<td><a href="https://docs.timescale.com/api/latest/jobs-automation/alter_job/">alter_job</a></td>
<td>❌</td>
<td>✅</td>
<td><a href="https://docs.timescale.com/api/latest/jobs-automation/delete_job/">delete_job</a></td>
<td>❌</td>
<td>✅</td>
<td><a href="https://docs.timescale.com/api/latest/jobs-automation/run_job/">run_job</a></td>
<td>❌</td>
<td>✅</td>
<td><strong>Hyperfunctions</strong></td>
<td><a href="https://docs.timescale.com/api/latest/hyperfunctions/approximate_row_count/">approximate_row_count</a></td>
<td>✅</td>
<td>✅</td>
<td><a href="https://docs.timescale.com/api/latest/hyperfunctions/first/">first</a></td>
<td>✅</td>
<td>✅</td>
<td><a href="https://docs.timescale.com/api/latest/hyperfunctions/last/">last</a></td>
<td>✅</td>
<td>✅</td>
<td><a href="https://docs.timescale.com/api/latest/hyperfunctions/histogram/">histogram</a></td>
<td>✅</td>
<td>✅</td>
<td><a href="https://docs.timescale.com/api/latest/hyperfunctions/time_bucket/">time_bucket</a></td>
<td>✅</td>
<td>✅</td>
<td><a href="https://docs.timescale.com/api/latest/hyperfunctions/time_bucket_ng/">time_bucket_ng (experimental feature)</a></td>
<td>✅ </td>
<td>✅ </td>
<td><a href="https://docs.timescale.com/api/latest/hyperfunctions/gapfilling/time_bucket_gapfill/">time_bucket_gapfill</a></td>
<td>❌</td>
<td>✅</td>
<td><a href="https://docs.tigerdata.com/api/latest/hyperfunctions/gapfilling/time_bucket_gapfill#locf">locf</a></td>
<td>❌</td>
<td>✅</td>
<td><a href="https://docs.timescale.com/api/latest/hyperfunctions/gapfilling/time_bucket_gapfill#interpolate">interpolate</a></td>
<td>❌</td>
<td>✅</td>
<td><a href="https://docs.timescale.com/api/latest/hyperfunctions/percentile-approximation/uddsketch/#percentile-agg">percentile_agg</a></td>
<td>❌</td>
<td>✅</td>
<td><a href="https://docs.timescale.com/api/latest/hyperfunctions/percentile-approximation/uddsketch/#approx_percentile">approx_percentile</a></td>
<td>❌</td>
<td>✅</td>
<td><a href="https://docs.timescale.com/api/latest/hyperfunctions/percentile-approximation/uddsketch/#approx_percentile_rank">approx_percentile_rank</a></td>
<td>❌</td>
<td>✅</td>
<td><a href="https://docs.timescale.com/api/latest/hyperfunctions/percentile-approximation/uddsketch/#rollup">rollup</a></td>
<td>❌</td>
<td>✅</td>
<td><a href="https://docs.timescale.com/api/latest/hyperfunctions/percentile-approximation/tdigest/#max_val">max_val</a></td>
<td>❌</td>
<td>✅</td>
<td><a href="https://docs.timescale.com/api/latest/hyperfunctions/percentile-approximation/uddsketch/#mean">mean</a></td>
<td>❌</td>
<td>✅</td>
<td><a href="https://docs.timescale.com/api/latest/hyperfunctions/percentile-approximation/uddsketch/#error">error</a></td>
<td>❌</td>
<td>✅</td>
<td><a href="https://docs.timescale.com/api/latest/hyperfunctions/percentile-approximation/tdigest/#min_val">min_val</a></td>
<td>❌</td>
<td>✅</td>
<td><a href="https://docs.timescale.com/api/latest/hyperfunctions/percentile-approximation/uddsketch/#num_vals">num_vals</a></td>
<td>❌</td>
<td>✅</td>
<td><a href="https://docs.timescale.com/api/latest/hyperfunctions/percentile-approximation/uddsketch/#uddsketch">uddsketch</a></td>
<td>❌</td>
<td>✅</td>
<td><a href="https://docs.timescale.com/api/latest/hyperfunctions/percentile-approximation/tdigest/#tdigest">tdigest</a></td>
<td>❌</td>
<td>✅</td>
<td><a href="https://docs.timescale.com/api/latest/hyperfunctions/time-weighted-calculations/time_weight/">time_weight</a></td>
<td>❌</td>
<td>✅</td>
<td><a href="https://docs.tigerdata.com/api/latest/hyperfunctions/time-weighted-calculations/time_weight#rollup">rollup</a></td>
<td>❌</td>
<td>✅</td>
<td><a href="https://docs.timescale.com/api/latest/hyperfunctions/time-weighted-calculations/time_weight#average">average</a></td>
<td>❌</td>
<td>✅</td>
<td><strong>Informational Views</strong></td>
<td><a href="https://docs.timescale.com/api/latest/informational-views/chunks/#available-columns">timescaledb_information.chunks</a></td>
<td>✅</td>
<td>✅</td>
<td><a href="https://docs.timescale.com/api/latest/informational-views/continuous_aggregates/#sample-usage">timescaledb_information.continuous_aggregates</a></td>
<td>✅</td>
<td>✅</td>
<td><a href="https://docs.timescale.com/api/latest/informational-views/compression_settings/#sample-usage">timescaledb_information.compression_settings</a></td>
<td>✅</td>
<td>✅</td>
<td><a href="https://docs.timescale.com/api/latest/informational-views/data_nodes/#sample-usage">timescaledb_information.data_nodes</a></td>
<td>✅</td>
<td>✅</td>
<td><a href="https://docs.timescale.com/api/latest/informational-views/dimensions/#timescaledb-information-dimensions">timescaledb_information.dimension</a></td>
<td>✅</td>
<td>✅</td>
<td><a href="https://docs.timescale.com/api/latest/informational-views/hypertables/">timescaledb_information.hypertables</a></td>
<td>✅</td>
<td>✅</td>
<td><a href="https://docs.timescale.com/api/latest/informational-views/jobs/#available-columns">timescaledb_information.jobs</a></td>
<td>✅</td>
<td>✅</td>
<td><a href="https://docs.timescale.com/api/latest/informational-views/job_stats/#available-columns">timescaledb_information.job_stats</a></td>
<td>✅</td>
<td>✅</td>
<td><strong>Administration functions</strong></td>
<td><a href="https://docs.timescale.com/api/latest/administration/#timescaledb_pre_restore">timescaledb_pre_restore</a></td>
<td>✅</td>
<td>✅</td>
<td><a href="https://docs.timescale.com/api/latest/administration/#timescaledb_post_restore">timescaledb_post_restore</a></td>
<td>✅</td>
<td>✅</td>
<td><a href="https://docs.timescale.com/api/latest/administration/#get_telemetry_report">get_telemetry_report</a></td>
<td>✅</td>
<td>✅</td>
<td><a href="https://docs.timescale.com/api/latest/administration/#dump-timescaledb-meta-data">dump_meta_data</a></td>
<td>✅</td>
<td>✅</td>
<td><strong>Compression</strong> Old API since [TimescaleDB v2.18.0](https://github.com/timescale/timescaledb/releases/tag/2.18.0) replaced by Hypercore</td>
<td><a href="https://docs.timescale.com/api/latest/compression/alter_table_compression/">ALTER TABLE (Compression)</a></td>
<td>❌</td>
<td>✅</td>
<td><a href="https://docs.timescale.com/api/latest/compression/add_compression_policy/#sample-usage">add_compression_policy</a></td>
<td>❌</td>
<td>✅</td>
<td><a href="https://docs.timescale.com/api/latest/compression/remove_compression_policy/">remove_compression_policy</a></td>
<td>❌</td>
<td>✅</td>
<td><a href="https://docs.timescale.com/api/latest/compression/compress_chunk/">compress_chunk</a></td>
<td>❌</td>
<td>✅</td>
<td><a href="https://docs.timescale.com/api/latest/compression/decompress_chunk/">decompress_chunk</a></td>
<td>❌</td>
<td>✅</td>
<td><a href="https://docs.timescale.com/api/latest/compression/hypertable_compression_stats/">hypertable_compression_stats</a></td>
<td>❌</td>
<td>✅</td>
<td><a href="https://docs.timescale.com/api/latest/compression/chunk_compression_stats/">chunk_compression_stats</a></td>
<td>❌</td>
<td>✅</td>
===== PAGE: https://docs.tigerdata.com/about/supported-platforms/ =====
Supported platforms
This page lists the platforms and systems that Tiger Data products have been tested on for the following options:
- Tiger Cloud: all the latest features that just work. A reliable and worry-free Postgres cloud for all your workloads.
- Self-hosted products: create your best app from the comfort of your own developer environment.
Tiger Cloud
Tiger Cloud always runs the latest version of all Tiger Data products. With Tiger Cloud you:
- Build everything on one service, and each service hosts one database
- Get faster queries using less compute
- Compress data without sacrificing performance
- View insights on performance, queries, and more
- Reduce storage with automated retention policies
See the available service capabilities and regions.
Available service capabilities
Tiger Cloud services run optimized Tiger Data extensions on latest Postgres, in a highly secure cloud environment. Each service is a specialized database instance tuned for your workload. Available capabilities are:
<thead>
<tr>
<th>Capability</th>
<th>Extensions</th>
</tr>
</thead>
<tbody>
<tr>
<td><strong>Real-time analytics</strong> <p>Lightning-fast ingest and querying of time-based and event data.</p></td>
<td><ul><li>TimescaleDB</li><li>TimescaleDB Toolkit</li></ul> </td>
</tr>
<tr>
<td ><strong>AI and vector </strong><p>Seamlessly build RAG, search, and AI agents.</p></td>
<td><ul><li>TimescaleDB</li><li>pgvector</li><li>pgvectorscale</li><li>pgai</li></ul></td>
</tr>
<tr>
<td ><strong>Hybrid</strong><p>Everything for real-time analytics and AI workloads, combined.</p></td>
<td><ul><li>TimescaleDB</li><li>TimescaleDB Toolkit</li><li>pgvector</li><li>pgvectorscale</li><li>pgai</li></ul></td>
</tr>
<tr>
<td ><strong>Support</strong></td>
<td><ul><li>24/7 support no matter where you are.</li><li> Continuous incremental backup/recovery. </li><li>Point-in-time forking/branching.</li><li>Zero-downtime upgrades. </li><li>Multi-AZ high availability. </li><li>An experienced global ops and support team that can build and manage Postgres at scale.</li></ul></td>
</tr>
</tbody>
Available regions
Tiger Cloud services run in the following Amazon Web Services (AWS) regions:
| Region | Zone | Location |
|---|---|---|
ap-south-1 |
Asia Pacific | Mumbai |
ap-southeast-1 |
Asia Pacific | Singapore |
ap-southeast-2 |
Asia Pacific | Sydney |
ap-northeast-1 |
Asia Pacific | Tokyo |
ca-central-1 |
Canada | Central |
eu-central-1 |
Europe | Frankfurt |
eu-west-1 |
Europe | Ireland |
eu-west-2 |
Europe | London |
sa-east-1 |
South America | São Paulo |
us-east-1 |
United States | North Virginia |
us-east-2 |
United States | Ohio |
us-west-2 |
United States | Oregon |
Self-hosted products
You use Tiger Data's open-source products to create your best app from the comfort of your own developer environment.
See the available services and supported systems.
Available services
Tiger Data offers the following services for your self-hosted installations:
<thead>
<tr>
<th>Service type</th>
<th>Description</th>
</tr>
</thead>
<tbody>
<tr>
<td><strong>Self-hosted support</strong></td>
<td><ul><li>24/7 support no matter where you are.</li><li>An experienced global ops and support team that
can build and manage Postgres at scale.</li></ul>
Want to try it out? <a href="https://www.tigerdata.com/self-managed-support">See how we can help</a>.
</td>
</tr>
</tbody>
Postgres, TimescaleDB support matrix
TimescaleDB and TimescaleDB Toolkit run on Postgres v10, v11, v12, v13, v14, v15, v16, and v17. Currently Postgres 15 and higher are supported.
| TimescaleDB version |Postgres 17|Postgres 16|Postgres 15|Postgres 14|Postgres 13|Postgres 12|Postgres 11|Postgres 10| |-----------------------|-|-|-|-|-|-|-|-| | 2.22.x |✅|✅|✅|❌|❌|❌|❌|❌|❌| | 2.21.x |✅|✅|✅|❌|❌|❌|❌|❌|❌| | 2.20.x |✅|✅|✅|❌|❌|❌|❌|❌|❌| | 2.17 - 2.19 |✅|✅|✅|✅|❌|❌|❌|❌|❌| | 2.16.x |❌|✅|✅|✅|❌|❌|❌|❌|❌|❌| | 2.13 - 2.15 |❌|✅|✅|✅|✅|❌|❌|❌|❌| | 2.12.x |❌|❌|✅|✅|✅|❌|❌|❌|❌| | 2.10.x |❌|❌|✅|✅|✅|✅|❌|❌|❌| | 2.5 - 2.9 |❌|❌|❌|✅|✅|✅|❌|❌|❌| | 2.4 |❌|❌|❌|❌|✅|✅|❌|❌|❌| | 2.1 - 2.3 |❌|❌|❌|❌|✅|✅|✅|❌|❌| | 2.0 |❌|❌|❌|❌|❌|✅|✅|❌|❌ | 1.7 |❌|❌|❌|❌|❌|✅|✅|✅|✅|
We recommend not using TimescaleDB with Postgres 17.1, 16.5, 15.9, 14.14, 13.17, 12.21. These minor versions introduced a breaking binary interface change that, once identified, was reverted in subsequent minor Postgres versions 17.2, 16.6, 15.10, 14.15, 13.18, and 12.22. When you build from source, best practice is to build with Postgres 17.2, 16.6, etc and higher. Users of Tiger Cloud and platform packages for Linux, Windows, MacOS, Docker, and Kubernetes are unaffected.
Supported operating system
You can deploy TimescaleDB and TimescaleDB Toolkit on the following systems:
| Operation system | Version |
|---|---|
| Debian | 13 Trixe, 12 Bookworm, 11 Bullseye |
| Ubuntu | 24.04 Noble Numbat, 22.04 LTS Jammy Jellyfish |
| Red Hat Enterprise | Linux 9, Linux 8 |
| Fedora | Fedora 35, Fedora 34, Fedora 33 |
| Rocky Linux | Rocky Linux 9 (x86_64), Rocky Linux 8 |
| ArchLinux (community-supported) | Check the available packages |
| Operation system | Version |
|---|---|
| Microsoft Windows | 10, 11 |
| Microsoft Windows Server | 2019, 2020 |
| Operation system | Version |
|---|---|
| macOS | From 10.15 Catalina to 14 Sonoma |
===== PAGE: https://docs.tigerdata.com/about/contribute-to-timescale/ =====
Contribute to Tiger Data
TimescaleDB, pgai, pgvectorscale, TimescaleDB Toolkit, and the Tiger Data documentation are all open source. They are available in GitHub for you to use, review, and update. This page shows you where you can add to Tiger Data products.
Contribute to the code for Tiger Data products
Tiger Data appreciates any help the community can provide to make its products better! You can:
- Open an issue with a bug report, build issue, feature request or suggestion.
- Fork a corresponding repository and submit a pull request.
Head over to the Tiger Data source repositories to learn, review, and help improve our products!
- TimescaleDB: a Postgres extension for high-performance real-time analytics on time-series and event data.
- pgai: a suite of tools to develop RAG, semantic search, and other AI applications more easily with Postgres.
- pgvectorscale: a complement to pgvector for higher performance embedding search and cost-efficient storage for AI applications.
- TimescaleDB Toolkit: all things analytics when using TimescaleDB, with a particular focus on developer ergonomics and performance.
Contribute to Tiger Data documentation
Tiger Data documentation is hosted in the docs GitHub repository and open for contribution from all community members.
See the README and contribution guide for details.
===== PAGE: https://docs.tigerdata.com/about/release-notes/ =====
Release notes
For information about new updates and improvement to Tiger Data products, see the Changelog. For release notes about our downloadable products, see:
- TimescaleDB - an open-source database that makes SQL scalable for time-series data, packaged as a Postgres extension.
- TimescaleDB Toolkit - additional functions to ease all things analytics when using TimescaleDB.
- pgai - brings AI workflows to your Postgres database.
- pgvectorscale - higher performance embedding search and cost-efficient storage for AI applications on Postgres.
- pgspot - spot vulnerabilities in Postgres extension scripts.
- live-migration - a Docker image to migrate data to a Tiger Cloud service.
Want to stay up-to-date with new releases? On the main page for each repository
click Watch, select Custom and then check Releases.
===== PAGE: https://docs.tigerdata.com/migrate/livesync-for-postgresql/ =====
Sync data from Postgres to your service
You use the source Postgres connector in Tiger Cloud to synchronize all data or specific tables from a Postgres database instance to your service, in real time. You run the connector continuously, turning Postgres into a primary database with your service as a logical replica. This enables you to leverage Tiger Cloud’s real-time analytics capabilities on your replica data.
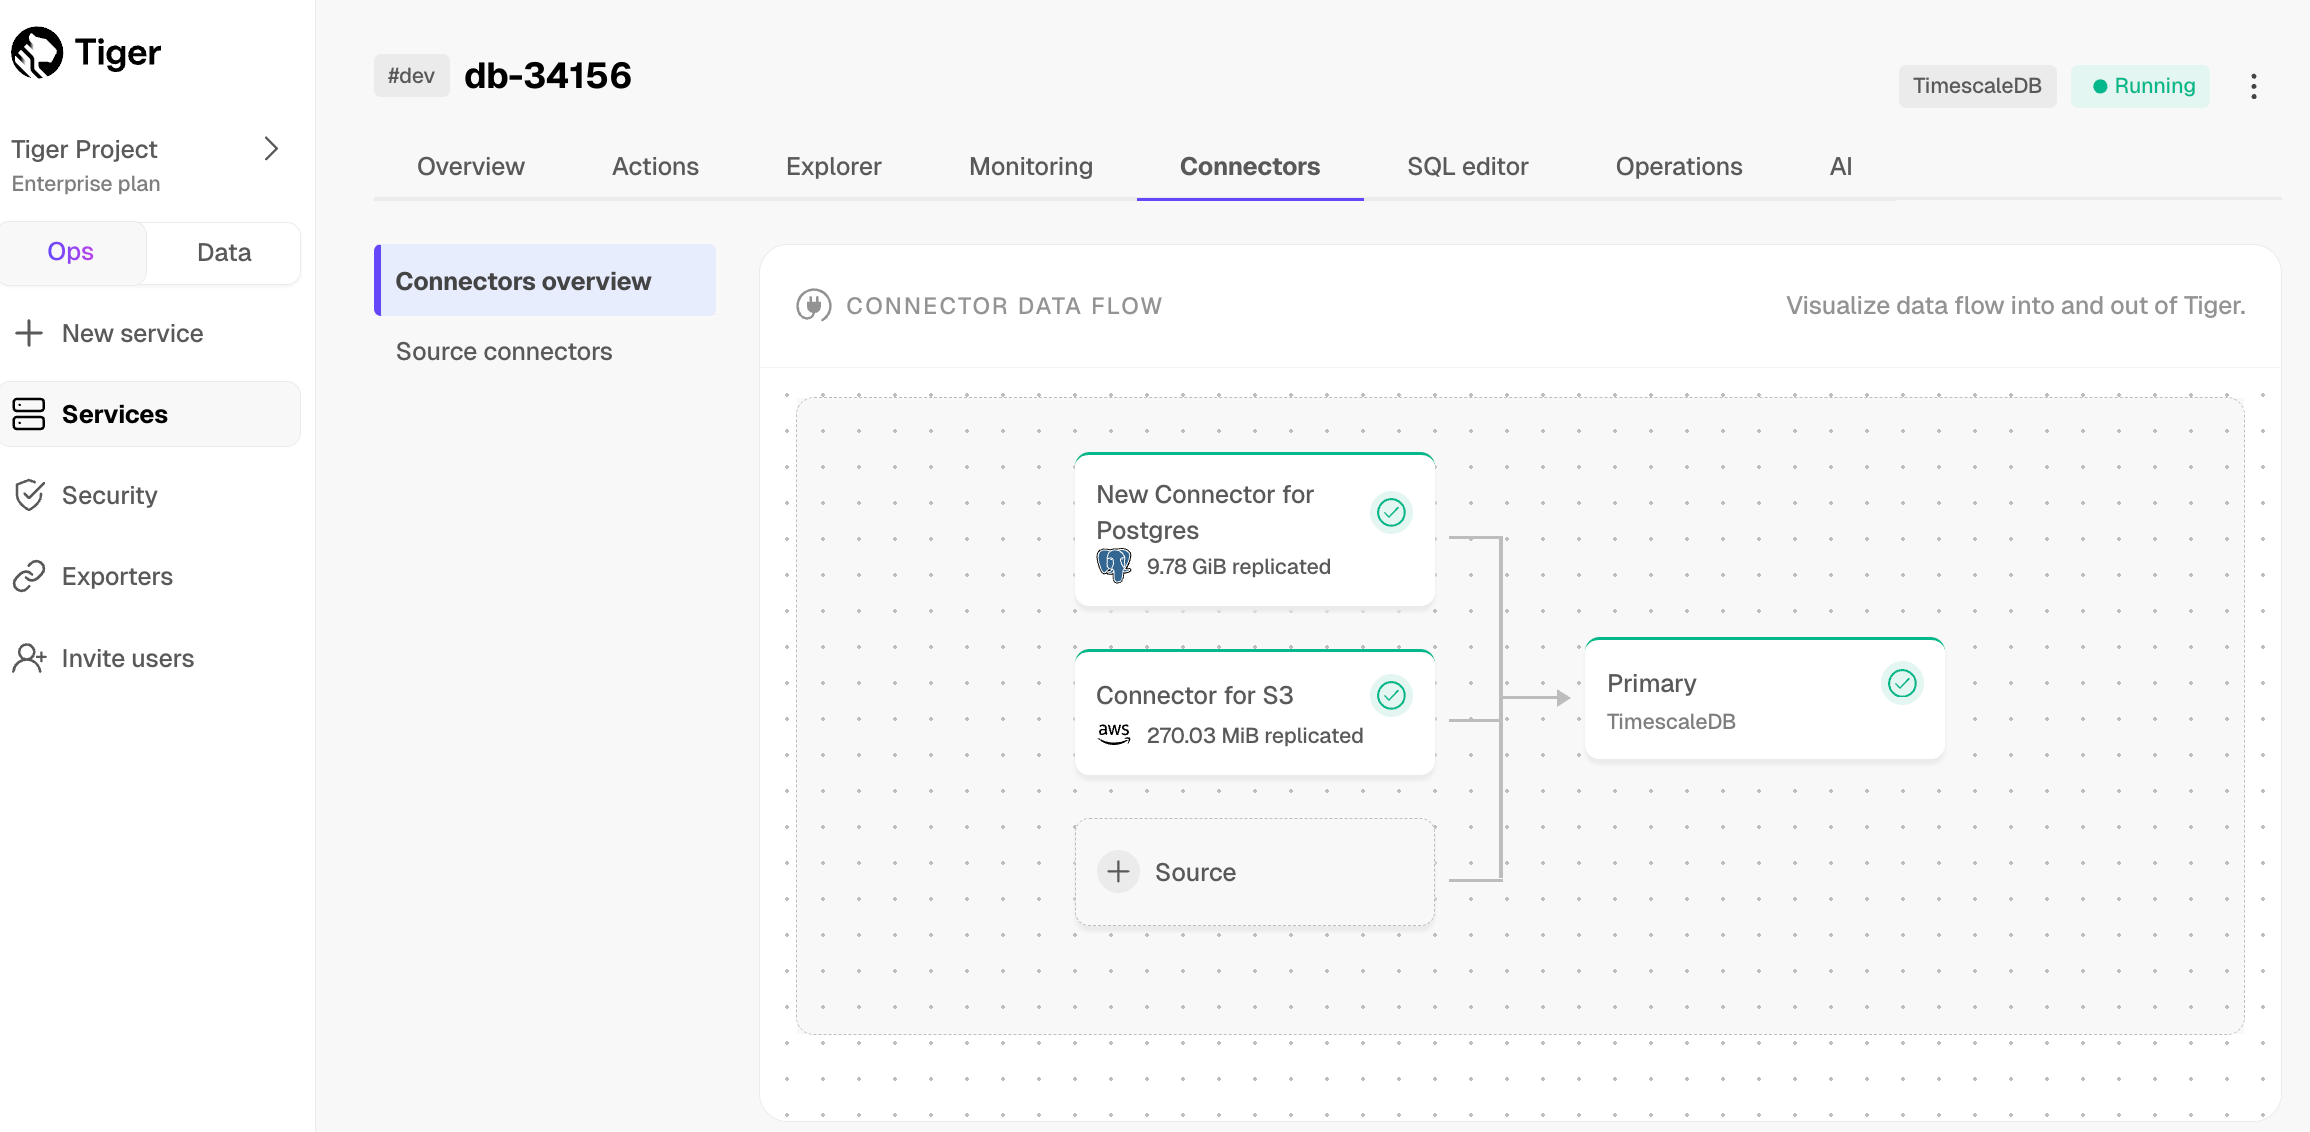
The source Postgres connector in Tiger Cloud leverages the well-established Postgres logical replication protocol. By relying on this protocol, Tiger Cloud ensures compatibility, familiarity, and a broader knowledge base—making it easier for you to adopt the connector and integrate your data.
You use the source Postgres connector for data synchronization, rather than migration. This includes:
Copy existing data from a Postgres instance to a Tiger Cloud service:
- Copy data at up to 150 GB/hr.
You need at least a 4 CPU/16 GB source database, and a 4 CPU/16 GB target service.
- Copy the publication tables in parallel.
Large tables are still copied using a single connection. Parallel copying is in the backlog.
- Forget foreign key relationships.
The connector disables foreign key validation during the sync. For example, if a
metricstable refers to theidcolumn on thetagstable, you can still sync only themetricstable without worrying about their foreign key relationships.- Track progress.
Postgres exposes
COPYprogress underpg_stat_progress_copy.Synchronize real-time changes from a Postgres instance to a Tiger Cloud service.
Add and remove tables on demand using the Postgres PUBLICATION interface.
Enable features such as hypertables, columnstore, and continuous aggregates on your logical replica.
Early access: this source Postgres connector is not yet supported for production use. If you have any questions or feedback, talk to us in #livesync in the Tiger Community.
Prerequisites
To follow the steps on this page:
- Create a target Tiger Cloud service with real-time analytics enabled.
You need your connection details.
Install the Postgres client tools on your sync machine.
Ensure that the source Postgres instance and the target Tiger Cloud service have the same extensions installed.
The source Postgres connector does not create extensions on the target. If the table uses column types from an extension,
first create the extension on the target Tiger Cloud service before syncing the table.
Limitations
- The source Postgres instance must be accessible from the Internet.
Services hosted behind a firewall or VPC are not supported. This functionality is on the roadmap.
- Indexes, including the primary key and unique constraints, are not migrated to the target Tiger Cloud service.
We recommend that, depending on your query patterns, you create only the necessary indexes on the target Tiger Cloud service.
This works for Postgres databases only as source. TimescaleDB is not yet supported.
The source must be running Postgres 13 or later.
Schema changes must be co-ordinated.
Make compatible changes to the schema in your Tiger Cloud service first, then make the same changes to the source Postgres instance.
- Ensure that the source Postgres instance and the target Tiger Cloud service have the same extensions installed.
The source Postgres connector does not create extensions on the target. If the table uses column types from an extension, first create the extension on the target Tiger Cloud service before syncing the table.
There is WAL volume growth on the source Postgres instance during large table copy.
Continuous aggregate invalidation
The connector uses session_replication_role=replica during data replication,
which prevents table triggers from firing. This includes the internal
triggers that mark continuous aggregates as invalid when underlying data
changes.
If you have continuous aggregates on your target database, they do not automatically refresh for data inserted during the migration. This limitation only applies to data below the continuous aggregate's materialization watermark. For example, backfilled data. New rows synced above the continuous aggregate watermark are used correctly when refreshing.
This can lead to:
- Missing data in continuous aggregates for the migration period.
- Stale aggregate data.
- Queries returning incomplete results.
If the continuous aggregate exists in the source database, best
practice is to add it to the Postgres connector publication. If it only exists on the
target database, manually refresh the continuous aggregate using the force
option of refresh_continuous_aggregate.
Set your connection string
This variable holds the connection information for the source database. In the terminal on your migration machine, set the following:
export SOURCE="postgres://<user>:<password>@<source host>:<source port>/<db_name>"
Avoid using connection strings that route through connection poolers like PgBouncer or similar tools. This tool requires a direct connection to the database to function properly.
Tune your source database
Updating parameters on a Postgres instance will cause an outage. Choose a time that will cause the least issues to tune this database.
Tune the Write Ahead Log (WAL) on the RDS/Aurora Postgres source database
In https://console.aws.amazon.com/rds/home#databases:, select the RDS instance to migrate.
Click
Configuration, scroll down and note theDB instance parameter group, then clickParameter Groups
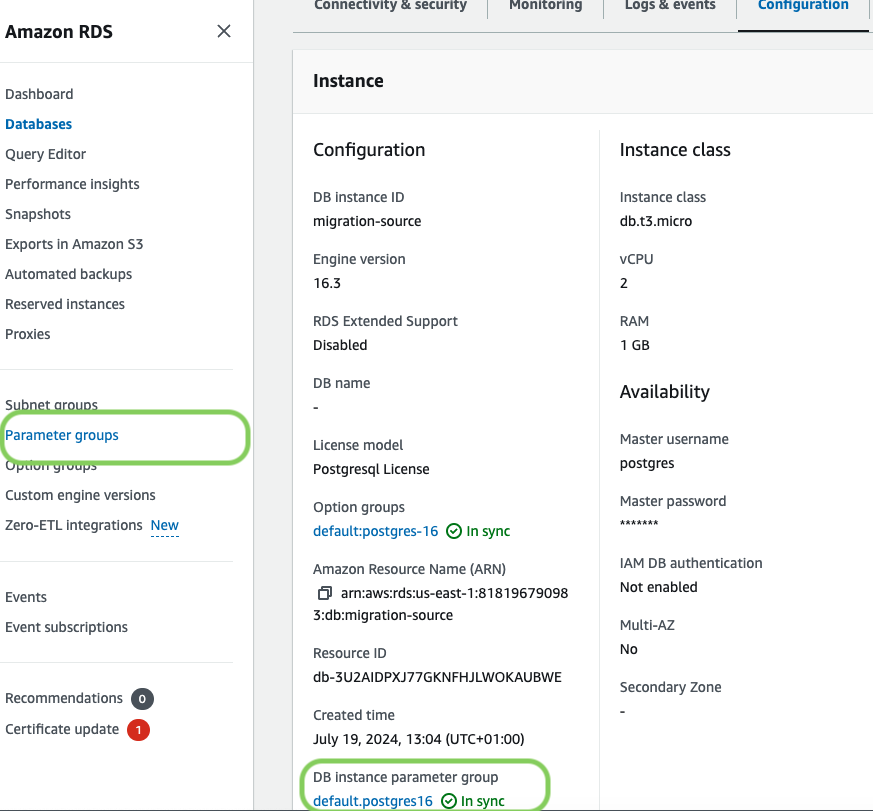
- Click
Create parameter group, fill in the form with the following values, then clickCreate.- Parameter group name - whatever suits your fancy.
- Description - knock yourself out with this one.
- Engine type -
PostgreSQL - Parameter group family - the same as
DB instance parameter groupin yourConfiguration.
- In
Parameter groups, select the parameter group you created, then clickEdit. Update the following parameters, then click
Save changes.rds.logical_replicationset to1: record the information needed for logical decoding.wal_sender_timeoutset to0: disable the timeout for the sender process.
In RDS, navigate back to your databases, select the RDS instance to migrate, and click
Modify.Scroll down to
Database options, select your new parameter group, and clickContinue.Click
Apply immediatelyor choose a maintenance window, then clickModify DB instance.
Changing parameters will cause an outage. Wait for the database instance to reboot before continuing.
- Verify that the settings are live in your database.
Create a user for the source Postgres connector and assign permissions
Create
<pg connector username>:psql source -c "CREATE USER <pg connector username> PASSWORD '<password>'"
You can use an existing user. However, you must ensure that the user has the following permissions.
Grant permissions to create a replication slot:
psql source -c "GRANT rds_replication TO <pg connector username>"Grant permissions to create a publication:
psql source -c "GRANT CREATE ON DATABASE <database name> TO <pg connector username>"Assign the user permissions on the source database:
psql source <<EOF GRANT USAGE ON SCHEMA "public" TO <pg connector username>; GRANT SELECT ON ALL TABLES IN SCHEMA "public" TO <pg connector username>; ALTER DEFAULT PRIVILEGES IN SCHEMA "public" GRANT SELECT ON TABLES TO <pg connector username>; EOF
If the tables you are syncing are not in the
publicschema, grant the user permissions for each schema you are syncing:psql source <<EOF GRANT USAGE ON SCHEMA <schema> TO <pg connector username>; GRANT SELECT ON ALL TABLES IN SCHEMA <schema> TO <pg connector username>; ALTER DEFAULT PRIVILEGES IN SCHEMA <schema> GRANT SELECT ON TABLES TO <pg connector username>; EOFOn each table you want to sync, make
<pg connector username>the owner:psql source -c 'ALTER TABLE OWNER TO <pg connector username>;'
You can skip this step if the replicating user is already the owner of the tables.
Enable replication
DELETEandUPDATEoperations
Replica identity assists data replication by identifying the rows being modified. Your options are that each table and hypertable in the source database should either have:
- A primary key: data replication defaults to the primary key of the table being replicated. Nothing to do.
- A viable unique index: each table has a unique, non-partial, non-deferrable index that includes only columns
marked as
NOT NULL. If a UNIQUE index does not exist, create one to assist the migration. You can delete if after migration.
For each table, set REPLICA IDENTITY to the viable unique index:
psql -X -d source -c 'ALTER TABLE REPLICA IDENTITY USING INDEX <_index_name>'
- No primary key or viable unique index: use brute force.
For each table, set REPLICA IDENTITY to FULL:
psql -X -d source -c 'ALTER TABLE {table_name} REPLICA IDENTITY FULL'
For each UPDATE or DELETE statement, Postgres reads the whole table to find all matching rows. This results
in significantly slower replication. If you are expecting a large number of UPDATE or DELETE operations on the table,
best practice is to not use FULL.
Tune the Write Ahead Log (WAL) on the Postgres source database
psql source <<EOF ALTER SYSTEM SET wal_level='logical'; ALTER SYSTEM SET max_wal_senders=10; ALTER SYSTEM SET wal_sender_timeout=0; EOF
This will require a restart of the Postgres source database.
Create a user for the connector and assign permissions
Create
<pg connector username>:psql source -c "CREATE USER <pg connector username> PASSWORD '<password>'"
You can use an existing user. However, you must ensure that the user has the following permissions.
Grant permissions to create a replication slot:
psql source -c "ALTER ROLE <pg connector username> REPLICATION"Grant permissions to create a publication:
psql source -c "GRANT CREATE ON DATABASE <database name> TO <pg connector username>"Assign the user permissions on the source database:
psql source <<EOF GRANT USAGE ON SCHEMA "public" TO <pg connector username>; GRANT SELECT ON ALL TABLES IN SCHEMA "public" TO <pg connector username>; ALTER DEFAULT PRIVILEGES IN SCHEMA "public" GRANT SELECT ON TABLES TO <pg connector username>; EOF
If the tables you are syncing are not in the
publicschema, grant the user permissions for each schema you are syncing:psql source <<EOF GRANT USAGE ON SCHEMA <schema> TO <pg connector username>; GRANT SELECT ON ALL TABLES IN SCHEMA <schema> TO <pg connector username>; ALTER DEFAULT PRIVILEGES IN SCHEMA <schema> GRANT SELECT ON TABLES TO <pg connector username>; EOFOn each table you want to sync, make
<pg connector username>the owner:psql source -c 'ALTER TABLE OWNER TO <pg connector username>;'
You can skip this step if the replicating user is already the owner of the tables.
Enable replication
DELETEandUPDATEoperations
Replica identity assists data replication by identifying the rows being modified. Your options are that each table and hypertable in the source database should either have:
- A primary key: data replication defaults to the primary key of the table being replicated. Nothing to do.
- A viable unique index: each table has a unique, non-partial, non-deferrable index that includes only columns
marked as
NOT NULL. If a UNIQUE index does not exist, create one to assist the migration. You can delete if after migration.
For each table, set REPLICA IDENTITY to the viable unique index:
psql -X -d source -c 'ALTER TABLE REPLICA IDENTITY USING INDEX <_index_name>'
- No primary key or viable unique index: use brute force.
For each table, set REPLICA IDENTITY to FULL:
psql -X -d source -c 'ALTER TABLE {table_name} REPLICA IDENTITY FULL'
For each UPDATE or DELETE statement, Postgres reads the whole table to find all matching rows. This results
in significantly slower replication. If you are expecting a large number of UPDATE or DELETE operations on the table,
best practice is to not use FULL.
Synchronize data to your Tiger Cloud service
To sync data from your Postgres database to your Tiger Cloud service using Tiger Cloud Console:
- Connect to your Tiger Cloud service
In Tiger Cloud Console, select the service to sync live data to.
- Connect the source database and the target service
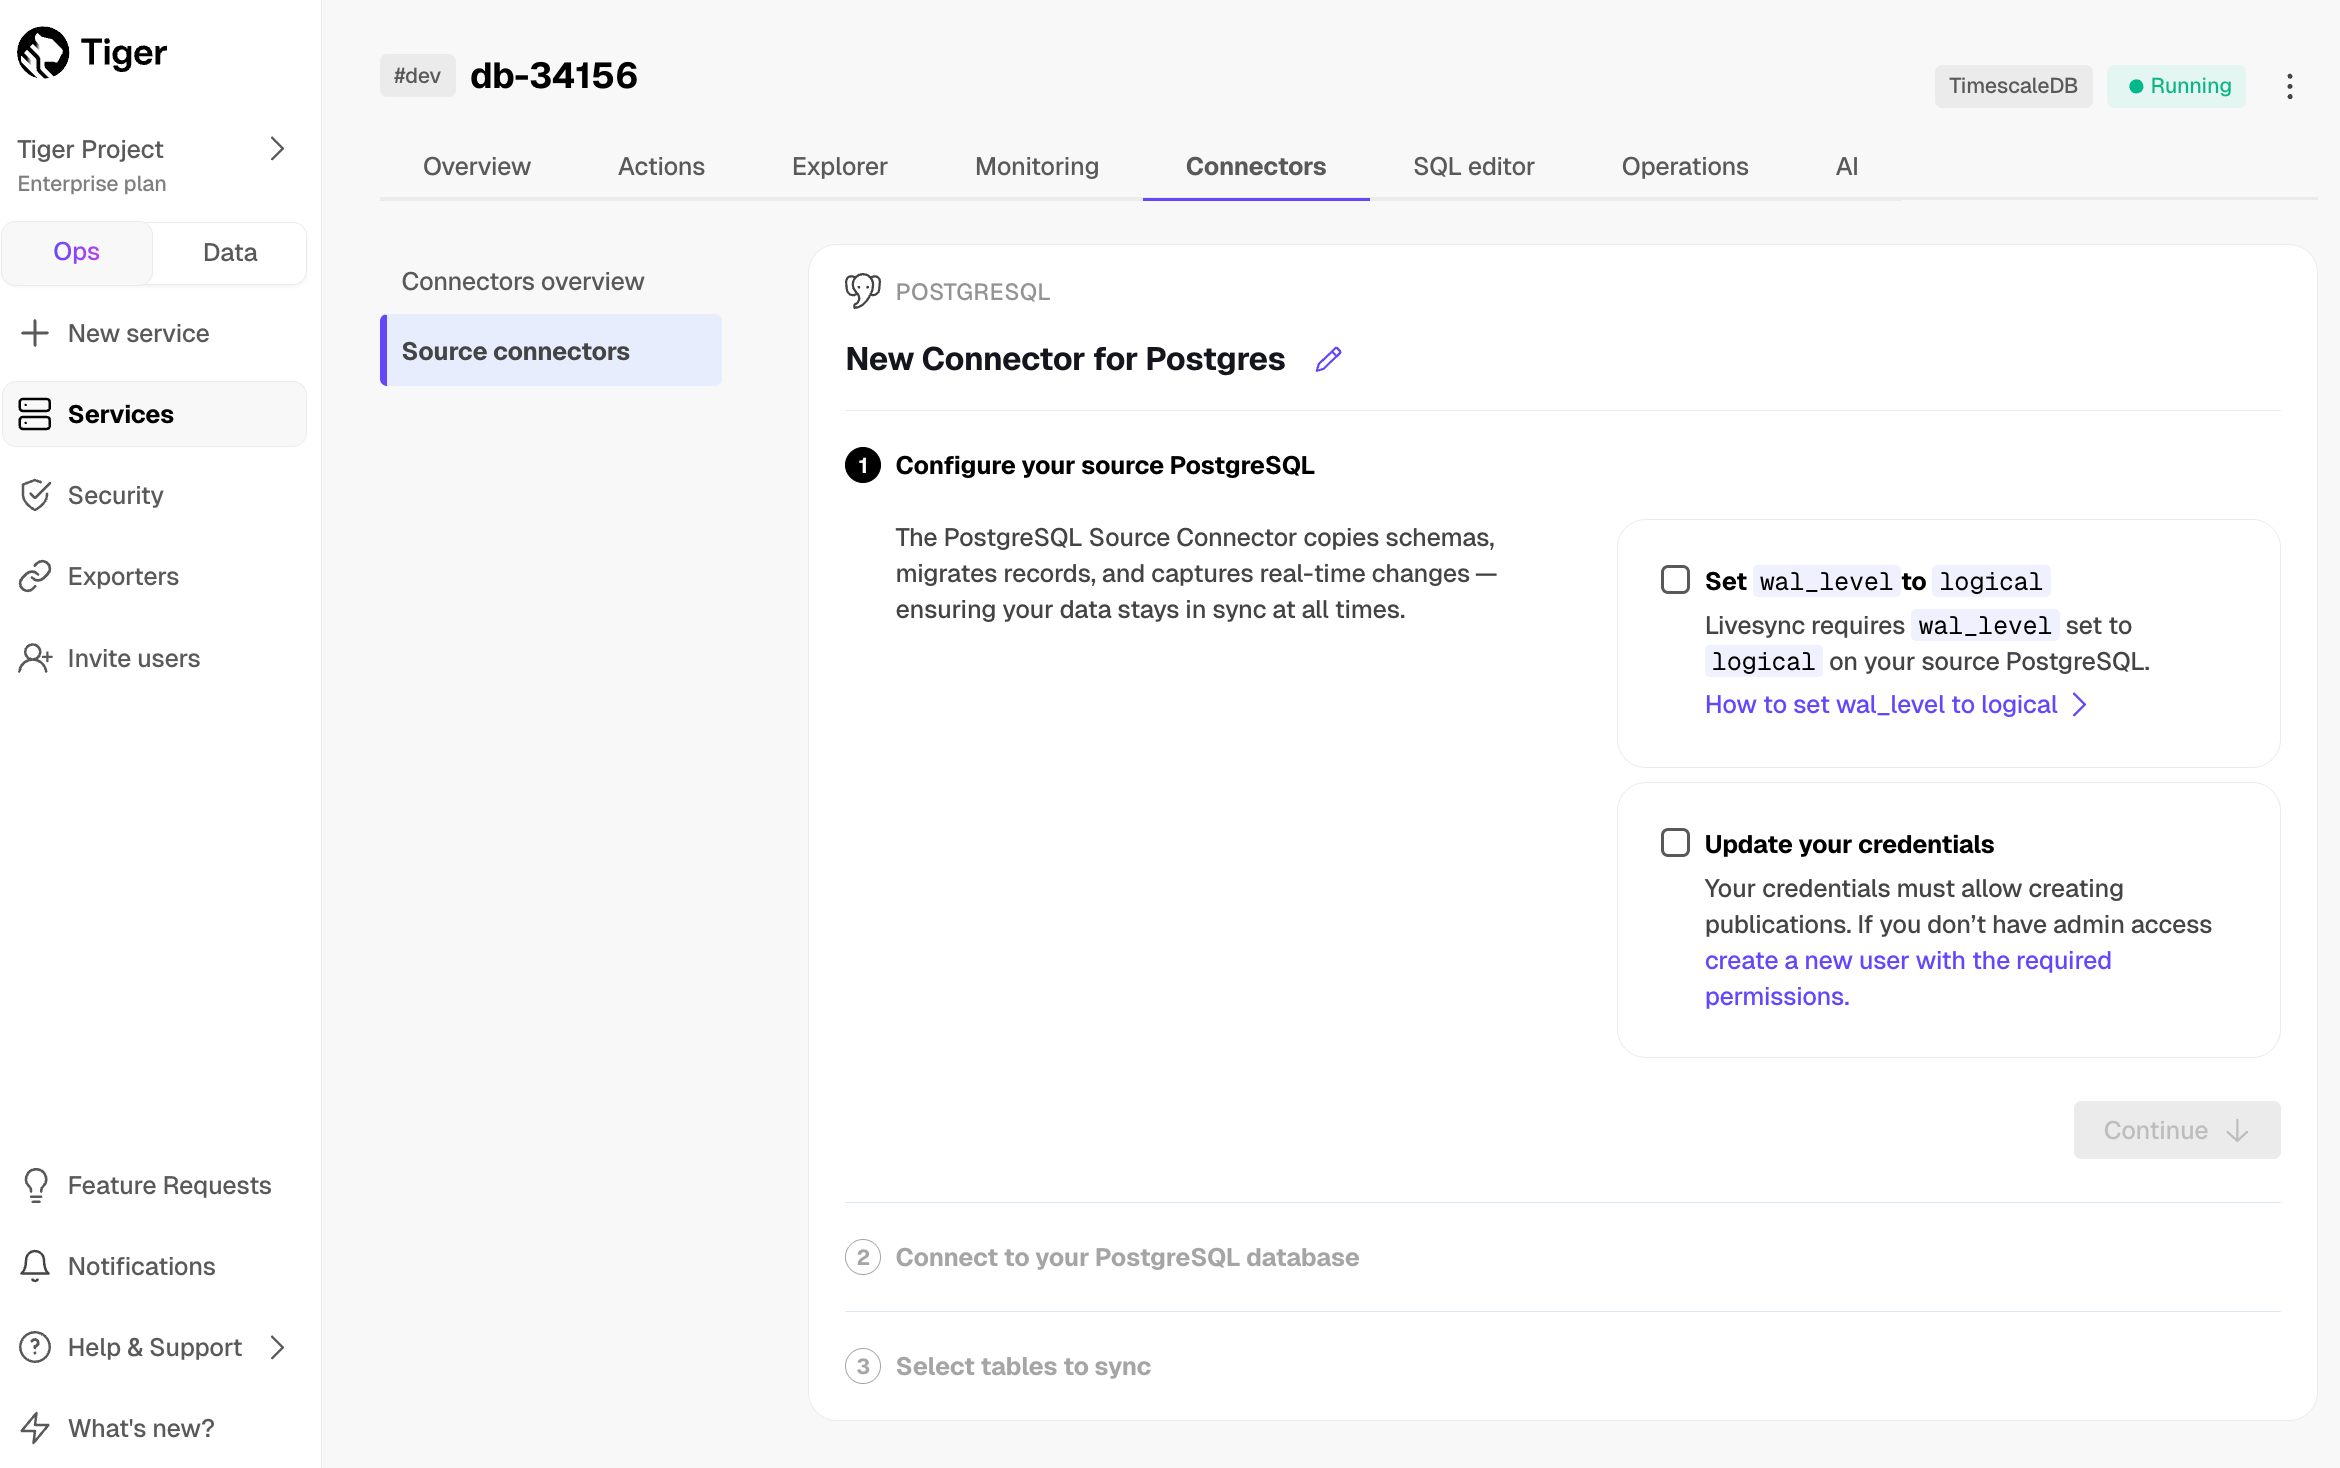
- Click
Connectors>PostgreSQL. - Set the name for the new connector by clicking the pencil icon.
- Check the boxes for
Set wal_level to logicalandUpdate your credentials, then clickContinue. Enter your database credentials or a Postgres connection string, then click
Connect to database. This is the connection string for<pg connector username>. Tiger Cloud Console connects to the source database and retrieves the schema information.Optimize the data to synchronize in hypertables
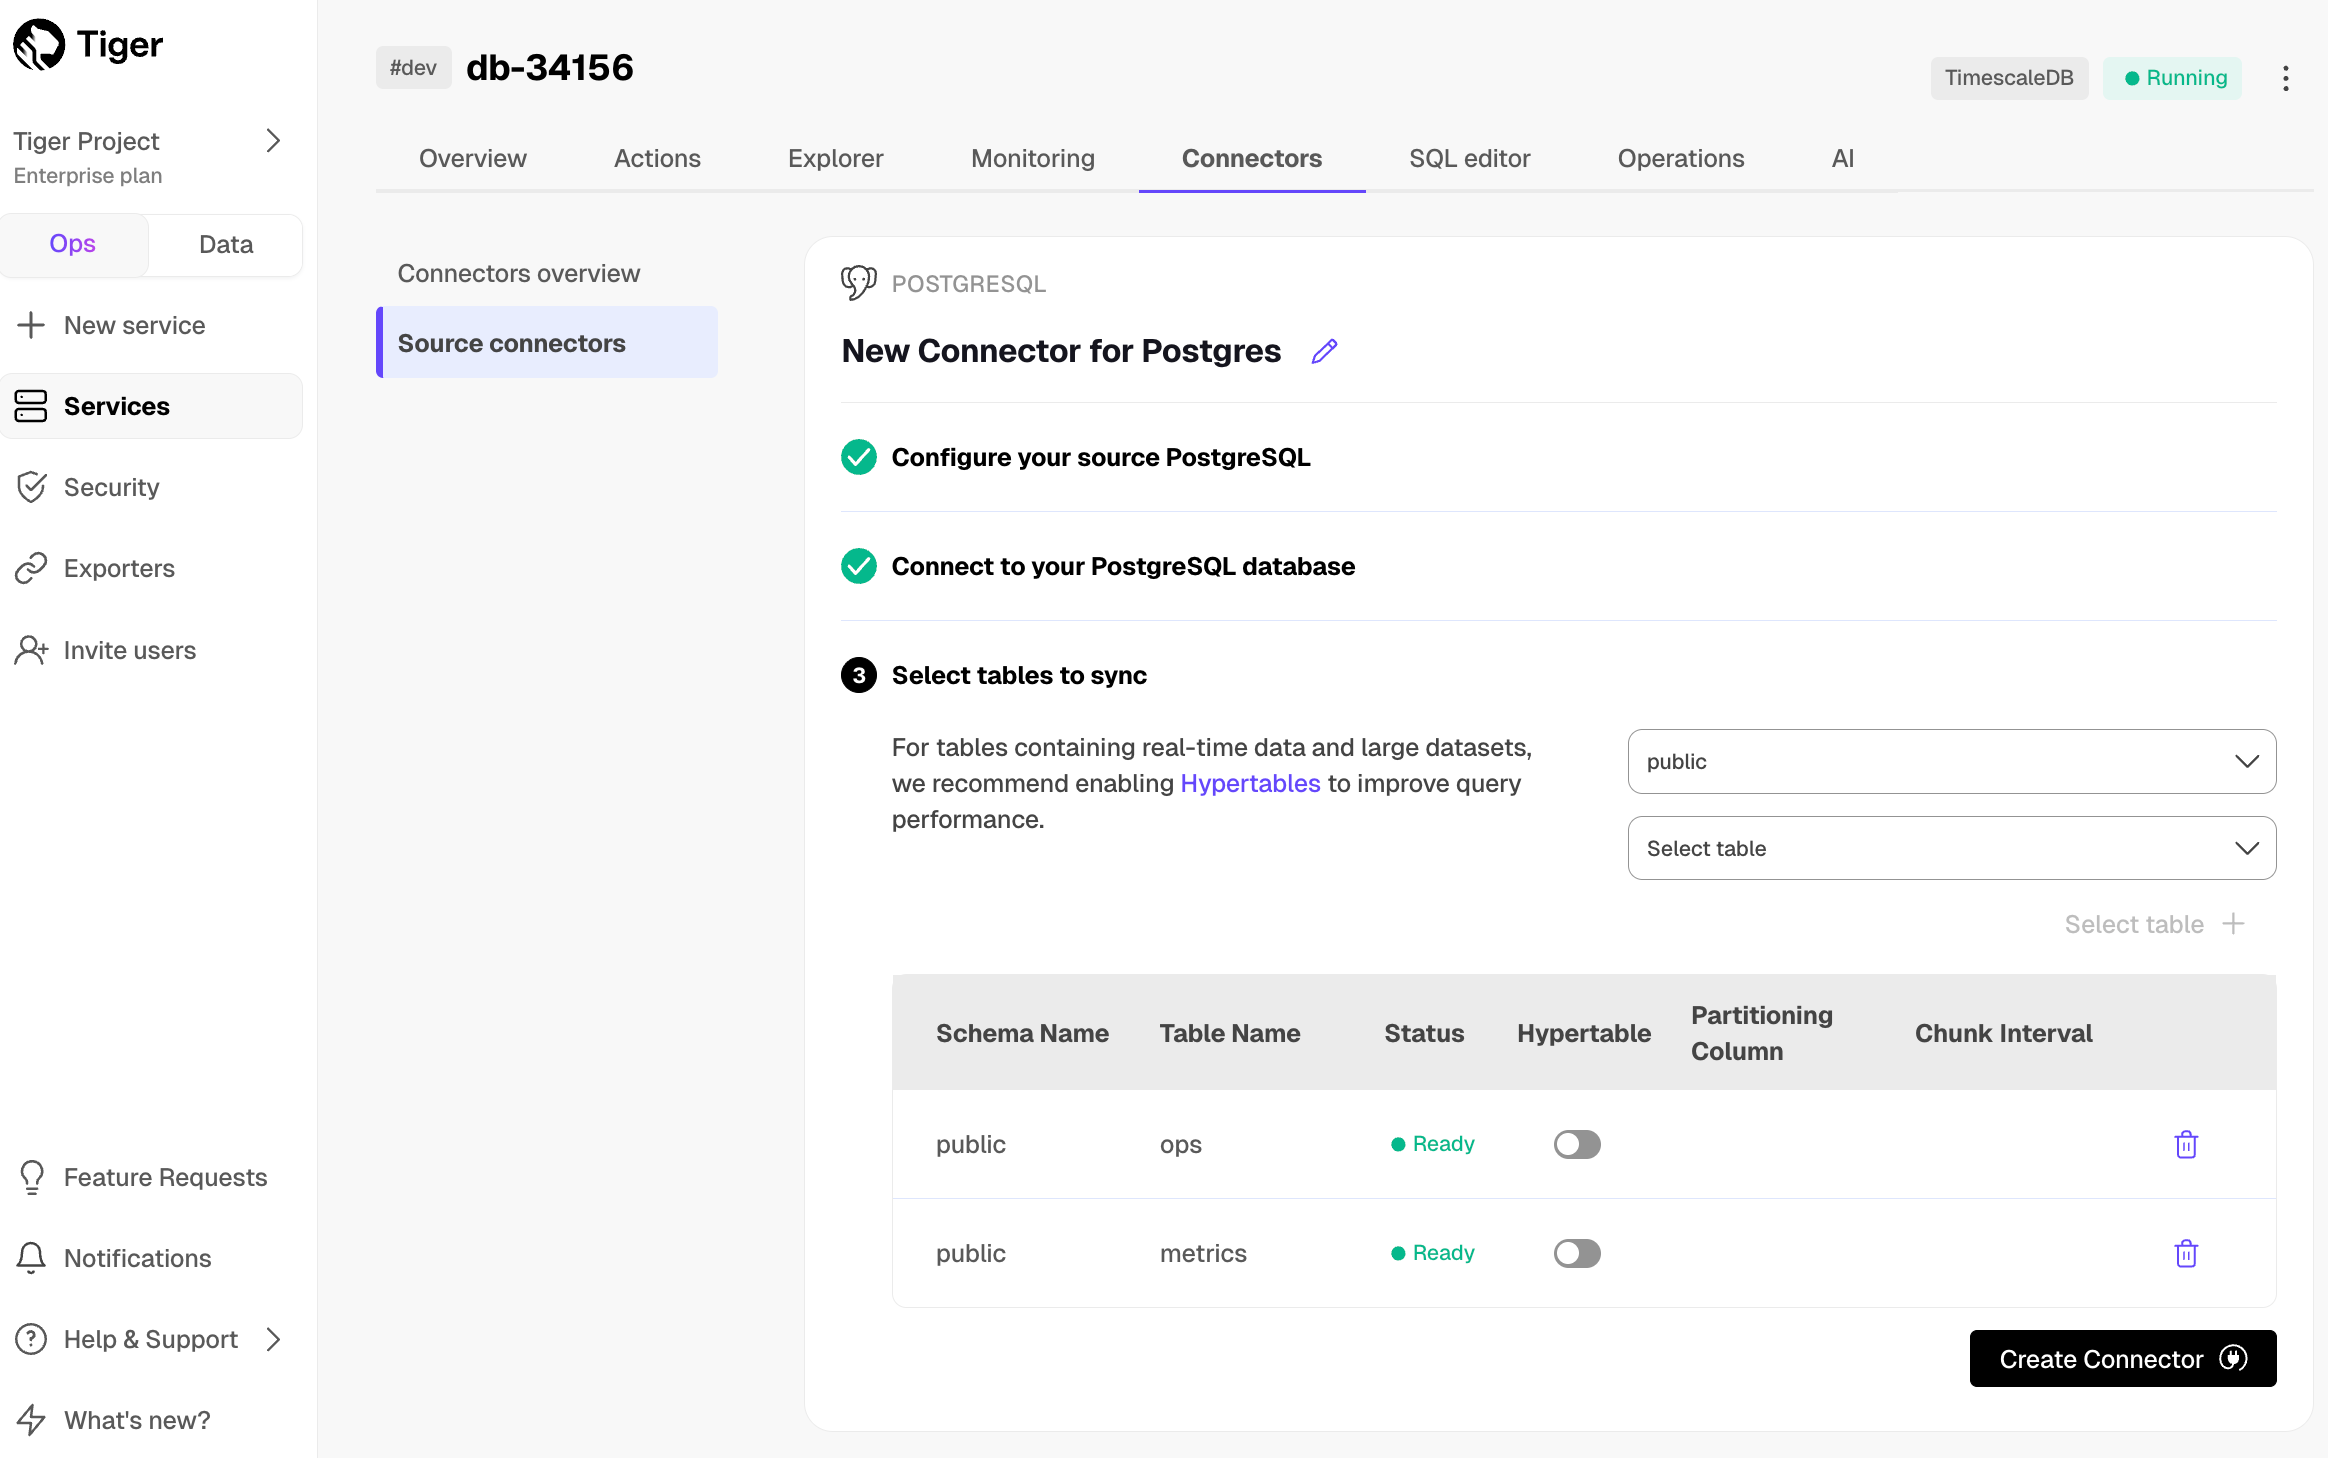
- In the
Select tabledropdown, select the tables to sync. Click
Select tables +.Tiger Cloud Console checks the table schema and, if possible, suggests the column to use as the time dimension in a hypertable.
Click
Create Connector.Tiger Cloud Console starts source Postgres connector between the source database and the target service and displays the progress.
Monitor synchronization
1. To view the amount of data replicated, click `Connectors`. The diagram in `Connector data flow` gives you an overview of the connectors you have created, their status, and how much data has been replicated.
1. To review the syncing progress for each table, click `Connectors` > `Source connectors`, then select the name of your connector in the table.
- Manage the connector
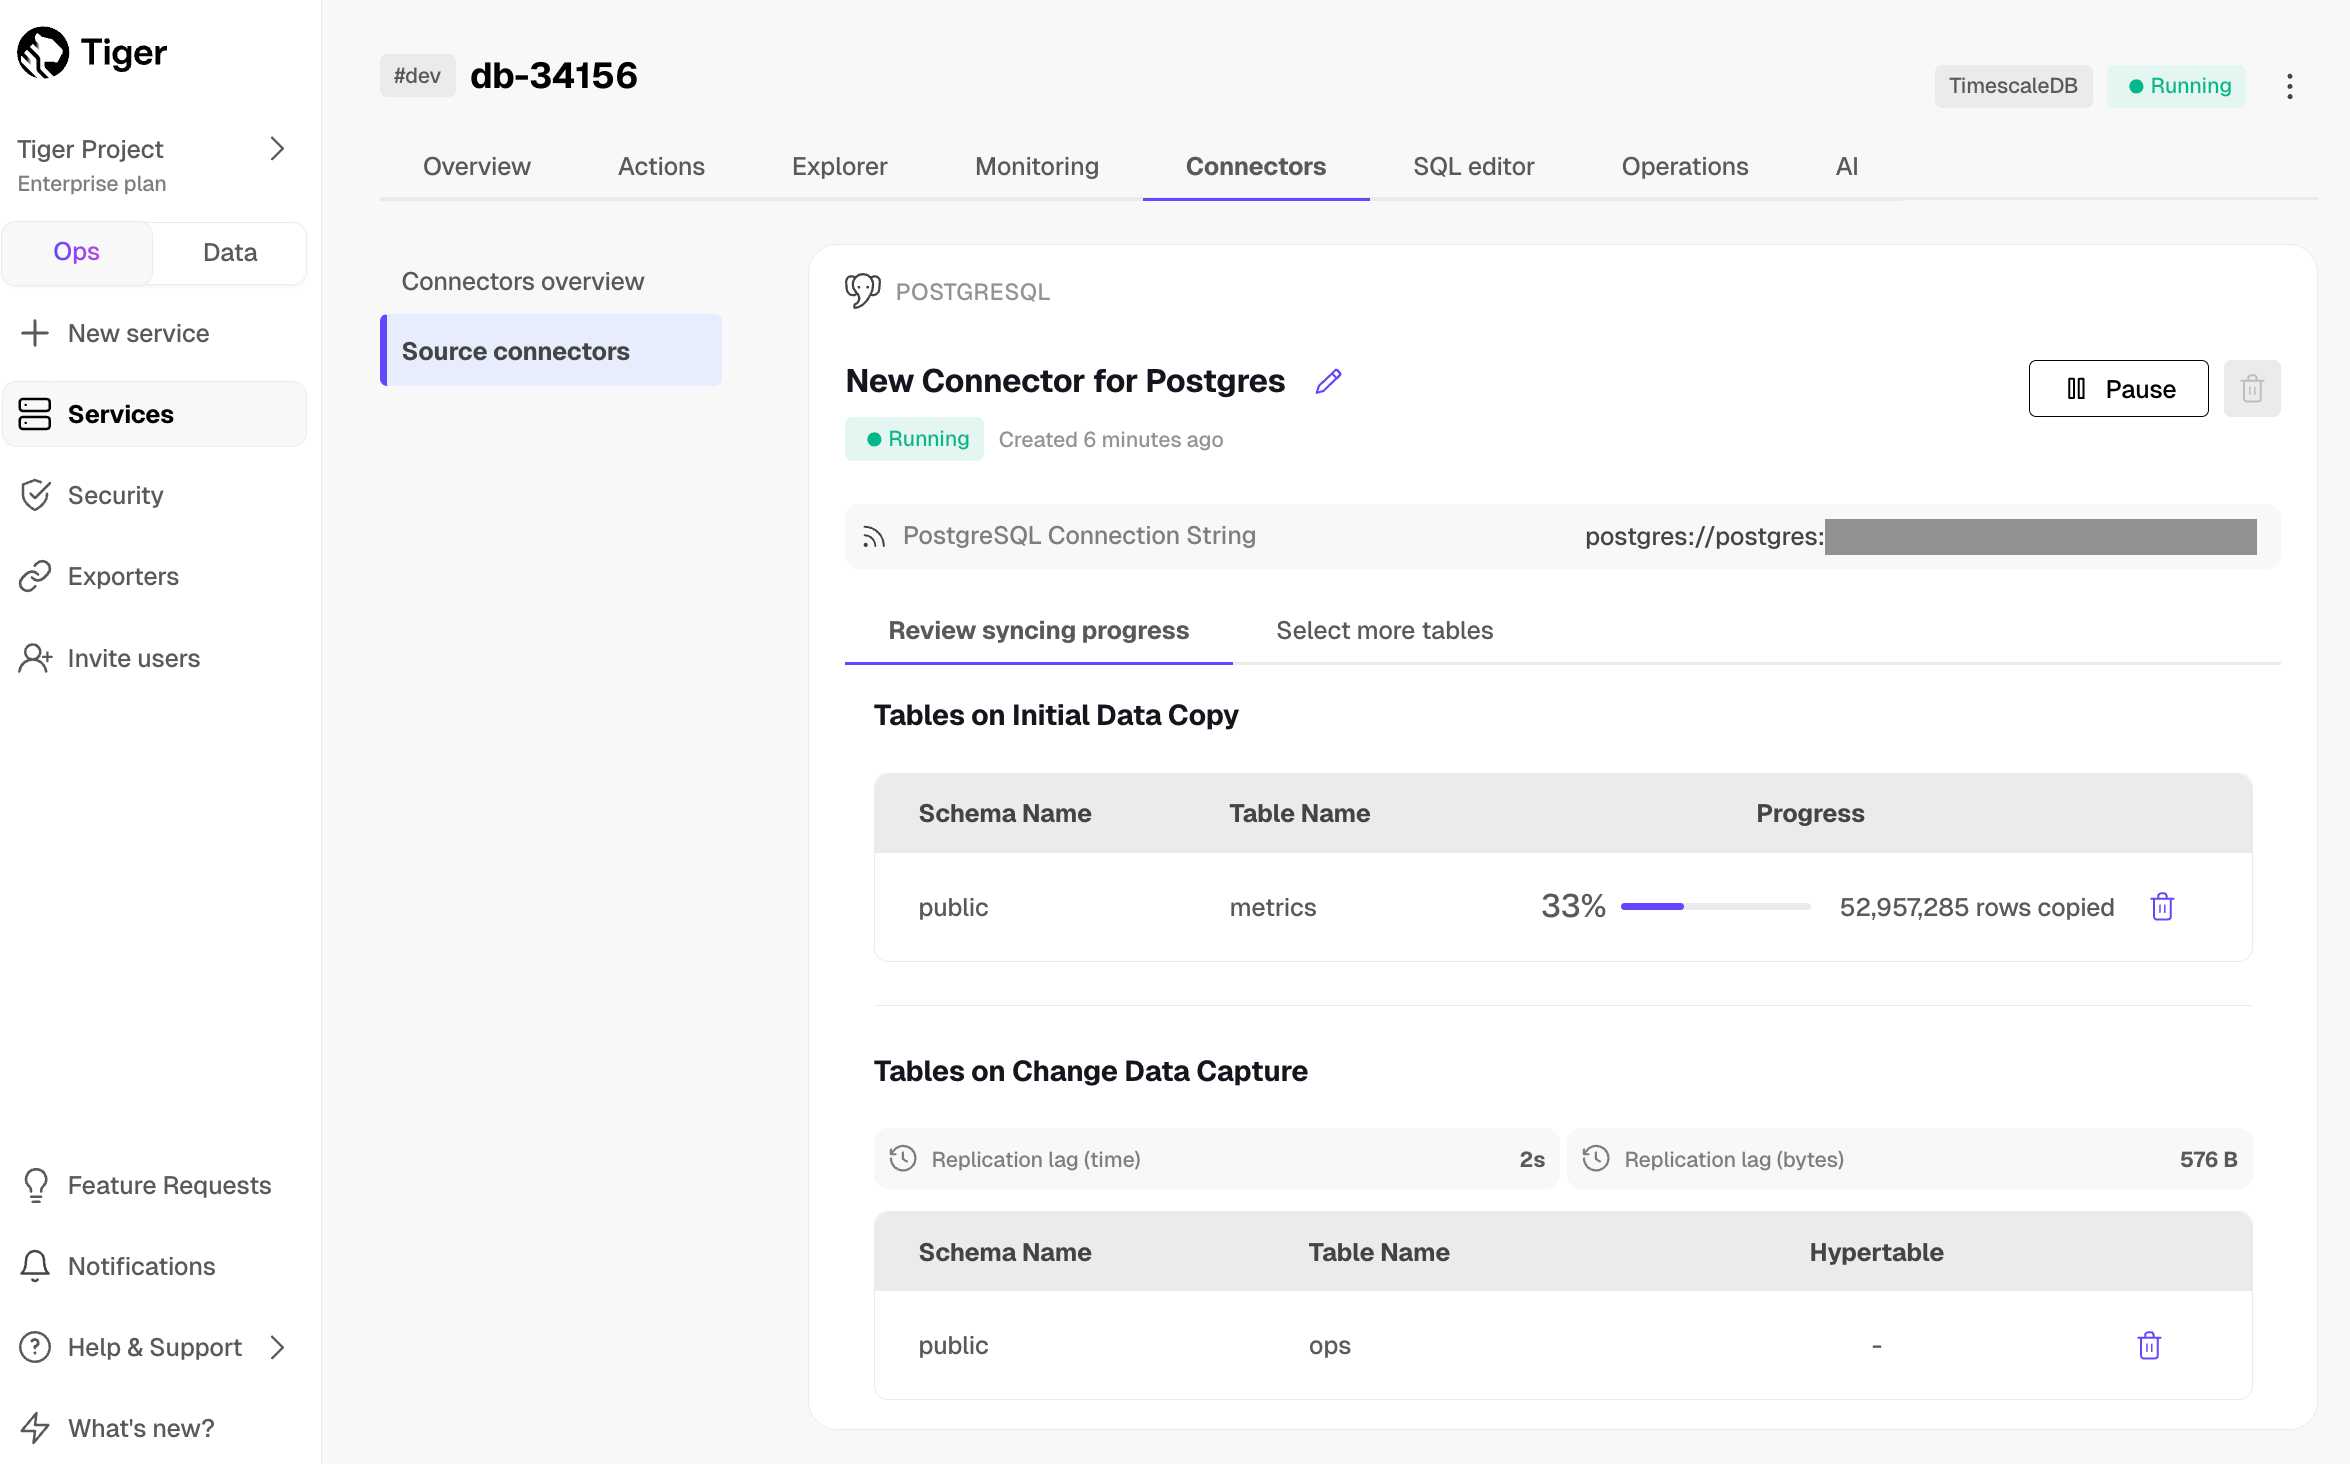
To edit the connector, click
Connectors>Source connectors, then select the name of your connector in the table. You can rename the connector, delete or add new tables for syncing.To pause a connector, click
Connectors>Source connectors, then open the three-dot menu on the right and selectPause.To delete a connector, click
Connectors>Source connectors, then open the three-dot menu on the right and selectDelete. You must pause the connector before deleting it.
And that is it, you are using the source Postgres connector to synchronize all the data, or specific tables, from a Postgres database instance to your Tiger Cloud service, in real time.
Prerequisites
Best practice is to use an Ubuntu EC2 instance hosted in the same region as your Tiger Cloud service to move data. That is, the machine you run the commands on to move your data from your source database to your target Tiger Cloud service.
Before you move your data:
- Create a target Tiger Cloud service.
Each Tiger Cloud service has a single Postgres instance that supports the most popular extensions. Tiger Cloud services do not support tablespaces, and there is no superuser associated with a service. Best practice is to create a Tiger Cloud service with at least 8 CPUs for a smoother experience. A higher-spec instance can significantly reduce the overall migration window.
To ensure that maintenance does not run while migration is in progress, best practice is to adjust the maintenance window.
Ensure that the source Postgres instance and the target Tiger Cloud service have the same extensions installed.
The source Postgres connector does not create extensions on the target. If the table uses column types from an extension, first create the extension on the target Tiger Cloud service before syncing the table.
- Install Docker on your sync machine.
For a better experience, use a 4 CPU/16GB EC2 instance or greater to run the source Postgres connector.
- Install the Postgres client tools on your sync machine.
This includes psql, pg_dump, pg_dumpall, and vacuumdb commands.
Limitations
The schema is not migrated by the source Postgres connector, you use
pg_dump/pg_restoreto migrate it.This works for Postgres databases only as source. TimescaleDB is not yet supported.
The source must be running Postgres 13 or later.
Schema changes must be co-ordinated.
Make compatible changes to the schema in your Tiger Cloud service first, then make the same changes to the source Postgres instance.
- Ensure that the source Postgres instance and the target Tiger Cloud service have the same extensions installed.
The source Postgres connector does not create extensions on the target. If the table uses column types from an extension, first create the extension on the target Tiger Cloud service before syncing the table.
There is WAL volume growth on the source Postgres instance during large table copy.
Continuous aggregate invalidation
The connector uses session_replication_role=replica during data replication,
which prevents table triggers from firing. This includes the internal
triggers that mark continuous aggregates as invalid when underlying data
changes.
If you have continuous aggregates on your target database, they do not automatically refresh for data inserted during the migration. This limitation only applies to data below the continuous aggregate's materialization watermark. For example, backfilled data. New rows synced above the continuous aggregate watermark are used correctly when refreshing.
This can lead to:
- Missing data in continuous aggregates for the migration period.
- Stale aggregate data.
- Queries returning incomplete results.
If the continuous aggregate exists in the source database, best
practice is to add it to the Postgres connector publication. If it only exists on the
target database, manually refresh the continuous aggregate using the force
option of refresh_continuous_aggregate.
Set your connection strings
The <user> in the SOURCE connection must have the replication role granted in order to create a replication slot.
These variables hold the connection information for the source database and target Tiger Cloud service. In Terminal on your migration machine, set the following:
export SOURCE="postgres://<user>:<password>@<source host>:<source port>/<db_name>"
export TARGET="postgres://tsdbadmin:<PASSWORD>@<HOST>:<PORT>/tsdb?sslmode=require"
You find the connection information for your Tiger Cloud service in the configuration file you downloaded when you created the service.
Avoid using connection strings that route through connection poolers like PgBouncer or similar tools. This tool requires a direct connection to the database to function properly.
Tune your source database
Updating parameters on a Postgres instance will cause an outage. Choose a time that will cause the least issues to tune this database.
Update the DB instance parameter group for your source database
In https://console.aws.amazon.com/rds/home#databases:, select the RDS instance to migrate.
Click
Configuration, scroll down and note theDB instance parameter group, then clickParameter groups
- Click
Create parameter group, fill in the form with the following values, then clickCreate.- Parameter group name - whatever suits your fancy.
- Description - knock yourself out with this one.
- Engine type -
PostgreSQL - Parameter group family - the same as
DB instance parameter groupin yourConfiguration.
- In
Parameter groups, select the parameter group you created, then clickEdit. Update the following parameters, then click
Save changes.rds.logical_replicationset to1: record the information needed for logical decoding.wal_sender_timeoutset to0: disable the timeout for the sender process.
In RDS, navigate back to your databases, select the RDS instance to migrate, and click
Modify.Scroll down to
Database options, select your new parameter group, and clickContinue.Click
Apply immediatelyor choose a maintenance window, then clickModify DB instance.
Changing parameters will cause an outage. Wait for the database instance to reboot before continuing.
- Verify that the settings are live in your database.
Enable replication
DELETEandUPDATEoperations
Replica identity assists data replication by identifying the rows being modified. Your options are that each table and hypertable in the source database should either have:
- A primary key: data replication defaults to the primary key of the table being replicated. Nothing to do.
- A viable unique index: each table has a unique, non-partial, non-deferrable index that includes only columns
marked as
NOT NULL. If a UNIQUE index does not exist, create one to assist the migration. You can delete if after migration.
For each table, set REPLICA IDENTITY to the viable unique index:
psql -X -d source -c 'ALTER TABLE REPLICA IDENTITY USING INDEX <_index_name>'
- No primary key or viable unique index: use brute force.
For each table, set REPLICA IDENTITY to FULL:
psql -X -d source -c 'ALTER TABLE {table_name} REPLICA IDENTITY FULL'
For each UPDATE or DELETE statement, Postgres reads the whole table to find all matching rows. This results
in significantly slower replication. If you are expecting a large number of UPDATE or DELETE operations on the table,
best practice is to not use FULL.
Tune the Write Ahead Log (WAL) on the Postgres source database
psql source <<EOF ALTER SYSTEM SET wal_level='logical'; ALTER SYSTEM SET max_wal_senders=10; ALTER SYSTEM SET wal_sender_timeout=0; EOF
This will require a restart of the Postgres source database.
Create a user for the connector and assign permissions
Create
<pg connector username>:psql source -c "CREATE USER <pg connector username> PASSWORD '<password>'"
You can use an existing user. However, you must ensure that the user has the following permissions.
Grant permissions to create a replication slot:
psql source -c "ALTER ROLE <pg connector username> REPLICATION"Grant permissions to create a publication:
psql source -c "GRANT CREATE ON DATABASE <database name> TO <pg connector username>"Assign the user permissions on the source database:
psql source <<EOF GRANT USAGE ON SCHEMA "public" TO <pg connector username>; GRANT SELECT ON ALL TABLES IN SCHEMA "public" TO <pg connector username>; ALTER DEFAULT PRIVILEGES IN SCHEMA "public" GRANT SELECT ON TABLES TO <pg connector username>; EOF
If the tables you are syncing are not in the
publicschema, grant the user permissions for each schema you are syncing:psql source <<EOF GRANT USAGE ON SCHEMA <schema> TO <pg connector username>; GRANT SELECT ON ALL TABLES IN SCHEMA <schema> TO <pg connector username>; ALTER DEFAULT PRIVILEGES IN SCHEMA <schema> GRANT SELECT ON TABLES TO <pg connector username>; EOFOn each table you want to sync, make
<pg connector username>the owner:psql source -c 'ALTER TABLE OWNER TO <pg connector username>;'
You can skip this step if the replicating user is already the owner of the tables.
Enable replication
DELETEandUPDATEoperations
Replica identity assists data replication by identifying the rows being modified. Your options are that each table and hypertable in the source database should either have:
- A primary key: data replication defaults to the primary key of the table being replicated. Nothing to do.
- A viable unique index: each table has a unique, non-partial, non-deferrable index that includes only columns
marked as
NOT NULL. If a UNIQUE index does not exist, create one to assist the migration. You can delete if after migration.
For each table, set REPLICA IDENTITY to the viable unique index:
psql -X -d source -c 'ALTER TABLE REPLICA IDENTITY USING INDEX <_index_name>'
- No primary key or viable unique index: use brute force.
For each table, set REPLICA IDENTITY to FULL:
psql -X -d source -c 'ALTER TABLE {table_name} REPLICA IDENTITY FULL'
For each UPDATE or DELETE statement, Postgres reads the whole table to find all matching rows. This results
in significantly slower replication. If you are expecting a large number of UPDATE or DELETE operations on the table,
best practice is to not use FULL.
Migrate the table schema to the Tiger Cloud service
Use pg_dump to:
Download the schema from the source database
pg_dump source \ --no-privileges \ --no-owner \ --no-publications \ --no-subscriptions \ --no-table-access-method \ --no-tablespaces \ --schema-only \ --file=schema.sqlApply the schema on the target service
psql target -f schema.sql
Convert partitions and tables with time-series data into hypertables
For efficient querying and analysis, you can convert tables which contain time-series or events data, and tables that are already partitioned using Postgres declarative partition into hypertables.
- Convert tables to hypertables
Run the following on each table in the target Tiger Cloud service to convert it to a hypertable:
psql -X -d target -c "SELECT public.create_hypertable('', by_range('<partition column>', '<chunk interval>'::interval));"
For example, to convert the metrics table into a hypertable with time as a partition column and 1 day as a partition interval:
psql -X -d target -c "SELECT public.create_hypertable('public.metrics', by_range('time', '1 day'::interval));"
- Convert Postgres partitions to hypertables
Rename the partition and create a new regular table with the same name as the partitioned table, then convert to a hypertable:
psql target -f - <<'EOF'
BEGIN;
ALTER TABLE public.events RENAME TO events_part;
CREATE TABLE public.events(LIKE public.events_part INCLUDING ALL);
SELECT create_hypertable('public.events', by_range('time', '1 day'::interval));
COMMIT;
EOF
Specify the tables to synchronize
After the schema is migrated, you CREATE PUBLICATION on the source database that
specifies the tables to synchronize.
- Create a publication that specifies the table to synchronize
A PUBLICATION enables you to synchronize some or all the tables in the schema or database.
CREATE PUBLICATION <publication_name> FOR TABLE , ;
To add tables after to an existing publication, use [ALTER PUBLICATION][alter-publication]**
ALTER PUBLICATION <publication_name> ADD TABLE ;
Publish the Postgres declarative partitioned table
ALTER PUBLICATION <publication_name> SET(publish_via_partition_root=true);
To convert partitioned table to hypertable, follow Convert partitions and tables with time-series data into hypertables.
Stop syncing a table in the
PUBLICATION, useDROP TABLEALTER PUBLICATION <publication_name> DROP TABLE ;
Synchronize data to your Tiger Cloud service
You use the source Postgres connector docker image to synchronize changes in real time from a Postgres database instance to a Tiger Cloud service:
- Start the source Postgres connector
As you run the source Postgres connector continuously, best practice is to run it as a Docker daemon.
docker run -d --rm --name livesync timescale/live-sync:v0.1.25 run \
--publication <publication_name> --subscription <subscription_name> \
--source source --target target --table-map
--publication: The name of the publication as you created in the previous step. To use multiple publications, repeat the --publication flag.
--subscription: The name that identifies the subscription on the target Tiger Cloud service.
--source: The connection string to the source Postgres database.
--target: The connection string to the target Tiger Cloud service.
--table-map: (Optional) A JSON string that maps source tables to target tables. If not provided, the source and target table names are assumed to be the same.
For example, to map the source table metrics to the target table metrics_data:
--table-map '{"source": {"schema": "public", "table": "metrics"}, "target": {"schema": "public", "table": "metrics_data"}}'
To map only the schema, use:
--table-map '{"source": {"schema": "public"}, "target": {"schema": "analytics"}}'
This flag can be repeated for multiple table mappings.
- Capture logs
Once the source Postgres connector is running as a docker daemon, you can also capture the logs:
docker logs -f livesync
- View the progress of tables being synchronized
List the tables being synchronized by the source Postgres connector using the _ts_live_sync.subscription_rel table in the target Tiger Cloud service:
psql target -c "SELECT * FROM _ts_live_sync.subscription_rel"
You see something like the following:
| subname | pubname | schemaname | tablename | rrelid | state | lsn | updated_at | last_error | created_at | rows_copied | approximate_rows | bytes_copied | approximate_size | target_schema | target_table | |----------|---------|-------------|-----------|--------|-------|------------|-------------------------------|-------------------------------------------------------------------------------|-------------------------------|-------------|------------------|--------------|------------------|---------------|-------------| |livesync | analytics | public | metrics | 20856 | r | 6/1A8CBA48 | 2025-06-24 06:16:21.434898+00 | | 2025-06-24 06:03:58.172946+00 | 18225440 | 18225440 | 1387359359 | 1387359359 | public | metrics |
The state column indicates the current state of the table synchronization.
Possible values for state are:
| state | description | |-------|-------------| | d | initial table data sync | | f | initial table data sync completed | | s | catching up with the latest changes | | r | table is ready, syncing live changes |
To see the replication lag, run the following against the SOURCE database:
psql source -f - <<'EOF'
SELECT
slot_name,
pg_size_pretty(pg_current_wal_flush_lsn() - confirmed_flush_lsn) AS lag
FROM pg_replication_slots
WHERE slot_name LIKE 'live_sync_%' AND slot_type = 'logical'
EOF
- Add or remove tables from the publication
To add tables, use ALTER PUBLICATION .. ADD TABLE**
ALTER PUBLICATION <publication_name> ADD TABLE ;
To remove tables, use ALTER PUBLICATION .. DROP TABLE**
ALTER PUBLICATION <publication_name> DROP TABLE ;
- Update table statistics
If you have a large table, you can run ANALYZE on the target Tiger Cloud service
to update the table statistics after the initial sync is complete.
This helps the query planner make better decisions for query execution plans.
vacuumdb --analyze --verbose --dbname=target
Stop the source Postgres connector
docker stop live-sync(Optional) Reset sequence nextval on the target Tiger Cloud service
The source Postgres connector does not automatically reset the sequence nextval on the target Tiger Cloud service.
Run the following script to reset the sequence for all tables that have a serial or identity column in the target Tiger Cloud service:
psql target -f - <<'EOF'
DO $$
DECLARE
rec RECORD;
BEGIN
FOR rec IN (
SELECT
sr.target_schema AS table_schema,
sr.target_table AS table_name,
col.column_name,
pg_get_serial_sequence(
sr.target_schema || '.' || sr.target_table,
col.column_name
) AS seqname
FROM _ts_live_sync.subscription_rel AS sr
JOIN information_schema.columns AS col
ON col.table_schema = sr.target_schema
AND col.table_name = sr.target_table
WHERE col.column_default LIKE 'nextval(%' -- only serial/identity columns
) LOOP
EXECUTE format(
'SELECT setval(%L,
COALESCE((SELECT MAX(%I) FROM %I.%I), 0) + 1,
false
);',
rec.seqname, -- the sequence identifier
rec.column_name, -- the column to MAX()
rec.table_schema, -- schema for MAX()
rec.table_name -- table for MAX()
);
END LOOP;
END;
$$ LANGUAGE plpgsql;
EOF
- Clean up
Use the --drop flag to remove the replication slots created by the source Postgres connector on the source database.
docker run -it --rm --name livesync timescale/live-sync:v0.1.25 run \
--publication <publication_name> --subscription <subscription_name> \
--source source --target target \
--drop
===== PAGE: https://docs.tigerdata.com/migrate/livesync-for-s3/ =====
Sync data from S3 to your service
You use the source S3 connector in Tiger Cloud to synchronize CSV and Parquet files from an S3 bucket to your Tiger Cloud service in real time. The connector runs continuously, enabling you to leverage Tiger Cloud as your analytics database with data constantly synced from S3. This lets you take full advantage of Tiger Cloud's real-time analytics capabilities without having to develop or manage custom ETL solutions between S3 and Tiger Cloud.
You can use the source S3 connector to synchronize your existing and new data. Here's what the connector can do:
Sync data from an S3 bucket instance to a Tiger Cloud service:
- Use glob patterns to identify the objects to sync.
- Watch an S3 bucket for new files and import them automatically. It runs on a configurable schedule and tracks processed files.
- Important: The connector processes files in lexicographical order. It uses the name of the last file processed as a marker and fetches only files later in the alphabet in subsequent queries. Files added with names earlier in the alphabet than the marker are skipped and never synced. For example, if you add the file Bob when the marker is at Elephant, Bob is never processed.
- For large backlogs, check every minute until caught up.
Sync data from multiple file formats:
- CSV: check for compression in GZ and ZIP format, then process using timescaledb-parallel-copy.
- Parquet: convert to CSV, then process using timescaledb-parallel-copy.
The source S3 connector offers an option to enable a hypertable during the file-to-table schema mapping setup. You can enable columnstore and continuous aggregates through the SQL editor once the connector has started running.
The connector offers a default 1-minute polling interval. This means that Tiger Cloud checks the S3 source every minute for new data. You can customize this interval by setting up a cron expression.
The source S3 connector continuously imports data from an Amazon S3 bucket into your database. It monitors your S3 bucket for new files matching a specified pattern and automatically imports them into your designated database table.
Note: the connector currently only syncs existing and new files—it does not support updating or deleting records based on updates and deletes from S3 to tables in a Tiger Cloud service.
Early access: this source S3 connector is not supported for production use. If you have any questions or feedback, talk to us in #livesync in the Tiger Community.
Prerequisites
To follow the steps on this page:
- Create a target Tiger Cloud service with real-time analytics enabled.
You need your connection details.
- Ensure access to a standard Amazon S3 bucket containing your data files.
Directory buckets are not supported.
Configure access credentials for the S3 bucket. The following credentials are supported:
-
Configure the trust policy. Set the:
Principal:arn:aws:iam::142548018081:role/timescale-s3-connections.ExternalID: set to the Tiger Cloud project and Tiger Cloud service ID of the service you are syncing to in the format<projectId>/<serviceId>.
This is to avoid the confused deputy problem.
Give the following access permissions:
s3:GetObject.s3:ListBucket.
-
Limitations
File naming: Files must follow lexicographical ordering conventions. Files with names that sort earlier than already-processed files are permanently skipped. Example: if
file_2024_01_15.csvhas been processed, a file namedfile_2024_01_10.csvadded later will never be synced. Recommended naming patterns: timestamps (for example,YYYY-MM-DD-HHMMSS), sequential numbers with fixed padding (for example,file_00001,file_00002).CSV:
- Maximum file size: 1 GB
To increase this limit, contact sales@tigerdata.com
- Maximum row size: 2 MB
- Supported compressed formats:
- GZ
- ZIP
- Advanced settings:
- Delimiter: the default character is
,, you can choose a different delimiter - Skip header: skip the first row if your file has headers
- Delimiter: the default character is
Parquet:
- Maximum file size: 1 GB
- Maximum row size: 2 MB
Sync iteration:
To prevent system overload, the connector tracks up to 100 files for each sync iteration. Additional checks only fill empty queue slots.
Synchronize data to your Tiger Cloud service
To sync data from your S3 bucket to your Tiger Cloud service using Tiger Cloud Console:
- Connect to your Tiger Cloud service
In Tiger Cloud Console, select the service to sync live data to.
- Connect the source S3 bucket to the target service
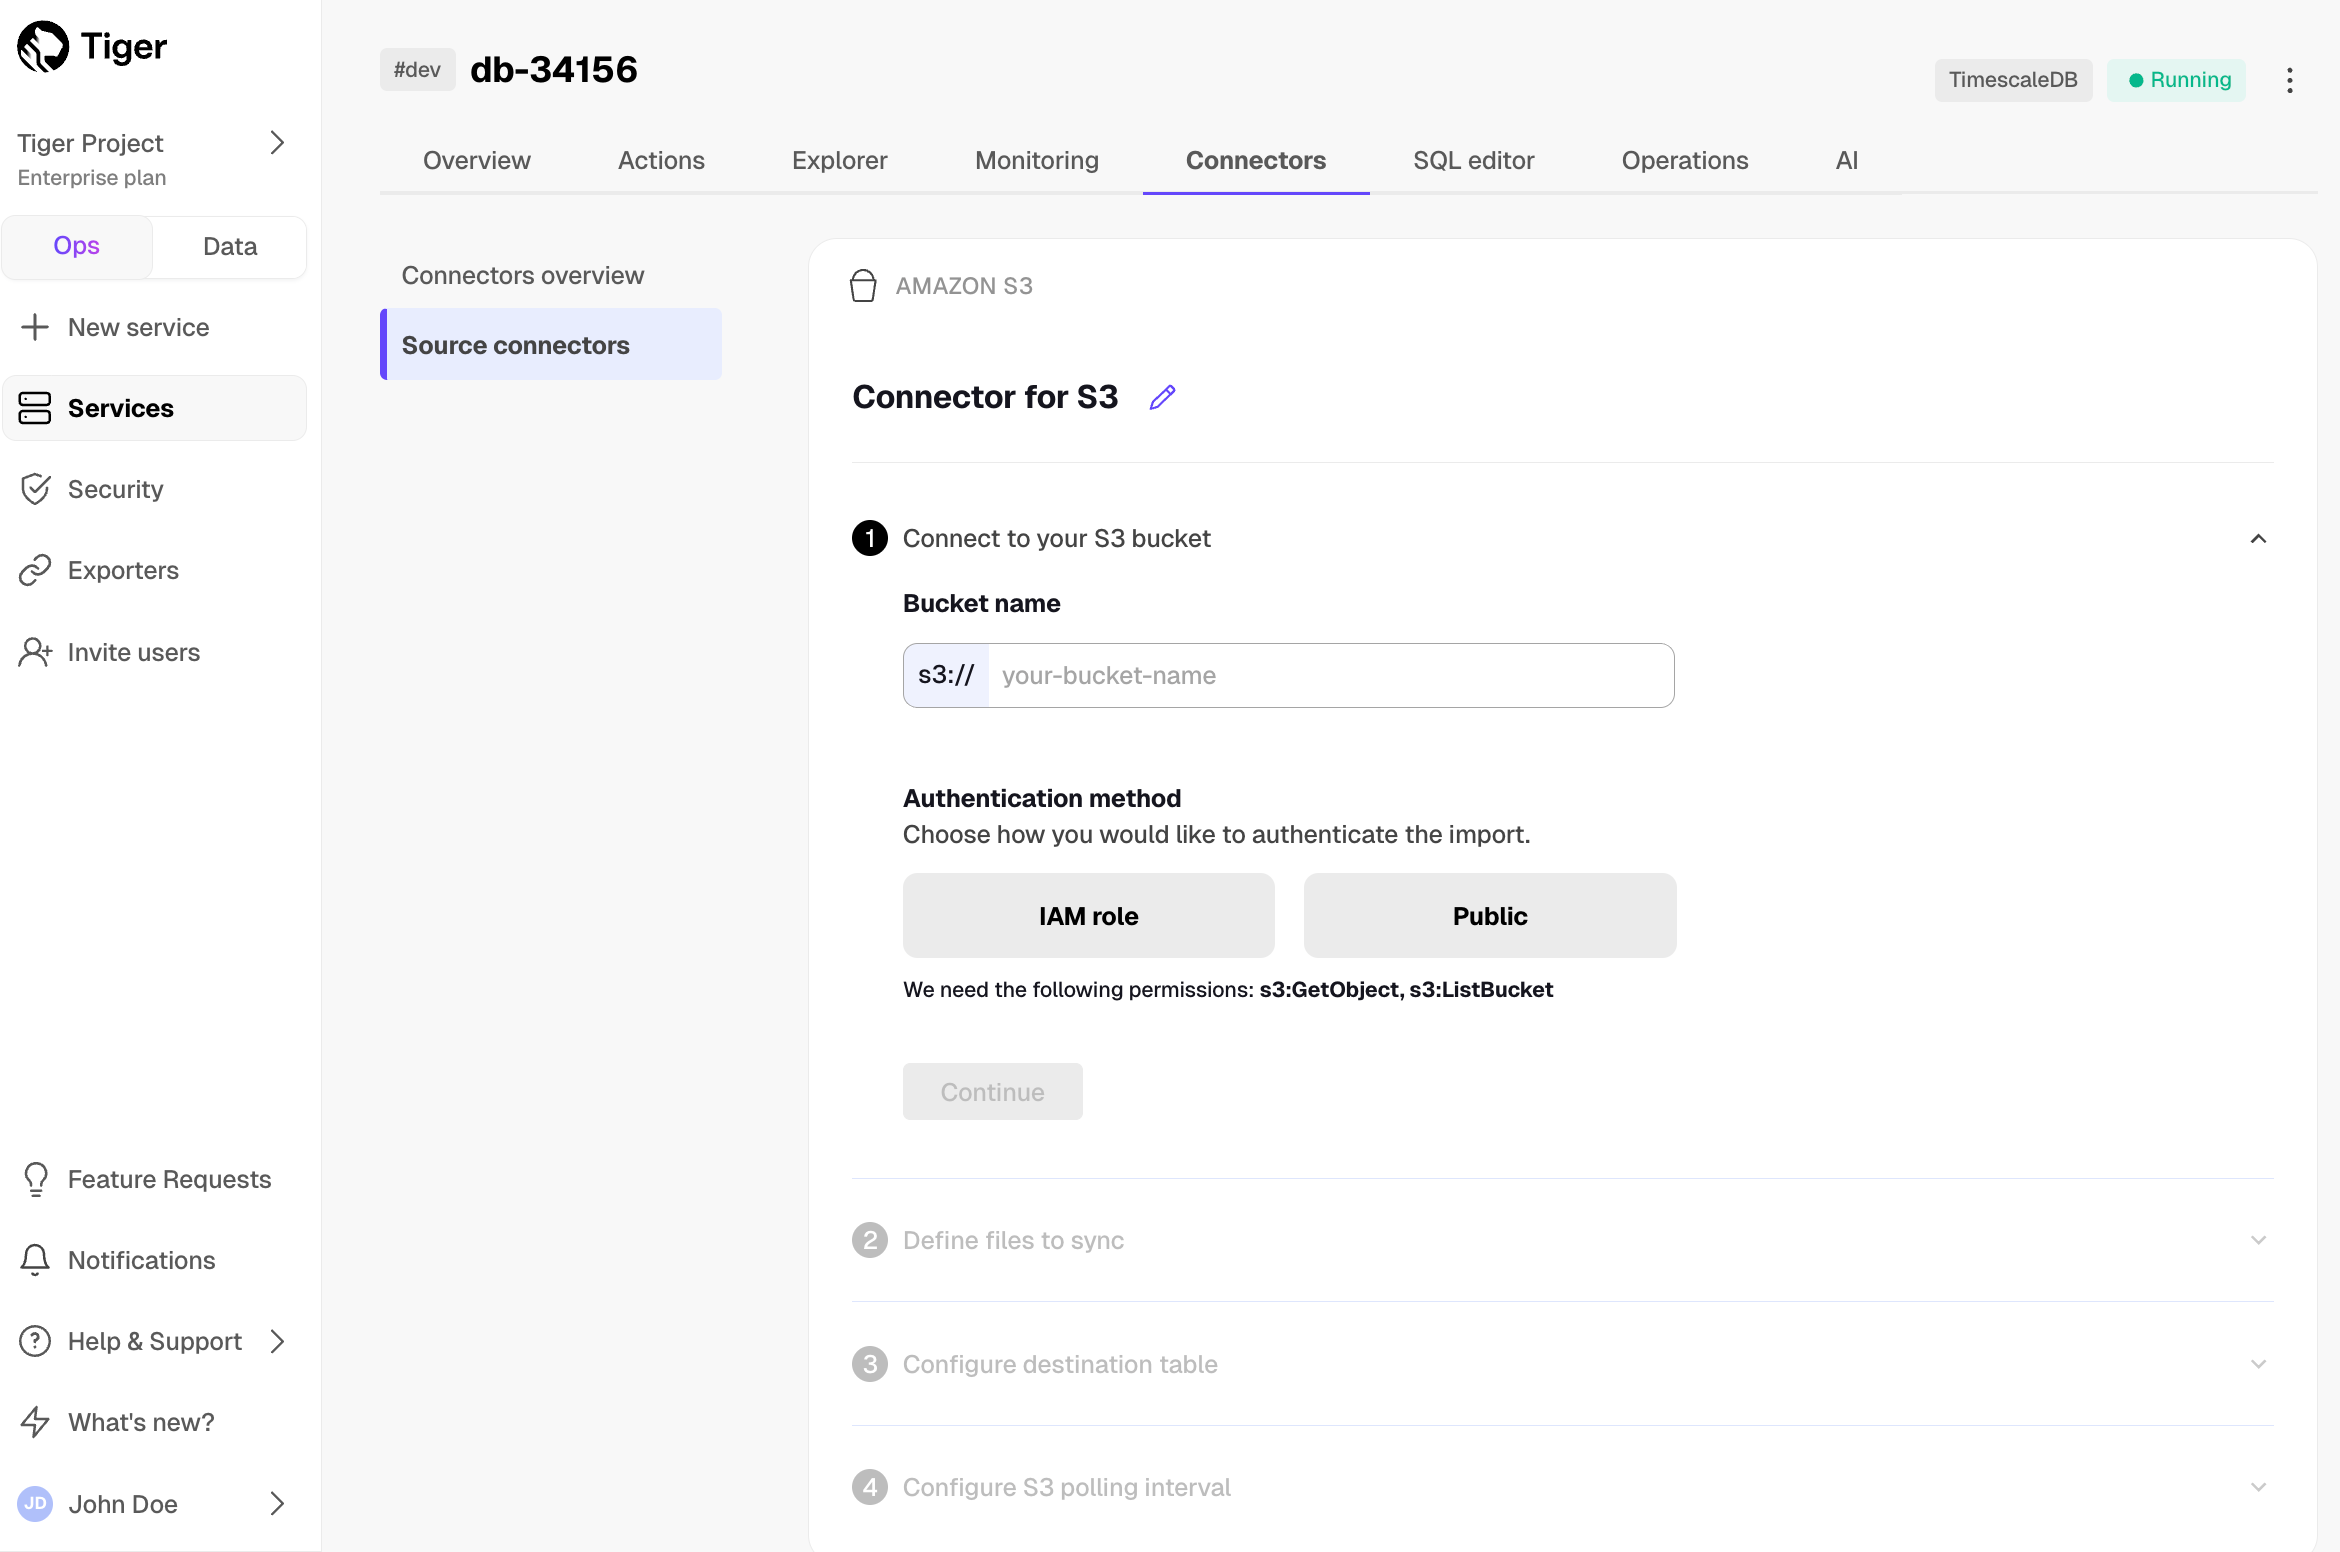
- Click
Connectors>Amazon S3. - Click the pencil icon, then set the name for the new connector.
Set the
Bucket nameandAuthentication method, then clickContinue.For instruction on creating the IAM role to connect your S3 bucket, click
Learn how. Tiger Cloud Console connects to the source bucket.In
Define files to sync, choose theFile typeand set theGlob pattern.Use the following patterns:
<folder name>/*: match all files in a folder. Also, any pattern ending with/is treated as/*.<folder name>/**: match all recursively.<folder name>/**/*.csv: match a specific file type.
The source S3 connector uses prefix filters where possible, place patterns carefully at the end of your glob expression. AWS S3 doesn't support complex filtering. If your expression filters too many files, the list operation may time out.
Click the search icon. You see the files to sync. Click
Continue.Optimize the data to synchronize in hypertables
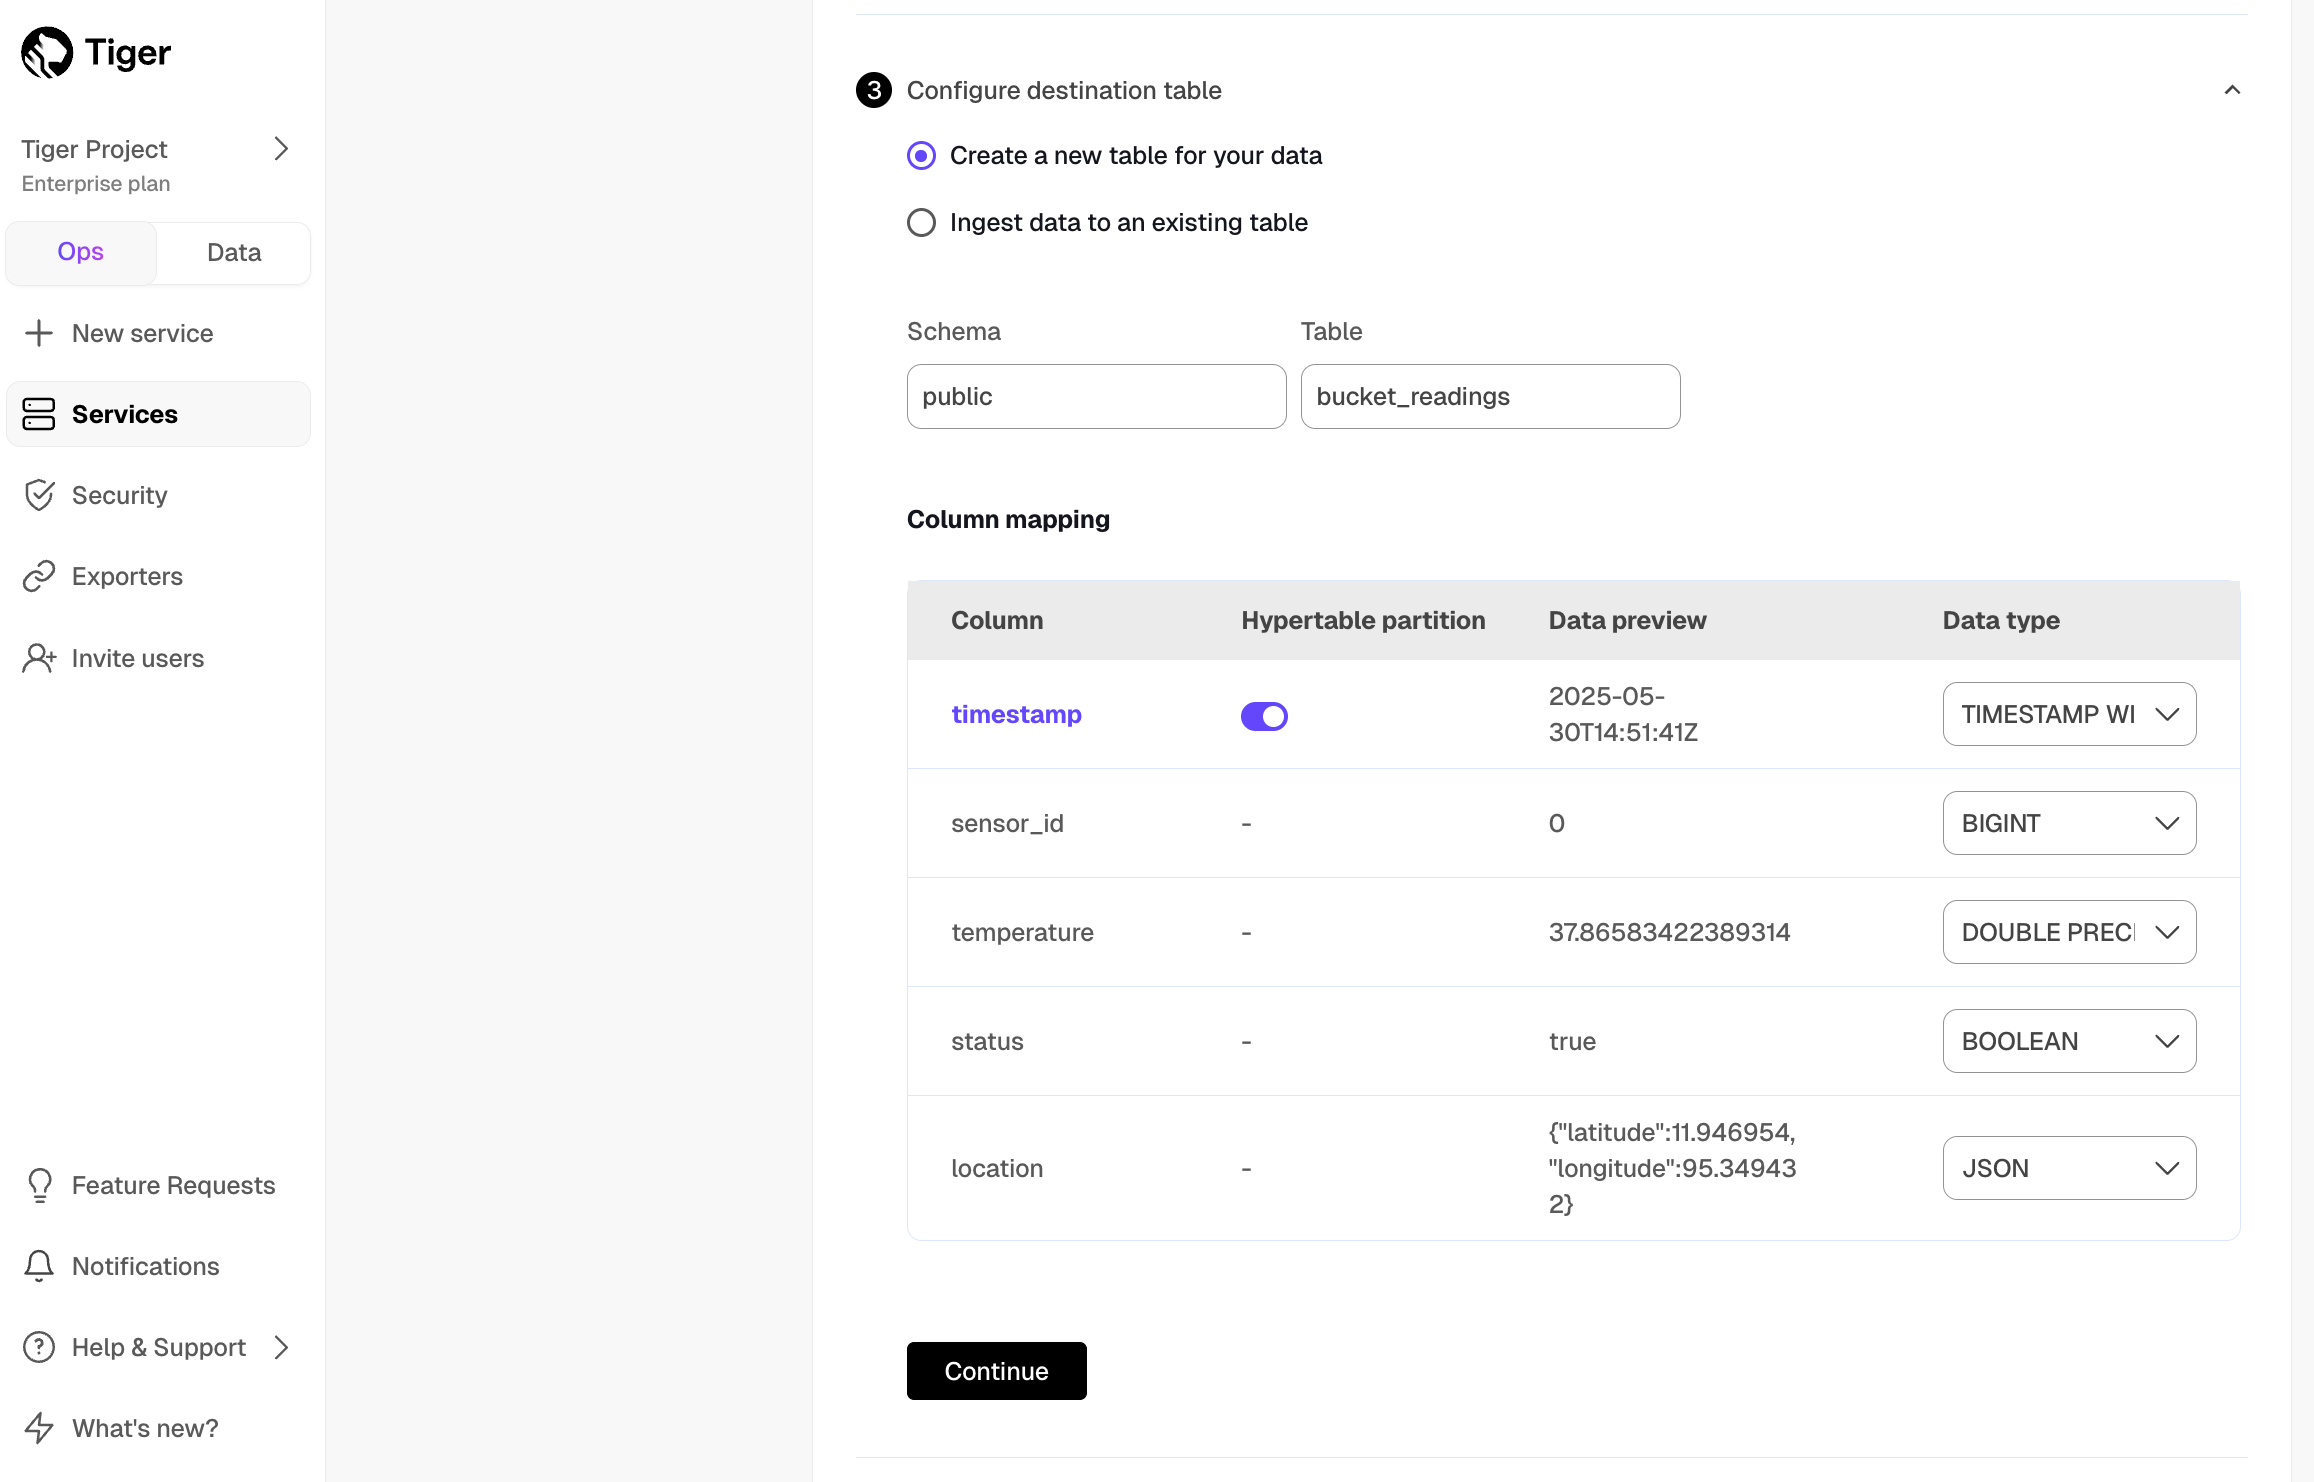
Tiger Cloud Console checks the file schema and, if possible, suggests the column to use as the time dimension in a hypertable.
- Choose
Create a new table for your dataorIngest data to an existing table. - Choose the
Data typefor each column, then clickContinue. - Choose the interval. This can be a minute, an hour, or use a cron expression.
Click
Start Connector.Tiger Cloud Console starts the connection between the source database and the target service and displays the progress.
Monitor synchronization
- To view the amount of data replicated, click
Connectors. The diagram inConnector data flowgives you an overview of the connectors you have created, their status, and how much data has been replicated.
- To view file import statistics and logs, click
Connectors>Source connectors, then select the name of your connector in the table.
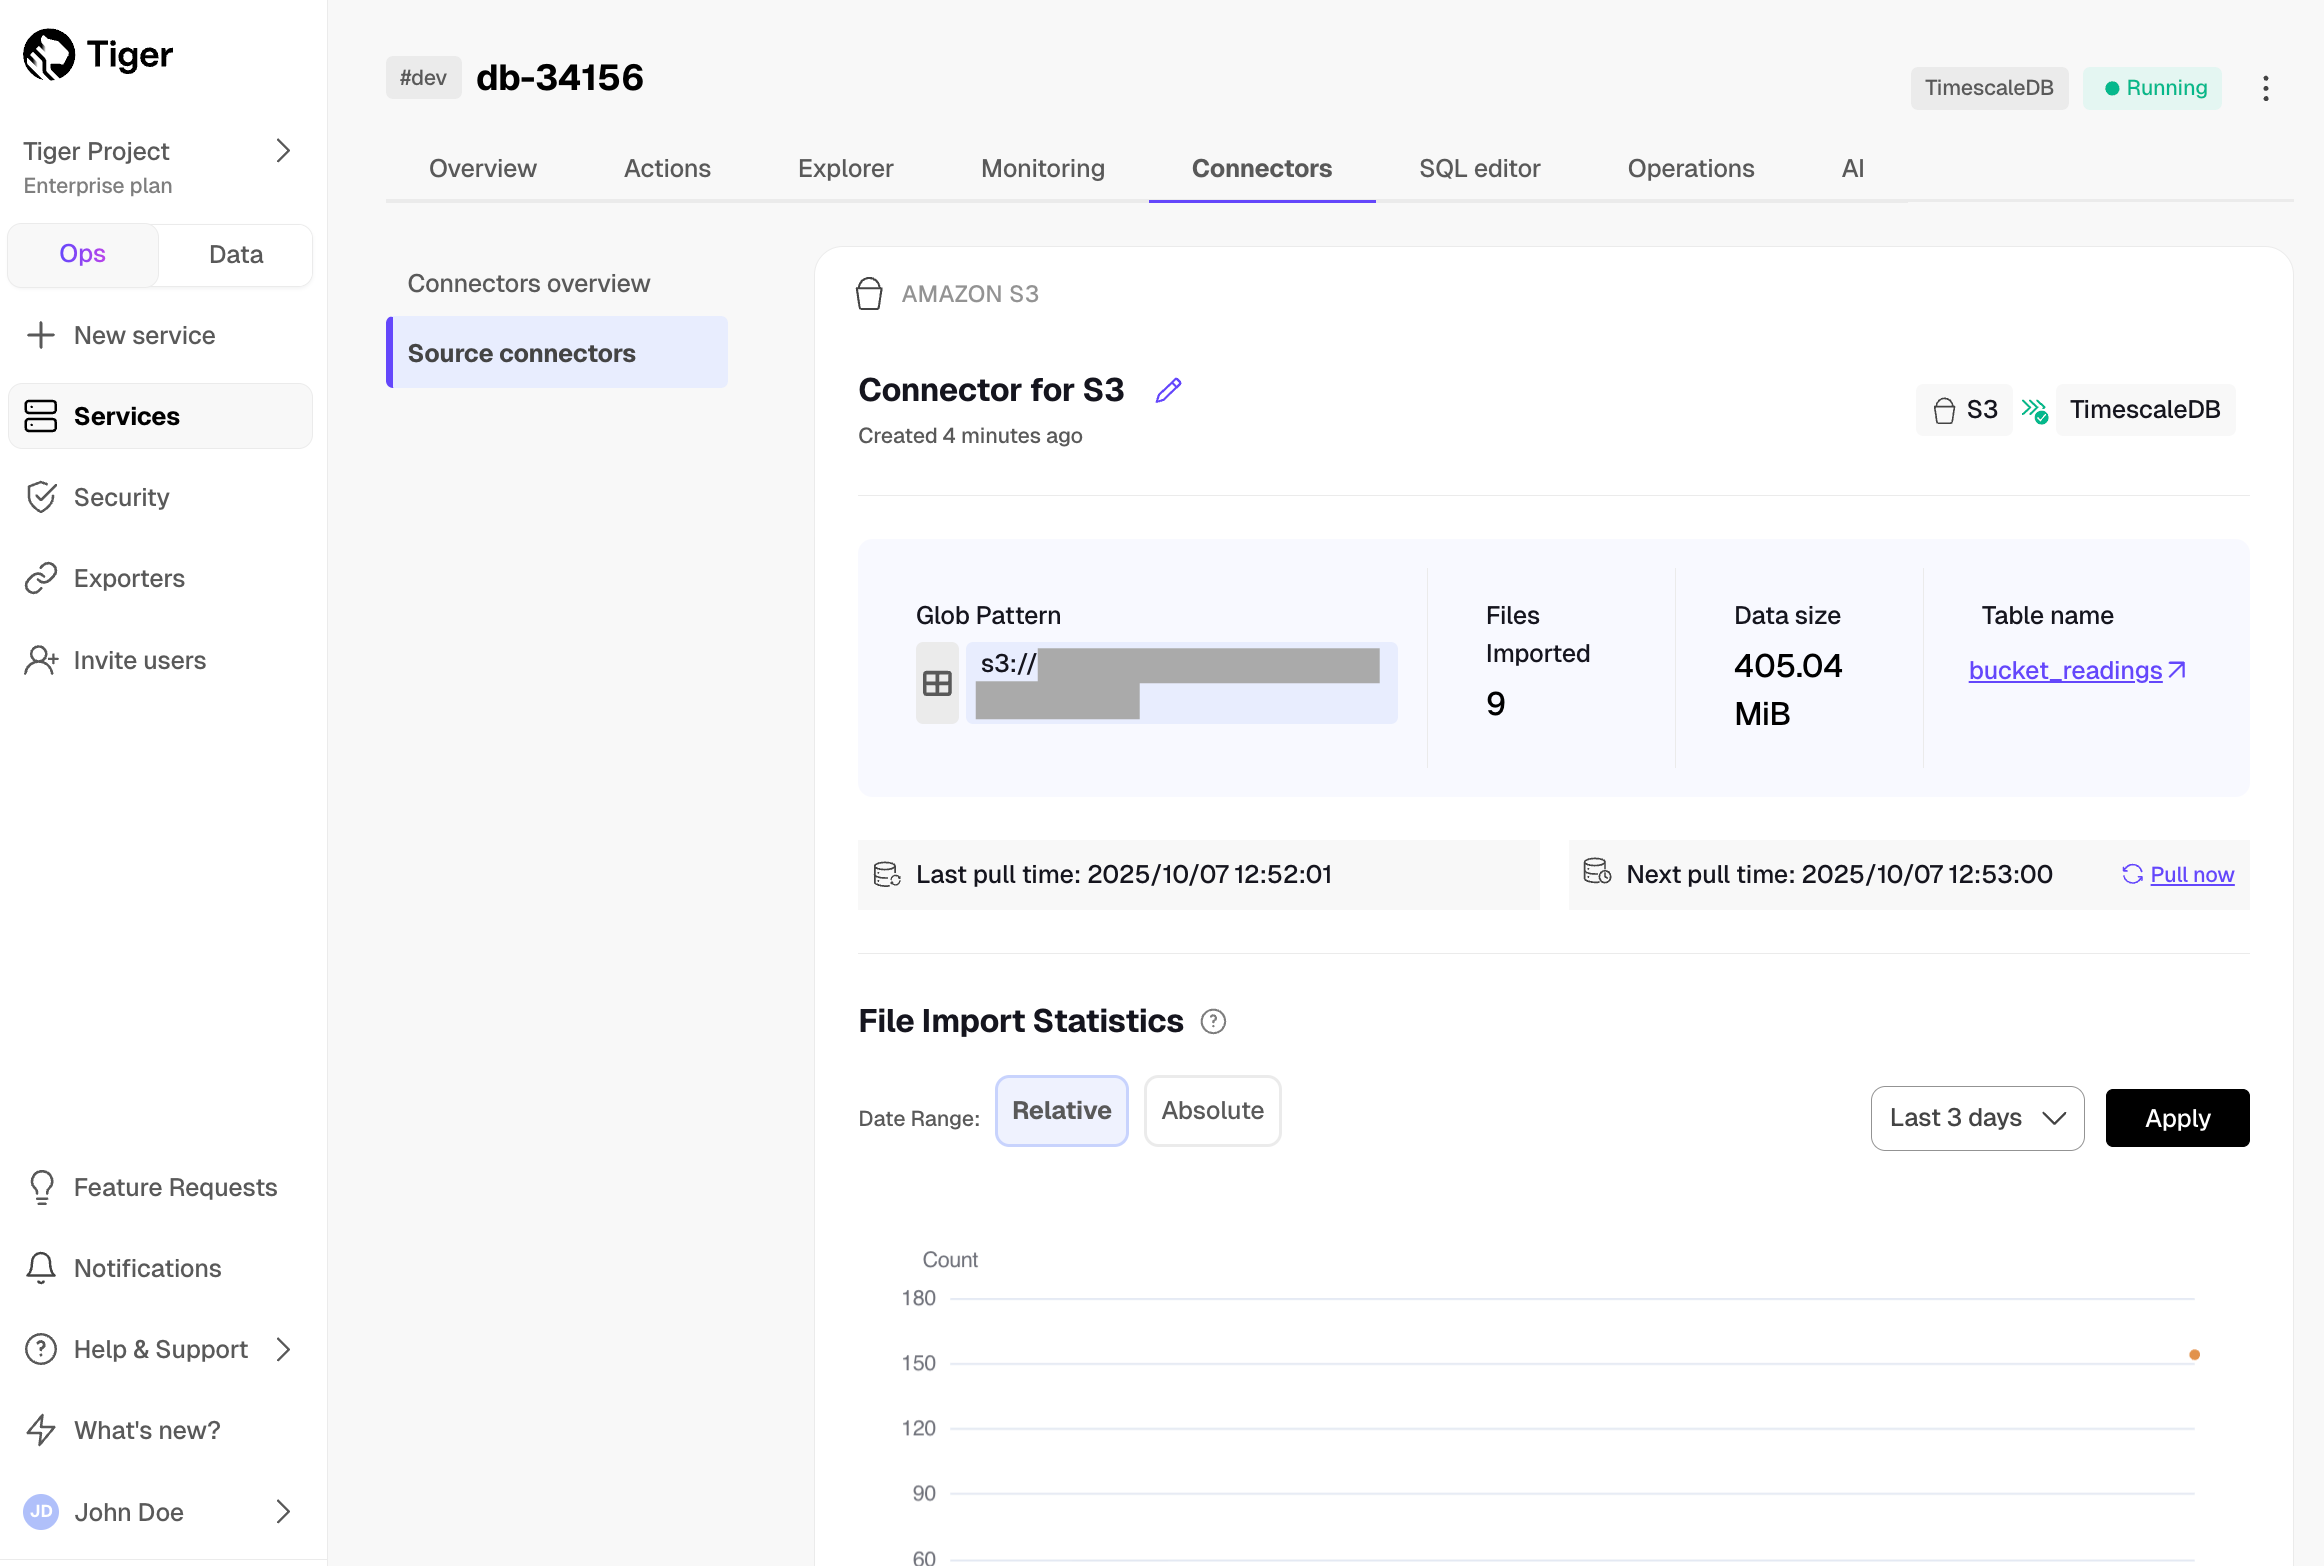
- To view the amount of data replicated, click
Manage the connector
- To pause the connector, click
Connectors>Source connectors. Open the three-dot menu next to your connector in the table, then clickPause.
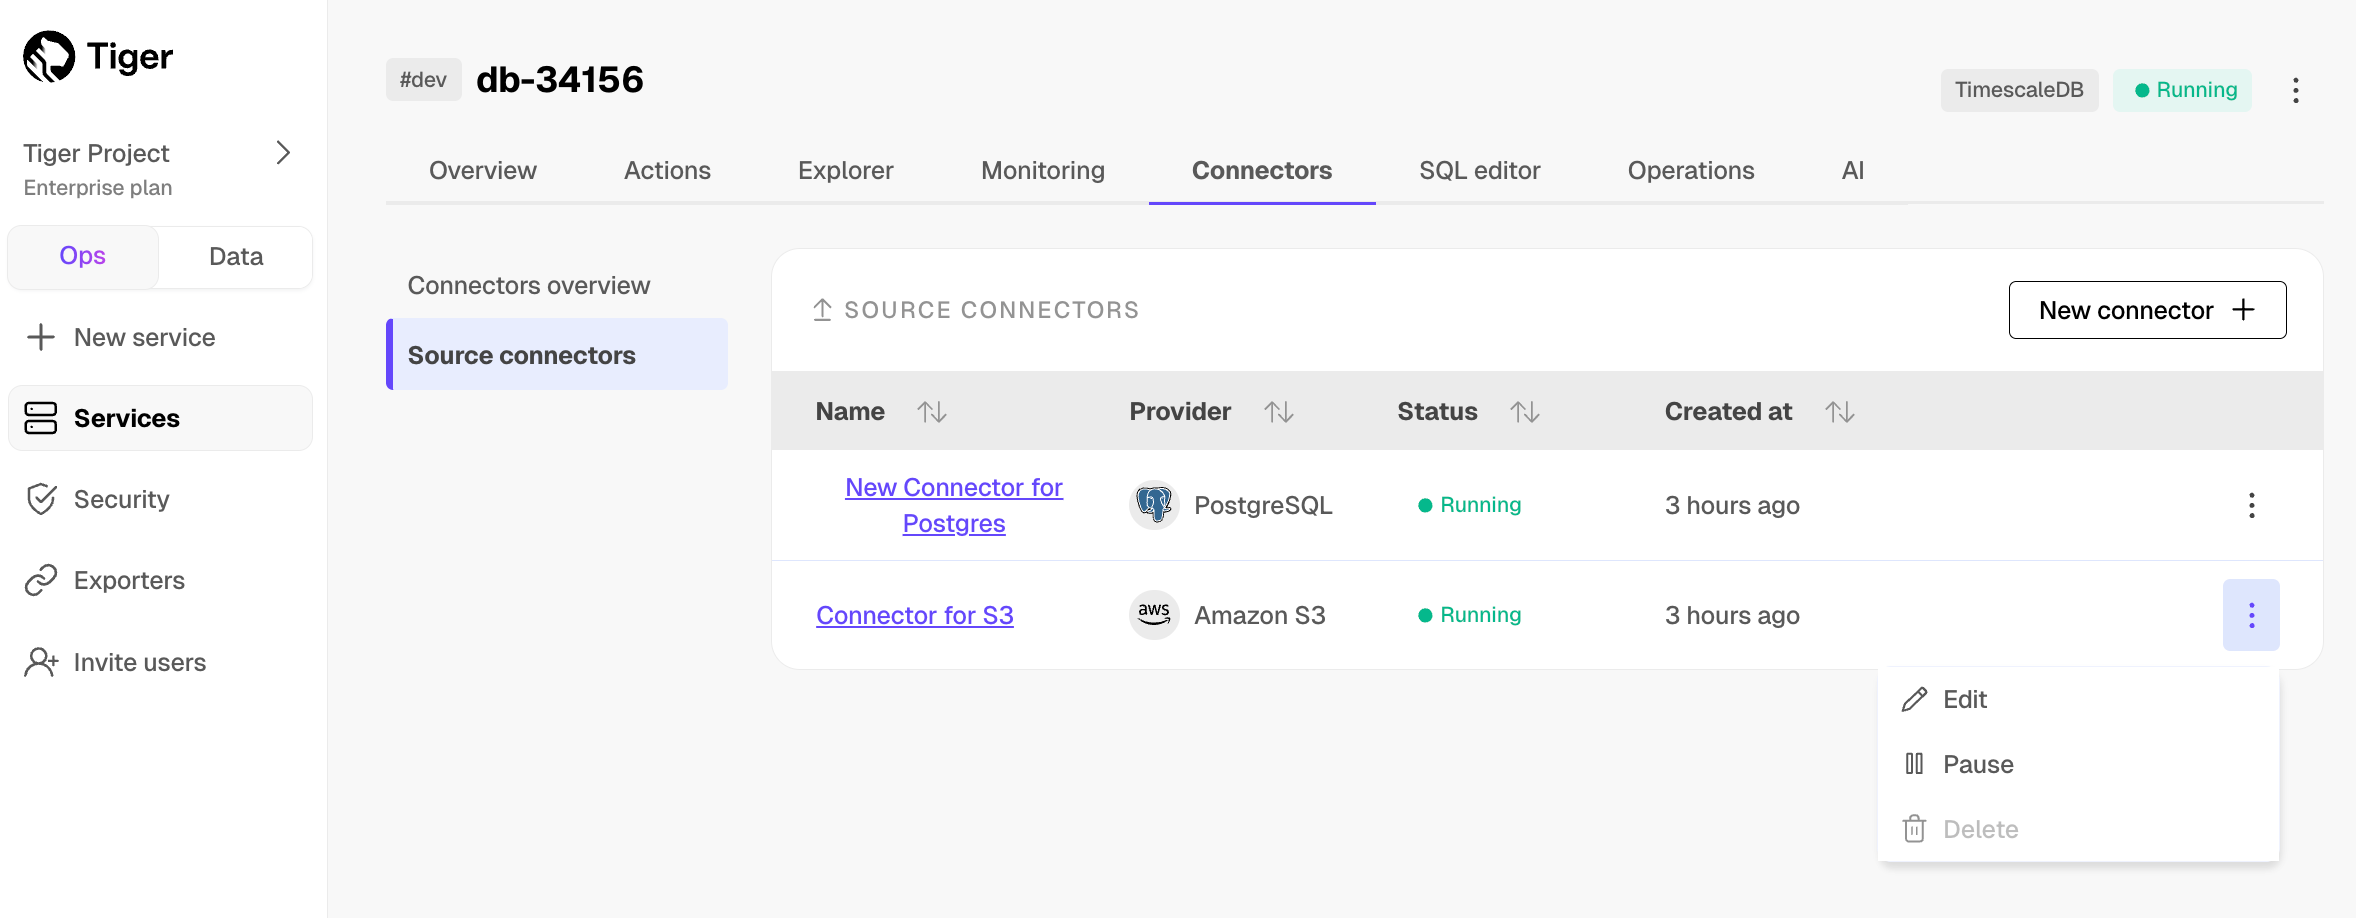
- To edit the connector, click
Connectors>Source connectors. Open the three-dot menu next to your connector in the table, then clickEditand scroll down toModify your Connector. You must pause the connector before editing it.
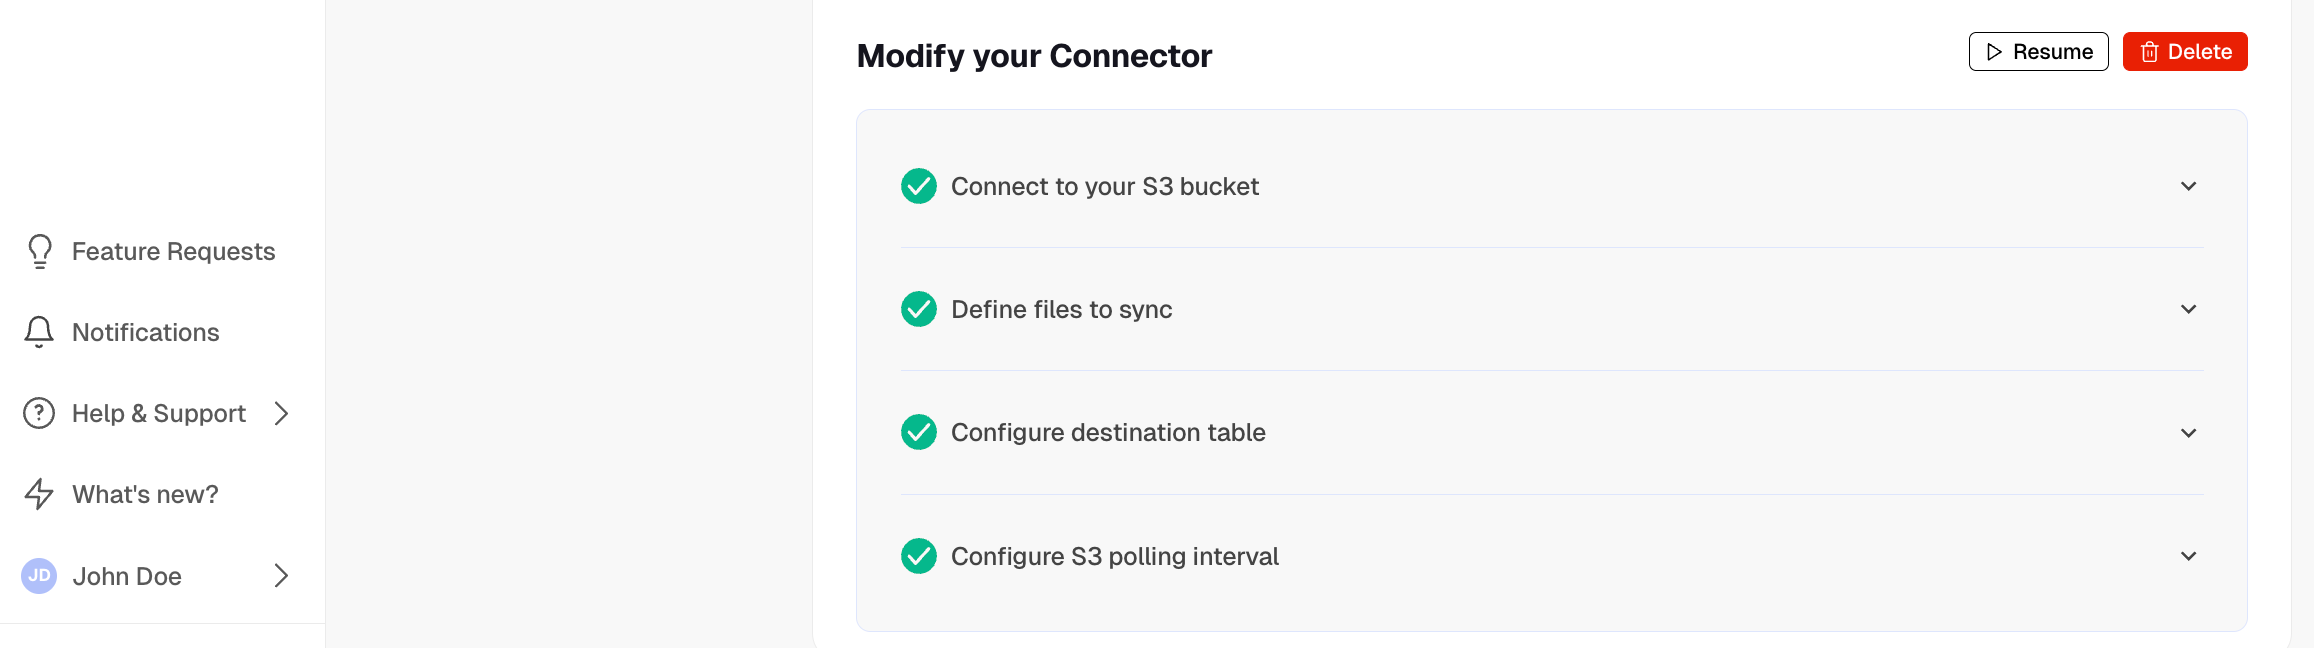
- To pause or delete the connector, click
Connectors>Source connectors, then open the three-dot menu on the right and select an option. You must pause the connector before deleting it.
- To pause the connector, click
And that is it, you are using the source S3 connector to synchronize all the data, or specific files, from an S3 bucket to your Tiger Cloud service in real time.
===== PAGE: https://docs.tigerdata.com/migrate/livesync-for-kafka/ =====
Stream data from Kafka into your service
You use the Kafka source connector in Tiger Cloud to stream events from Kafka into your service. Tiger Cloud connects to your Confluent Cloud Kafka cluster and Schema Registry using SASL/SCRAM authentication and service account–based API keys. Only the Avro format is currently supported with some limitations.
This page explains how to connect Tiger Cloud to your Confluence Cloud Kafka cluster.
Early access: the Kafka source connector is not yet supported for production use.
Prerequisites
To follow the steps on this page:
- Create a target Tiger Cloud service with real-time analytics enabled.
You need your connection details.
Access your Kafka cluster in Confluent Cloud
Take the following steps to prepare your Kafka cluster for connection to Tiger Cloud:
Create a service account
If you already have a service account for Tiger Cloud, you can reuse it. To create a new service account:
- Log in to Confluent Cloud.
- Click the burger menu at the top-right of the pane, then press
Access control>Service accounts>Add service account. Enter the following details:
- Name:
tigerdata-access - Description:
Service account for the Tiger Cloud source connector
- Name:
Add the service account owner role, then click
Next.Select a role assignment, then click
AddClick
Next, then clickCreate service account.Create API keys
- In Confluent Cloud, click
Home>Environments> Select your environment > Select your cluster. - Under
Cluster overviewin the left sidebar, selectAPI Keys. - Click
Add key, chooseService Accountand clickNext. - Select
tigerdata-access, then clickNext. - For your cluster, choose the
Operationand select the followingPermissions, then clickNext:Resource type:ClusterOperation:DESCRIBEPermission:ALLOW
- Click
Download and continue, then securely store the ACL. - Use the same procedure to add the following keys:
- ACL 2: Topic access
Resource type:TopicTopic name: Select the topics that Tiger Cloud should readPattern type:LITERALOperation:READPermission:ALLOW- ACL 3: Consumer group access
Resource type:Consumer groupConsumer group ID:tigerdata-kafka/<tiger_cloud_project_id>. See Find your connection details for where to find your project IDPattern type:PREFIXEDOperation:READPermission:ALLOWYou need these to configure your Kafka source connector in Tiger Cloud.
- In Confluent Cloud, click
Configure Confluent Cloud Schema Registry
Tiger Cloud requires access to the Schema Registry to fetch schemas for Kafka topics. To configure the Schema Registry:
Navigate to Schema Registry
In Confluent Cloud, click
Environmentsand select your environment, then clickStream Governance.Create a Schema Registry API key
- Click
API Keys, then clickAdd API Key. - Choose
Service Account, selecttigerdata-access, then clickNext. - Under
Resource scope, chooseSchema Registry, select thedefaultenvironment, then clickNext. In
Create API Key, add the following, then clickCreate API Key:Name:tigerdata-schema-registry-accessDescription:API key for Tiger Cloud schema registry access
Click
Download API Keyand securely store the API key and secret, then clickComplete.
- Click
Assign roles for Schema Registry
- Click the burger menu at the top-right of the pane, then press
Access control>Accounts & access>Service accounts. - Select the
tigerdata-accessservice account. In the
Accesstab, add the following role assignments forAll schema subjects:ResourceOwneron the service account.DeveloperReadon schema subjects.
Choose
All schema subjectsor restrict to specific subjects as required.Save the role assignments.
- Click the burger menu at the top-right of the pane, then press
Your Confluent Cloud Schema Registry is now accessible to Tiger Cloud using the API key and secret.
Add Kafka source connector in Tiger Cloud
Take the following steps to create a Kafka source connector in Tiger Cloud Console.
- In Console, select your service
- Go to
Connectors>Source connectors. ClickNew Connector, then selectKafka - Click the pencil icon, then set the connector name
- Set up Kafka authentication
Enter the name of your cluster in Confluent Cloud and the information from the first api-key-*.txt that you
downloaded, then click `Authenticate`.
- Set up the Schema Registry
Enter the service account ID and the information from the second api-key-*.txt that you
downloaded, then click Authenticate.
Select topics to sync
Add the schema and table, map the columns in the table, and click
Create connector.
Your Kafka connector is configured and ready to stream events.
Known limitations and unsupported types
The following Avro schema types are not supported:
Union types
Multi-type non-nullable unions are blocked.
Examples:
Multiple type union:
{ "type": "record", "name": "Message", "fields": [ {"name": "content", "type": ["string", "bytes", "null"]} ] }Union as root schema:
["null", "string"]
Reference types (named type references)
Referencing a previously defined named type by name, instead of inline, is not supported.
Examples:
Named type definition:
{ "type": "record", "name": "Address", "fields": [ {"name": "street", "type": "string"}, {"name": "city", "type": "string"} ] }Failing reference:
{ "type": "record", "name": "Person", "fields": [ {"name": "name", "type": "string"}, {"name": "address", "type": "Address"} ] }
Unsupported logical types
Only the logical types in the hardcoded supported list are supported. This includes:
decimal, date, time-millis, time-micros
timestamp-millis, timestamp-micros, timestamp-nanos
local-timestamp-millis, local-timestamp-micros, local-timestamp-nanos
uuid, duration
Unsupported examples:
{
"type": "int",
"logicalType": "date-time"
}
{
"type": "string",
"logicalType": "json"
}
{
"type": "bytes",
"logicalType": "custom-type"
}
===== PAGE: https://docs.tigerdata.com/migrate/upload-file-using-console/ =====
Upload a file into your service using Tiger Cloud Console
You can upload files into your service using Tiger Cloud Console. This page explains how to upload CSV, Parquet, and text files, from your local machine and from an S3 bucket.
Tiger Cloud Console enables you to drag and drop files to upload from your local machine.
Early access
Prerequisites
To follow the steps on this page:
- Create a target Tiger Cloud service with real-time analytics enabled.
To upload a CSV file to your service:
- Select your service in Console, then click
Actions>Import data>Upload your files>Upload CSV file
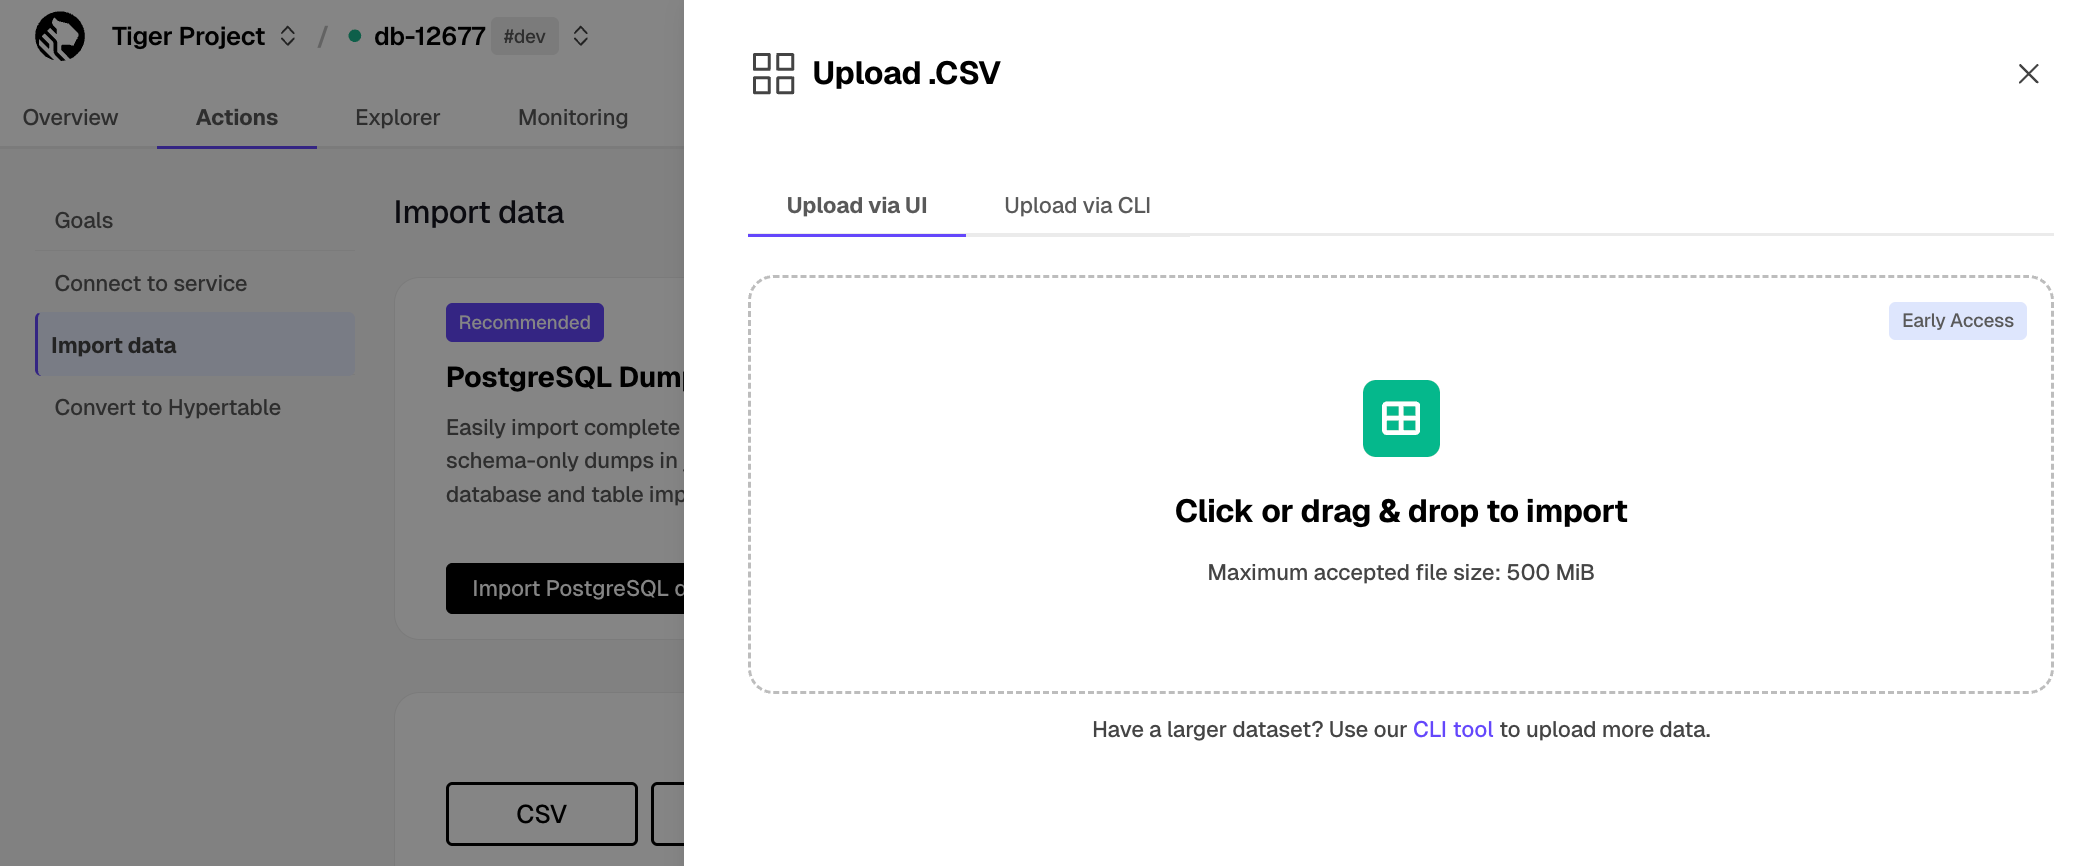
- Click to browse, or drag the file to import
- Configure the import
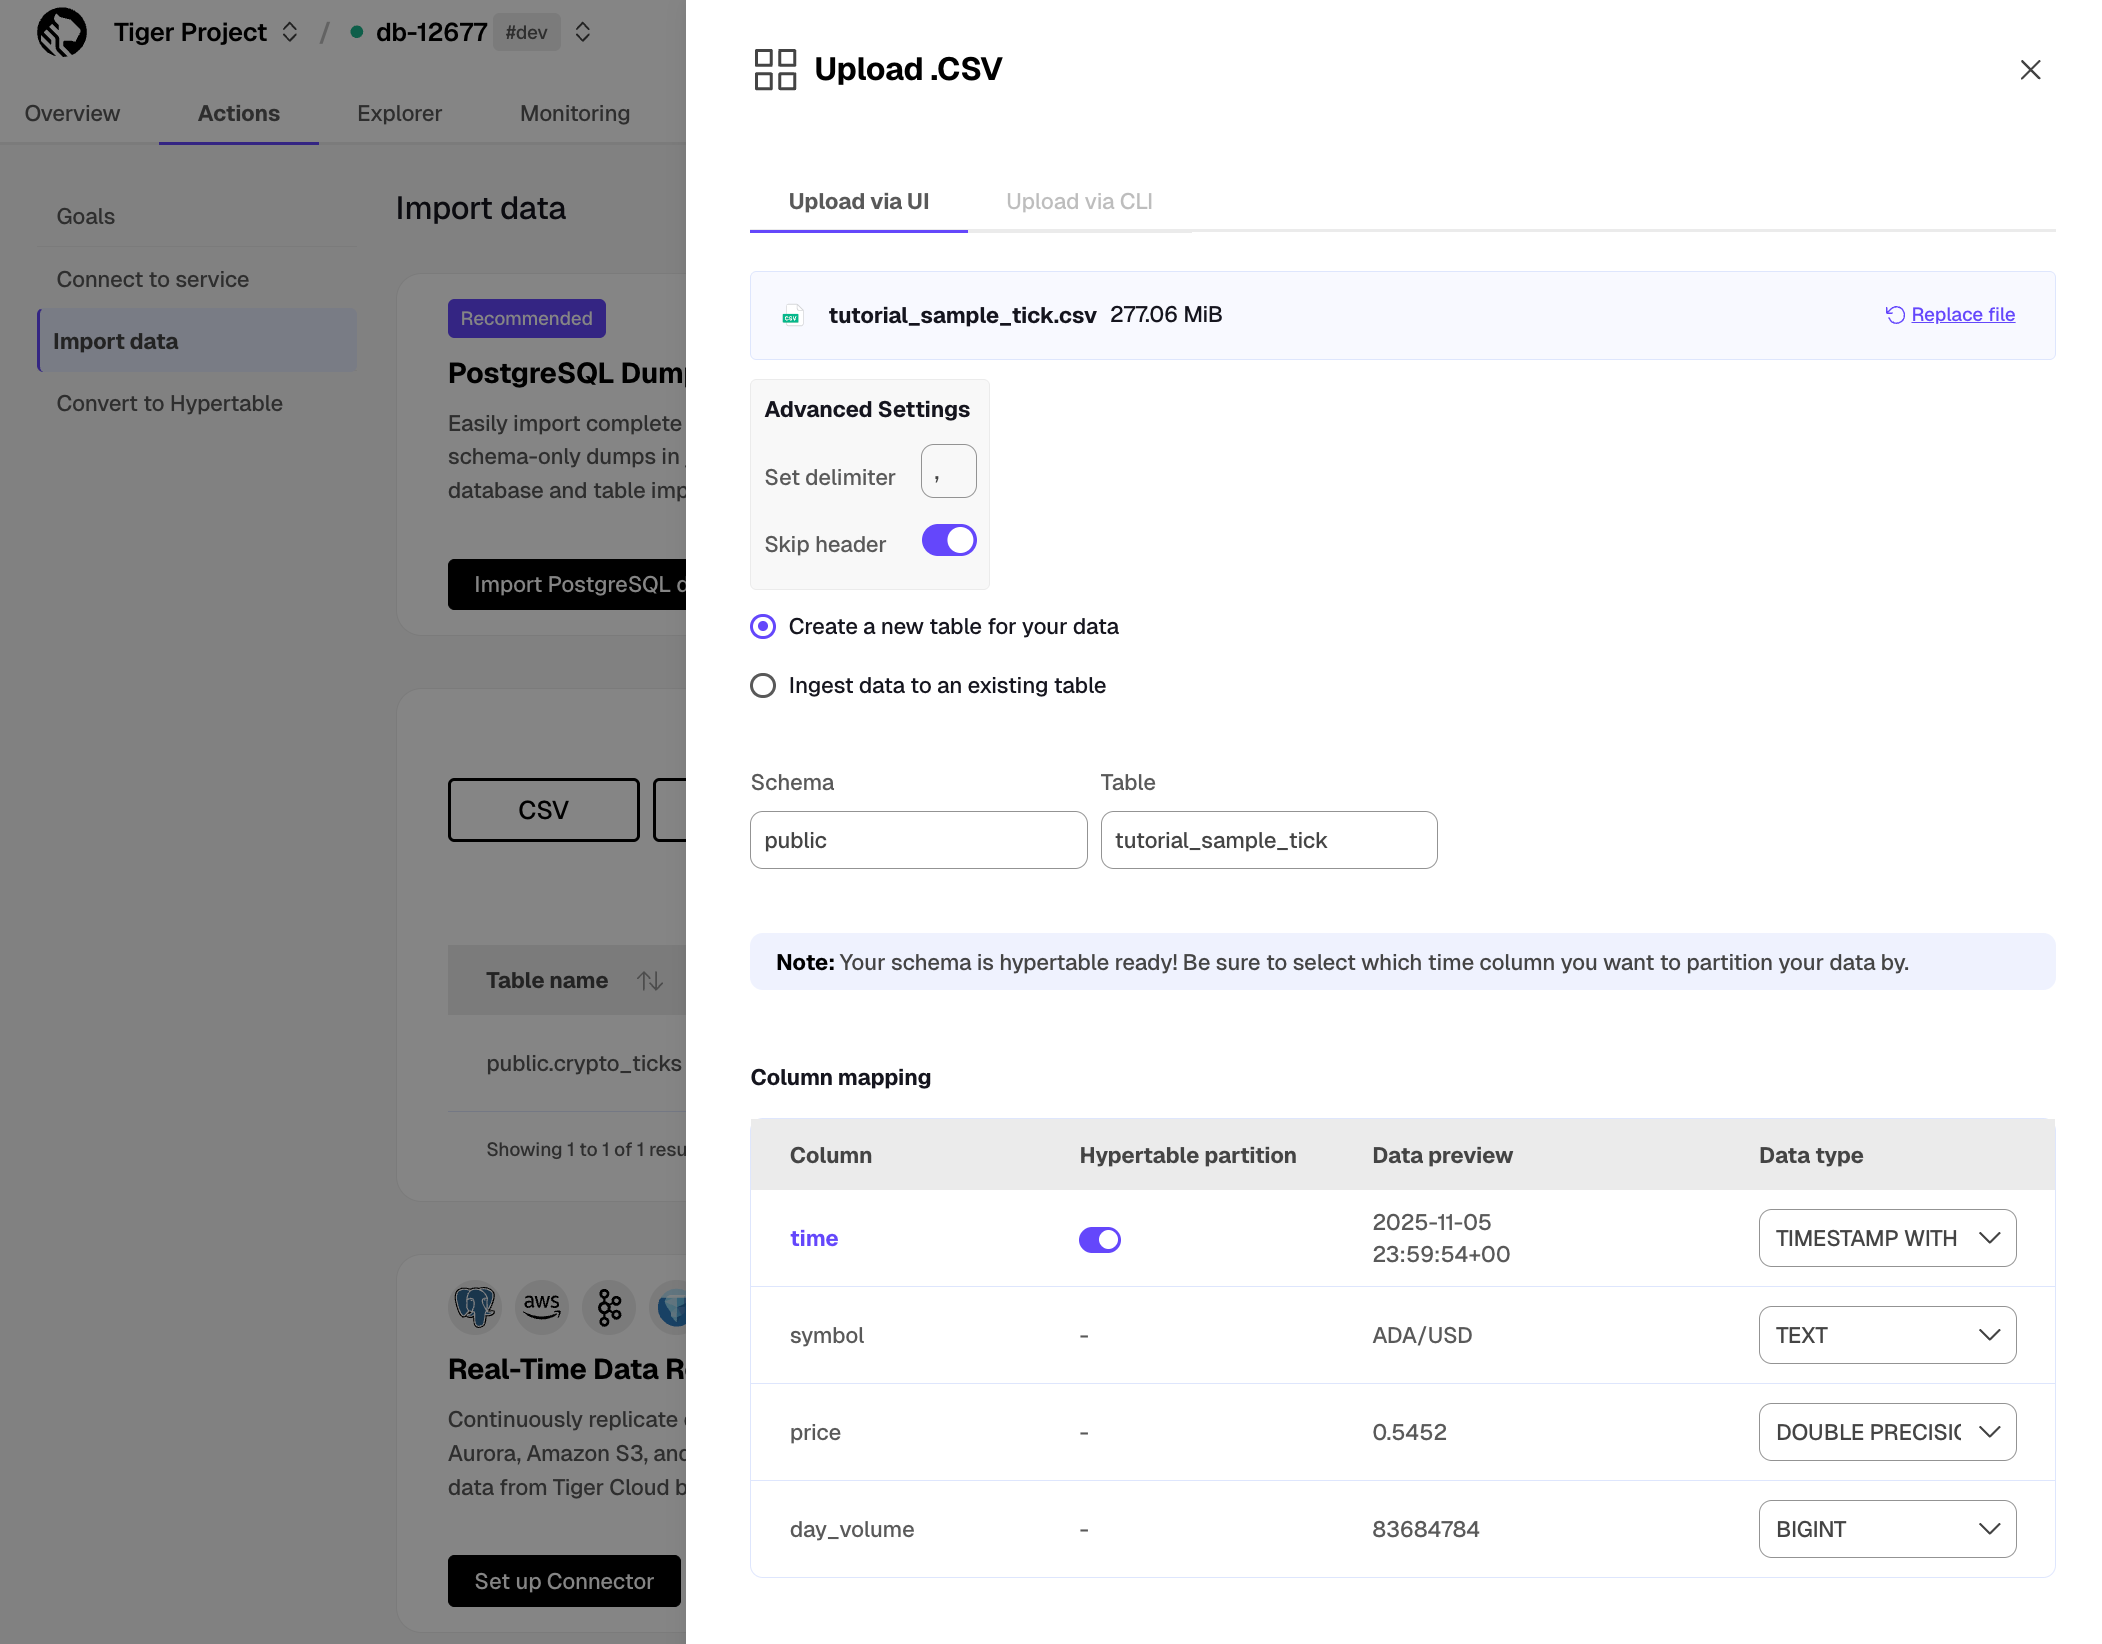
- Set a delimiter.
- Toggle to skip or keep the header.
- Select to ingest the data into an existing table or create a new one.
- Provide the new or existing table name.
- For a new table with a time column, toggle the time column to create a hypertable instead of a regular table.
- Click
Process CSV file
When the processing is completed, to find the data your imported, click Explorer.
To upload a Parquet file to your service:
- Select your service in Console, then click
Actions>Import data>Upload your files>Upload Parquet file
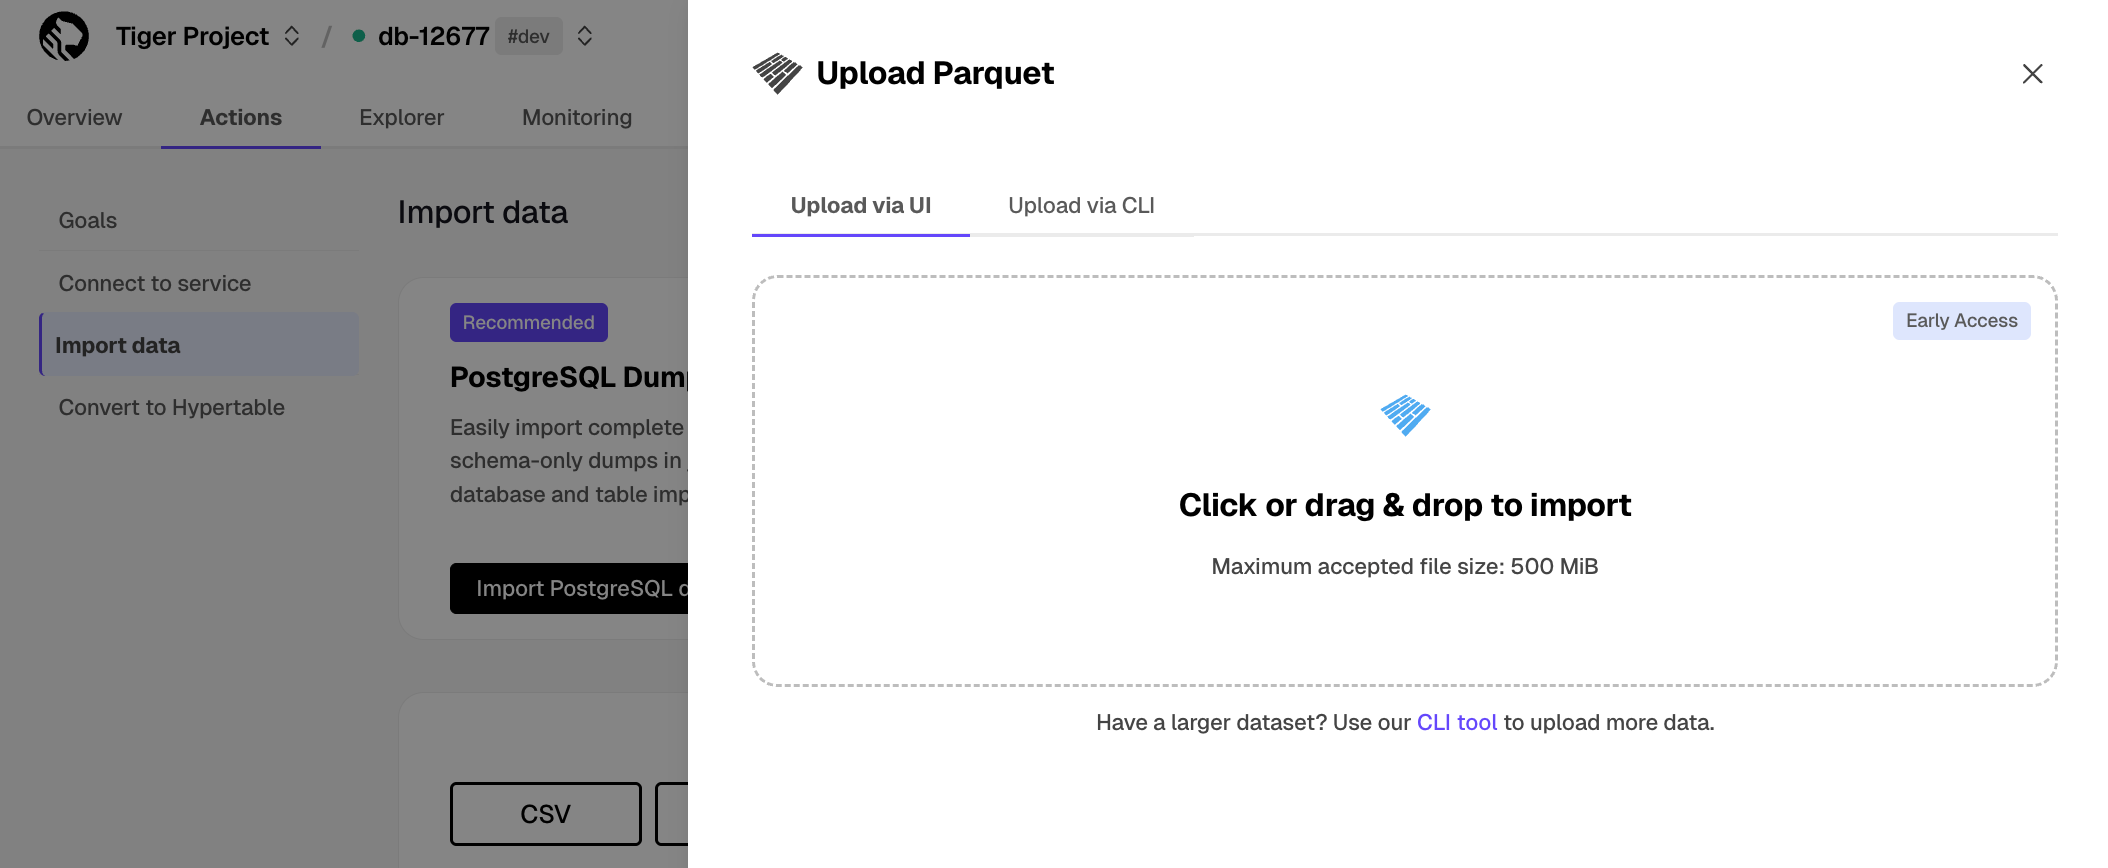
- Click to browse, or drag the file to import
- Configure the import
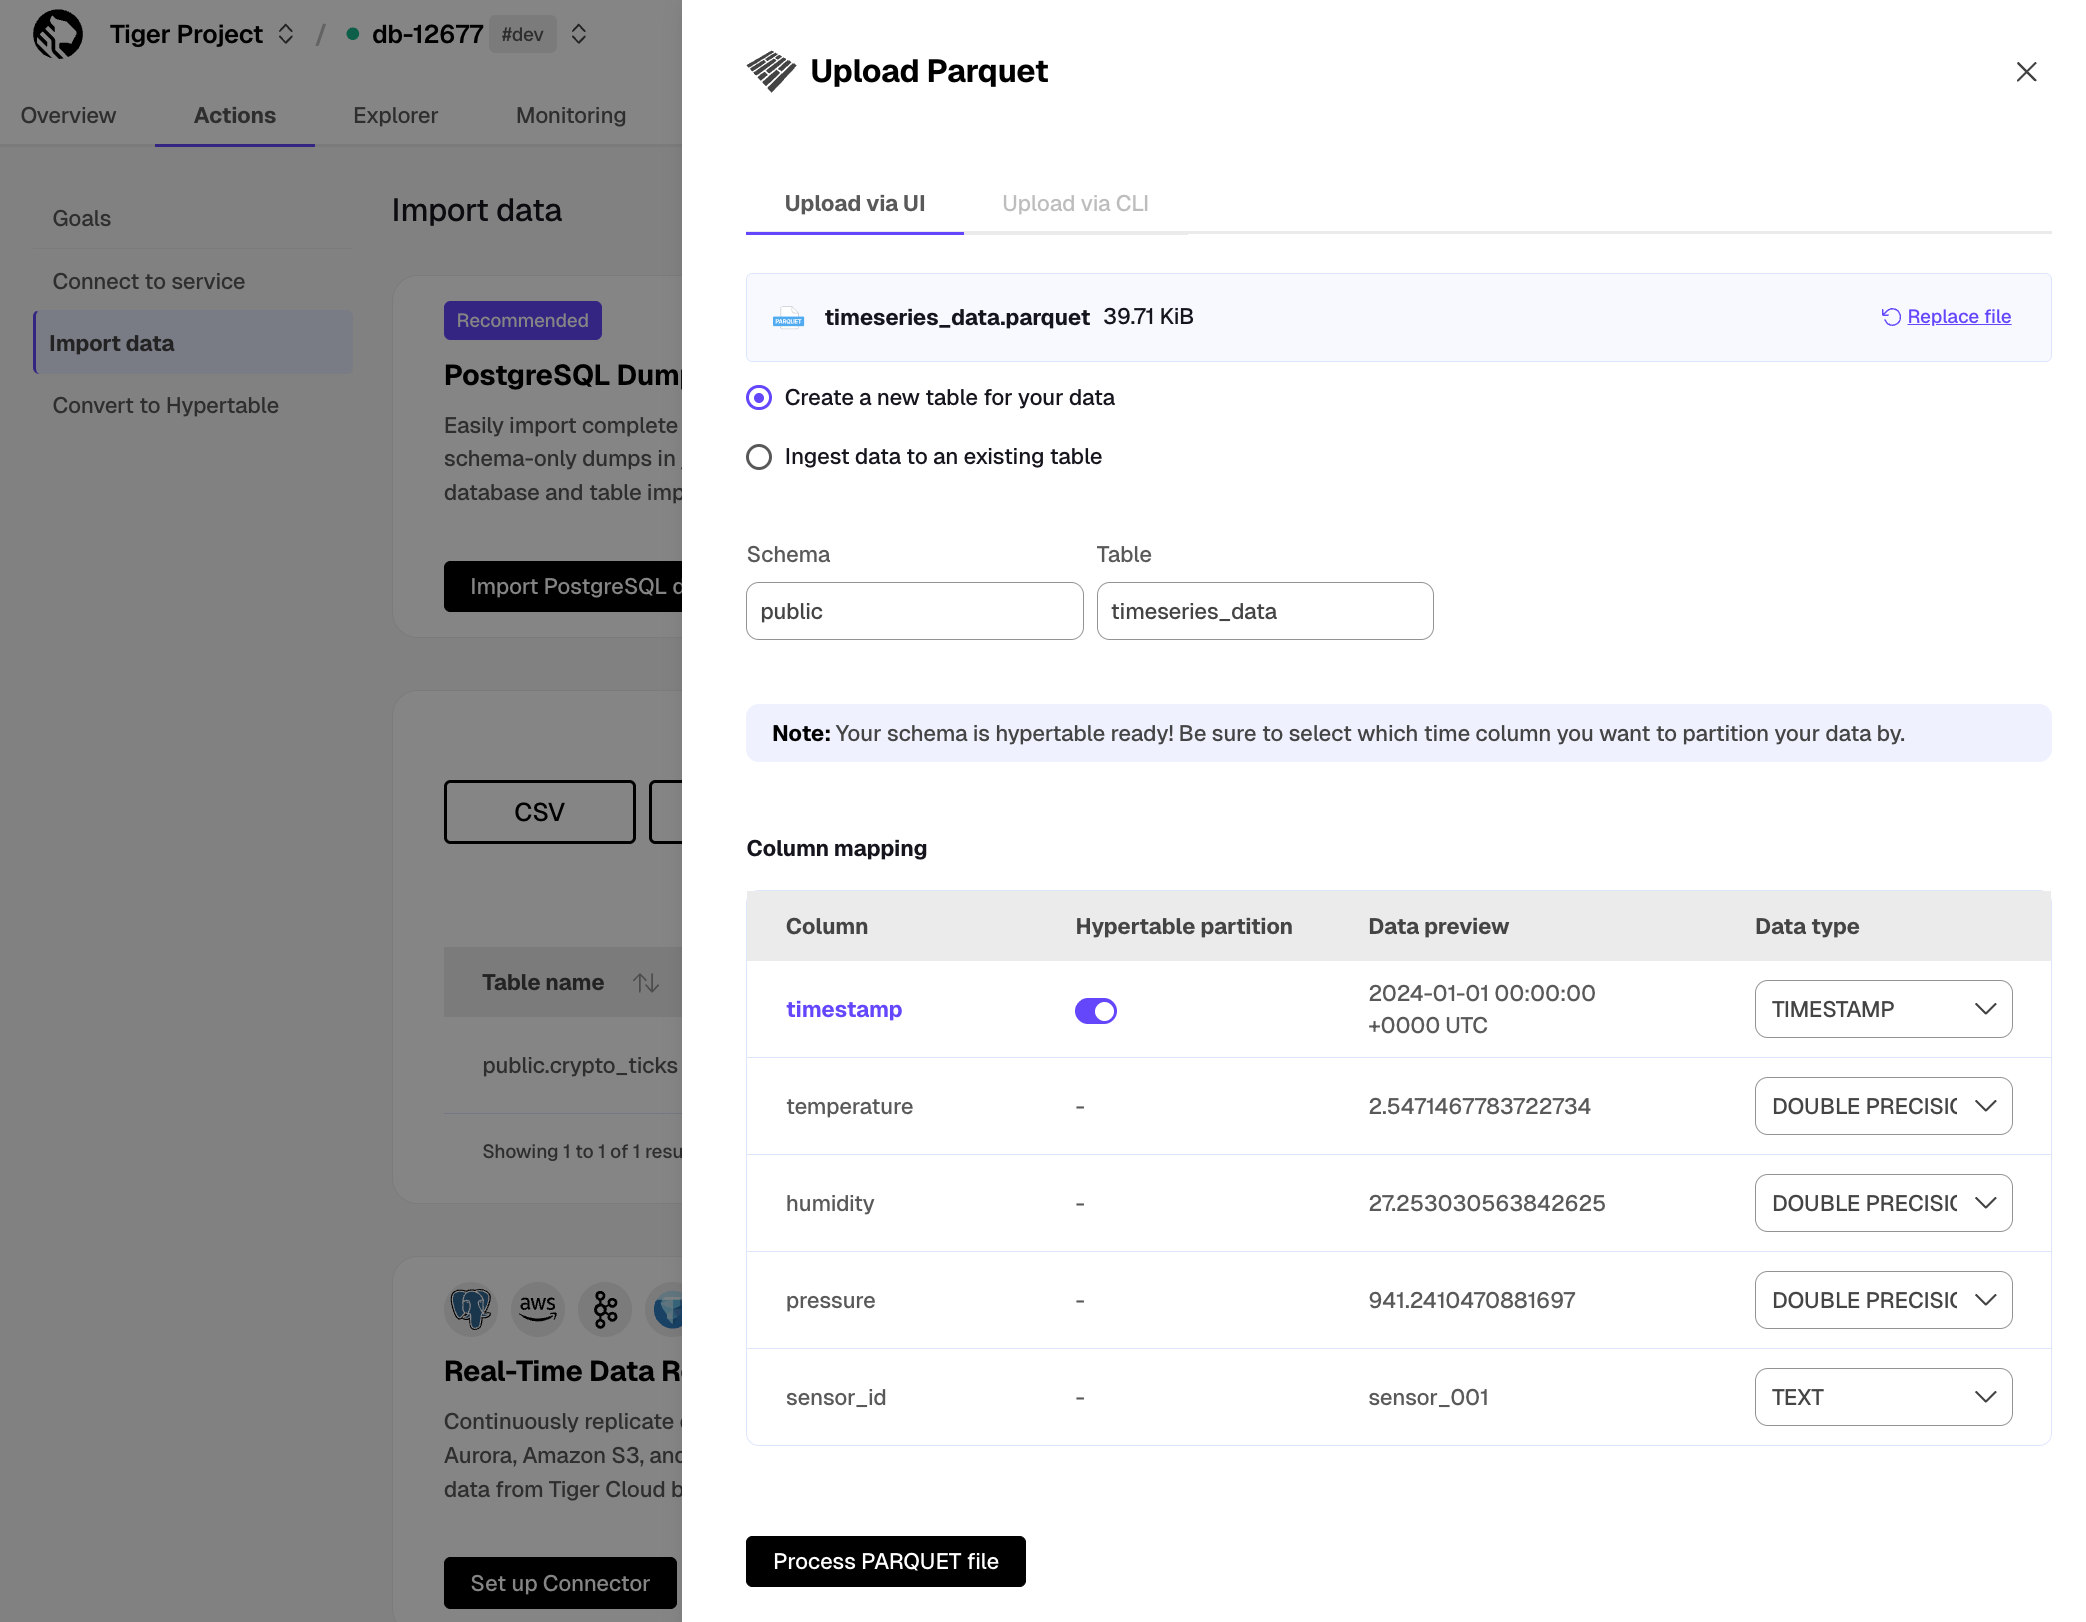
- Select to ingest the data into an existing table or create a new one.
- Provide the new or existing table name.
- For a new table with a time column, toggle the time column to create a hypertable instead of a regular table.
- Click
Process Parquet file
When the processing is completed, to find the data your imported, click Explorer.
To upload a TXT or MD file to your service:
- Select your service in Console, then click
Actions>Import data>Upload your files>Upload Text file
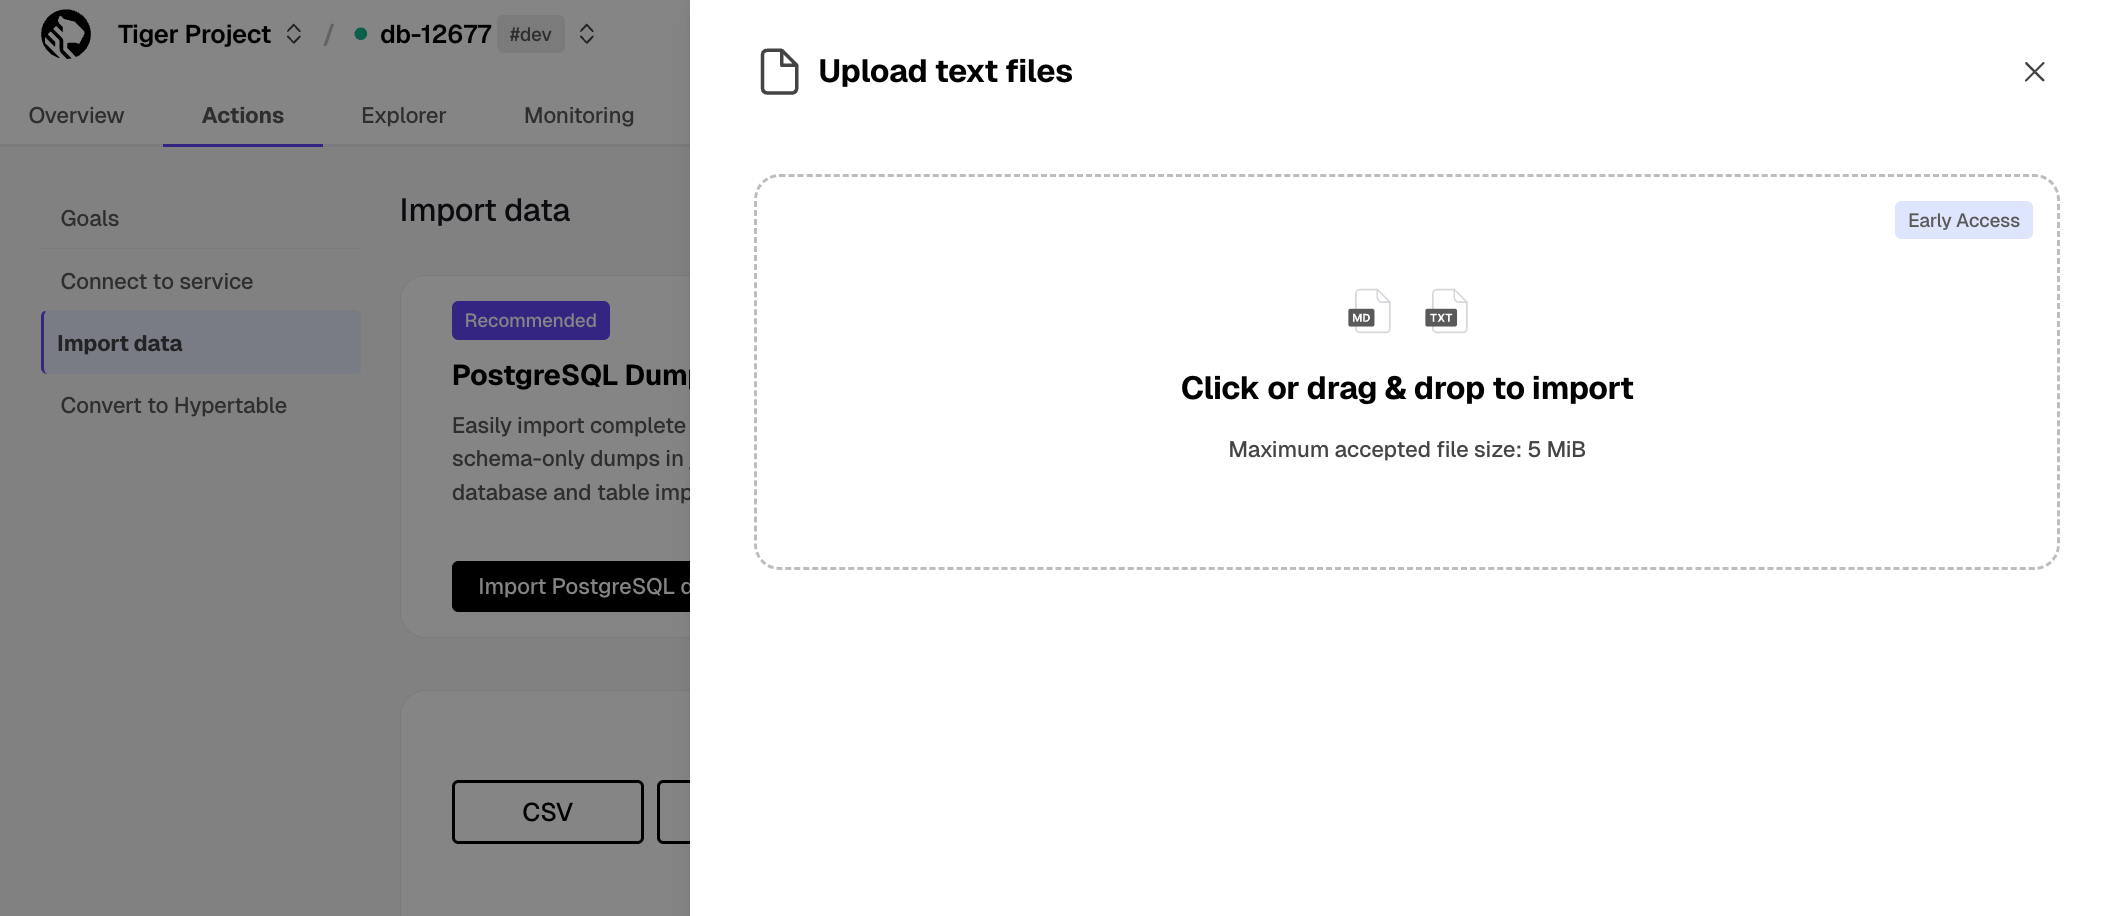
- Click to browse, or drag and drop the file to import
- Configure the import
Provide a name to create a new table, or select an existing table to add data to.
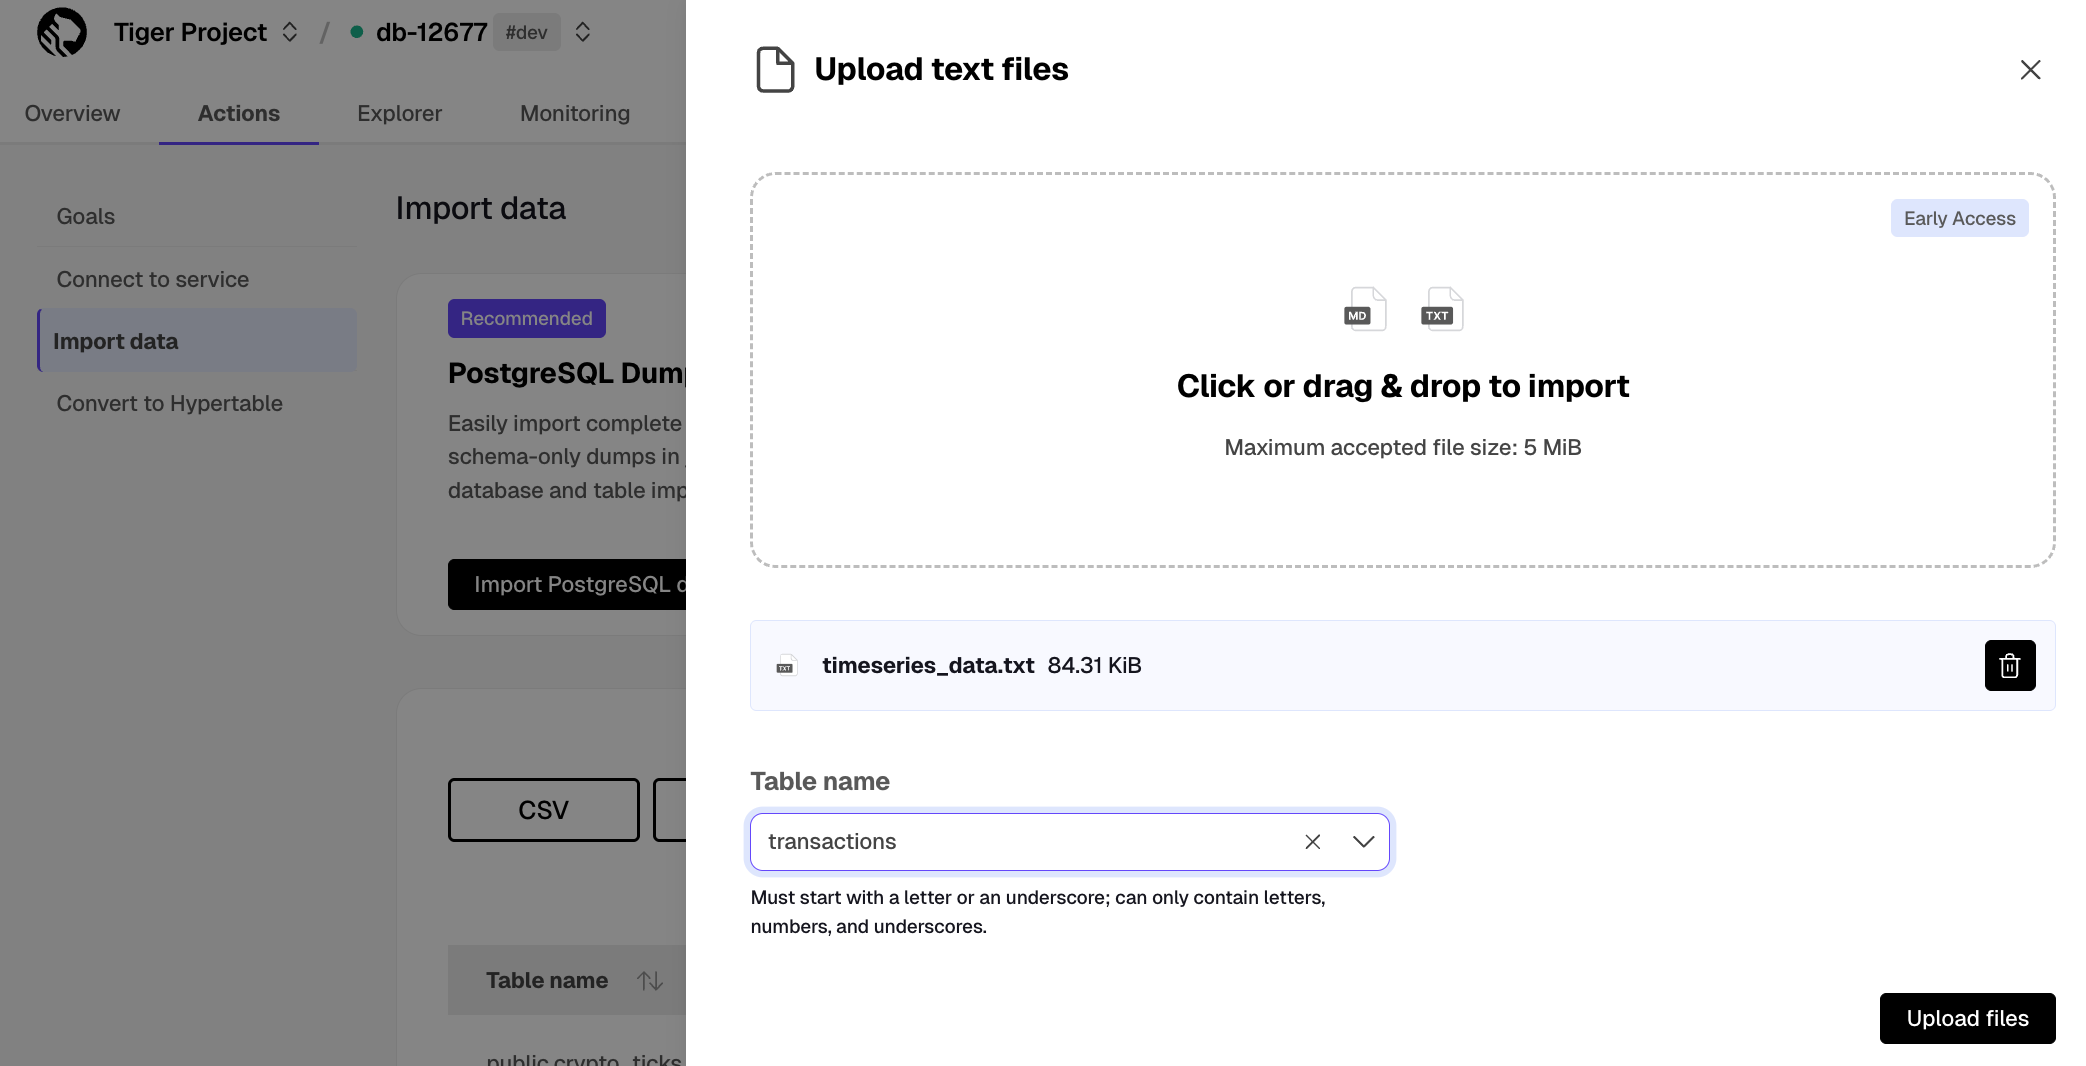
- Click
Upload files
When the upload is finished, find your data imported to a new or existing table in Explorer.
Tiger Cloud Console enables you to upload CSV and Parquet files, including archives compressed using GZIP and ZIP, by connecting to an S3 bucket.
This feature is not available under the Free pricing plan.
Prerequisites
To follow the steps on this page:
Create a target Tiger Cloud service with real-time analytics enabled.
Ensure access to a standard Amazon S3 bucket containing your data files.
Configure access credentials for the S3 bucket. The following credentials are supported:
To import a CSV file from an S3 bucket:
Select your service in Console, then click
Actions>Import data>Explore import options>Import from S3Select your file in the S3 bucket
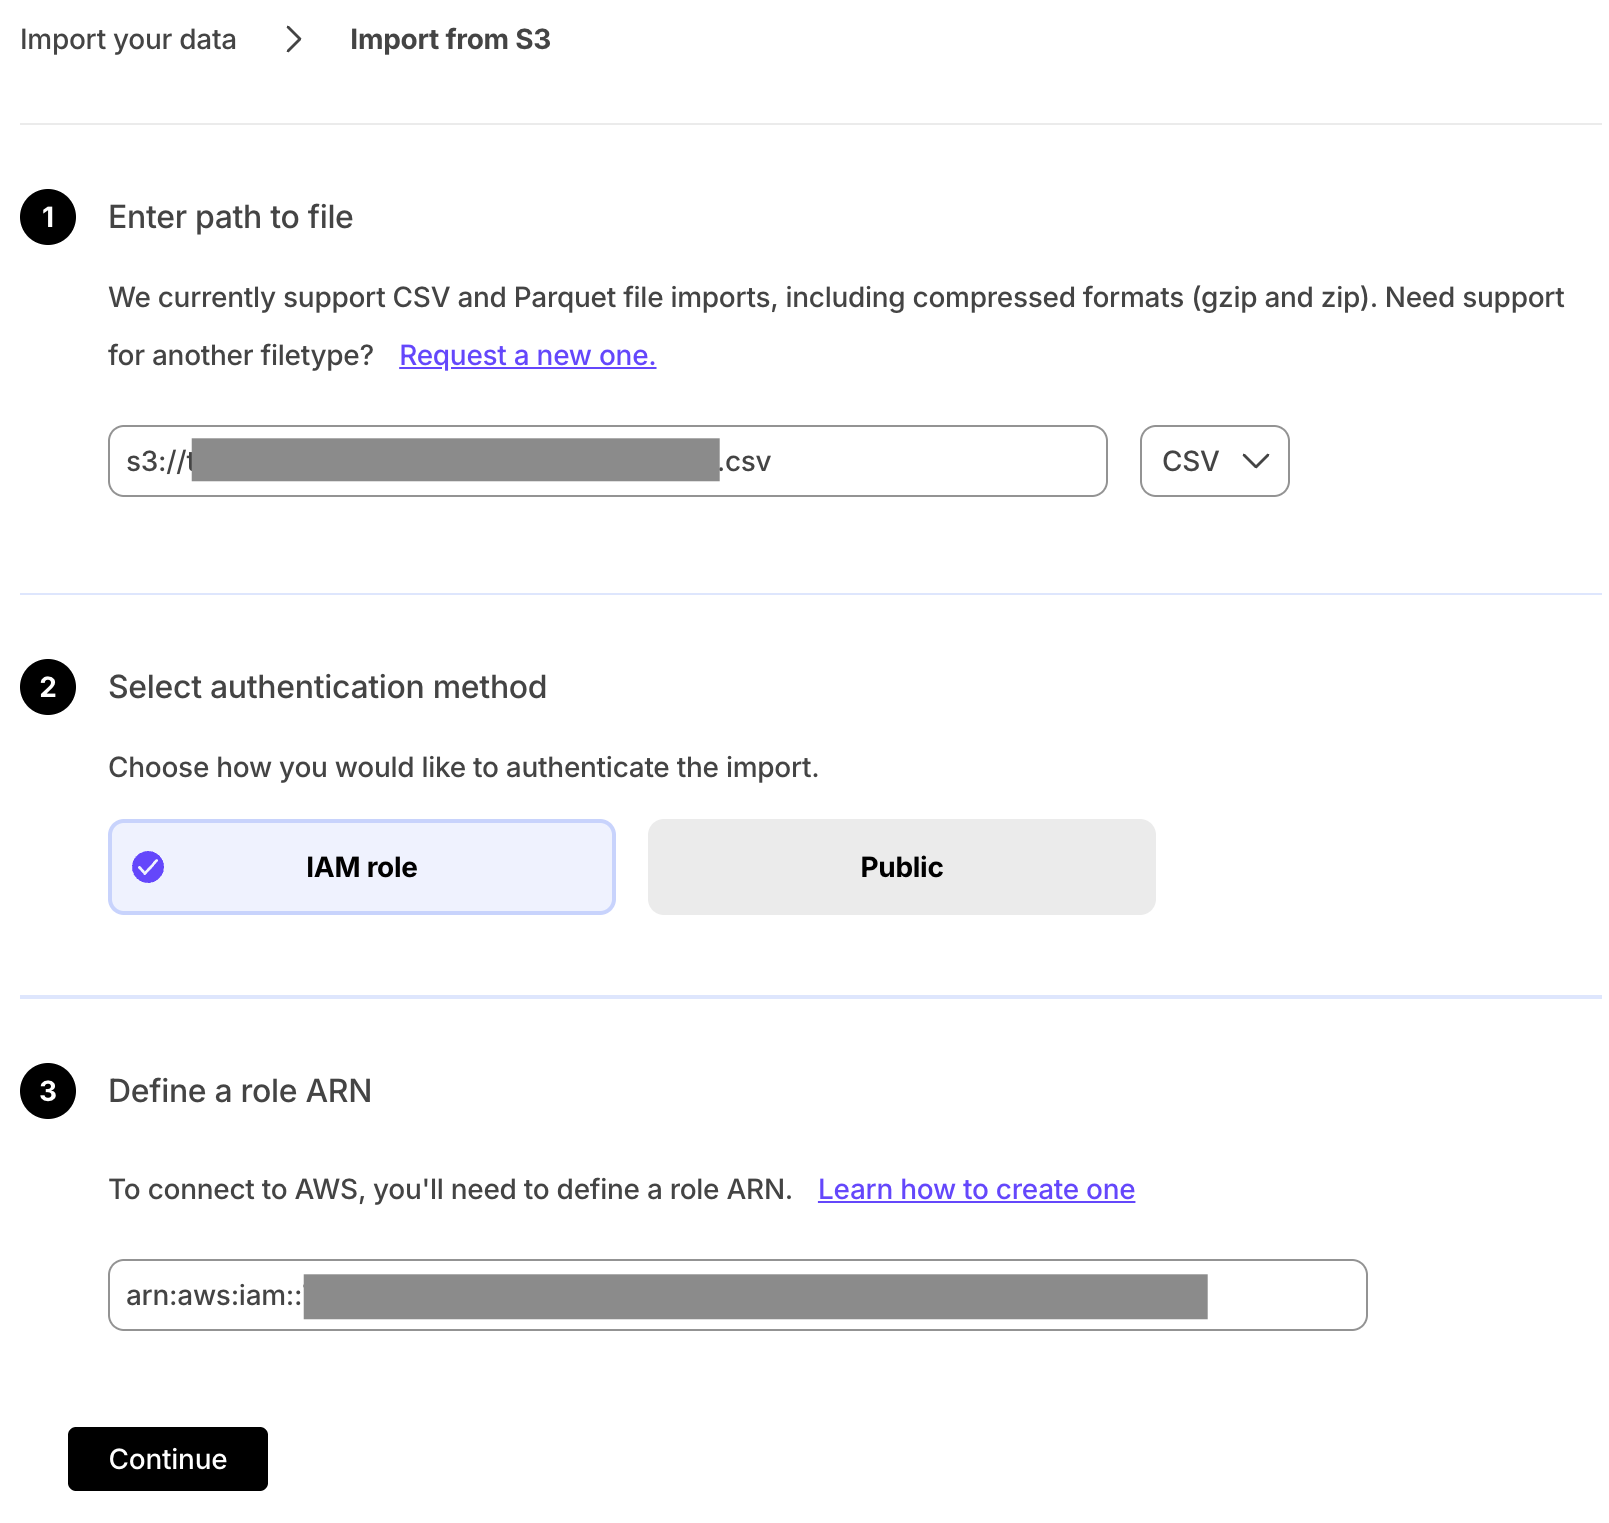
- Provide your file path.
- Select
CSVin the file type dropdown. - Select the authentication method:
IAM roleand provide the role.Public.
Click
Continue.Configure the import
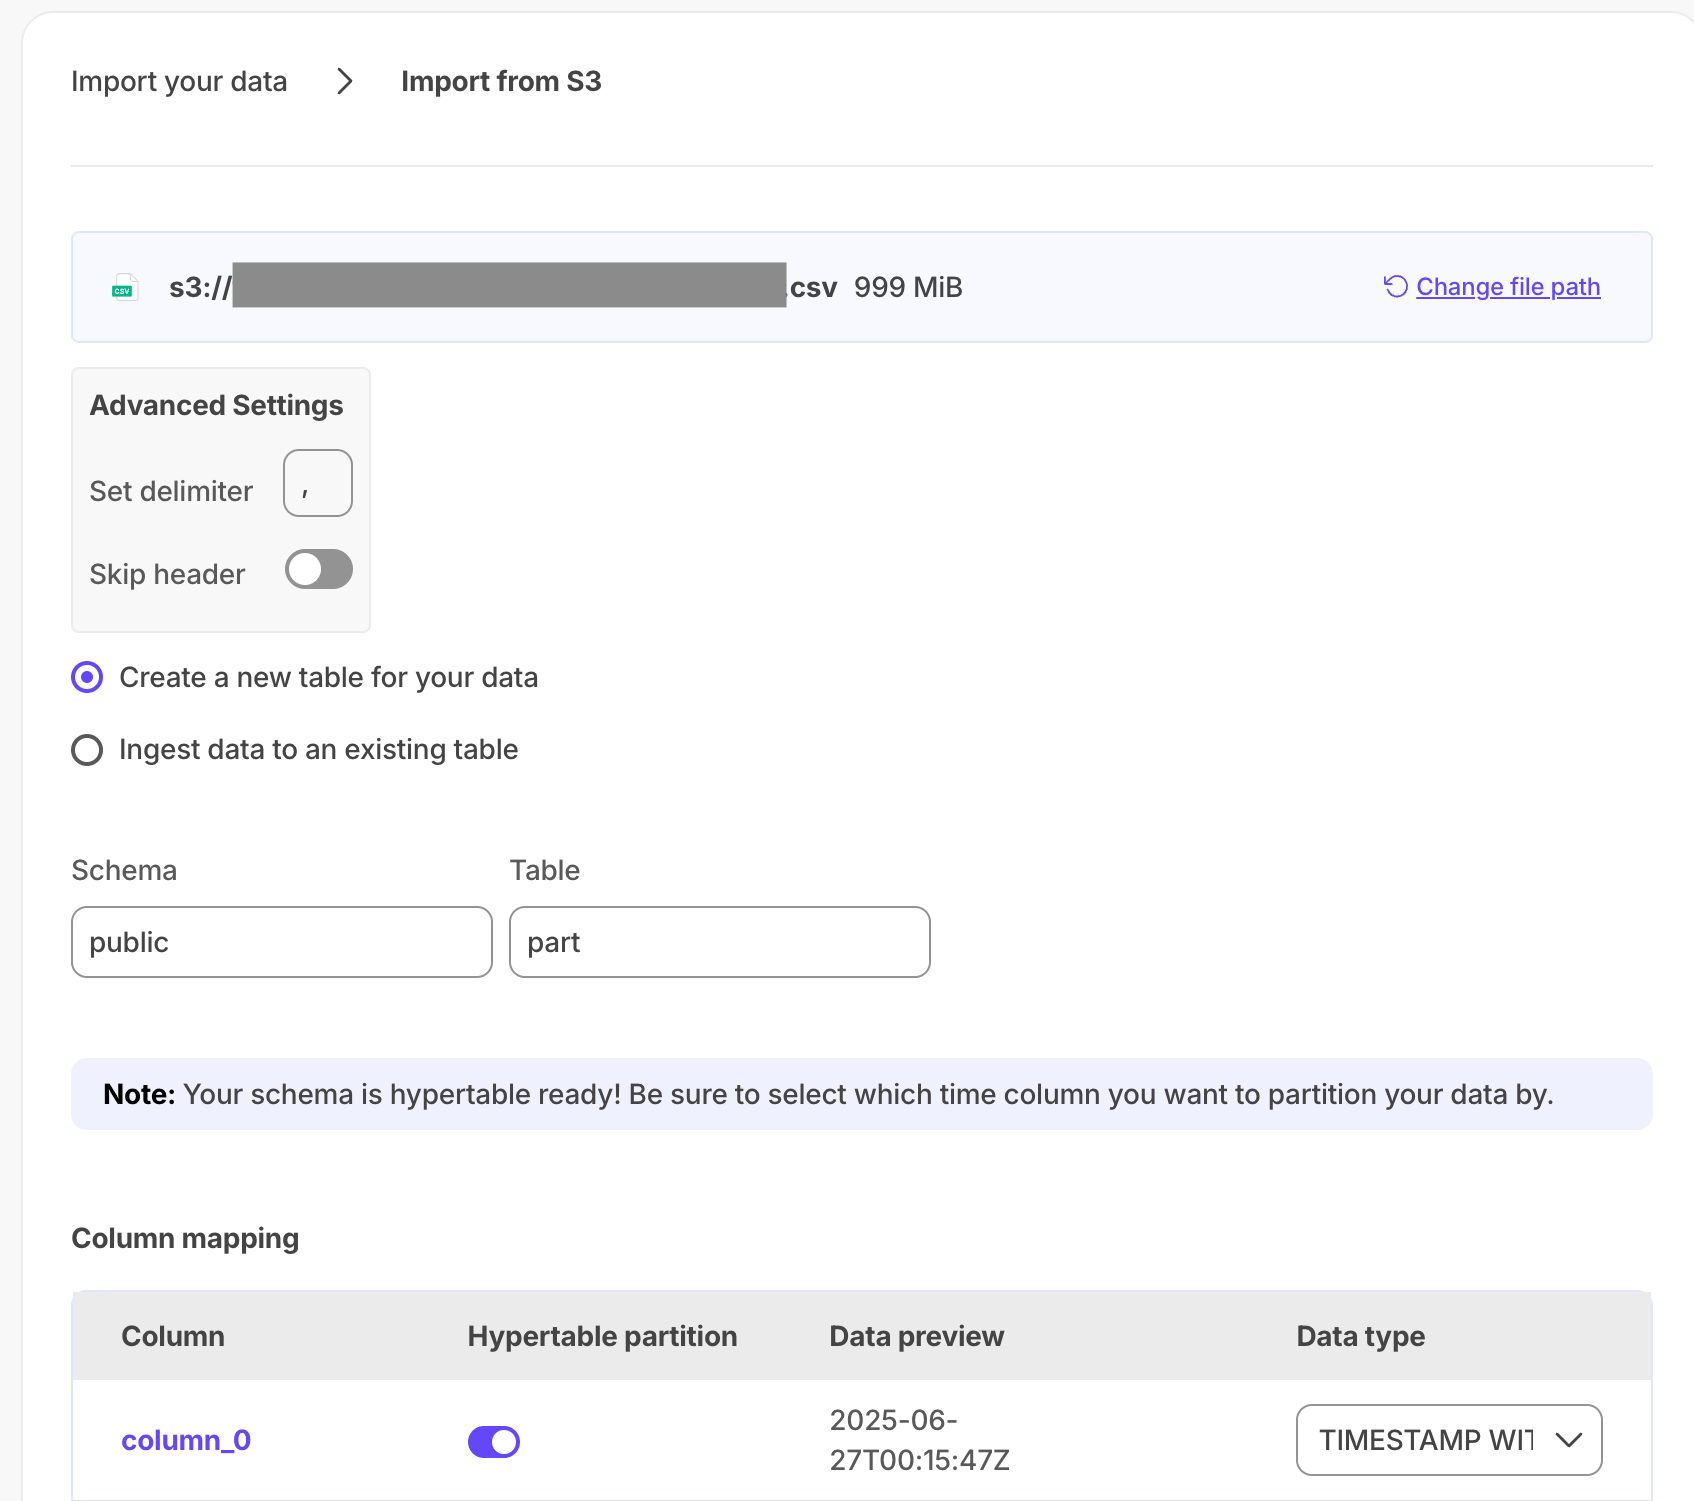
- Set a delimiter.
- Toggle to skip or keep the header.
- Select to ingest the data into an existing table or create a new one.
- Provide the new or existing table name.
- For a new table with a time column, toggle the time column to create a hypertable instead of a regular table.
- Click
Process CSV file
When the processing is completed, to find the data your imported, click Explorer.
To import a Parquet file from an S3 bucket:
Select your service in Console, then click
Actions>Import from S3Select your file in the S3 bucket
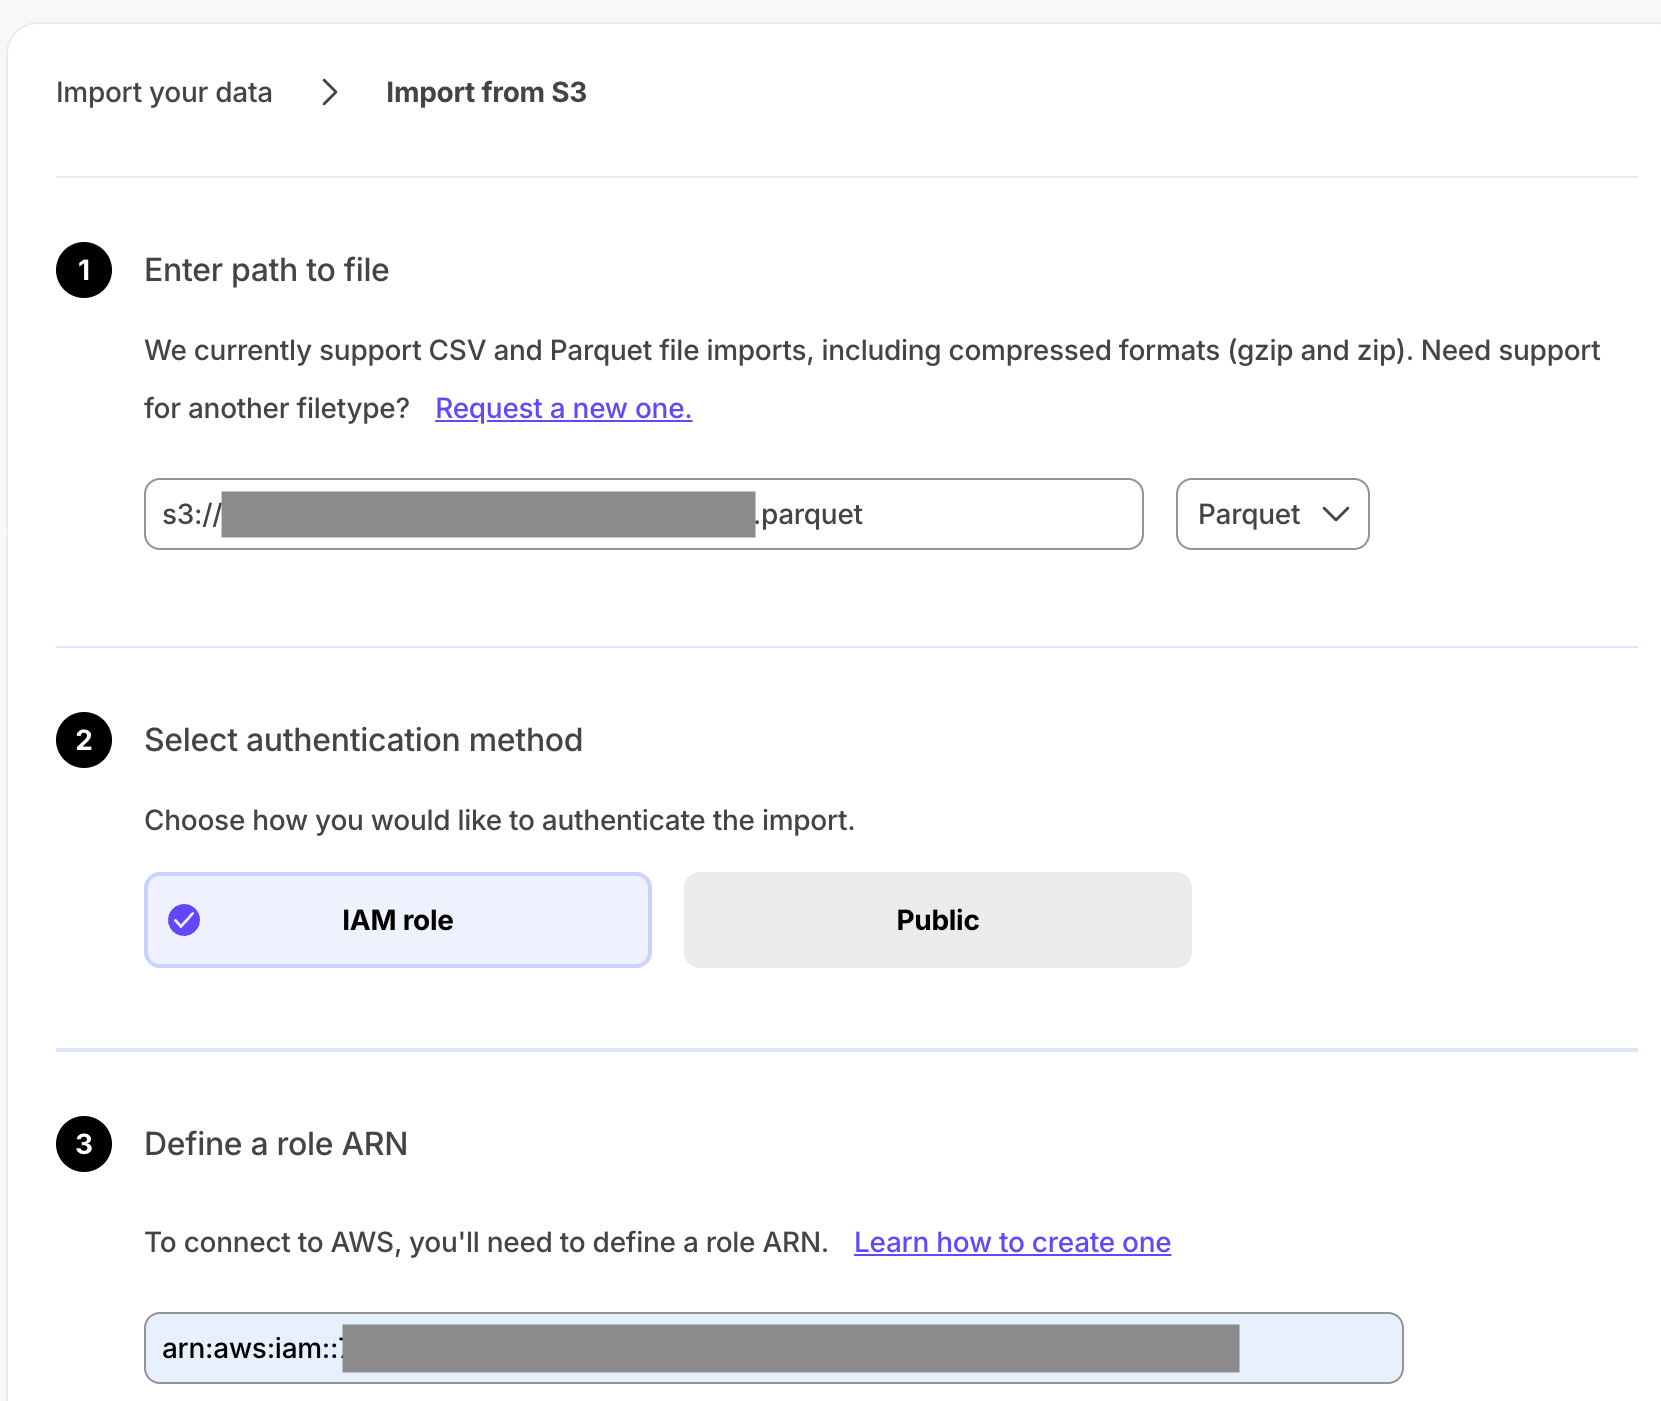
- Provide your file path.
- Select
Parquetin the file type dropdown. - Select the authentication method:
IAM roleand provide the role.Public.
Click
Continue.Configure the import
- Select
Create a new table for your dataorIngest data to an existing table. - Provide the new or existing table name.
- For a new table with a time column, toggle the time column to create a hypertable instead of a regular table.
- Select
Click
Process Parquet file
When the processing is completed, to find the data your imported, click Explorer.
And that is it, you have imported your data to your Tiger Cloud service.
===== PAGE: https://docs.tigerdata.com/migrate/upload-file-using-terminal/ =====
Upload a file into your service using the terminal
This page shows you how to upload CSV, MySQL, and Parquet files from a source machine into your service using the terminal.
The CSV file format is widely used for data migration. This page shows you how to import data into your Tiger Cloud service from a CSV file using the terminal.
Prerequisites
To follow the procedure on this page you need to:
- Create a target Tiger Cloud service.
This procedure also works for self-hosted TimescaleDB.
Install Go v1.13 or later
Install timescaledb-parallel-copy
timescaledb-parallel-copy improves performance for large datasets by parallelizing the import process. It also preserves row order and uses a round-robin approach to optimize memory management and disk operations.
To verify your installation, run timescaledb-parallel-copy --version.
- Ensure that the time column in the CSV file uses the
TIMESTAMPZdata type.
For faster data transfer, best practice is that your target service and the system running the data import are in the same region.
Import data into your service
To import data from a CSV file:
Set up your service connection string
This variable holds the connection information for the target Tiger Cloud service.
In the terminal on the source machine, set the following:
export TARGET=postgres://tsdbadmin:<PASSWORD>@<HOST>:<PORT>/tsdb?sslmode=require
See where to find your connection details.
- Create a hypertable to hold your data
Create a hypertable with a schema that is compatible with the data in your parquet file. For example, if your parquet file contains the columns ts, location, and temperature with typesTIMESTAMP, STRING, and DOUBLE:
TimescaleDB v2.20 and above:
psql target -c "CREATE TABLE ( \ ts TIMESTAMPTZ NOT NULL, \ location TEXT NOT NULL, \ temperature DOUBLE PRECISION NULL \ ) WITH (timescaledb.hypertable, timescaledb.partition_column = 'ts');" - TimescaleDB v2.19.3 and below: 1. Create a new regular table: ```sql psql target -c "CREATE TABLE ( \ ts TIMESTAMPTZ NOT NULL, \ location TEXT NOT NULL, \ temperature DOUBLE PRECISION NULL \ );" ``` 1. Convert the empty table to a hypertable: In the following command, replace `` with the name of the table you just created, and `<COLUMN_NAME>` with the partitioning column in ``. ```sql psql target -c "SELECT create_hypertable('', by_range('<COLUMN_NAME>'))" ``` 1. **Import your data** In the folder containing your CSV files, either: - Use [timescaledb-parallel-copy][install-parallel-copy]:bash
timescaledb-parallel-copy \ --connection target \ --table \ --file <FILE_NAME>.csv \ --workers <NUM_WORKERS> \ --reporting-period 30sFor the best performances while avoiding resource competition, set `<NUM_WORKERS>` to twice the number of CPUs in your service, but less than the available CPU cores. For self-hosted TimescaleDB, set `target` to `host=localhost user=postgres sslmode=disable` - Use `psql`:bash psql target \c \COPY FROM .csv CSV"
`psql` COPY is single-threaded, and may be slower for large datasets. 1. **Verify the data was imported correctly into your service** And that is it, you have imported your data from a CSV file. MySQL is an open-source relational database management system (RDBMS). This page shows you how to import data into your Tiger Cloud service from a database running on MySQL version 8 or earlier. ## Prerequisites To follow the procedure on this page you need to: * Create a [target Tiger Cloud service][create-service]. This procedure also works for [self-hosted TimescaleDB][enable-timescaledb]. - [Install Docker][install-docker] on your migration machine. This machine needs sufficient space to store the buffered changes that occur while your data is being copied. This space is proportional to the amount of new uncompressed data being written to the Tiger Cloud service during migration. A general rule of thumb is between 100GB and 500GB. For faster data transfer, best practice is for your source database, target service, and the system running the data import are in the same region . ## Import data into your service To import data from a MySQL database: 1. **Set up the connection string for your target service** This variable holds the connection information for the target Tiger Cloud service. In the terminal on the source machine, set the following:bash
export TARGET=postgres://tsdbadmin:@:/tsdb?sslmode=require
See where to [find your connection details][connection-info]. 1. **Set up the connection string for your source database**bash SOURCE="mysql://:@:/?sslmode=require"
where: - `<mysql_username>`: your MySQL username - `<mysql_password>`: your MySQL password - `<mysql_host>`: the MySQL server hostname or IP address - `<mysql_port>`: the MySQL server port, the default is 3306 - `<mysql_database>`: the name of your MySQL database 1. **Import your data** On your data import machine, run the following command: ```docker docker run -it ghcr.io/dimitri/pgloader:latest pgloader --no-ssl-cert-verification \ "source" \ "target" ``` 1. **Verify the data was imported correctly into your service** And that is it, you have imported your data from MySQL. [Apache Parquet][apache-parquet] is a free and open-source column-oriented data storage format in the Apache Hadoop ecosystem. It provides efficient data compression and encoding schemes with enhanced performance to handle complex data in bulk. This page shows you how to import data into your Tiger Cloud service from a Parquet file. ## Prerequisites To follow the procedure on this page you need to: * Create a [target Tiger Cloud service][create-service]. This procedure also works for [self-hosted TimescaleDB][enable-timescaledb]. - [Install DuckDB][install-duckdb] on the source machine where the Parquet file is located. - Ensure that the time column in the Parquet file uses the `TIMESTAMP` data type. For faster data transfer, best practice is that your target service and the system running the data import are in the same region. ## Import data into your service To import data from a Parquet file: 1. **Set up your service connection string** This variable holds the connection information for the target Tiger Cloud service. In the terminal on the source machine, set the following:bash export TARGET=postgres://tsdbadmin:@:/tsdb?sslmode=require
See where to [find your connection details][connection-info]. 1. **Create a [hypertable][hypertable-docs] to hold your data** Create a hypertable with a schema that is compatible with the data in your parquet file. For example, if your parquet file contains the columns `ts`, `location`, and `temperature` with types`TIMESTAMP`, `STRING`, and `DOUBLE`: - TimescaleDB v2.20 and above: ```sql psql target -c "CREATE TABLE ( \ ts TIMESTAMPTZ NOT NULL, \ location TEXT NOT NULL, \ temperature DOUBLE PRECISION NULL \ ) WITH (timescaledb.hypertable, timescaledb.partition_column = 'ts');" - TimescaleDB v2.19.3 and below: 1. Create a new regular table: ```sql psql target -c "CREATE TABLE ( \ ts TIMESTAMPTZ NOT NULL, \ location TEXT NOT NULL, \ temperature DOUBLE PRECISION NULL \ );" ``` 1. Convert the empty table to a hypertable: In the following command, replace `` with the name of the table you just created, and `<COLUMN_NAME>` with the partitioning column in ``. ```sql psql target -c "SELECT create_hypertable('', by_range('<COLUMN_NAME>'))" ``` 1. **Set up a DuckDB connection to your service** 1. In a terminal on the source machine with your Parquet files, start a new DuckDB interactive session: ```bash duckdb ``` 1. Connect to your service in your DuckDB session: ```bash ATTACH '<Paste the value of target here' AS db (type postgres); ``` `target` is the connection string you used to connect to your service using psql. 1. **Import data from Parquet to your service** 1. In DuckDB, upload the table data to your service ```bash COPY db. FROM '<FILENAME>.parquet' (FORMAT parquet); ``` Where: - ``: the hypertable you created to import data to - `<FILENAME>`: the Parquet file to import data from 1. Exit the DuckDB session: ```bash EXIT; ``` 1. **Verify the data was imported correctly into your service** In your `psql` session, view the data in ``:sql SELECT * FROM ;
And that is it, you have imported your data from a Parquet file to your Tiger Cloud service. ===== PAGE: https://docs.tigerdata.com/migrate/pg-dump-and-restore/ ===== # Migrate with downtime You use downtime migration to move less than 100GB of data from a self-hosted database to a Tiger Cloud service. Downtime migration uses the native Postgres [`pg_dump`][pg_dump] and [`pg_restore`][pg_restore] commands. If you are migrating from self-hosted TimescaleDB, this method works for hypertables compressed into the columnstore without having to convert the data back to the rowstore before you begin. If you want to migrate more than 400GB of data, create a [Tiger Cloud Console support request](https://console.cloud.timescale.com/dashboard/support), or send us an email at [support@tigerdata.com](mailto:support@tigerdata.com) saying how much data you want to migrate. We pre-provision your Tiger Cloud service for you. However, downtime migration for large amounts of data takes a large amount of time. For more than 100GB of data, best practice is to follow [live migration]. This page shows you how to move your data from a self-hosted database to a Tiger Cloud service using shell commands. ## Prerequisites Best practice is to use an [Ubuntu EC2 instance][create-ec2-instance] hosted in the same region as your Tiger Cloud service to move data. That is, the machine you run the commands on to move your data from your source database to your target Tiger Cloud service. Before you move your data: - Create a target [Tiger Cloud service][created-a-database-service-in-timescale]. Each Tiger Cloud service has a single Postgres instance that supports the [most popular extensions][all-available-extensions]. Tiger Cloud services do not support tablespaces, and there is no superuser associated with a service. Best practice is to create a Tiger Cloud service with at least 8 CPUs for a smoother experience. A higher-spec instance can significantly reduce the overall migration window. - To ensure that maintenance does not run while migration is in progress, best practice is to [adjust the maintenance window][adjust-maintenance-window]. - Install the Postgres client tools on your migration machine. This includes `psql`, `pg_dump`, and `pg_dumpall`. - Install the GNU implementation of `sed`. Run `sed --version` on your migration machine. GNU sed identifies itself as GNU software, BSD sed returns `sed: illegal option -- -`. ### Migrate to Tiger Cloud To move your data from a self-hosted database to a Tiger Cloud service: This section shows you how to move your data from self-hosted TimescaleDB to a Tiger Cloud service using `pg_dump` and `psql` from Terminal. ## Prepare to migrate 1. **Take the applications that connect to the source database offline** The duration of the migration is proportional to the amount of data stored in your database. By disconnection your app from your database you avoid and possible data loss. 1. **Set your connection strings** These variables hold the connection information for the source database and target Tiger Cloud service:bash export SOURCE="postgres://:@:/" export TARGET="postgres://tsdbadmin:@:/tsdb?sslmode=require"
You find the connection information for your Tiger Cloud service in the configuration file you downloaded when you created the service. ## Align the version of TimescaleDB on the source and target 1. Ensure that the source and target databases are running the same version of TimescaleDB. 1. Check the version of TimescaleDB running on your Tiger Cloud service: ```bash psql target -c "SELECT extversion FROM pg_extension WHERE extname = 'timescaledb';" ``` 1. Update the TimescaleDB extension in your source database to match the target service: If the TimescaleDB extension is the same version on the source database and target service, you do not need to do this. ```bash psql source -c "ALTER EXTENSION timescaledb UPDATE TO '<version here>';" ``` For more information and guidance, see [Upgrade TimescaleDB](https://docs.tigerdata.com/self-hosted/latest/upgrades/). 1. Ensure that the Tiger Cloud service is running the Postgres extensions used in your source database. 1. Check the extensions on the source database: ```bash psql source -c "SELECT * FROM pg_extension;" ``` 1. For each extension, enable it on your target Tiger Cloud service: ```bash psql target -c "CREATE EXTENSION IF NOT EXISTS <extension name> CASCADE;" ``` ## Migrate the roles from TimescaleDB to your Tiger Cloud service Roles manage database access permissions. To migrate your role-based security hierarchy to your Tiger Cloud service: 1. **Dump the roles from your source database** Export your role-based security hierarchy. `<db_name>` has the same value as `<db_name>` in `source`. I know, it confuses me as well.bash pg_dumpall -d "source"
-l <db_name> --quote-all-identifiers \ --roles-only \ --file=roles.sqlIf you only use the default `postgres` role, this step is not necessary. 1. **Remove roles with superuser access** Tiger Cloud service do not support roles with superuser access. Run the following script to remove statements, permissions and clauses that require superuser permissions from `roles.sql`:bash sed -i -E \ -e '/CREATE ROLE "postgres";/d' \ -e '/ALTER ROLE "postgres"/d' \ -e '/CREATE ROLE "tsdbadmin";/d' \ -e '/ALTER ROLE "tsdbadmin"/d' \ -e 's/(NO)*SUPERUSER//g' \ -e 's/(NO)*REPLICATION//g' \ -e 's/(NO)BYPASSRLS//g' \ -e 's/GRANTED BY "[^"]"//g' \ roles.sql
1. **Dump the source database schema and data** The `pg_dump` flags remove superuser access and tablespaces from your data. When you run `pgdump`, check the run time, [a long-running `pg_dump` can cause issues][long-running-pgdump].bash pg_dump -d "source" \ --format=plain \ --quote-all-identifiers \ --no-tablespaces \ --no-owner \ --no-privileges \ --file=dump.sql
To dramatically reduce the time taken to dump the source database, using multiple connections. For more information, see [dumping with concurrency][dumping-with-concurrency] and [restoring with concurrency][restoring-with-concurrency]. ## Upload your data to the target Tiger Cloud service This command uses the [timescaledb_pre_restore] and [timescaledb_post_restore] functions to put your database in the correct state.bash psql target -v ON_ERROR_STOP=1 --echo-errors \ -f roles.sql \ -c "SELECT timescaledb_pre_restore();" \ -f dump.sql \ -c "SELECT timescaledb_post_restore();"
## Validate your Tiger Cloud service and restart your app 1. Update the table statistics. ```bash psql target -c "ANALYZE;" ``` 1. Verify the data in the target Tiger Cloud service. Check that your data is correct, and returns the results that you expect, 1. Enable any Tiger Cloud features you want to use. Migration from Postgres moves the data only. Now manually enable Tiger Cloud features like [hypertables][about-hypertables], [hypercore][data-compression] or [data retention][data-retention] while your database is offline. 1. Reconfigure your app to use the target database, then restart it. And that is it, you have migrated your data from a self-hosted instance running TimescaleDB to a Tiger Cloud service. This section shows you how to move your data from self-hosted Postgres to a Tiger Cloud service using `pg_dump` and `psql` from Terminal. Migration from Postgres moves the data only. You must manually enable Tiger Cloud features like [hypertables][about-hypertables], [hypercore][data-compression] or [data retention][data-retention] after the migration is complete. You enable Tiger Cloud features while your database is offline. ## Prepare to migrate 1. **Take the applications that connect to the source database offline** The duration of the migration is proportional to the amount of data stored in your database. By disconnection your app from your database you avoid and possible data loss. 1. **Set your connection strings** These variables hold the connection information for the source database and target Tiger Cloud service:bash export SOURCE="postgres://:@:/" export TARGET="postgres://tsdbadmin:@:/tsdb?sslmode=require"
You find the connection information for your Tiger Cloud service in the configuration file you downloaded when you created the service. ## Align the extensions on the source and target 1. Ensure that the Tiger Cloud service is running the Postgres extensions used in your source database. 1. Check the extensions on the source database: ```bash psql source -c "SELECT * FROM pg_extension;" ``` 1. For each extension, enable it on your target Tiger Cloud service: ```bash psql target -c "CREATE EXTENSION IF NOT EXISTS <extension name> CASCADE;" ``` ## Migrate the roles from TimescaleDB to your Tiger Cloud service Roles manage database access permissions. To migrate your role-based security hierarchy to your Tiger Cloud service: 1. **Dump the roles from your source database** Export your role-based security hierarchy. `<db_name>` has the same value as `<db_name>` in `source`. I know, it confuses me as well.bash pg_dumpall -d "source"
-l <db_name> --quote-all-identifiers \ --roles-only \ --file=roles.sqlIf you only use the default `postgres` role, this step is not necessary. 1. **Remove roles with superuser access** Tiger Cloud service do not support roles with superuser access. Run the following script to remove statements, permissions and clauses that require superuser permissions from `roles.sql`:bash sed -i -E \ -e '/CREATE ROLE "postgres";/d' \ -e '/ALTER ROLE "postgres"/d' \ -e '/CREATE ROLE "tsdbadmin";/d' \ -e '/ALTER ROLE "tsdbadmin"/d' \ -e 's/(NO)*SUPERUSER//g' \ -e 's/(NO)*REPLICATION//g' \ -e 's/(NO)BYPASSRLS//g' \ -e 's/GRANTED BY "[^"]"//g' \ roles.sql
1. **Dump the source database schema and data** The `pg_dump` flags remove superuser access and tablespaces from your data. When you run `pgdump`, check the run time, [a long-running `pg_dump` can cause issues][long-running-pgdump].bash pg_dump -d "source" \ --format=plain \ --quote-all-identifiers \ --no-tablespaces \ --no-owner \ --no-privileges \ --file=dump.sql
To dramatically reduce the time taken to dump the source database, using multiple connections. For more information, see [dumping with concurrency][dumping-with-concurrency] and [restoring with concurrency][restoring-with-concurrency]. ## Upload your data to the target Tiger Cloud servicebash psql target -v ON_ERROR_STOP=1 --echo-errors \ -f roles.sql \ -f dump.sql
## Validate your Tiger Cloud service and restart your app 1. Update the table statistics. ```bash psql target -c "ANALYZE;" ``` 1. Verify the data in the target Tiger Cloud service. Check that your data is correct, and returns the results that you expect, 1. Enable any Tiger Cloud features you want to use. Migration from Postgres moves the data only. Now manually enable Tiger Cloud features like [hypertables][about-hypertables], [hypercore][data-compression] or [data retention][data-retention] while your database is offline. 1. Reconfigure your app to use the target database, then restart it. And that is it, you have migrated your data from a self-hosted instance running Postgres to a Tiger Cloud service. To migrate your data from an Amazon RDS/Aurora Postgres instance to a Tiger Cloud service, you extract the data to an intermediary EC2 Ubuntu instance in the same AWS region as your RDS/Aurora Postgres instance. You then upload your data to a Tiger Cloud service. To make this process as painless as possible, ensure that the intermediary machine has enough CPU and disk space to rapidLy extract and store your data before uploading to Tiger Cloud. Migration from RDS/Aurora Postgres moves the data only. You must manually enable Tiger Cloud features like [hypertables][about-hypertables], [data compression][data-compression] or [data retention][data-retention] after the migration is complete. You enable Tiger Cloud features while your database is offline. This section shows you how to move your data from a Postgres database running in an Amazon RDS/Aurora Postgres instance to a Tiger Cloud service using `pg_dump` and `psql` from Terminal. ## Create an intermediary EC2 Ubuntu instance 1. In [https://console.aws.amazon.com/rds/home#databases:][databases], select the RDS/Aurora Postgres instance to migrate. 1. Click `Actions` > `Set up EC2 connection`. Press `Create EC2 instance` and use the following settings: - **AMI**: Ubuntu Server. - **Key pair**: use an existing pair or create a new one that you will use to access the intermediary machine. - **VPC**: by default, this is the same as the database instance. - **Configure Storage**: adjust the volume to at least the size of RDS/Aurora Postgres instance you are migrating from. You can reduce the space used by your data on Tiger Cloud using [Hypercore][hypercore]. 1. Click `Lauch instance`. AWS creates your EC2 instance, then click `Connect to instance` > `SSH client`. Follow the instructions to create the connection to your intermediary EC2 instance. ## Install the psql client tools on the intermediary instance 1. Connect to your intermediary EC2 instance. For example:sh ssh -i ".pem" ubuntu@
1. On your intermediary EC2 instance, install the Postgres client.sh sudo sh -c 'echo "deb http://apt.postgresql.org/pub/repos/apt $(lsb_release -cs)-pgdg main" > /etc/apt/sources.list.d/pgdg.list' wget -qO- https://www.postgresql.org/media/keys/ACCC4CF8.asc | sudo tee /etc/apt/trusted.gpg.d/pgdg.asc &>/dev/null sudo apt update sudo apt install postgresql-client-16 -y # "postgresql-client-16" if your source DB is using PG 16. psql --version && pg_dump --version
Keep this terminal open, you need it to connect to the RDS/Aurora Postgres instance for migration. ## Set up secure connectivity between your RDS/Aurora Postgres and EC2 instances 1. In [https://console.aws.amazon.com/rds/home#databases:][databases], select the RDS/Aurora Postgres instance to migrate. 1. Scroll down to `Security group rules (1)` and select the `EC2 Security Group - Inbound` group. The `Security Groups (1)` window opens. Click the `Security group ID`, then click `Edit inbound rules` <img class="main-content__illustration" src="https://assets.timescale.com/docs/images/migrate/rds-add-security-rule-to-ec2-instance.svg" alt="Create security group rule to enable RDS/Aurora Postgres EC2 connection"/> 1. On your intermediary EC2 instance, get your local IP address:sh ec2metadata --local-ipv4
Bear with me on this one, you need this IP address to enable access to your RDS/Aurora Postgres instance. 1. In `Edit inbound rules`, click `Add rule`, then create a `PostgreSQL`, `TCP` rule granting access to the local IP address for your EC2 instance (told you :-)). Then click `Save rules`. <img class="main-content__illustration" src="https://assets.timescale.com/docs/images/migrate/rds-add-inbound-rule-for-ec2-instance.png" alt="Create security rule to enable RDS/Aurora Postgres EC2 connection"/> ## Test the connection between your RDS/Aurora Postgres and EC2 instances 1. In [https://console.aws.amazon.com/rds/home#databases:][databases], select the RDS/Aurora Postgres instance to migrate. 1. On your intermediary EC2 instance, use the values of `Endpoint`, `Port`, `Master username`, and `DB name` to create the postgres connectivity string to the `SOURCE` variable. <img class="main-content__illustration" src="https://assets.timescale.com/docs/images/migrate/migrate-source-rds-instance.svg" alt="Record endpoint, port, VPC details"/>sh export SOURCE="postgres://:@:/"
The value of `Master password` was supplied when this RDS/Aurora Postgres instance was created. 1. Test your connection:sh psql -d source
You are connected to your RDS/Aurora Postgres instance from your intermediary EC2 instance. ## Migrate your data to your Tiger Cloud service To securely migrate data from your RDS instance: ## Prepare to migrate 1. **Take the applications that connect to the RDS instance offline** The duration of the migration is proportional to the amount of data stored in your database. By disconnection your app from your database you avoid and possible data loss. You should also ensure that your source RDS instance is not receiving any DML queries. 1. **Connect to your intermediary EC2 instance** For example:sh ssh -i ".pem" ubuntu@
1. **Set your connection strings** These variables hold the connection information for the RDS instance and target Tiger Cloud service:bash export SOURCE="postgres://:@:/" export TARGET=postgres://tsdbadmin:@:/tsdb?sslmode=require
You find the connection information for `SOURCE` in your RDS configuration. For `TARGET` in the configuration file you downloaded when you created the Tiger Cloud service. ## Align the extensions on the source and target 1. Ensure that the Tiger Cloud service is running the Postgres extensions used in your source database. 1. Check the extensions on the source database: ```bash psql source -c "SELECT * FROM pg_extension;" ``` 1. For each extension, enable it on your target Tiger Cloud service: ```bash psql target -c "CREATE EXTENSION IF NOT EXISTS <extension name> CASCADE;" ``` ## Migrate roles from RDS to your Tiger Cloud service Roles manage database access permissions. To migrate your role-based security hierarchy to your Tiger Cloud service: 1. **Dump the roles from your RDS instance** Export your role-based security hierarchy. If you only use the default `postgres` role, this step is not necessary.bash pg_dumpall -d "source"
--quote-all-identifiers \ --roles-only \ --no-role-passwords \ --file=roles.sqlAWS RDS does not allow you to export passwords with roles. You assign passwords to these roles when you have uploaded them to your Tiger Cloud service. 1. **Remove roles with superuser access** Tiger Cloud services do not support roles with superuser access. Run the following script to remove statements, permissions and clauses that require superuser permissions from `roles.sql`:bash sed -i -E \ -e '/CREATE ROLE "postgres";/d' \ -e '/ALTER ROLE "postgres"/d' \ -e '/CREATE ROLE "rds/d' \ -e '/ALTER ROLE "rds/d' \ -e '/TO "rds/d' \ -e '/GRANT "rds/d' \ -e 's/(NO)*SUPERUSER//g' \ -e 's/(NO)*REPLICATION//g' \ -e 's/(NO)BYPASSRLS//g' \ -e 's/GRANTED BY "[^"]"//g' \ roles.sql
1. **Upload the roles to your Tiger Cloud service**bash psql -X -d "target"
-v ON_ERROR_STOP=1 \ --echo-errors \ -f roles.sql1. **Manually assign passwords to the roles** AWS RDS did not allow you to export passwords with roles. For each role, use the following command to manually assign a password to a role:bash
psql target -c "ALTER ROLE <role name> WITH PASSWORD '<highly secure password>';" ```Migrate data from your RDS instance to your Tiger Cloud service
- Dump the data from your RDS instance to your intermediary EC2 instance
The
pg_dumpflags remove superuser access and tablespaces from your data. When you runpgdump, check the run time, a long-runningpg_dumpcan cause issues.pg_dump -d "source" \ --format=plain \ --quote-all-identifiers \ --no-tablespaces \ --no-owner \ --no-privileges \ --file=dump.sqlTo dramatically reduce the time taken to dump the RDS instance, using multiple connections. For more information, see dumping with concurrency and restoring with concurrency.
Upload your data to your Tiger Cloud service
psql -d target -v ON_ERROR_STOP=1 --echo-errors \ -f dump.sql
Validate your Tiger Cloud service and restart your app
Update the table statistics.
psql target -c "ANALYZE;"Verify the data in the target Tiger Cloud service.
Check that your data is correct, and returns the results that you expect,
- Enable any Tiger Cloud features you want to use.
Migration from Postgres moves the data only. Now manually enable Tiger Cloud features like hypertables, hypercore or data retention while your database is offline.
- Reconfigure your app to use the target database, then restart it.
And that is it, you have migrated your data from an RDS/Aurora Postgres instance to a Tiger Cloud service.
This section shows you how to move your data from a Managed Service for TimescaleDB instance to a Tiger Cloud service using
pg_dumpandpsqlfrom Terminal.Prepare to migrate
- Take the applications that connect to the source database offline
The duration of the migration is proportional to the amount of data stored in your database. By disconnection your app from your database you avoid and possible data loss.
- Set your connection strings
These variables hold the connection information for the source database and target Tiger Cloud service:
export SOURCE="postgres://<user>:<password>@<source host>:<source port>/<db_name>" export TARGET="postgres://tsdbadmin:<PASSWORD>@<HOST>:<PORT>/tsdb?sslmode=require"You find the connection information for your Tiger Cloud service in the configuration file you downloaded when you created the service.
Align the version of TimescaleDB on the source and target
Ensure that the source and target databases are running the same version of TimescaleDB.
Check the version of TimescaleDB running on your Tiger Cloud service:
psql target -c "SELECT extversion FROM pg_extension WHERE extname = 'timescaledb';"Update the TimescaleDB extension in your source database to match the target service:
If the TimescaleDB extension is the same version on the source database and target service, you do not need to do this.
psql source -c "ALTER EXTENSION timescaledb UPDATE TO '<version here>';"For more information and guidance, see Upgrade TimescaleDB.
Ensure that the Tiger Cloud service is running the Postgres extensions used in your source database.
Check the extensions on the source database:
psql source -c "SELECT * FROM pg_extension;"For each extension, enable it on your target Tiger Cloud service:
psql target -c "CREATE EXTENSION IF NOT EXISTS <extension name> CASCADE;"
Migrate the roles from TimescaleDB to your Tiger Cloud service
Roles manage database access permissions. To migrate your role-based security hierarchy to your Tiger Cloud service:
- Dump the roles from your source database
Export your role-based security hierarchy.
<db_name>has the same value as<db_name>insource. I know, it confuses me as well.pg_dumpall -d "source" \ -l <db_name> \ --quote-all-identifiers \ --roles-only \ --no-role-passwords \ --file=roles.sqlMST does not allow you to export passwords with roles. You assign passwords to these roles when you have uploaded them to your Tiger Cloud service.
- Remove roles with superuser access
Tiger Cloud services do not support roles with superuser access. Run the following script to remove statements, permissions and clauses that require superuser permissions from
roles.sql:sed -i -E \ -e '/DROP ROLE IF EXISTS "postgres";/d' \ -e '/DROP ROLE IF EXISTS "tsdbadmin";/d' \ -e '/CREATE ROLE "postgres";/d' \ -e '/ALTER ROLE "postgres"/d' \ -e '/CREATE ROLE "rds/d' \ -e '/ALTER ROLE "rds/d' \ -e '/TO "rds/d' \ -e '/GRANT "rds/d' \ -e '/GRANT "pg_read_all_stats" TO "tsdbadmin"/d' \ -e 's/(NO)*SUPERUSER//g' \ -e 's/(NO)*REPLICATION//g' \ -e 's/(NO)*BYPASSRLS//g' \ -e 's/GRANTED BY "[^"]*"//g' \ -e '/CREATE ROLE "tsdbadmin";/d' \ -e '/ALTER ROLE "tsdbadmin"/d' \ -e 's/WITH ADMIN OPTION,/WITH /g' \ -e 's/WITH ADMIN OPTION//g' \ -e 's/GRANTED BY ".*"//g' \ -e '/GRANT "pg_.*" TO/d' \ -e '/CREATE ROLE "_aiven";/d' \ -e '/ALTER ROLE "_aiven"/d' \ -e '/GRANT SET ON PARAMETER "pgaudit\.[^"]+" TO "_tsdbadmin_auditing"/d' \ -e '/GRANT SET ON PARAMETER "anon\.[^"]+" TO "tsdbadmin_group"/d' \ roles.sql- Dump the source database schema and data
The
pg_dumpflags remove superuser access and tablespaces from your data. When you runpgdump, check the run time, a long-runningpg_dumpcan cause issues.pg_dump -d "source" \ --format=plain \ --quote-all-identifiers \ --no-tablespaces \ --no-owner \ --no-privileges \ --file=dump.sqlTo dramatically reduce the time taken to dump the source database, using multiple connections. For more information, see dumping with concurrency and restoring with concurrency.
Upload your data to the target Tiger Cloud service
This command uses the timescaledb_pre_restore and timescaledb_post_restore functions to put your database in the correct state.
Upload your data
psql target -v ON_ERROR_STOP=1 --echo-errors \ -f roles.sql \ -c "SELECT timescaledb_pre_restore();" \ -f dump.sql \ -c "SELECT timescaledb_post_restore();"Manually assign passwords to the roles
MST did not allow you to export passwords with roles. For each role, use the following command to manually assign a password to a role:
psql target -c "ALTER ROLE <role name> WITH PASSWORD '<highly secure password>';" ``` ## Validate your Tiger Cloud service and restart your app 1. Update the table statistics. ```bash psql target -c "ANALYZE;" ``` 1. Verify the data in the target Tiger Cloud service. Check that your data is correct, and returns the results that you expect, 1. Enable any Tiger Cloud features you want to use. Migration from Postgres moves the data only. Now manually enable Tiger Cloud features like [hypertables][about-hypertables], [hypercore][data-compression] or [data retention][data-retention] while your database is offline. 1. Reconfigure your app to use the target database, then restart it. And that is it, you have migrated your data from a Managed Service for TimescaleDB instance to a Tiger Cloud service. ===== PAGE: https://docs.tigerdata.com/migrate/live-migration/ ===== # Live migration Live migration is an end-to-end solution that copies the database schema and data to your target Tiger Cloud service, then replicates the database activity in your source database to the target service in real time. Live migration uses the Postgres logical decoding functionality and leverages [pgcopydb]. You use the live migration Docker image to move 100GB-10TB+ of data to a Tiger Cloud service seamlessly with only a few minutes downtime. If you want to migrate more than 400GB of data, create a [Tiger Cloud Console support request](https://console.cloud.timescale.com/dashboard/support), or send us an email at [support@tigerdata.com](mailto:support@tigerdata.com) saying how much data you want to migrate. We pre-provision your Tiger Cloud service for you. Best practice is to use live migration when: - Modifying your application logic to perform dual writes is a significant effort. - The insert workload does not exceed 20,000 rows per second, and inserts are batched. Use [Dual write and backfill][dual-write-and-backfill] for greater workloads. - Your source database: - Uses `UPDATE` and `DELETE` statements on uncompressed time-series data. Live-migration does not support replicating `INSERT`/`UPDATE`/`DELETE` statements on compressed data. - Has large, busy tables with primary keys. - Does not have many `UPDATE` or `DELETE` statements. This page shows you how to move your data from a self-hosted database to a Tiger Cloud service using the live-migration Docker image. ## Prerequisites Best practice is to use an [Ubuntu EC2 instance][create-ec2-instance] hosted in the same region as your Tiger Cloud service to move data. That is, the machine you run the commands on to move your data from your source database to your target Tiger Cloud service. Before you move your data: - Create a target [Tiger Cloud service][created-a-database-service-in-timescale]. Each Tiger Cloud service has a single Postgres instance that supports the [most popular extensions][all-available-extensions]. Tiger Cloud services do not support tablespaces, and there is no superuser associated with a service. Best practice is to create a Tiger Cloud service with at least 8 CPUs for a smoother experience. A higher-spec instance can significantly reduce the overall migration window. - To ensure that maintenance does not run while migration is in progress, best practice is to [adjust the maintenance window][adjust-maintenance-window]. - [Install Docker][install-docker] on your migration machine. This machine needs sufficient space to store the buffered changes that occur while your data is being copied. This space is proportional to the amount of new uncompressed data being written to the Tiger Cloud service during migration. A general rule of thumb is between 100GB and 500GB. The CPU specifications of this EC2 instance should match those of your Tiger Cloud service for optimal performance. For example, if your service has an 8-CPU configuration, then your EC2 instance should also have 8 CPUs. - Before starting live migration, read the [Frequently Asked Questions][FAQ]. ### Migrate to Tiger Cloud To move your data from a self-hosted database to a Tiger Cloud service: This section shows you how to move your data from self-hosted TimescaleDB to a Tiger Cloud service using live migration from Terminal. ## Set your connection strings These variables hold the connection information for the source database and target Tiger Cloud service. In Terminal on your migration machine, set the following:bash export SOURCE="postgres://:@:/" export TARGET="postgres://tsdbadmin:@:/tsdb?sslmode=require"
You find the connection information for your Tiger Cloud service in the configuration file you downloaded when you created the service. Avoid using connection strings that route through connection poolers like PgBouncer or similar tools. This tool requires a direct connection to the database to function properly. ## Align the version of TimescaleDB on the source and target 1. Ensure that the source and target databases are running the same version of TimescaleDB. 1. Check the version of TimescaleDB running on your Tiger Cloud service: ```bash psql target -c "SELECT extversion FROM pg_extension WHERE extname = 'timescaledb';" ``` 1. Update the TimescaleDB extension in your source database to match the target service: If the TimescaleDB extension is the same version on the source database and target service, you do not need to do this. ```bash psql source -c "ALTER EXTENSION timescaledb UPDATE TO '<version here>';" ``` For more information and guidance, see [Upgrade TimescaleDB](https://docs.tigerdata.com/self-hosted/latest/upgrades/). 1. Ensure that the Tiger Cloud service is running the Postgres extensions used in your source database. 1. Check the extensions on the source database: ```bash psql source -c "SELECT * FROM pg_extension;" ``` 1. For each extension, enable it on your target Tiger Cloud service: ```bash psql target -c "CREATE EXTENSION IF NOT EXISTS <extension name> CASCADE;" ``` ## Tune your source database You need admin rights to to update the configuration on your source database. If you are using a managed service, follow the instructions in the `From MST` tab on this page. 1. **Install the `wal2json` extension on your source database** [Install wal2json][install-wal2json] on your source database. 1. **Prevent Postgres from treating the data in a snapshot as outdated**shell psql -X -d source -c 'alter system set old_snapshot_threshold=-1'
This is not applicable if the source database is Postgres 17 or later. 1. **Set the write-Ahead Log (WAL) to record the information needed for logical decoding**shell psql -X -d source -c 'alter system set wal_level=logical'
1. **Restart the source database** Your configuration changes are now active. However, verify that the settings are live in your database. 1. **Enable live-migration to replicate `DELETE` and`UPDATE` operations** Replica identity assists data replication by identifying the rows being modified. Your options are that each table and hypertable in the source database should either have: - **A primary key**: data replication defaults to the primary key of the table being replicated. Nothing to do. - **A viable unique index**: each table has a unique, non-partial, non-deferrable index that includes only columns marked as `NOT NULL`. If a UNIQUE index does not exist, create one to assist the migration. You can delete if after migration. For each table, set `REPLICA IDENTITY` to the viable unique index:shell psql -X -d source -c 'ALTER TABLE REPLICA IDENTITY USING INDEX <_index_name>'
- **No primary key or viable unique index**: use brute force. For each table, set `REPLICA IDENTITY` to `FULL`:shell psql -X -d source -c 'ALTER TABLE {table_name} REPLICA IDENTITY FULL'
For each `UPDATE` or `DELETE` statement, Postgres reads the whole table to find all matching rows. This results in significantly slower replication. If you are expecting a large number of `UPDATE` or `DELETE` operations on the table, best practice is to not use `FULL`. ## Migrate your data, then start downtime 2. **Pull the live-migration docker image to you migration machine**shell sudo docker pull timescale/live-migration:latest
To list the available commands, run:shell sudo docker run --rm -it -e PGCOPYDB_SOURCE_PGURI=source timescale/live-migration:latest --help
To see the available flags for each command, run `--help` for that command. For example:shell sudo docker run --rm -it -e PGCOPYDB_SOURCE_PGURI=source timescale/live-migration:latest migrate --help
1. **Create a snapshot image of your source database in your Tiger Cloud service** This process checks that you have tuned your source database and target service correctly for replication, then creates a snapshot of your data on the migration machine:shell docker run --rm -it --name live-migration-snapshot
-e PGCOPYDB_SOURCE_PGURI=source \ -e PGCOPYDB_TARGET_PGURI=target \ --pid=host \ -v ~/live-migration:/opt/timescale/ts_cdc \ timescale/live-migration:latest snapshotLive-migration supplies information about updates you need to make to the source database and target service. For example:shell 2024-03-25T12:40:40.884 WARNING: The following tables in the Source DB have neither a primary key nor a REPLICA IDENTITY (FULL/INDEX) 2024-03-25T12:40:40.884 WARNING: UPDATE and DELETE statements on these tables will not be replicated to the Target DB 2024-03-25T12:40:40.884 WARNING: - public.metrics
If you have warnings, stop live-migration, make the suggested changes and start again. 1. **Synchronize data between your source database and your Tiger Cloud service** This command migrates data from the snapshot to your Tiger Cloud service, then streams transactions from the source to the target.shell docker run --rm -it --name live-migration-migrate
-e PGCOPYDB_SOURCE_PGURI=source \ -e PGCOPYDB_TARGET_PGURI=target \ --pid=host \ -v ~/live-migration:/opt/timescale/ts_cdc \ timescale/live-migration:latest migrateIf the source Postgres version is 17 or later, you need to pass additional flag `-e PGVERSION=17` to the `migrate` command. During this process, you see the migration process:shell Live-replay will complete in 1 minute 38.631 seconds (source_wal_rate: 106.0B/s, target_replay_rate: 589.0KiB/s, replay_lag: 56MiB)
If `migrate` stops add `--resume` to start from where it left off. Once the data in your target Tiger Cloud service has almost caught up with the source database, you see the following message:shell Target has caught up with source (source_wal_rate: 751.0B/s, target_replay_rate: 0B/s, replay_lag: 7KiB)
To stop replication, hit 'c' and then ENTERWait until `replay_lag` is down to a few kilobytes before you move to the next step. Otherwise, data replication may not have finished. 1. **Start app downtime** 1. Stop your app writing to the source database, then let the the remaining transactions finish to fully sync with the target. You can use tools like the `pg_top` CLI or `pg_stat_activity` to view the current transaction on the source database. 1. Stop Live-migration. ```shell hit 'c' and then ENTER ``` Live-migration continues the remaining work. This includes copying TimescaleDB metadata, sequences, and run policies. When the migration completes, you see the following message: ```sh Migration successfully completed ``` ## Validate your data, then restart your app 1. **Validate the migrated data** The contents of both databases should be the same. To check this you could compare the number of rows, or an aggregate of columns. However, the best validation method depends on your app. 1. **Stop app downtime** Once you are confident that your data is successfully replicated, configure your apps to use your Tiger Cloud service. 1. **Cleanup resources associated with live-migration from your migration machine** This command removes all resources and temporary files used in the migration process. When you run this command, you can no longer resume live-migration.shell docker run --rm -it --name live-migration-clean
-e PGCOPYDB_SOURCE_PGURI=source \ -e PGCOPYDB_TARGET_PGURI=target \ --pid=host \ -v ~/live-migration:/opt/timescale/ts_cdc \ timescale/live-migration:latest clean --pruneThis section shows you how to move your data from self-hosted Postgres to a Tiger Cloud service using live migration from Terminal. ## Set your connection strings These variables hold the connection information for the source database and target Tiger Cloud service. In Terminal on your migration machine, set the following:bash export SOURCE="postgres://:@:/" export TARGET="postgres://tsdbadmin:@:/tsdb?sslmode=require"
You find the connection information for your Tiger Cloud service in the configuration file you downloaded when you created the service. Avoid using connection strings that route through connection poolers like PgBouncer or similar tools. This tool requires a direct connection to the database to function properly. ## Align the extensions on the source and target 1. Ensure that the Tiger Cloud service is running the Postgres extensions used in your source database. 1. Check the extensions on the source database: ```bash psql source -c "SELECT * FROM pg_extension;" ``` 1. For each extension, enable it on your target Tiger Cloud service: ```bash psql target -c "CREATE EXTENSION IF NOT EXISTS <extension name> CASCADE;" ``` ## Tune your source database You need admin rights to to update the configuration on your source database. If you are using a managed service, follow the instructions in the `From AWS RDS/Aurora` tab on this page. 1. **Install the `wal2json` extension on your source database** [Install wal2json][install-wal2json] on your source database. 1. **Prevent Postgres from treating the data in a snapshot as outdated**shell psql -X -d source -c 'alter system set old_snapshot_threshold=-1'
This is not applicable if the source database is Postgres 17 or later. 1. **Set the write-Ahead Log (WAL) to record the information needed for logical decoding**shell psql -X -d source -c 'alter system set wal_level=logical'
1. **Restart the source database** Your configuration changes are now active. However, verify that the settings are live in your database. 1. **Enable live-migration to replicate `DELETE` and`UPDATE` operations** Replica identity assists data replication by identifying the rows being modified. Your options are that each table and hypertable in the source database should either have: - **A primary key**: data replication defaults to the primary key of the table being replicated. Nothing to do. - **A viable unique index**: each table has a unique, non-partial, non-deferrable index that includes only columns marked as `NOT NULL`. If a UNIQUE index does not exist, create one to assist the migration. You can delete if after migration. For each table, set `REPLICA IDENTITY` to the viable unique index:shell psql -X -d source -c 'ALTER TABLE REPLICA IDENTITY USING INDEX <_index_name>'
- **No primary key or viable unique index**: use brute force. For each table, set `REPLICA IDENTITY` to `FULL`:shell psql -X -d source -c 'ALTER TABLE {table_name} REPLICA IDENTITY FULL'
For each `UPDATE` or `DELETE` statement, Postgres reads the whole table to find all matching rows. This results in significantly slower replication. If you are expecting a large number of `UPDATE` or `DELETE` operations on the table, best practice is to not use `FULL`. ## Migrate your data, then start downtime 1. **Pull the live-migration docker image to you migration machine**shell sudo docker pull timescale/live-migration:latest
To list the available commands, run:shell sudo docker run --rm -it -e PGCOPYDB_SOURCE_PGURI=source timescale/live-migration:latest --help
To see the available flags for each command, run `--help` for that command. For example:shell sudo docker run --rm -it -e PGCOPYDB_SOURCE_PGURI=source timescale/live-migration:latest migrate --help
1. **Create a snapshot image of your source database in your Tiger Cloud service** This process checks that you have tuned your source database and target service correctly for replication, then creates a snapshot of your data on the migration machine:shell docker run --rm -it --name live-migration-snapshot
-e PGCOPYDB_SOURCE_PGURI=source \ -e PGCOPYDB_TARGET_PGURI=target \ --pid=host \ -v ~/live-migration:/opt/timescale/ts_cdc \ timescale/live-migration:latest snapshotLive-migration supplies information about updates you need to make to the source database and target service. For example:shell 2024-03-25T12:40:40.884 WARNING: The following tables in the Source DB have neither a primary key nor a REPLICA IDENTITY (FULL/INDEX) 2024-03-25T12:40:40.884 WARNING: UPDATE and DELETE statements on these tables will not be replicated to the Target DB 2024-03-25T12:40:40.884 WARNING: - public.metrics
If you have warnings, stop live-migration, make the suggested changes and start again. 1. **Synchronize data between your source database and your Tiger Cloud service** This command migrates data from the snapshot to your Tiger Cloud service, then streams transactions from the source to the target.shell docker run --rm -it --name live-migration-migrate
-e PGCOPYDB_SOURCE_PGURI=source \ -e PGCOPYDB_TARGET_PGURI=target \ --pid=host \ -v ~/live-migration:/opt/timescale/ts_cdc \ timescale/live-migration:latest migrateIf the source Postgres version is 17 or later, you need to pass additional flag `-e PGVERSION=17` to the `migrate` command. After migrating the schema, live-migration prompts you to create hypertables for tables that contain time-series data in your Tiger Cloud service. Run `create_hypertable()` to convert these table. For more information, see the [Hypertable docs][Hypertable docs]. During this process, you see the migration process:shell Live-replay will complete in 1 minute 38.631 seconds (source_wal_rate: 106.0B/s, target_replay_rate: 589.0KiB/s, replay_lag: 56MiB)
If `migrate` stops add `--resume` to start from where it left off. Once the data in your target Tiger Cloud service has almost caught up with the source database, you see the following message:shell Target has caught up with source (source_wal_rate: 751.0B/s, target_replay_rate: 0B/s, replay_lag: 7KiB)
To stop replication, hit 'c' and then ENTERWait until `replay_lag` is down to a few kilobytes before you move to the next step. Otherwise, data replication may not have finished. 1. **Start app downtime** 1. Stop your app writing to the source database, then let the the remaining transactions finish to fully sync with the target. You can use tools like the `pg_top` CLI or `pg_stat_activity` to view the current transaction on the source database. 1. Stop Live-migration. ```shell hit 'c' and then ENTER ``` Live-migration continues the remaining work. This includes copying TimescaleDB metadata, sequences, and run policies. When the migration completes, you see the following message: ```sh Migration successfully completed ``` ## Validate your data, then restart your app 1. **Validate the migrated data** The contents of both databases should be the same. To check this you could compare the number of rows, or an aggregate of columns. However, the best validation method depends on your app. 1. **Stop app downtime** Once you are confident that your data is successfully replicated, configure your apps to use your Tiger Cloud service. 1. **Cleanup resources associated with live-migration from your migration machine** This command removes all resources and temporary files used in the migration process. When you run this command, you can no longer resume live-migration.shell docker run --rm -it --name live-migration-clean
-e PGCOPYDB_SOURCE_PGURI=source \ -e PGCOPYDB_TARGET_PGURI=target \ --pid=host \ -v ~/live-migration:/opt/timescale/ts_cdc \ timescale/live-migration:latest clean --pruneTo migrate your data from an Amazon RDS/Aurora Postgres instance to a Tiger Cloud service, you extract the data to an intermediary EC2 Ubuntu instance in the same AWS region as your RDS/Aurora instance. You then upload your data to a Tiger Cloud service. To make this process as painless as possible, ensure that the intermediary machine has enough CPU and disk space to rapidly extract and store your data before uploading to Tiger Cloud. Migration from RDS/Aurora gives you the opportunity to create [hypertables][about-hypertables] before copying the data. Once the migration is complete, you can manually enable Tiger Cloud features like [data compression][data-compression] or [data retention][data-retention]. This section shows you how to move your data from an Amazon RDS/Aurora instance to a Tiger Cloud service using live migration. ## Create an intermediary EC2 Ubuntu instance 1. In [https://console.aws.amazon.com/rds/home#databases:][databases], select the RDS/Aurora Postgres instance to migrate. 1. Click `Actions` > `Set up EC2 connection`. Press `Create EC2 instance` and use the following settings: - **AMI**: Ubuntu Server. - **Key pair**: use an existing pair or create a new one that you will use to access the intermediary machine. - **VPC**: by default, this is the same as the database instance. - **Configure Storage**: adjust the volume to at least the size of RDS/Aurora Postgres instance you are migrating from. You can reduce the space used by your data on Tiger Cloud using [Hypercore][hypercore]. 1. Click `Lauch instance`. AWS creates your EC2 instance, then click `Connect to instance` > `SSH client`. Follow the instructions to create the connection to your intermediary EC2 instance. ## Install the psql client tools on the intermediary instance 1. Connect to your intermediary EC2 instance. For example:sh ssh -i ".pem" ubuntu@
1. On your intermediary EC2 instance, install the Postgres client.sh sudo sh -c 'echo "deb http://apt.postgresql.org/pub/repos/apt $(lsb_release -cs)-pgdg main" > /etc/apt/sources.list.d/pgdg.list' wget -qO- https://www.postgresql.org/media/keys/ACCC4CF8.asc | sudo tee /etc/apt/trusted.gpg.d/pgdg.asc &>/dev/null sudo apt update sudo apt install postgresql-client-16 -y # "postgresql-client-16" if your source DB is using PG 16. psql --version && pg_dump --version
Keep this terminal open, you need it to connect to the RDS/Aurora Postgres instance for migration. ## Set up secure connectivity between your RDS/Aurora Postgres and EC2 instances 1. In [https://console.aws.amazon.com/rds/home#databases:][databases], select the RDS/Aurora Postgres instance to migrate. 1. Scroll down to `Security group rules (1)` and select the `EC2 Security Group - Inbound` group. The `Security Groups (1)` window opens. Click the `Security group ID`, then click `Edit inbound rules` <img class="main-content__illustration" src="https://assets.timescale.com/docs/images/migrate/rds-add-security-rule-to-ec2-instance.svg" alt="Create security group rule to enable RDS/Aurora Postgres EC2 connection"/> 1. On your intermediary EC2 instance, get your local IP address:sh ec2metadata --local-ipv4
Bear with me on this one, you need this IP address to enable access to your RDS/Aurora Postgres instance. 1. In `Edit inbound rules`, click `Add rule`, then create a `PostgreSQL`, `TCP` rule granting access to the local IP address for your EC2 instance (told you :-)). Then click `Save rules`. <img class="main-content__illustration" src="https://assets.timescale.com/docs/images/migrate/rds-add-inbound-rule-for-ec2-instance.png" alt="Create security rule to enable RDS/Aurora Postgres EC2 connection"/> ## Test the connection between your RDS/Aurora Postgres and EC2 instances 1. In [https://console.aws.amazon.com/rds/home#databases:][databases], select the RDS/Aurora Postgres instance to migrate. 1. On your intermediary EC2 instance, use the values of `Endpoint`, `Port`, `Master username`, and `DB name` to create the postgres connectivity string to the `SOURCE` variable. <img class="main-content__illustration" src="https://assets.timescale.com/docs/images/migrate/migrate-source-rds-instance.svg" alt="Record endpoint, port, VPC details"/>sh export SOURCE="postgres://:@:/"
The value of `Master password` was supplied when this RDS/Aurora Postgres instance was created. 1. Test your connection:sh psql -d source
You are connected to your RDS/Aurora Postgres instance from your intermediary EC2 instance. ## Set your connection strings These variables hold the connection information for the source database and target Tiger Cloud service. In Terminal on your migration machine, set the following:bash export SOURCE="postgres://:@:/" export TARGET="postgres://tsdbadmin:@:/tsdb?sslmode=require"
You find the connection information for your Tiger Cloud service in the configuration file you downloaded when you created the service. Avoid using connection strings that route through connection poolers like PgBouncer or similar tools. This tool requires a direct connection to the database to function properly. ## Align the extensions on the source and target 1. Ensure that the Tiger Cloud service is running the Postgres extensions used in your source database. 1. Check the extensions on the source database: ```bash psql source -c "SELECT * FROM pg_extension;" ``` 1. For each extension, enable it on your target Tiger Cloud service: ```bash psql target -c "CREATE EXTENSION IF NOT EXISTS <extension name> CASCADE;" ``` ## Tune your source database Updating parameters on a Postgres instance will cause an outage. Choose a time that will cause the least issues to tune this database. 1. **Update the DB instance parameter group for your source database** 1. In [https://console.aws.amazon.com/rds/home#databases:][databases], select the RDS instance to migrate. 1. Click `Configuration`, scroll down and note the `DB instance parameter group`, then click `Parameter groups` <img class="main-content__illustration" src="https://assets.timescale.com/docs/images/migrate/awsrds-parameter-groups.png" alt="Create security rule to enable RDS EC2 connection"/> 1. Click `Create parameter group`, fill in the form with the following values, then click `Create`. - **Parameter group name** - whatever suits your fancy. - **Description** - knock yourself out with this one. - **Engine type** - `PostgreSQL` - **Parameter group family** - the same as `DB instance parameter group` in your `Configuration`. 1. In `Parameter groups`, select the parameter group you created, then click `Edit`. 1. Update the following parameters, then click `Save changes`. - `rds.logical_replication` set to `1`: record the information needed for logical decoding. - `wal_sender_timeout` set to `0`: disable the timeout for the sender process. 1. In RDS, navigate back to your [databases][databases], select the RDS instance to migrate, and click `Modify`. 1. Scroll down to `Database options`, select your new parameter group, and click `Continue`. 1. Click `Apply immediately` or choose a maintenance window, then click `Modify DB instance`. Changing parameters will cause an outage. Wait for the database instance to reboot before continuing. 1. Verify that the settings are live in your database. 1. **Enable replication `DELETE` and`UPDATE` operations** Replica identity assists data replication by identifying the rows being modified. Your options are that each table and hypertable in the source database should either have: - **A primary key**: data replication defaults to the primary key of the table being replicated. Nothing to do. - **A viable unique index**: each table has a unique, non-partial, non-deferrable index that includes only columns marked as `NOT NULL`. If a UNIQUE index does not exist, create one to assist the migration. You can delete if after migration. For each table, set `REPLICA IDENTITY` to the viable unique index:shell psql -X -d source -c 'ALTER TABLE REPLICA IDENTITY USING INDEX <_index_name>'
- **No primary key or viable unique index**: use brute force. For each table, set `REPLICA IDENTITY` to `FULL`:shell psql -X -d source -c 'ALTER TABLE {table_name} REPLICA IDENTITY FULL'
For each `UPDATE` or `DELETE` statement, Postgres reads the whole table to find all matching rows. This results in significantly slower replication. If you are expecting a large number of `UPDATE` or `DELETE` operations on the table, best practice is to not use `FULL`. ## Migrate your data, then start downtime 1. **Pull the live-migration docker image to you migration machine**shell sudo docker pull timescale/live-migration:latest
To list the available commands, run:shell sudo docker run --rm -it -e PGCOPYDB_SOURCE_PGURI=source timescale/live-migration:latest --help
To see the available flags for each command, run `--help` for that command. For example:shell sudo docker run --rm -it -e PGCOPYDB_SOURCE_PGURI=source timescale/live-migration:latest migrate --help
1. **Create a snapshot image of your source database in your Tiger Cloud service** This process checks that you have tuned your source database and target service correctly for replication, then creates a snapshot of your data on the migration machine:shell docker run --rm -it --name live-migration-snapshot
-e PGCOPYDB_SOURCE_PGURI=source \ -e PGCOPYDB_TARGET_PGURI=target \ --pid=host \ -v ~/live-migration:/opt/timescale/ts_cdc \ timescale/live-migration:latest snapshotLive-migration supplies information about updates you need to make to the source database and target service. For example:shell 2024-03-25T12:40:40.884 WARNING: The following tables in the Source DB have neither a primary key nor a REPLICA IDENTITY (FULL/INDEX) 2024-03-25T12:40:40.884 WARNING: UPDATE and DELETE statements on these tables will not be replicated to the Target DB 2024-03-25T12:40:40.884 WARNING: - public.metrics
If you have warnings, stop live-migration, make the suggested changes and start again. 1. **Synchronize data between your source database and your Tiger Cloud service** This command migrates data from the snapshot to your Tiger Cloud service, then streams transactions from the source to the target.shell docker run --rm -it --name live-migration-migrate
-e PGCOPYDB_SOURCE_PGURI=source \ -e PGCOPYDB_TARGET_PGURI=target \ --pid=host \ -v ~/live-migration:/opt/timescale/ts_cdc \ timescale/live-migration:latest migrateIf the source Postgres version is 17 or later, you need to pass additional flag `-e PGVERSION=17` to the `migrate` command. After migrating the schema, live-migration prompts you to create hypertables for tables that contain time-series data in your Tiger Cloud service. Run `create_hypertable()` to convert these table. For more information, see the [Hypertable docs][Hypertable docs]. During this process, you see the migration process:shell Live-replay will complete in 1 minute 38.631 seconds (source_wal_rate: 106.0B/s, target_replay_rate: 589.0KiB/s, replay_lag: 56MiB)
If `migrate` stops add `--resume` to start from where it left off. Once the data in your target Tiger Cloud service has almost caught up with the source database, you see the following message:shell Target has caught up with source (source_wal_rate: 751.0B/s, target_replay_rate: 0B/s, replay_lag: 7KiB)
To stop replication, hit 'c' and then ENTERWait until `replay_lag` is down to a few kilobytes before you move to the next step. Otherwise, data replication may not have finished. 1. **Start app downtime** 1. Stop your app writing to the source database, then let the the remaining transactions finish to fully sync with the target. You can use tools like the `pg_top` CLI or `pg_stat_activity` to view the current transaction on the source database. 1. Stop Live-migration. ```shell hit 'c' and then ENTER ``` Live-migration continues the remaining work. This includes copying TimescaleDB metadata, sequences, and run policies. When the migration completes, you see the following message: ```sh Migration successfully completed ``` ## Validate your data, then restart your app 1. **Validate the migrated data** The contents of both databases should be the same. To check this you could compare the number of rows, or an aggregate of columns. However, the best validation method depends on your app. 1. **Stop app downtime** Once you are confident that your data is successfully replicated, configure your apps to use your Tiger Cloud service. 1. **Cleanup resources associated with live-migration from your migration machine** This command removes all resources and temporary files used in the migration process. When you run this command, you can no longer resume live-migration.shell docker run --rm -it --name live-migration-clean
-e PGCOPYDB_SOURCE_PGURI=source \ -e PGCOPYDB_TARGET_PGURI=target \ --pid=host \ -v ~/live-migration:/opt/timescale/ts_cdc \ timescale/live-migration:latest clean --pruneThis section shows you how to move your data from a MST instance to a Tiger Cloud service using live migration from Terminal. ## Set your connection strings These variables hold the connection information for the source database and target Tiger Cloud service. In Terminal on your migration machine, set the following:bash export SOURCE="postgres://:@:/" export TARGET="postgres://tsdbadmin:@:/tsdb?sslmode=require"
You find the connection information for your Tiger Cloud service in the configuration file you downloaded when you created the service. Avoid using connection strings that route through connection poolers like PgBouncer or similar tools. This tool requires a direct connection to the database to function properly. ## Align the version of TimescaleDB on the source and target 1. Ensure that the source and target databases are running the same version of TimescaleDB. 1. Check the version of TimescaleDB running on your Tiger Cloud service: ```bash psql target -c "SELECT extversion FROM pg_extension WHERE extname = 'timescaledb';" ``` 1. Update the TimescaleDB extension in your source database to match the target service: If the TimescaleDB extension is the same version on the source database and target service, you do not need to do this. ```bash psql source -c "ALTER EXTENSION timescaledb UPDATE TO '<version here>';" ``` For more information and guidance, see [Upgrade TimescaleDB](https://docs.tigerdata.com/self-hosted/latest/upgrades/). 1. Ensure that the Tiger Cloud service is running the Postgres extensions used in your source database. 1. Check the extensions on the source database: ```bash psql source -c "SELECT * FROM pg_extension;" ``` 1. For each extension, enable it on your target Tiger Cloud service: ```bash psql target -c "CREATE EXTENSION IF NOT EXISTS <extension name> CASCADE;" ``` ## Tune your source database 1. **Enable live-migration to replicate `DELETE` and`UPDATE` operations** Replica identity assists data replication by identifying the rows being modified. Your options are that each table and hypertable in the source database should either have: - **A primary key**: data replication defaults to the primary key of the table being replicated. Nothing to do. - **A viable unique index**: each table has a unique, non-partial, non-deferrable index that includes only columns marked as `NOT NULL`. If a UNIQUE index does not exist, create one to assist the migration. You can delete if after migration. For each table, set `REPLICA IDENTITY` to the viable unique index:shell psql -X -d source -c 'ALTER TABLE REPLICA IDENTITY USING INDEX <_index_name>'
- **No primary key or viable unique index**: use brute force. For each table, set `REPLICA IDENTITY` to `FULL`:shell psql -X -d source -c 'ALTER TABLE {table_name} REPLICA IDENTITY FULL'
For each `UPDATE` or `DELETE` statement, Postgres reads the whole table to find all matching rows. This results in significantly slower replication. If you are expecting a large number of `UPDATE` or `DELETE` operations on the table, best practice is to not use `FULL`. ## Migrate your data, then start downtime 2. **Pull the live-migration docker image to you migration machine**shell sudo docker pull timescale/live-migration:latest
To list the available commands, run:shell sudo docker run --rm -it -e PGCOPYDB_SOURCE_PGURI=source timescale/live-migration:latest --help
To see the available flags for each command, run `--help` for that command. For example:shell sudo docker run --rm -it -e PGCOPYDB_SOURCE_PGURI=source timescale/live-migration:latest migrate --help
1. **Create a snapshot image of your source database in your Tiger Cloud service** This process checks that you have tuned your source database and target service correctly for replication, then creates a snapshot of your data on the migration machine:shell docker run --rm -it --name live-migration-snapshot
-e PGCOPYDB_SOURCE_PGURI=source \ -e PGCOPYDB_TARGET_PGURI=target \ --pid=host \ -v ~/live-migration:/opt/timescale/ts_cdc \ timescale/live-migration:latest snapshotLive-migration supplies information about updates you need to make to the source database and target service. For example:shell 2024-03-25T12:40:40.884 WARNING: The following tables in the Source DB have neither a primary key nor a REPLICA IDENTITY (FULL/INDEX) 2024-03-25T12:40:40.884 WARNING: UPDATE and DELETE statements on these tables will not be replicated to the Target DB 2024-03-25T12:40:40.884 WARNING: - public.metrics
If you have warnings, stop live-migration, make the suggested changes and start again. 1. **Synchronize data between your source database and your Tiger Cloud service** This command migrates data from the snapshot to your Tiger Cloud service, then streams transactions from the source to the target.shell docker run --rm -it --name live-migration-migrate
-e PGCOPYDB_SOURCE_PGURI=source \ -e PGCOPYDB_TARGET_PGURI=target \ --pid=host \ -v ~/live-migration:/opt/timescale/ts_cdc \ timescale/live-migration:latest migrateIf the source Postgres version is 17 or later, you need to pass additional flag `-e PGVERSION=17` to the `migrate` command. During this process, you see the migration process:shell Live-replay will complete in 1 minute 38.631 seconds (source_wal_rate: 106.0B/s, target_replay_rate: 589.0KiB/s, replay_lag: 56MiB)
If `migrate` stops add `--resume` to start from where it left off. Once the data in your target Tiger Cloud service has almost caught up with the source database, you see the following message:shell Target has caught up with source (source_wal_rate: 751.0B/s, target_replay_rate: 0B/s, replay_lag: 7KiB)
To stop replication, hit 'c' and then ENTERWait until `replay_lag` is down to a few kilobytes before you move to the next step. Otherwise, data replication may not have finished. 1. **Start app downtime** 1. Stop your app writing to the source database, then let the the remaining transactions finish to fully sync with the target. You can use tools like the `pg_top` CLI or `pg_stat_activity` to view the current transaction on the source database. 1. Stop Live-migration. ```shell hit 'c' and then ENTER ``` Live-migration continues the remaining work. This includes copying TimescaleDB metadata, sequences, and run policies. When the migration completes, you see the following message: ```sh Migration successfully completed ``` ## Validate your data, then restart your app 1. **Validate the migrated data** The contents of both databases should be the same. To check this you could compare the number of rows, or an aggregate of columns. However, the best validation method depends on your app. 1. **Stop app downtime** Once you are confident that your data is successfully replicated, configure your apps to use your Tiger Cloud service. 1. **Cleanup resources associated with live-migration from your migration machine** This command removes all resources and temporary files used in the migration process. When you run this command, you can no longer resume live-migration.shell docker run --rm -it --name live-migration-clean
-e PGCOPYDB_SOURCE_PGURI=source \ -e PGCOPYDB_TARGET_PGURI=target \ --pid=host \ -v ~/live-migration:/opt/timescale/ts_cdc \ timescale/live-migration:latest clean --pruneAnd you are done, your data is now in your Tiger Cloud service. ## Troubleshooting This section shows you how to work around frequently seen issues when using live migration. ### ERROR: relation "xxx.yy" does not exist This may happen when a relation is removed after executing the `snapshot` command. A relation can be a table, index, view, or materialized view. When you see you this error: - Do not perform any explicit DDL operation on the source database during the course of migration. - If you are migrating from self-hosted TimescaleDB or MST, disable the chunk retention policy on your source database until you have finished migration. ### FATAL: remaining connection slots are reserved for non-replication superuser connections This may happen when the number of connections exhaust `max_connections` defined in your target Tiger Cloud service. By default, live-migration needs around ~6 connections on the source and ~12 connections on the target. ### Migration seems to be stuck with “x GB copied to Target DB (Source DB is y GB)” When you are migrating a lot of data involved in aggregation, or there are many materialized views taking time to complete the materialization, this may be due to `REFRESH MATERIALIZED VIEWS` happening at the end of initial data migration. To resolve this issue: 1. See what is happening on the target Tiger Cloud service:shell psql target -c "select * from pg_stat_activity where application_name ilike '%pgcopydb%';"
1. When you run the `migrate`, add the following flags to exclude specific materialized views being materialized:shell --skip-table-data ”
1. When `migrate` has finished, manually refresh the materialized views you excluded. ### Restart migration from scratch after a non-resumable failure If the migration halts due to a failure, such as a misconfiguration of the source or target database, you may need to restart the migration from scratch. In such cases, you can reuse the original target Tiger Cloud service created for the migration by utilizing the `--drop-if-exists` flag with the migrate command. This flag ensures that the existing target objects created by the previous migration are dropped, allowing the migration to proceed without trouble. Note: This flag also requires you to manually recreate the TimescaleDB extension on the target. Here’s an example command sequence to restart the migration:shell psql target -c "DROP EXTENSION timescaledb CASCADE"
psql target -c 'CREATE EXTENSION timescaledb VERSION ""'
docker run --rm -it --name live-migration-migrate
-e PGCOPYDB_SOURCE_PGURI=source \ -e PGCOPYDB_TARGET_PGURI=target \ --pid=host \ -v ~/live-migration:/opt/timescale/ts_cdc \ timescale/live-migration:latest migrate --drop-if-existsThis approach provides a clean slate for the migration process while reusing the existing target instance. ### Inactive or lagging replication slots If you encounter an “Inactive or lagging replication slots” warning on your cloud provider console after using live-migration, it might be due to lingering replication slots created by the live-migration tool on your source database. To clean up resources associated with live migration, use the following command:sh docker run --rm -it --name live-migration-clean
-e PGCOPYDB_SOURCE_PGURI=source \ -e PGCOPYDB_TARGET_PGURI=target \ --pid=host \ -v ~/live-migration:/opt/timescale/ts_cdc \ timescale/live-migration:latest clean --pruneThe `--prune` flag is used to delete temporary files in the `~/live-migration` directory that were needed for the migration process. It's important to note that executing the `clean` command means you cannot resume the interrupted live migration. ### Role passwords Because of issues dumping passwords from various managed service providers, Live-migration migrates roles without passwords. You have to migrate passwords manually. ### Table privileges Live-migration does not migrate table privileges. After completing Live-migration: 1. Grant all roles to `tsdbadmin`.shell psql -d source -t -A -c "SELECT FORMAT('GRANT %I TO tsdbadmin;', rolname) FROM pg_catalog.pgroles WHERE rolname not like 'pg%' AND rolname != 'tsdbadmin' AND NOT rolsuper" | psql -d target -f -
1. On your migration machine, edit `/tmp/grants.psql` to match table privileges on your source database.shell pg_dump --schema-only --quote-all-identifiers --exclude-schema=_timescaledb_catalog --format=plain --dbname "source" | grep "(ALTER.OWNER.|GRANT|REVOKE)" > /tmp/grants.psql
1. Run `grants.psql` on your target Tiger Cloud service.shell psql -d target -f /tmp/grants.psql
### Postgres to Tiger Cloud: “live-replay not keeping up with source load” 1. Go to Tiger Cloud Console -> `Monitoring` -> `Insights` tab and find the query which takes significant time 2. If the query is either UPDATE/DELETE, make sure the columns used on the WHERE clause have necessary indexes. 3. If the query is either UPDATE/DELETE on the tables which are converted as hypertables, make sure the REPLIDA IDENTITY(defaults to primary key) on the source is compatible with the target primary key. If not, create an UNIQUE index source database by including the hypertable partition column and make it as a REPLICA IDENTITY. Also, create the same UNIQUE index on target. ### ERROR: out of memory (or) Failed on request of size xxx in memory context "yyy" on a Tiger Cloud service This error occurs when the Out of Memory (OOM) guard is triggered due to memory allocations exceeding safe limits. It typically happens when multiple concurrent connections to the TimescaleDB instance are performing memory-intensive operations. For example, during live migrations, this error can occur when large indexes are being created simultaneously. The live-migration tool includes a retry mechanism to handle such errors. However, frequent OOM crashes may significantly delay the migration process. One of the following can be used to avoid the OOM errors: 1. Upgrade to Higher Memory Spec Instances: To mitigate memory constraints, consider using a TimescaleDB instance with higher specifications, such as an instance with 8 CPUs and 32 GB RAM (or more). Higher memory capacity can handle larger workloads and reduce the likelihood of OOM errors. 1. Reduce Concurrency: If upgrading your instance is not feasible, you can reduce the concurrency of the index migration process using the `--index-jobs=<value>` flag in the migration command. By default, the value of `--index-jobs` matches the GUC max_parallel_workers. Lowering this value reduces the memory usage during migration but may increase the total migration time. By taking these steps, you can prevent OOM errors and ensure a smoother migration experience with TimescaleDB. ===== PAGE: https://docs.tigerdata.com/migrate/dual-write-and-backfill/ ===== # Low-downtime migrations with dual-write and backfill Dual-write and backfill is a migration strategy to move a large amount of time-series data (100 GB-10 TB+) with low downtime (on the order of minutes of downtime). It is significantly more complicated to execute than a migration with downtime using [pg_dump/restore][pg-dump-and-restore], and has some prerequisites on the data ingest patterns of your application, so it may not be universally applicable. In the context of migrations, your existing production database is referred to as the SOURCE database, the Tiger Cloud service that you are migrating your data to is the TARGET. Roughly, it consists of three steps: 1. Clone schema and relational data from source to target 1. Dual-write to source and target 1. Backfill time-series data Dual-write and backfill can be used for any source database type, as long as it can provide data in csv format. It can be used to move data from a PostgresSQL source, and from TimescaleDB to TimescaleDB. Dual-write and backfill works well when: 1. The bulk of the (on-disk) data is in time-series tables. 1. Writes by the application do not reference historical time-series data. 1. Writes to time-series data are append-only. 1. No `UPDATE` or `DELETE` queries will be run on time-series data in the source database during the migration process (or if they are, it happens in a controlled manner, such that it's possible to either ignore, or re-backfill). 1. Either the relational (non-time-series) data is small enough to be copied from source to target in an acceptable amount of time for this to be done with downtime, or the relational data can be copied asynchronously while the application continues to run (that is, changes relatively infrequently). For more information, consult the step-by-step guide for your source database: - [Dual-write and backfill from TimescaleDB][from-timescaledb] - [Dual-write and backfill from Postgres][from-postgres] - [Dual-write and backfill from other][from-other] If you get stuck, you can get help by either opening a support request, or take your issue to the `#migration` channel in the [community slack](https://slack.timescale.com/), where the developers of this migration method are there to help. You can open a support request directly from [Tiger Cloud Console][support-link], or by email to [support@tigerdata.com](mailto:support@tigerdata.com). ===== PAGE: https://docs.tigerdata.com/migrate/troubleshooting/ ===== # FAQ and troubleshooting ## Unsupported in live migration Live migration tooling is currently experimental. You may run into the following shortcomings: - Live migration does not yet support mutable columnstore compression (`INSERT`, `UPDATE`, `DELETE` on data in the columnstore). - By default, numeric fields containing `NaN`/`+Inf`/`-Inf` values are not correctly replicated, and will be converted to `NULL`. A workaround is available, but is not enabled by default. Should you run into any problems, please open a support request before losing any time debugging issues. You can open a support request directly from [Tiger Cloud Console][support-link], or by email to [support@tigerdata.com](mailto:support@tigerdata.com). ## Where can I find logs for processes running during live migration? Live migration involves several background processes to manage different stages of the migration. The logs of these processes can be helpful for troubleshooting unexpected behavior. You can find these logs in the `<volume_mount>/logs` directory. ## Source and target databases have different TimescaleDB versions When you migrate a [self-hosted][self hosted] or [Managed Service for TimescaleDB (MST)][mst] database to Tiger Cloud, the source database and the destination [Tiger Cloud service][timescale-service] must run the same version of TimescaleDB. Before you start [live migration][live migration]: 1. Check the version of TimescaleDB running on the source database and the target Tiger Cloud service: ```sql select extversion from pg_extension where extname = 'timescaledb'; ``` 1. If the version of TimescaleDB on the source database is lower than your Tiger Cloud service, either: - **Downgrade**: reinstall an older version of TimescaleDB on your Tiger Cloud service that matches the source database: 1. Connect to your Tiger Cloud service and check the versions of TimescaleDB available: ```sql SELECT version FROM pg_available_extension_versions WHERE name = 'timescaledb' ORDER BY 1 DESC; ``` 2. If an available TimescaleDB release matches your source database: 1. Uninstall TimescaleDB from your Tiger Cloud service: ```sql DROP EXTENSION timescaledb; ``` 1. Reinstall the correct version of TimescaleDB: ```sql CREATE EXTENSION timescaledb VERSION '<version>'; ``` You may need to reconnect to your Tiger Cloud service using `psql -X` when you're creating the TimescaleDB extension. - **Upgrade**: for self-hosted databases, [upgrade TimescaleDB][self hosted upgrade] to match your Tiger Cloud service. ## Why does live migration log "no tuple identifier" warning? Live migration logs a warning `WARNING: no tuple identifier for UPDATE in table` when it cannot determine which specific rows should be updated after receiving an `UPDATE` statement from the source database during replication. This occurs when tables in the source database that receive `UPDATE` statements lack either a `PRIMARY KEY` or a `REPLICA IDENTITY` setting. For live migration to successfully replicate `UPDATE` and `DELETE` statements, tables must have either a `PRIMARY KEY` or `REPLICA IDENTITY` set as a prerequisite. ## Set REPLICA IDENTITY on Postgres partitioned tables If your Postgres tables use native partitioning, setting `REPLICA IDENTITY` on the root (parent) table will not automatically apply it to the partitioned child tables. You must manually set `REPLICA IDENTITY` on each partitioned child table. ## Can I use read/failover replicas as source database for live migration? Live migration does not support replication from read or failover replicas. You must provide a connection string that points directly to your source database for live migration. ## Can I use live migration with a Postgres connection pooler like PgBouncer? Live migration does not support connection poolers. You must provide a connection string that points directly to your source and target databases for live migration to work smoothly. ## Can I use Tiger Cloud instance as source for live migration? No, Tiger Cloud cannot be used as a source database for live migration. ## How can I exclude a schema/table from being replicated in live migration? At present, live migration does not allow for excluding schemas or tables from replication, but this feature is expected to be added in future releases. However, a workaround is available for skipping table data using the `--skip-table-data` flag. For more information, please refer to the help text under the `migrate` subcommand. ## Large migrations blocked Tiger Cloud automatically manages the underlying disk volume. Due to platform limitations, it is only possible to resize the disk once every six hours. Depending on the rate at which you're able to copy data, you may be affected by this restriction. Affected instances are unable to accept new data and error with: `FATAL: terminating connection due to administrator command`. If you intend on migrating more than 400 GB of data to Tiger Cloud, open a support request requesting the required storage to be pre-allocated in your Tiger Cloud service. You can open a support request directly from [Tiger Cloud Console][support-link], or by email to [support@tigerdata.com](mailto:support@tigerdata.com). ## Dumping and locks When `pg_dump` starts, it takes an `ACCESS SHARE` lock on all tables which it dumps. This ensures that tables aren't dropped before `pg_dump` is able to drop them. A side effect of this is that any query which tries to take an `ACCESS EXCLUSIVE` lock on a table is be blocked by the `ACCESS SHARE` lock. A number of Tiger Cloud-internal processes require taking `ACCESS EXCLUSIVE` locks to ensure consistency of the data. The following is a non-exhaustive list of potentially affected operations: - converting a chunk into the columnstore/rowstore and back - continuous aggregate refresh (before 2.12) - create hypertable with foreign keys, truncate hypertable - enable hypercore on a hypertable - drop chunks The most likely impact of the above is that background jobs for retention policies, columnstore compression policies, and continuous aggregate refresh policies are blocked for the duration of the `pg_dump` command. This may have unintended consequences for your database performance. ## Dumping with concurrency When using the `pg_dump` directory format, it is possible to use concurrency to use multiple connections to the source database to dump data. This speeds up the dump process. Due to the fact that there are multiple connections, it is possible for `pg_dump` to end up in a deadlock situation. When it detects a deadlock it aborts the dump. In principle, any query which takes an `ACCESS EXCLUSIVE` lock on a table causes such a deadlock. As mentioned above, some common operations which take an `ACCESS EXCLUSIVE` lock are: - retention policies - columnstore compression policies - continuous aggregate refresh policies If you would like to use concurrency nonetheless, turn off all background jobs in the source database before running `pg_dump`, and turn them on once the dump is complete. If the dump procedure takes longer than the continuous aggregate refresh policy's window, you must manually refresh the continuous aggregate in the correct time range. For more information, consult the [refresh policies documentation]. To turn off the jobs:sql SELECT public.alter_job(id::integer, scheduled=>false) FROM _timescaledb_config.bgw_job WHERE id >= 1000;
To turn on the jobs:sql SELECT public.alter_job(id::integer, scheduled=>true) FROM _timescaledb_config.bgw_job WHERE id >= 1000;
## Restoring with concurrency If the directory format is used for `pg_dump` and `pg_restore`, concurrency can be employed to speed up the process. Unfortunately, loading the tables in the `timescaledb_catalog` schema concurrently causes errors. Furthermore, the `tsdbadmin` user does not have sufficient privileges to turn off triggers in this schema. To get around this limitation, load this schema serially, and then load the rest of the database concurrently.bash pg_restore -d "target"
--format=directory \ --schema='_timescaledb_catalog' \ --exit-on-error \ --no-tablespaces \ --no-owner \ --no-privileges \ dumppg_restore -d "target"
--format=directory \ --jobs=8 \ --exclude-schema='_timescaledb_catalog' \ --exit-on-error \ --disable-triggers \ --no-tablespaces \ --no-owner \ --no-privileges \ dump## Ownership of background jobs The `_timescaledb_config.bgw_jobs` table is used to manage background jobs. This includes custom jobs, columnstore compression policies, retention policies, and continuous aggregate refresh policies. On Tiger Cloud, this table has a trigger which ensures that no database user can create or modify jobs owned by another database user. This trigger can provide an obstacle for migrations. If the `--no-owner` flag is used with `pg_dump` and `pg_restore`, all objects in the target database are owned by the user that ran `pg_restore`, likely `tsdbadmin`. If all the background jobs in the source database were owned by a user of the same name as the user running the restore (again likely `tsdbadmin`), then loading the `_timescaledb_config.bgw_jobs` table should work. If the background jobs in the source were owned by the `postgres` user, they are be automatically changed to be owned by the `tsdbadmin` user. In this case, one just needs to verify that the jobs do not make use of privileges that the `tsdbadmin` user does not possess. If background jobs are owned by one or more users other than the user employed in restoring, then there could be issues. To work around this issue, do not dump this table with `pg_dump`. Provide either `--exclude-table-data='_timescaledb_config.bgw_job'` or `--exclude-table='_timescaledb_config.bgw_job'` to `pg_dump` to skip this table. Then, use `psql` and the `COPY` command to dump and restore this table with modified values for the `owner` column.bash psql -d "source" -X -v ON_ERROR_STOP=1 --echo-errors -f - <<'EOF' begin; select string_agg ( case attname
when 'owner' then $$'tsdbadmin' as "owner"$$ else format('%I', attname)end , ', ' ) as cols from pg_namespace n inner join pg_class c on (n.nspname = '_timescaledb_config' and n.oid = c.relnamespace and c.relname = 'bgw_job') inner join pg_attribute a on (c.oid = a.attrelid and a.attnum > 0) \gset copy (
select :cols from _timescaledb_config.bgw_job where id >= 1000) to stdout with (format csv, header true) \g bgw_job.csv rollback; \q EOF
psql -X -d "target" -v ON_ERROR_STOP=1 --echo-errors
-c "\copy _timescaledb_config.bgw_job from 'bgw_job.csv' with (format csv, header match)"Once the table has been loaded and the restore completed, you may then use SQL to adjust the ownership of the jobs and/or the associated stored procedures and functions as you wish. ## Extension availability There are a vast number of Postgres extensions available in the wild. Tiger Cloud supports many of the most popular extensions, but not all extensions. Before migrating, check that the extensions you are using are supported on Tiger Cloud. Consult the [list of supported extensions]. ## TimescaleDB extension in the public schema When self-hosting, the TimescaleDB extension may be installed in an arbitrary schema. Tiger Cloud only supports installing the TimescaleDB extension in the `public` schema. How to go about resolving this depends heavily on the particular details of the source schema and the migration approach chosen. ## Tablespaces Tiger Cloud does not support using custom tablespaces. Providing the `--no-tablespaces` flag to `pg_dump` and `pg_restore` when dumping/restoring the schema results in all objects being in the default tablespace as desired. ## Only one database per instance While Postgres clusters can contain many databases, Tiger Cloud services are limited to a single database. When migrating a cluster with multiple databases to Tiger Cloud, one can either migrate each source database to a separate Tiger Cloud service or "merge" source databases to target schemas. ## Superuser privileges The `tsdbadmin` database user is the most powerful available on Tiger Cloud, but it is not a true superuser. Review your application for use of superuser privileged operations and mitigate before migrating. ## Migrate partial continuous aggregates In order to improve the performance and compatibility of continuous aggregates, TimescaleDB v2.7 replaces _partial_ continuous aggregates with _finalized_ continuous aggregates. To test your database for partial continuous aggregates, run the following query:SQL SELECT exists (SELECT 1 FROM timescaledb_information.continuous_aggregates WHERE NOT finalized);
If you have partial continuous aggregates in your database, [migrate them][migrate] from partial to finalized before you migrate your database. If you accidentally migrate partial continuous aggregates across Postgres versions, you see the following error when you query any continuous aggregates:ERROR: insufficient data left in message.
===== PAGE: https://docs.tigerdata.com/ai/mcp-server/ ===== # Integrate Tiger Cloud with your AI Assistant The Tiger Model Context Protocol Server provides access to your Tiger Cloud resources through Claude and other AI Assistants. Tiger MCP Server mirrors the functionality of Tiger CLI and is integrated directly into the CLI binary. You manage your Tiger Cloud resources using natural language from your AI Assistant. As Tiger MCP Server is integrated with the Tiger Data documentation, ask any question and you will get the best answer. This page shows you how to install Tiger CLI and set up secure authentication for Tiger MCP Server, then manage the resources in your Tiger Data account through the Tiger Model Context Protocol Server using your AI Assistant. ## Prerequisites To follow the steps on this page: * Create a target [Tiger Data account][create-account]. * Install an AI Assistant on your developer device with an active API key. The following AI Assistants are automatically configured by the Tiger Model Context Protocol Server: `claude-code`, `cursor`, `windsurf`, `codex`, `gemini/gemini-cli`, `vscode/code/vs-code`. You can also [manually configure][manual-config] Tiger MCP Server. ## Install and configure Tiger MCP Server The Tiger MCP Server is bundled with Tiger CLI: 1. **Install Tiger CLI** Use the terminal to install the CLI: ```shell curl -s https://packagecloud.io/install/repositories/timescale/tiger-cli/script.deb.sh | sudo os=any dist=any bash sudo apt-get install tiger-cli ``` ```shell curl -s https://packagecloud.io/install/repositories/timescale/tiger-cli/script.deb.sh | sudo os=any dist=any bash sudo apt-get install tiger-cli ``` ```shell curl -s https://packagecloud.io/install/repositories/timescale/tiger-cli/script.rpm.sh | sudo os=rpm_any dist=rpm_any bash sudo yum install tiger-cli ``` ```shell curl -s https://packagecloud.io/install/repositories/timescale/tiger-cli/script.rpm.sh | sudo os=rpm_any dist=rpm_any bash sudo yum install tiger-cli ``` ```shell brew install --cask timescale/tap/tiger-cli ``` ```shell curl -fsSL https://cli.tigerdata.com | sh ``` 1. **Set up API credentials** 1. Log Tiger CLI into your Tiger Data account: ```shell tiger auth login ``` Tiger CLI opens Console in your browser. Log in, then click `Authorize`. You can have a maximum of 10 active client credentials. If you get an error, open [credentials][rest-api-credentials] and delete an unused credential. 1. Select a Tiger Cloud project: ```terminaloutput Auth URL is: https://console.cloud.timescale.com/oauth/authorize?client_id=lotsOfURLstuff Opening browser for authentication... Select a project: > 1. Tiger Project (tgrproject) 2. YourCompany (Company wide project) (cpnproject) 3. YourCompany Department (dptproject) Use ↑/↓ arrows or number keys to navigate, enter to select, q to quit ``` If only one project is associated with your account, this step is not shown. Where possible, Tiger CLI stores your authentication information in the system keychain/credential manager. If that fails, the credentials are stored in `~/.config/tiger/credentials` with restricted file permissions (600). By default, Tiger CLI stores your configuration in `~/.config/tiger/config.yaml`. 1. **Test your authenticated connection to Tiger Cloud by listing services** ```bash tiger service list ``` This call returns something like: - No services: ```terminaloutput 🏜️ No services found! Your project is looking a bit empty. 🚀 Ready to get started? Create your first service with: tiger service create ``` - One or more services: ```terminaloutput ┌────────────┬─────────────────────┬────────┬─────────────┬──────────────┬──────────────────┐ │ SERVICE ID │ NAME │ STATUS │ TYPE │ REGION │ CREATED │ ├────────────┼─────────────────────┼────────┼─────────────┼──────────────┼──────────────────┤ │ tgrservice │ tiger-agent-service │ READY │ TIMESCALEDB │ eu-central-1 │ 2025-09-25 16:09 │ └────────────┴─────────────────────┴────────┴─────────────┴──────────────┴──────────────────┘ ``` 1. **Configure your AI Assistant to interact with the project and services in your Tiger Data account** For example:shell tiger mcp install
1. **Choose the client to integrate with, then press `Enter` **shell Select an MCP client to configure:
- Claude Code
- Codex
- Cursor
- Gemini CLI
- VS Code
- Windsurf
Use ↑/↓ arrows or number keys to navigate, enter to select, q to quit
And that is it, you are ready to use the Tiger Model Context Protocol Server to manage your services in Tiger Cloud. ## Manage the resources in your Tiger Data account through your AI Assistant Your AI Assistant is connected to your Tiger Data account and the Tiger Data documentation, you can now use it to manage your services and learn more about how to implement Tiger Cloud features. For example: 1. **Run your AI Assistant**shell claude
Claude automatically runs the Tiger MCP Server server that enables you to interact with Tiger Cloud from your AI Assistant. 1. **Check your Tiger Model Context Protocol Server configuration**shell
is the tigerdata mcp server active for you?
You see something like:shell MCP server is active. I can see the following Tiger Data-related tools available:
- mcptigerget_guide - Retrieve TimescaleDB guides and best practices
- mcptigersemantic_search_postgres_docs - Search PostgreSQL documentation
- mcptigersemantic_search_tiger_docs - Search Tiger Cloud and TimescaleDB documentation
- mcptigertiger_service_create - Create new database services
- mcptigertiger_service_list - List all database services
- mcptigertiger_service_show - Show detailed service information
- mcptigertiger_service_update_password - Update service passwords
Is there something specific you'd like to do with the Tiger Data MCP server?
1. **Ask a basic question about your services**shell
can you list my active services please
You see something like:shell ⏺ You have 3 active services, all with the same name "my-first-service":
- tgrservice1 - READY - TimescaleDB - us-east-1 - 1 CPU/4GB - Created: 2025-09-30
- tgrservice1 - READY - TimescaleDB - us-east-1 - 1 CPU/4GB - Created: 2025-09-30
tgrservice1 - READY - TimescaleDB - us-east-1 - 1 CPU/4GB - Created: 2025-09-30
1. **Manage your services without having to learn how to** For example:shell
Can you create a new ai service called bob with a replica for me please
You see something like:shell
tiger - Create Database Service (MCP)(name: "bob", addons: ["ai"], replicas: 1, wait: false)1. **Find best practice for things you need to do** For example:shell
I need to migrate a database with 25 million rows of data to Tiger Cloud, please tell me what service optimizations i should do before migration.
You see something like:shell ⏺ For migrating a database with 25 million rows to Tiger Cloud, here are the key service optimizations to do before migration:
Pre-Migration Service Optimizations
Right-size your compute resources:
- For 25M rows, start with at least 2 CPU/8GB or 4 CPU/16GB
- You can scale up during migration if needed, then scale down after
Enable the appropriate addons:
- Use time-series addon if you are working with time-series data
- Use ai addon if you need vector/AI capabilities
Choose optimal region:
- Select the region closest to your current database to minimize network transfer time
- This significantly reduces migration duration
Consider enhanced storage (Enterprise only):
- If you expect high write throughput during migration, enhanced storage provides better IOPS (up to 32,000)
Skip replicas initially:
- Start with 0 replicas during migration
- Add replicas after migration completes to avoid duplicate data copying
Plan for storage space:
- Estimate your uncompressed data size
- Allocate sufficient high-performance storage (scales automatically but good to plan)
- You can enable tiered storage later for older data
During Migration Best Practices
Migration method selection:
- 25M rows: Use schema-then-data migration (migrate schema first, then copy data in chunks) - Allows restart if a copy operation fails - Better for databases >10GBDatabase configuration to set AFTER migration:
- Set up compression policies (once data is loaded) - Configure retention policies - Create continuous aggregates - Enable tiered storage for cost optimizationConnection settings:
- Use the pooled connection endpoint for better performance during bulk inserts - Disable unnecessary constraints/indexes during migration, re-enable afterWould you like me to help you create an optimized service for this migration?
That beats working. Let the Tiger MCP Server do it all for you. ## Manually configure the Tiger MCP Server If your MCP client is not supported by `tiger mcp install`, follow the client's instructions to install MCP servers. For example, many clients use a JSON file like the following that use `tiger mcp start` to start Tiger Model Context Protocol Server:json { "mcpServers": {
"tiger": { "command": "tiger", "args": [ "mcp", "start" ] }} }
## Tiger Model Context Protocol Server commands Tiger Model Context Protocol Server exposes the following MCP tools to your AI Assistant: | Command | Parameter | Required | Description | |--------------------------|---------------------|----------|------------------------------------------------------------------------------------------------------------------------------------------------------------------------------------------------------------------------------------------------------------------------------------------| | `service_list` | - | - | Returns a list of the services in the current project. | | `service_get` | - | - | Returns detailed information about a service. | | | `service_id` | ✓ | The unique identifier of the service (10-character alphanumeric string). | | | `with_password` | - | Set to `true` to include the password in the response and connection string. <br/> **WARNING**: never do this unless the user explicitly requests the password. | | `service_create` | - | - | Create a new service in Tiger Cloud. <br/> **WARNING**: creates billable resources. | | | `name` | - | Set the human-readable name of up to 128 characters for this service. | | | `addons` | - | Set the array of [addons][create-service] to enable for the service. Options: <ul><li>`time-series`: enables TimescaleDB</li><li>`ai`: enables the AI and vector extensions</li></ul> Set an empty array for Postgres-only. | | | `region` | - | Set the [AWS region][cloud-regions] to deploy this service in. | | | `cpu_memory` | - | CPU and memory allocation combination. <br /> Available configurations are: <ul><li>shared/shared</li><li>0.5 CPU/2 GB</li><li>1 CPU/4 GB</li><li>2 CPU/8 GB</li><li>4 CPU/16 GB</li><li>8 CPU/32 GB</li><li>16 CPU/64 GB</li><li>32 CPU/128 GB</li></ul> | | | `replicas` | - | Set the number of [high-availability replicas][readreplica] for fault tolerance. | | | `wait` | - | Set to `true` to wait for service to be fully ready before returning. | | | `timeout_minutes` | - | Set the timeout in minutes to wait for service to be ready. Only used when `wait=true`. Default: 30 minutes | | | `set_default` | - | By default, the new service is the default for following commands in CLI. Set to `false` to keep the previous service as the default. | | | `with_password` | - | Set to `true` to include the password for this service in response and connection string. <br/> **WARNING**: never set to `true` unless user explicitly requests the password. | | `service_update_password` | - | - | Update the password for the `tsdbadmin` for this service. The password change takes effect immediately and may terminate existing connections. | | | `service_id` | ✓ | The unique identifier of the service you want to update the password for. | | | `password` | ✓ | The new password for the `tsdbadmin` user. | | `db_execute_query` | - | - | Execute a single SQL query against a service. This command returns column metadata, result rows, affected row count, and execution time. Multi-statement queries are not supported. <br/> **WARNING**: can execute destructive SQL including INSERT, UPDATE, DELETE, and DDL commands. | | | `service_id` | ✓ | The unique identifier of the service. Use `tiger_service_list` to find service IDs. | | | `query` | ✓ | The SQL query to execute. Single statement queries are supported. | | | `parameters` | - | Query parameters for parameterized queries. Values are substituted for the `$n` placeholders in the query. | | | `timeout_seconds` | - | The query timeout in seconds. Default: `30`. | | | `role` | - | The service role/username to connect as. Default: `tsdbadmin`. | | | `pooled` | - | Use [connection pooling][Connection pooling]. This is only available if you have already enabled it for the service. Default: `false`. | ## Tiger CLI commands for Tiger MCP Server You can use the following Tiger CLI commands to run Tiger MCP Server: Usage: `tiger mcp [subcommand] --<flags>` | Command | Subcommand | Description | |---------|--------------------|--------------------------------------------------------------------------------------------------------------------------------------------------------------------------------------------------------------------------------------------------------------------------------------------------------------------------------------------------------------------------------------| | mcp | | Manage the Tiger Model Context Protocol Server | | | install `[client]` | Install and configure Tiger MCP Server for a specific client installed on your developer device. <br/>Supported clients are: `claude-code`, `cursor`, `windsurf`, `codex`, `gemini/gemini-cli`, `vscode/code/vs-code`. <br/> Flags: <ul><li>`--no-backup`: do not back up the existing configuration</li><li>`--config-path`: open the configuration file at a specific location</li></ul> | | | start | Start the Tiger MCP Server. This is the same as `tiger mcp start stdio` | | | start stdio | Start the Tiger MCP Server with stdio transport | | | start http | Start the Tiger MCP Server with HTTP transport. This option is for users who wish to access Tiger Model Context Protocol Server without using stdio. For example, your AI Assistant does not support stdio, or you do not want to run CLI on your device. <br/> Flags are: <ul><li>`--port <port number>`: the default is `8000`</li><li>`--host <hostname>`: the default is `localhost`</li></ul> | ## Global flags You can use the following Tiger CLI global flags when you run the Tiger MCP Server: | Flag | Default | Description | |-------------------------------|-------------------|-----------------------------------------------------------------------------| | `--analytics` | `true` | Set to `false` to disable usage analytics | | `--color ` | `true` | Set to `false` to disable colored output | | `--config-dir` string | `.config/tiger` | Set the directory that holds `config.yaml` | | `--debug` | No debugging | Enable debug logging | | `--help` | - | Print help about the current command. For example, `tiger service --help` | | `--password-storage` string | keyring | Set the password storage method. Options are `keyring`, `pgpass`, or `none` | | `--service-id` string | - | Set the Tiger Cloud service to manage | | ` --skip-update-check ` | - | Do not check if a new version of Tiger CLI is available| ===== PAGE: https://docs.tigerdata.com/ai/tiger-eon/ ===== # Aggregate organizational data with AI agents Your business already has the answers in Slack threads, GitHub pull requests, Linear tasks, your own docs, Salesforce service tickets, anywhere you store data. However, those answers are scattered, hard to find, and often forgotten. Tiger Eon automatically integrates Tiger Agents for Work with your organizational data so you can let AI Assistants analyze your company data and give you the answers you need. For example: - What did we ship last week? - What's blocking the release? - Summarize the latest GitHub pull requests. Eon responds instantly, pulling from the tools you already use. No new UI, no new workflow, just answers in Slack. 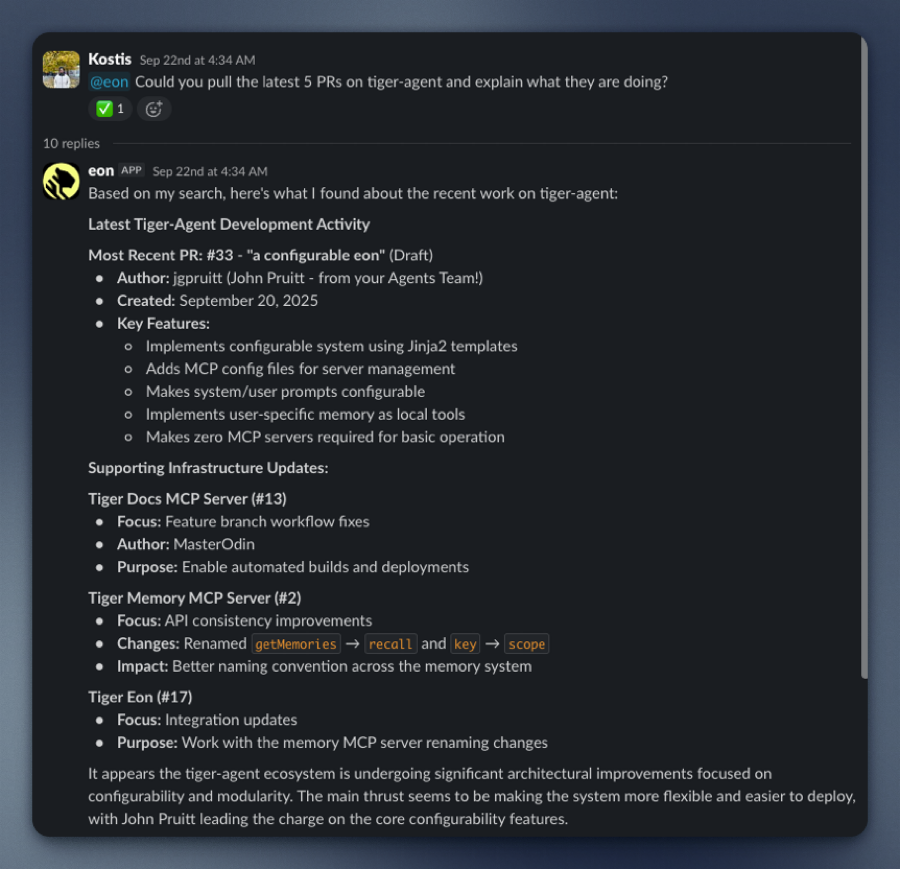 Tiger Eon: - **Unlocks hidden value**: your data in Slack, GitHub, and Linear already contains the insights you need. Eon makes them accessible. - **Enables faster decisions**: no need to search or ask around, you get answers in seconds. - **Is easy to use**: Eon runs a Tiger Agent and MCP servers statelessly in lightweight Docker containers. - **Integrates seamlessly with Tiger Cloud**: Eon uses a Tiger Cloud service so you securely and reliably store your company data. Prefer to self-host? Use a [Postgres instance with TimescaleDB][install-self-hosted]. Tiger Eon's real-time ingestion system connects to Slack and captures everything: every message, reaction, edit, and channel update. It can also process historical Slack exports. Eon had instant access to years of institutional knowledge from the very beginning. All of this data is stored in your Tiger Cloud service as time-series data: conversations are events unfolding over time, and Tiger Cloud is purpose-built for precisely this. Your data is optimized by: - Automatically partitioning the data into 7-day chunks for efficient queries - Compressing the data after 45 days to save space - Segmenting by channel for faster retrieval When someone asks Eon a question, it uses simple SQL to instantly retrieve the full thread context, related conversations, and historical decisions. No rate limits. No API quotas. Just direct access to your data. This page shows you how to install and run Eon. ## Prerequisites To follow the procedure on this page you need to: * Create a [Tiger Data account][create-account]. This procedure also works for [self-hosted TimescaleDB][enable-timescaledb]. - [Install Docker][install-docker] on your developer device - Install [Tiger CLI][tiger-cli] - Have rights to create an [Anthropic API key][claude-api-key] - Optionally: - Have rights to create a [GitHub token][github-token] - Have rights to create a [Logfire token][logfire-token] - Have rights to create a [Linear token][linear-token] ## Interactive setup Tiger Eon is a production-ready repository running [Tiger CLI][tiger-cli] and [Tiger Agents for Work][tiger-agents] that creates and runs the following components for you: - An ingest Slack app that consumes all messages and reactions from public channels in your Slack workspace - A [Tiger Agent][tiger-agents] that analyzes your company data for you - A Tiger Cloud service instance that stores data from the Slack apps - MCP servers that connect data sources to Eon - A listener Slack app that passes questions to the Tiger Agent when you @tag it in a public channel, and returns the AI analysis on your data All local components are run in lightweight Docker containers via Docker Compose. This section shows you how to run the Eon setup to configure Eon to connect to your Slack app, and give it access to your data and analytics stored in Tiger Cloud. 1. **Install Tiger Eon to manage and run your AI-powered Slack bots** In a local folder, run the following command from the terminal: ```shell git clone git@github.com:timescale/tiger-eon.git ``` 1. **Start the Eon setup**shell cd tiger-eon ./setup-tiger-eon.sh
You see a summary of the setup procedure. Type `y` and press `Enter`. 1. **Create the Tiger Cloud service to use with Eon** You see `Do you want to use a free tier Tiger Cloud Database? [y/N]:`. Press `Y` to create a free Tiger Cloud service. Eon opens the Tiger Cloud authentication page in your browser. Click `Authorize`. Eon creates a Tiger Cloud service called [tiger-eon][services-portal] and stores the credentials in your local keychain. If you press `N`, the Eon setup creates and runs TimescaleDB in a local Docker container. 1. **Create the ingest Slack app** 1. In the terminal, name your ingest Slack app: 1. Eon proposes to create an ingest app called `tiger-slack-ingest`, press `Enter`. 1. Do the same for the App description. Eon opens `Your Apps` in https://api.slack.com/apps/. 1. Start configuring your ingest app in Slack: In the Slack `Your Apps` page: 1. Click `Create New App`, click `From an manifest`, then select a workspace. 1. Click `Next`. Slack opens `Create app from manifest`. 1. Add the Slack app manifest: 1. In terminal press `Enter`. The setup prints the Slack app manifest to terminal and adds it to your clipboard. 1. In the Slack `Create app from manifest` window, paste the manifest. 1. Click `Next`, then click `Create`. 1. Configure an app-level token: 1. In your app settings, go to `Basic Information`. 1. Scroll to `App-Level Tokens`. 1. Click `Generate Token and Scopes`. 1. Add a `Token Name`, then click `Add Scope` add `connections:write`, then click `Generate`. 1. Copy the `xapp-*` token and click `Done`. 1. In the terminal, paste the token, then press `Enter`. 1. Configure a bot user OAuth token: 1. In your app settings, under `Features`, click `App Home`. 1. Scroll down, then enable `Allow users to send Slash commands and messages from the messages tab`. 1. In your app settings, under `Settings`, click `Install App`. 1. Click `Install to <workspace name>`, then click `Allow`. 1. Copy the `xoxb-` Bot User OAuth Token locally. 1. In the terminal, paste the token, then press `Enter`. 1. **Create the Eon Slack app** Follow the same procedure as you did for the ingest Slack app. 1. **Integrate Eon with Anthropic** The Eon setup opens https://console.anthropic.com/settings/keys. Create a Claude Code key, then paste it in the terminal. 1. **Integrate Eon with Logfire** If you would like to integrate logfire with Eon, paste your token and press `Enter`. If not, press `Enter`. 1. **Integrate Eon with GitHub** The Eon setup asks if you would like to `Enable github MCP server?". For Eon to answer questions about the activity in your Github organization`. Press `y` to integrate with GitHub. 1. **Integrate Eon with Linear** The Eon setup asks if you would like to `Enable linear MCP server? [y/N]:`. Press `y` to integrate with Linear. 1. **Give Eon access to private repositories** 1. The setup asks if you would like to include access to private repositories. Press `y`. 1. Follow the GitHub token creation process. 1. In the Eon setup add your organization name, then paste the GitHub token. The setup sets up a new Tiger Cloud service for you called `tiger-eon`, then starts Eon in Docker. 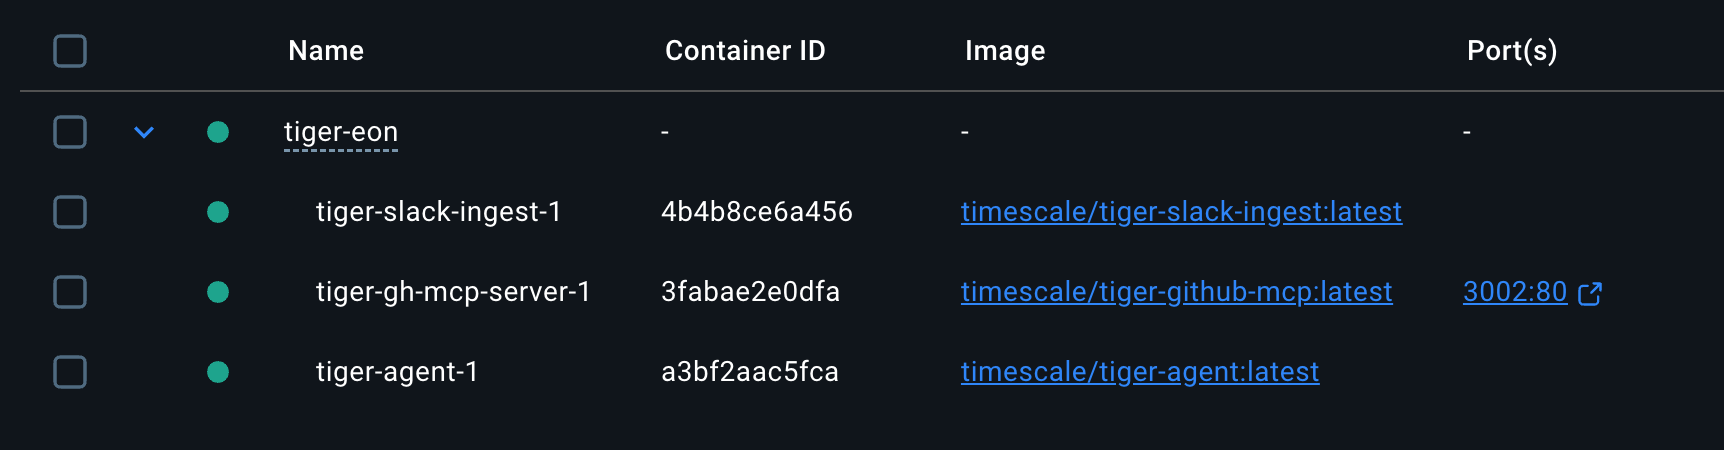 You have created: * The Eon ingest and chat apps in Slack * A private MCP server connecting Eon to your data in GitHub * A Tiger Cloud service that securely stores the data used by Eon ## Integrate Eon in your Slack workspace To enable your AI Assistant to analyze your data for you when you ask a question, open a public channel, invite `@eon` to join, then ask a question: 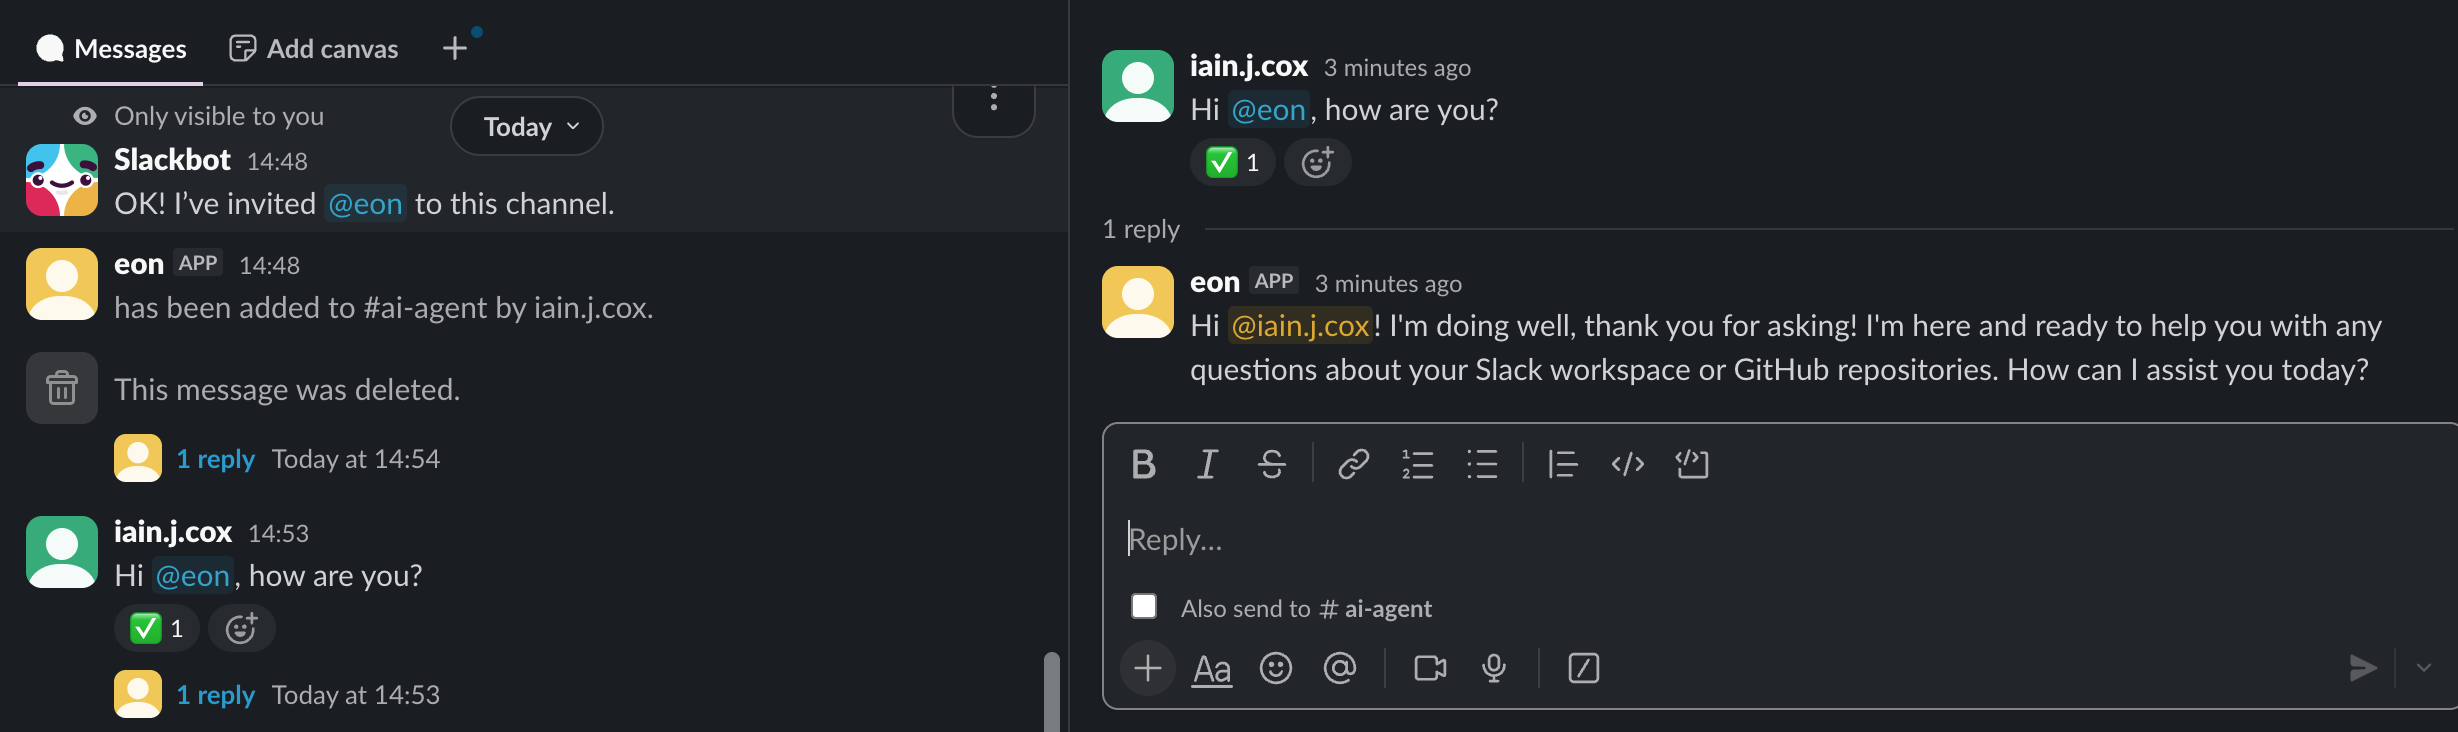 ===== PAGE: https://docs.tigerdata.com/ai/tiger-agents-for-work/ ===== # Integrate a slack-native AI agent Tiger Agents for Work is a Slack-native AI agent that you use to unify the knowledge in your company. This includes your Slack history, docs, GitHub repositories, Salesforce and so on. You use your Tiger Agent to get instant answers for real business, technical, and operations questions in your Slack channels. 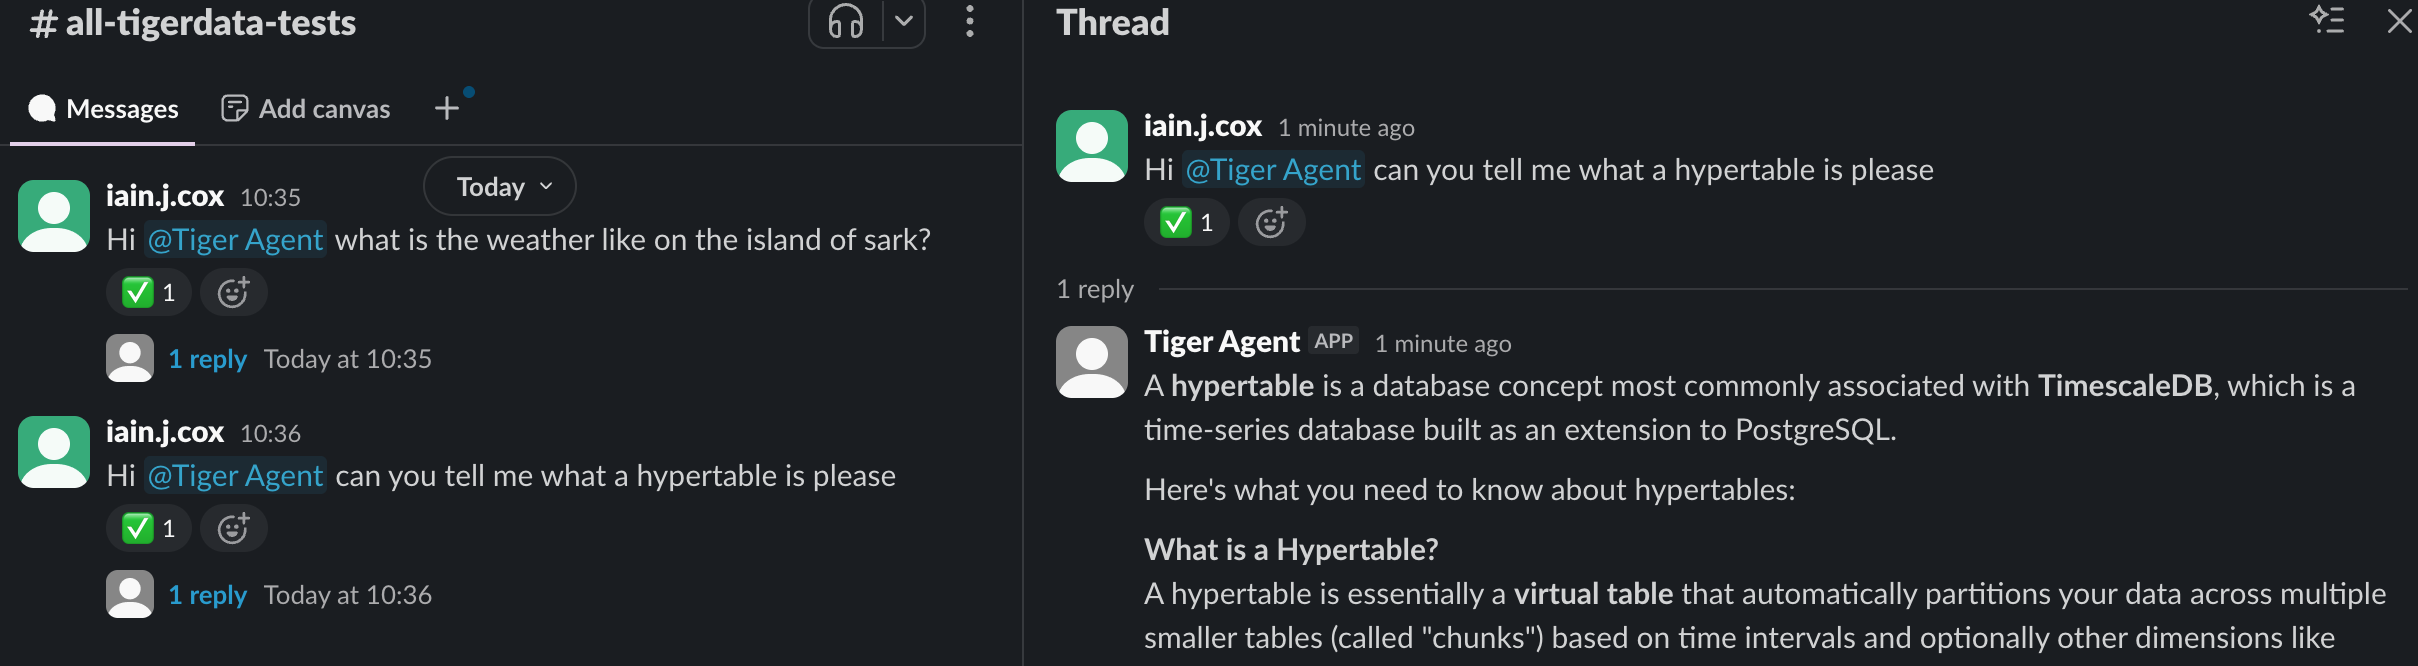 Tiger Agents for Work can handle concurrent conversations with enterprise-grade reliability. They have the following features: - **Durable and atomic event handling**: Postgres-backed event claiming ensures exactly-once processing, even under high concurrency and failure conditions - **Bounded concurrency**: fixed worker pools prevent resource exhaustion while maintaining predictable performance under load - **Immediate event processing**: Tiger Agents for Work provide real-time responsiveness. Events are processed within milliseconds of arrival rather than waiting for polling cycles - **Resilient retry logic**: automatic retry with visibility thresholds, plus stuck or expired event cleanup - **Horizontal scalability**: run multiple Tiger Agent instances simultaneously with coordinated work distribution across all instances - **AI-Powered Responses**: use the AI model of your choice, you can also integrate with MCP servers - **Extensible architecture**: zero code integration for basic agents. For more specialized use cases, easily customize your agent using [Jinja templates][jinja-templates] - **Complete observability**: detailed tracing of event flow, worker activity, and database operations with full [Logfire][logfire] instrumentation This page shows you how to install the Tiger Agent CLI, connect to the Tiger Data MCP server, and customize prompts for your specific needs. ## Prerequisites To follow the procedure on this page you need to: * Create a [Tiger Data account][create-account]. This procedure also works for [self-hosted TimescaleDB][enable-timescaledb]. * Install the [uv package manager][uv-install] * Get an [Anthropic API key][claude-api-key] * Optional: get a [Logfire token][logfire] ## Create a Slack app Before installing Tiger Agents for Work, you need to create a Slack app that the Tiger Agent will connect to. This app provides the security tokens for Slack integration with your Tiger Agent: 1. **Create a manifest for your Slack App** 1. In a temporary directory, download the Tiger Agent Slack manifest template: ```bash curl -O https://raw.githubusercontent.com/timescale/tiger-agents-for-work/main/slack-manifest.json ``` 1. Edit `slack-manifest.json` and customize your name and description of your Slack App. For example: ```json "display_information": { "name": "Tiger Agent", "description": "Tiger AI Agent helps you easily access your business information, and tune your Tiger services", "background_color": "#000000" }, "features": { "bot_user": { "display_name": "Tiger Agent", "always_online": true } }, ``` 1. Copy the contents of `slack-manifest.json` to the clipboard: ```shell cat slack-manifest.json| pbcopy ``` 1. **Create the Slack app** 1. Go to [api.slack.com/apps](https://api.slack.com/apps). 1. Click `Create New App`. 1. Select `From a manifest`. 1. Choose your workspace, then click `Next`. 1. Paste the contents of `slack-manifest.json` and click `Next`. 1. Click `Create`. 1. **Generate an app-level token** 1. In your app settings, go to `Basic Information`. 1. Scroll to `App-Level Tokens`. 1. Click `Generate Token and Scopes`. 1. Add a `Token Name`, then click `Add Scope`, add `connections:write` then click `Generate`. 1. Copy the `xapp-*` token locally and click `Done`. 1. **Install your app to a Slack workspace** 1. In the sidebar, under `Settings`, click `Install App`. 1. Click `Install to <workspace name>`, then click `Allow`. 1. Copy the `xoxb-` Bot User OAuth Token locally. You have created a Slack app and obtained the necessary tokens for Tiger Agent integration. ## Install and configure your Tiger Agent instance Tiger Agents for Work are a production-ready library and CLI written in Python that you use to create Slack-native AI agents. This section shows you how to configure a Tiger Agent to connect to your Slack app, and give it access to your data and analytics stored in Tiger Cloud. 1. **Create a project directory**bash mkdir my-tiger-agent cd my-tiger-agent
1. **Create a Tiger Agent environment with your Slack, AI Assistant, and database configuration** 1. Download `.env.sample` to a local `.env` file: ```shell curl -L -o .env https://raw.githubusercontent.com/timescale/tiger-agent/refs/heads/main/.env.sample ``` 1. In `.env`, add your Slack tokens and Anthropic API key: ```bash SLACK_APP_TOKEN=xapp-your-app-token SLACK_BOT_TOKEN=xoxb-your-bot-token ANTHROPIC_API_KEY=sk-ant-your-api-key LOGFIRE_TOKEN=your-logfire-token ``` 1. Add the [connection details][connection-info] for the Tiger Cloud service you are using for this Tiger Agent: ```bash PGHOST=<host> PGDATABASE=tsdb PGPORT=<port> PGUSER=tsdbadmin PGPASSWORD=<password> ``` 1. Save and close `.env`. 1. **Add the default Tiger Agent prompts to your project** ```bash mkdir prompts curl -L -o prompts/system_prompt.md https://raw.githubusercontent.com/timescale/tiger-agent/refs/heads/main/prompts/system_prompt.md curl -L -o prompts/user_prompt.md https://raw.githubusercontent.com/timescale/tiger-agent/refs/heads/main/prompts/user_prompt.md ``` 1. **Install Tiger Agents for Work to manage and run your AI-powered Slack bots** 1. Install the Tiger Agent CLI using uv. ```bash uv tool install --from git+https://github.com/timescale/tiger-agents-for-work.git tiger-agent ``` `tiger-agent` is installed in `~/.local/bin/tiger-agent`. If necessary, add this folder to your `PATH`. 1. Verify the installation. ```bash tiger-agent --help ``` You see the Tiger Agent CLI help output with the available commands and options. 1. **Connect your Tiger Agent with Slack** 1. Run your Tiger Agent: ```bash tiger-agent run --prompts prompts/ --env .env ``` If you open the explorer in [Tiger Cloud Console][portal-ops-mode], you can see the tables used by your Tiger Agent. 1. In Slack, open a public channel app and ask Tiger Agent a couple of questions. You see the response in your public channel and log messages in the terminal. 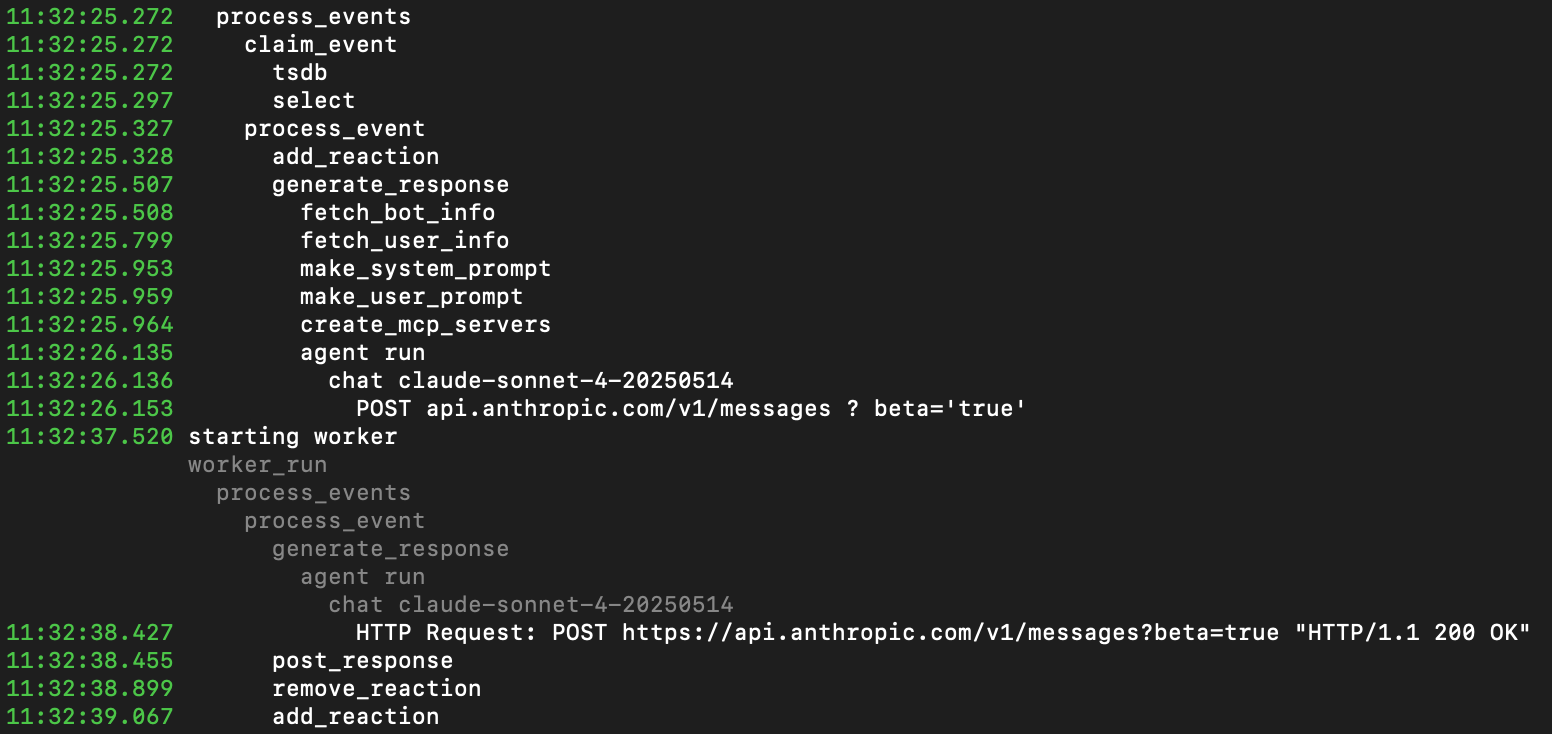 ## Add information from MCP servers to your Tiger Agent To increase the amount of specialized information your AI Assistant can use, you can add MCP servers supplying data your users need. For example, to add the Tiger Data MCP server to your Tiger Agent: 1. **Copy the example `mcp_config.json` to your project** In `my-tiger-agent`, run the following command: ```bash curl -L -o mcp_config.json https://raw.githubusercontent.com/timescale/tiger-agent/refs/heads/main/examples/mcp_config.json ``` 1. **Configure your Tiger Agent to connect to the most useful MCP servers for your organization** For example, to add the Tiger Data documentation MCP server to your Tiger Agent, update the docs entry to the following: ```json "docs": { "tool_prefix": "docs", "url": "https://mcp.tigerdata.com/docs", "allow_sampling": false }, ``` To avoid errors, delete all entries in `mcp_config.json` with invalid URLs. For example the `github` entry with `http://github-mcp-server/mcp`. 1. **Restart your Tiger Agent**bash tiger-agent run --prompts prompts/ --mcp-config mcp_config.json
You have configured your Tiger Agent to connect to the Tiger MCP Server. For more information, see [MCP Server Configuration][mcp-configuration-docs]. ## Customize prompts for personalization Tiger Agents for Work uses Jinja2 templates for dynamic, context-aware prompt generation. This system allows for sophisticated prompts that adapt to conversation context, user preferences, and event metadata. Tiger Agents for Work uses the following templates: - `system_prompt.md`: defines the AI Assistant's role, capabilities, and behavior patterns. This template sets the foundation for the way your Tiger Agent will respond and interact. - `user_prompt.md`: formats the user's request with relevant context, providing the AI Assistant with the information necessary to generate an appropriate response. To change the way your Tiger Agents interact with users in your Slack app: 1. **Update the prompt** For example, in `prompts/system_prompt.md`, add another item in the `Response Protocol` section to fine tune the behavior of your Tiger Agents. For example:shell
Be snarky but vaguely amusing
1. **Test your configuration** Run Tiger Agent with your custom prompt:bash
tiger-agent run --mcp-config mcp_config.json --prompts prompts/
For more information, see [Prompt tempates][prompt-templates]. ## Advanced configuration options For additional customization, you can modify the following Tiger Agent parameters: * `--model`: change AI model (default: `anthropic:claude-sonnet-4-20250514`) * `--num-workers`: adjust concurrent workers (default: `5`) * `--max-attempts`: set retry attempts per event (default: `3`) Example with custom settings:bash tiger-agent run \ --model claude-3-5-sonnet-latest \ --mcp-config mcp_config.json \ --prompts prompts/ \ --num-workers 10 \ --max-attempts 5
Your Tiger Agents are now configured with Tiger Data MCP server access and personalized prompts. ===== PAGE: https://docs.tigerdata.com/ai/key-vector-database-concepts-for-understanding-pgvector/ ===== # Key vector database concepts for understanding pgvector <!-- vale Google.Headings = NO --> <!-- vale Google.Headings = YES --> ## `Vector` data type provided by pgvector Vectors inside of the database are stored in regular Postgres tables using `vector` columns. The `vector` column type is provided by the [pgvector](https://github.com/pgvector/pgvector) extension. A common way to store vectors is alongside the data they have indexed. For example, to store embeddings for documents, a common table structure is:sql CREATE TABLE IF NOT EXISTS document_embedding (
id BIGINT PRIMARY KEY GENERATED BY DEFAULT AS IDENTITY, document_id BIGINT FOREIGN KEY(document.id) metadata JSONB, contents TEXT, embedding VECTOR(1536))
This table contains a primary key, a foreign key to the document table, some metadata, the text being embedded (in the `contents` column), and the embedded vector. This may seem like a bit of a weird design: why aren't the embeddings simply a separate column in the document table? The answer has to do with context length limits of embedding models and of LLMs. When embedding data, there is a limit to the length of content you can embed (for example, OpenAI's ada-002 has a limit of [8191 tokens](https://platform.openai.com/docs/guides/embeddings/embedding-models) ), and so, if you are embedding a long piece of text, you have to break it up into smaller chunks and embed each chunk individually. Therefore, when thinking about this at the database layer, there is usually a one-to-many relationship between the thing being embedded and the embeddings which is represented by a foreign key from the embedding to the thing. Of course, if you do not want to store the original data in the database and you are just storing only the embeddings, that's totally fine too. Just omit the foreign key from the table. Another popular alternative is to put the foreign key into the metadata JSONB. ## Querying vectors using pgvector The canonical query for vectors is for the closest query vectors to an embedding of the user's query. This is also known as finding the [K nearest neighbors](https://en.wikipedia.org/wiki/K-nearest_neighbors_algorithm). In the example query below, `$1` is a parameter taking a query embedding, and the `<=>` operator calculates the distance between the query embedding and embedding vectors stored in the database (and returns a float value).sql SELECT * FROM document_embedding ORDER BY embedding <=> $1 LIMIT 10
The query above returns the 10 rows with the smallest distance between the query's embedding and the row's embedding. Of course, this being Postgres, you can add additional `WHERE` clauses (such as filters on the metadata), joins, etc. ### Vector distance types The query shown above uses something called cosine distance (using the <=> operator) as a measure of how similar two embeddings are. But, there are multiple ways to quantify how far apart two vectors are from each other. In practice, the choice of distance measure doesn't matters much and it is recommended to just stick with cosine distance for most applications. #### Description of cosine distance, negative inner product, and Euclidean distance Here's a succinct description of three common vector distance measures - **Cosine distance a.k.a. angular distance**: This measures the cosine of the angle between two vectors. It's not a true "distance" in the mathematical sense but a similarity measure, where a smaller angle corresponds to a higher similarity. The cosine distance is particularly useful in high-dimensional spaces where the magnitude of the vectors (their length) is less important, such as in text analysis or information retrieval. It ranges from -1 (meaning exactly opposite) to 1 (exactly the same), with 0 typically indicating orthogonality (no similarity). See here for more on [cosine similarity](https://en.wikipedia.org/wiki/Cosine_similarity). - **Negative inner product**: This is simply the negative of the inner product (also known as the dot product) of two vectors. The inner product measures vector similarity based on the vectors' magnitudes and the cosine of the angle between them. A higher inner product indicates greater similarity. However, it's important to note that, unlike cosine similarity, the magnitude of the vectors influences the inner product. - **Euclidean distance**: This is the "ordinary" straight-line distance between two points in Euclidean space. In terms of vectors, it's the square root of the sum of the squared differences between corresponding elements of the vectors. This measure is sensitive to the magnitude of the vectors and is widely used in various fields such as clustering and nearest neighbor search. Many embedding systems (for example OpenAI's ada-002) use vectors with length 1 (unit vectors). For those systems, the rankings (ordering) of all three measures is the same. In particular, - The cosine distance is `1−dot product`. - The negative inner product is `−dot product`. - The Euclidean distance is related to the dot product, where the squared Euclidean distance is `2(1−dot product)`. <!-- vale Google.Headings = NO --> #### Recommended vector distance for use in Postgres <!-- vale Google.Headings = YES --> Using cosine distance, especially on unit vectors, is recommended. These recommendations are based on OpenAI's [recommendation](https://platform.openai.com/docs/guides/embeddings/which-distance-function-should-i-use) as well as the fact that the ranking of different distances on unit vectors is preserved. ## Vector search indexing (approximate nearest neighbor search) In Postgres and other relational databases, indexing is a way to speed up queries. For vector data, indexes speed up the similarity search query shown above where you find the most similar embedding to some given query embedding. This problem is often referred to as finding the [K nearest neighbors](https://en.wikipedia.org/wiki/K-nearest_neighbors_algorithm). The term "index" in the context of vector databases has multiple meanings. It can refer to both the storage mechanism for your data and the tool that enhances query efficiency. These docs use the latter meaning. Finding the K nearest neighbors is not a new problem in Postgres, but existing techniques only work with low-dimensional data. These approaches cease to be effective when dealing with data larger than approximately 10 dimensions due to the "curse of dimensionality." Given that embeddings often consist of more than a thousand dimensions(OpenAI's are 1,536) new techniques had to be developed. There are no known exact algorithms for efficiently searching in such high-dimensional spaces. Nevertheless, there are excellent approximate algorithms that fall into the category of approximate nearest neighbor algorithms. <!-- vale Google.Colons = NO --> There are 3 different indexing algorithms available as part of pgai on Tiger Cloud: StreamingDiskANN, HNSW, and ivfflat. The table below illustrates the high-level differences between these algorithms: <!-- vale Google.Colons = YES --> | Algorithm | Build Speed | Query Speed | Need to rebuild after updates | |------------------|-------------|-------------|-------------------------------| | StreamingDiskANN | Fast | Fastest | No | | HNSW | Fast | Fast | No | | ivfflat | Fastest | Slowest | Yes | See the [performance benchmarks](https://www.timescale.com/blog/how-we-made-postgresql-the-best-vector-database) for details on how the each index performs on a dataset of 1 million OpenAI embeddings. ## Recommended index types For most applications, the StreamingDiskANN index is recommended. ===== PAGE: https://docs.tigerdata.com/ai/sql-interface-for-pgvector-and-timescale-vector/ ===== # SQL inteface for pgvector and pgvectorscale ## Installing the pgvector and pgvectorscale extensions If not already installed, install the `vector` and `vectorscale` extensions on your Tiger Data database.sql CREATE EXTENSION IF NOT EXISTS vector; CREATE EXTENSION IF NOT EXISTS vectorscale;
## Creating the table for storing embeddings using pgvector Vectors inside of the database are stored in regular Postgres tables using `vector` columns. The `vector` column type is provided by the pgvector extension. A common way to store vectors is alongside the data they are embedding. For example, to store embeddings for documents, a common table structure is:sql CREATE TABLE IF NOT EXISTS document_embedding (
id BIGINT PRIMARY KEY GENERATED BY DEFAULT AS IDENTITY, document_id BIGINT FOREIGN KEY(document.id) metadata JSONB, contents TEXT, embedding VECTOR(1536))
This table contains a primary key, a foreign key to the document table, some metadata, the text being embedded (in the `contents` column) and the embedded vector. You may ask why not just add an embedding column to the document table? The answer is that there is a limit on the length of text an embedding can encode and so there needs to be a one-to-many relationship between the full document and its embeddings. The above table is just an illustration, it's totally fine to have a table without a foreign key and/or without a metadata column. The important thing is to have a column with the data being embedded and the vector in the same row, enabling you to return the raw data for a given similarity search query The vector type can specify an optional number of dimensions (1,538) in the example above). If specified, it enforces the constraint that all vectors in the column have that number of dimensions. A plain `VECTOR` (without specifying the number of dimensions) column is also possible and allows a variable number of dimensions. ## Query the vector embeddings The canonical query is:sql SELECT * FROM document_embedding ORDER BY embedding <=> $1 LIMIT 10
Which returns the 10 rows whose distance is the smallest. The distance function used here is cosine distance (specified by using the `<=>` operator). Other distance functions are available, see the [discussion][distance-functions]. The available distance types and their operators are: | Distance type | Operator | |------------------------|---------------| | Cosine/Angular | `<=>` | | Euclidean | `<->` | | Negative inner product | `<#>` | If you are using an index, you need to make sure that the distance function used in index creation is the same one used during query (see below). This is important because if you create your index with one distance function but query with another, your index cannot be used to speed up the query. ## Indexing the vector data using indexes provided by pgvector and pgvectorscale Indexing helps speed up similarity queries of the basic form:sql SELECT * FROM document_embedding ORDER BY embedding <=> $1 LIMIT 10
The key part is that the `ORDER BY` contains a distance measure against a constant or a pseudo-constant. Note that if performing a query without an index, you always get an exact result, but the query is slow (it has to read all of the data you store for every query). With an index, your queries are an order-of-magnitude faster, but the results are approximate (because there are no known indexing techniques that are exact see [here for more][vector-search-indexing]). <!-- vale Google.Colons = NO --> Nevertheless, there are excellent approximate algorithms. There are 3 different indexing algorithms available on TimescaleDB: StreamingDiskANN, HNSW, and ivfflat. Below is the trade-offs between these algorithms: <!-- vale Google.Colons = Yes --> | Algorithm | Build Speed | Query Speed | Need to rebuild after updates | |------------------|-------------|-------------|-------------------------------| | StreamingDiskANN | Fast | Fastest | No | | HNSW | Fast | Fast | No | | ivfflat | Fastest | Slowest | Yes | You can see [benchmarks](https://www.timescale.com/blog/how-we-made-postgresql-the-best-vector-database/) in the blog. For most use cases, the StreamingDiskANN index is recommended. Each of these indexes has a set of build-time options for controlling the speed/accuracy trade-off when creating the index and an additional query-time option for controlling accuracy during a particular query. You can see the details of each index below. ### StreamingDiskANN index The StreamingDiskANN index is a graph-based algorithm that was inspired by the [DiskANN](https://github.com/microsoft/DiskANN) algorithm. You can read more about it in [How We Made Postgres as Fast as Pinecone for Vector Data](https://www.timescale.com/blog/how-we-made-postgresql-as-fast-as-pinecone-for-vector-data). To create an index named `document_embedding_idx` on table `document_embedding` having a vector column named `embedding`, with cosine distance metric, run:sql CREATE INDEX document_embedding_cos_idx ON document_embedding USING diskann (embedding vector_cosine_ops);
Since this index uses cosine distance, you should use the `<=>` operator in your queries. StreamingDiskANN also supports L2 distance:sql CREATE INDEX document_embedding_l2_idx ON document_embedding USING diskann (embedding vector_l2_ops);
For L2 distance, use the `<->` operator in queries. These examples create the index with smart defaults for all parameters not listed. These should be the right values for most cases. But if you want to delve deeper, the available parameters are below. #### StreamingDiskANN index build-time parameters These parameters can be set when an index is created. | Parameter name | Description | Default value | |------------------|----------------------------------------------------------------------------------------------------------------------------------------------------------------|---------------| | `storage_layout` | `memory_optimized` which uses SBQ to compress vector data or `plain` which stores data uncompressed | memory_optimized | `num_neighbors` | Sets the maximum number of neighbors per node. Higher values increase accuracy but make the graph traversal slower. | 50 | | `search_list_size` | This is the S parameter used in the greedy search algorithm used during construction. Higher values improve graph quality at the cost of slower index builds. | 100 | | `max_alpha` | Is the alpha parameter in the algorithm. Higher values improve graph quality at the cost of slower index builds. | 1.2 | | `num_dimensions` | The number of dimensions to index. By default, all dimensions are indexed. But you can also index less dimensions to make use of [Matryoshka embeddings](https://huggingface.co/blog/matryoshka) | 0 (all dimensions) | `num_bits_per_dimension` | Number of bits used to encode each dimension when using SBQ | 2 for less than 900 dimensions, 1 otherwise An example of how to set the `num_neighbors` parameter is:sql CREATE INDEX document_embedding_idx ON document_embedding USING diskann (embedding) WITH(num_neighbors=50);
<!--- TODO: Add PQ options --> #### StreamingDiskANN query-time parameters You can also set two parameters to control the accuracy vs. query speed trade-off at query time. We suggest adjusting `diskann.query_rescore` to fine-tune accuracy. | Parameter name | Description | Default value | |------------------|----------------------------------------------------------------------------------------------------------------------------------------------------------------|---------------| | `diskann.query_search_list_size` | The number of additional candidates considered during the graph search. | 100 | `diskann.query_rescore` | The number of elements rescored (0 to disable rescoring) | 50 You can set the value by using `SET` before executing a query. For example:sql SET diskann.query_rescore = 400;
Note the [SET command](https://www.postgresql.org/docs/current/sql-set.html) applies to the entire session (database connection) from the point of execution. You can use a transaction-local variant using `LOCAL` which will be reset after the end of the transaction:sql BEGIN; SET LOCAL diskann.query_search_list_size= 10; SELECT * FROM document_embedding ORDER BY embedding <=> $1 LIMIT 10 COMMIT;
#### StreamingDiskANN index-supported queries You need to use the cosine-distance embedding measure (`<=>`) in your `ORDER BY` clause. A canonical query would be:sql SELECT * FROM document_embedding ORDER BY embedding <=> $1 LIMIT 10
### pgvector HNSW Pgvector provides a graph-based indexing algorithm based on the popular [HNSW algorithm](https://arxiv.org/abs/1603.09320). To create an index named `document_embedding_idx` on table `document_embedding` having a vector column named `embedding`, run:sql CREATE INDEX document_embedding_idx ON document_embedding USING hnsw(embedding vector_cosine_ops);
This command creates an index for cosine-distance queries because of `vector_cosine_ops`. There are also "ops" classes for Euclidean distance and negative inner product: | Distance type | Query operator | Index ops class | |------------------------|----------------|-------------------| | Cosine / Angular | `<=>` | `vector_cosine_ops` | | Euclidean / L2 | `<->` | `vector_ip_ops` | | Negative inner product | `<#>` | `vector_l2_ops` | Pgvector HNSW also includes several index build-time and query-time parameters. #### pgvector HNSW index build-time parameters These parameters can be set at index build time: | Parameter name | Description | Default value | |------------------|----------------------------------------------------------------------------------------------------------------------------------------------------------------|---------------| | `m` | Represents the maximum number of connections per layer. Think of these connections as edges created for each node during graph construction. Increasing m increases accuracy but also increases index build time and size. | 16 | | `ef_construction` | Represents the size of the dynamic candidate list for constructing the graph. It influences the trade-off between index quality and construction speed. Increasing `ef_construction` enables more accurate search results at the expense of lengthier index build times. | 64 | An example of how to set the m parameter is:sql CREATE INDEX document_embedding_idx ON document_embedding USING hnsw(embedding vector_cosine_ops) WITH (m = 20);
#### pgvector HNSW query-time parameters You can also set a parameter to control the accuracy vs. query speed trade-off at query time. The parameter is called `hnsw.ef_search`. This parameter specifies the size of the dynamic candidate list used during search. Defaults to 40. Higher values improve query accuracy while making the query slower. You can set the value by running:sql SET hnsw.ef_search = 100;
Before executing the query, note the [SET command](https://www.postgresql.org/docs/current/sql-set.html) applies to the entire session (database connection) from the point of execution. You can use a transaction-local variant using `LOCAL`:sql BEGIN; SET LOCAL hnsw.ef_search = 100; SELECT * FROM document_embedding ORDER BY embedding <=> $1 LIMIT 10 COMMIT;
#### pgvector HNSW index-supported queries You need to use the distance operator (`<=>`, `<->`, or `<#>`) matching the ops class you used during index creation in your `ORDER BY` clause. A canonical query would be:sql SELECT * FROM document_embedding ORDER BY embedding <=> $1 LIMIT 10
### pgvector ivfflat Pgvector provides a clustering-based indexing algorithm. The [blog post](https://www.timescale.com/blog/nearest-neighbor-indexes-what-are-ivfflat-indexes-in-pgvector-and-how-do-they-work) describes how it works in detail. It provides the fastest index-build speed but the slowest query speeds of any indexing algorithm. To create an index named `document_embedding_idx` on table `document_embedding` having a vector column named `embedding`, run:sql CREATE INDEX document_embedding_idx ON document_embedding USING ivfflat(embedding vector_cosine_ops) WITH (lists = 100);
This command creates an index for cosine-distance queries because of `vector_cosine_ops`. There are also "ops" classes for Euclidean distance and negative inner product: | Distance type | Query operator | Index ops class | |------------------------|----------------|-------------------| | Cosine / Angular | `<=>` | `vector_cosine_ops` | | Euclidean / L2 | `<->` | `vector_ip_ops` | | Negative inner product | `<#>` | `vector_l2_ops` | Note: *ivfflat should never be created on empty tables* because it needs to cluster data, and that only happens when an index is first created, not when new rows are inserted or modified. Also, if your table undergoes a lot of modifications, you need to rebuild this index occasionally to maintain good accuracy. See the [blog post](https://www.timescale.com/blog/nearest-neighbor-indexes-what-are-ivfflat-indexes-in-pgvector-and-how-do-they-work) for details. Pgvector ivfflat has a `lists` index parameter that should be set. See the next section. #### pgvector ivfflat index build-time parameters Pgvector has a `lists` parameter that should be set as follows: For datasets with less than one million rows, use lists = rows / 1000. For datasets with more than one million rows, use lists = sqrt(rows). It is generally advisable to have at least 10 clusters. You can use the following code to simplify creating ivfflat indexes:python def create_ivfflat_index(conn, table_name, column_name, query_operator="<=>"):
index_method = "invalid" if query_operator == "<->": index_method = "vector_l2_ops" elif query_operator == "<#>": index_method = "vector_ip_ops" elif query_operator == "<=>": index_method = "vector_cosine_ops" else: raise ValueError(f"unrecognized operator {query_operator}") with conn.cursor() as cur: cur.execute(f"SELECT COUNT(*) as cnt FROM {table_name};") num_records = cur.fetchone()[0] num_lists = num_records / 1000 if num_lists < 10: num_lists = 10 if num_records > 1000000: num_lists = math.sqrt(num_records) cur.execute(f'CREATE INDEX ON {table_name} USING ivfflat ({column_name} {index_method}) WITH (lists = {num_lists});') conn.commit()#### pgvector ivfflat query-time parameters You can also set a parameter to control the accuracy vs. query speed tradeoff at query time. The parameter is called `ivfflat.probes`. This parameter specifies the number of clusters searched during a query. It is recommended to set this parameter to `sqrt(lists)` where lists is the parameter used above during index creation. Higher values improve query accuracy while making the query slower. You can set the value by running:sql SET ivfflat.probes = 100;
Before executing the query, note the [SET command](https://www.postgresql.org/docs/current/sql-set.html) applies to the entire session (database connection) from the point of execution. You can use a transaction-local variant using `LOCAL`:sql BEGIN; SET LOCAL ivfflat.probes = 100; SELECT * FROM document_embedding ORDER BY embedding <=> $1 LIMIT 10 COMMIT;
#### pgvector ivfflat index-supported queries You need to use the distance operator (`<=>`, `<->`, or `<#>`) matching the ops class you used during index creation in your `ORDER BY` clause. A canonical query would be:sql SELECT * FROM document_embedding ORDER BY embedding <=> $1 LIMIT 10
===== PAGE: https://docs.tigerdata.com/ai/python-interface-for-pgvector-and-timescale-vector/ ===== # Python interface for pgvector and pgvectorscale You use pgai to power production grade AI applications. `timescale_vector` is the Python interface you use to interact with a pgai on Tiger Cloud service programmatically. Before you get started with `timescale_vector`: - [Sign up for pgai on Tiger Cloud](https://console.cloud.timescale.com/signup?utm_campaign=vectorlaunch&utm_source=docs&utm_medium=direct): Get 90 days free to try pgai on Tiger Cloud. - [Follow the Get Started Tutorial](https://timescale.github.io/python-vector/tsv_python_getting_started_tutorial.html): Learn how to use pgai on Tiger Cloud for semantic search on a real-world dataset. If you prefer to use an LLM development or data framework, see pgai's integrations with [LangChain](https://python.langchain.com/docs/integrations/vectorstores/timescalevector) and [LlamaIndex](https://gpt-index.readthedocs.io/en/stable/examples/vector_stores/Timescalevector.html). ## Prerequisites `timescale_vector` depends on the source distribution of `psycopg2` and adheres to [best practices for psycopg2](https://www.psycopg.org/docs/install.html#psycopg-vs-psycopg-binary). Before you install `timescale_vector`: * Follow the [psycopg2 build prerequisites](https://www.psycopg.org/docs/install.html#build-prerequisites). ## Install To interact with pgai on Tiger Cloud using Python: 1. Install `timescale_vector`: ```bash pip install timescale_vector ``` 1. Install `dotenv`: ```bash pip install python-dotenv ``` In these examples, you use `dotenv` to pass secrets and keys. That is it, you are ready to go. ## Basic usage of the timescale_vector library First, import all the necessary libraries:python from dotenv import load_dotenv, find_dotenv import os from timescale_vector import client import uuid from datetime import datetime, timedelta
Load up your Postgres credentials, the safest way is with a `.env` file:python _ = load_dotenv(find_dotenv(), override=True) service_url = os.environ['TIMESCALE_SERVICE_URL']
Next, create the client. This tutorial, uses the sync client. But the library has an async client as well (with an identical interface that uses async functions). The client constructor takes three required arguments: | name | description | |----------------|-------------------------------------------------------------------------------------------| | `service_url` | Tiger Cloud service URL / connection string | | `table_name` | Name of the table to use for storing the embeddings. Think of this as the collection name | | `num_dimensions` | Number of dimensions in the vector |python vec = client.Sync(service_url, "my_data", 2)
Next, create the tables for the collection:python vec.create_tables()
Next, insert some data. The data record contains: - A UUID to uniquely identify the embedding - A JSON blob of metadata about the embedding - The text the embedding represents - The embedding itself Because this data includes UUIDs which become primary keys, upserts should be used for ingest.python vec.upsert([
(uuid.uuid1(), {"animal": "fox"}, "the brown fox", [1.0,1.3]),\ (uuid.uuid1(), {"animal": "fox", "action":"jump"}, "jumped over the", [1.0,10.8]),\])
You can now create a vector index to speed up similarity search:python vec.create_embedding_index(client.TimescaleVectorIndex())
Then, you can query for similar items:python vec.search([1.0, 9.0])
[[UUID('73d05df0-84c1-11ee-98da-6ee10b77fd08'), {'action': 'jump', 'animal': 'fox'}, 'jumped over the', array([ 1. , 10.8], dtype=float32), 0.00016793422934946456], [UUID('73d05d6e-84c1-11ee-98da-6ee10b77fd08'), {'animal': 'fox'}, 'the brown fox', array([1. , 1.3], dtype=float32), 0.14489260377438218]] There are many search options which are covered below in the `Advanced search` section. A simple search example that returns one item using a similarity search constrained by a metadata filter is shown below:python vec.search([1.0, 9.0], limit=1, filter={"action": "jump"})
[[UUID('73d05df0-84c1-11ee-98da-6ee10b77fd08'), {'action': 'jump', 'animal': 'fox'}, 'jumped over the', array([ 1. , 10.8], dtype=float32), 0.00016793422934946456]] The returned records contain 5 fields: | name | description | |-----------|---------------------------------------------------------| | id | The UUID of the record | | metadata | The JSON metadata associated with the record | | contents | the text content that was embedded | | embedding | The vector embedding | | distance | The distance between the query embedding and the vector | You can access the fields by simply using the record as a dictionary keyed on the field name:python records = vec.search([1.0, 9.0], limit=1, filter={"action": "jump"}) (records[0]["id"],records[0]["metadata"], records[0]["contents"], records[0]["embedding"], records[0]["distance"])
(UUID('73d05df0-84c1-11ee-98da-6ee10b77fd08'), {'action': 'jump', 'animal': 'fox'}, 'jumped over the', array([ 1. , 10.8], dtype=float32), 0.00016793422934946456) You can delete by ID:python vec.delete_by_ids([records[0]["id"]])
Or you can delete by metadata filters:python vec.delete_by_metadata({"action": "jump"})
To delete all records use:python vec.delete_all()
## Advanced usage This section goes into more detail about the Python interface. It covers: 1. Search filter options - how to narrow your search by additional constraints 2. Indexing - how to speed up your similarity queries 3. Time-based partitioning - how to optimize similarity queries that filter on time 4. Setting different distance types to use in distance calculations ### Search options The `search` function is very versatile and allows you to search for the right vector in a wide variety of ways. This section describes the search option in 3 parts: 1. Basic similarity search. 2. How to filter your search based on the associated metadata. 3. Filtering on time when time-partitioning is enabled. The following examples are based on this data:python vec.upsert([
(uuid.uuid1(), {"animal":"fox", "action": "sit", "times":1}, "the brown fox", [1.0,1.3]),\ (uuid.uuid1(), {"animal":"fox", "action": "jump", "times":100}, "jumped over the", [1.0,10.8]),\])
The basic query looks like this:python vec.search([1.0, 9.0])
[[UUID('7487af96-84c1-11ee-98da-6ee10b77fd08'), {'times': 100, 'action': 'jump', 'animal': 'fox'}, 'jumped over the', array([ 1. , 10.8], dtype=float32), 0.00016793422934946456], [UUID('7487af14-84c1-11ee-98da-6ee10b77fd08'), {'times': 1, 'action': 'sit', 'animal': 'fox'}, 'the brown fox', array([1. , 1.3], dtype=float32), 0.14489260377438218]] You could provide a limit for the number of items returned:python vec.search([1.0, 9.0], limit=1)
[[UUID('7487af96-84c1-11ee-98da-6ee10b77fd08'), {'times': 100, 'action': 'jump', 'animal': 'fox'}, 'jumped over the', array([ 1. , 10.8], dtype=float32), 0.00016793422934946456]] #### Narrowing your search by metadata There are two main ways to filter results by metadata: - `filters` for equality matches on metadata. - `predicates` for complex conditions on metadata. Filters are more limited in what they can express, but are also more performant. You should use filters if your use case allows it. ##### Using filters for equality matches You could specify a match on the metadata as a dictionary where all keys have to match the provided values (keys not in the filter are unconstrained):python vec.search([1.0, 9.0], limit=1, filter={"action": "sit"})
[[UUID('7487af14-84c1-11ee-98da-6ee10b77fd08'), {'times': 1, 'action': 'sit', 'animal': 'fox'}, 'the brown fox', array([1. , 1.3], dtype=float32), 0.14489260377438218]] You can also specify a list of filter dictionaries, where an item is returned if it matches any dict:python vec.search([1.0, 9.0], limit=2, filter=[{"action": "jump"}, {"animal": "fox"}])
[[UUID('7487af96-84c1-11ee-98da-6ee10b77fd08'), {'times': 100, 'action': 'jump', 'animal': 'fox'}, 'jumped over the', array([ 1. , 10.8], dtype=float32), 0.00016793422934946456], [UUID('7487af14-84c1-11ee-98da-6ee10b77fd08'), {'times': 1, 'action': 'sit', 'animal': 'fox'}, 'the brown fox', array([1. , 1.3], dtype=float32), 0.14489260377438218]] ##### Using predicates for more advanced filtering on metadata Predicates allow for more complex search conditions. For example, you could use greater than and less than conditions on numeric values.python vec.search([1.0, 9.0], limit=2, predicates=client.Predicates("times", ">", 1))
[[UUID('7487af96-84c1-11ee-98da-6ee10b77fd08'), {'times': 100, 'action': 'jump', 'animal': 'fox'}, 'jumped over the', array([ 1. , 10.8], dtype=float32), 0.00016793422934946456]] `Predicates` objects are defined by the name of the metadata key, an operator, and a value. The supported operators are: `==`, `!=`, `<`, `<=`, `>`, `>=` The type of the values determines the type of comparison to perform. For example, passing in `"Sam"` (a string) performs a string comparison while a `10` (an int) performs an integer comparison, and a `10.0` (float) performs a float comparison. It is important to note that using a value of `"10"` performs a string comparison as well so it's important to use the right type. Supported Python types are: `str`, `int`, and `float`. One more example with a string comparison:python vec.search([1.0, 9.0], limit=2, predicates=client.Predicates("action", "==", "jump"))
[[UUID('7487af96-84c1-11ee-98da-6ee10b77fd08'), {'times': 100, 'action': 'jump', 'animal': 'fox'}, 'jumped over the', array([ 1. , 10.8], dtype=float32), 0.00016793422934946456]] The real power of predicates is that they can also be combined using the `&` operator (for combining predicates with `AND` semantics) and `|`(for combining using OR semantic). So you can do:python vec.search([1.0, 9.0], limit=2, predicates=client.Predicates("action", "==", "jump") & client.Predicates("times", ">", 1))
[[UUID('7487af96-84c1-11ee-98da-6ee10b77fd08'), {'times': 100, 'action': 'jump', 'animal': 'fox'}, 'jumped over the', array([ 1. , 10.8], dtype=float32), 0.00016793422934946456]] Just for sanity, the next example shows a case where no results are returned because of predicates:python vec.search([1.0, 9.0], limit=2, predicates=client.Predicates("action", "==", "jump") & client.Predicates("times", "==", 1))
[] And one more example where the predicates are defined as a variable and use grouping with parenthesis:python my_predicates = client.Predicates("action", "==", "jump") & (client.Predicates("times", "==", 1) | client.Predicates("times", ">", 1)) vec.search([1.0, 9.0], limit=2, predicates=my_predicates)
[[UUID('7487af96-84c1-11ee-98da-6ee10b77fd08'), {'times': 100, 'action': 'jump', 'animal': 'fox'}, 'jumped over the', array([ 1. , 10.8], dtype=float32), 0.00016793422934946456]] There is also semantic sugar for combining many predicates with `AND` semantics. You can pass in multiple 3-tuples to `Predicates`:python vec.search([1.0, 9.0], limit=2, predicates=client.Predicates(("action", "==", "jump"), ("times", ">", 10)))
[[UUID('7487af96-84c1-11ee-98da-6ee10b77fd08'), {'times': 100, 'action': 'jump', 'animal': 'fox'}, 'jumped over the', array([ 1. , 10.8], dtype=float32), 0.00016793422934946456]] #### Filter your search by time When using `time-partitioning` (see below) you can very efficiently filter your search by time. Time-partitioning associates the timestamp embedded in a UUID-based ID with an embedding. First, create a collection with time partitioning and insert some data (one item from January 2018 and another in January 2019):python tpvec = client.Sync(service_url, "time_partitioned_table", 2, time_partition_interval=timedelta(hours=6)) tpvec.create_tables()
specific_datetime = datetime(2018, 1, 1, 12, 0, 0) tpvec.upsert([
(client.uuid_from_time(specific_datetime), {"animal":"fox", "action": "sit", "times":1}, "the brown fox", [1.0,1.3]),\ (client.uuid_from_time(specific_datetime+timedelta(days=365)), {"animal":"fox", "action": "jump", "times":100}, "jumped over the", [1.0,10.8]),\])
Then, you can filter using the timestamps by specifying a `uuid_time_filter`:python tpvec.search([1.0, 9.0], limit=4, uuid_time_filter=client.UUIDTimeRange(specific_datetime, specific_datetime+timedelta(days=1)))
[[UUID('33c52800-ef15-11e7-be03-4f1f9a1bde5a'), {'times': 1, 'action': 'sit', 'animal': 'fox'}, 'the brown fox', array([1. , 1.3], dtype=float32), 0.14489260377438218]] A [`UUIDTimeRange`](https://timescale.github.io/python-vector/vector.html#uuidtimerange) can specify a `start_date` or `end_date` or both(as in the example above). Specifying only the `start_date` or `end_date` leaves the other end unconstrained.python tpvec.search([1.0, 9.0], limit=4, uuid_time_filter=client.UUIDTimeRange(start_date=specific_datetime))
[[UUID('ac8be800-0de6-11e9-889a-5eec84ba8a7b'), {'times': 100, 'action': 'jump', 'animal': 'fox'}, 'jumped over the', array([ 1. , 10.8], dtype=float32), 0.00016793422934946456], [UUID('33c52800-ef15-11e7-be03-4f1f9a1bde5a'), {'times': 1, 'action': 'sit', 'animal': 'fox'}, 'the brown fox', array([1. , 1.3], dtype=float32), 0.14489260377438218]] You have the option to define whether the start and end dates are inclusive with the `start_inclusive` and `end_inclusive` parameters. Setting `start_inclusive` to true results in comparisons using the `>=` operator, whereas setting it to false applies the `>` operator. By default, the start date is inclusive, while the end date is exclusive. One example:python tpvec.search([1.0, 9.0], limit=4, uuid_time_filter=client.UUIDTimeRange(start_date=specific_datetime, start_inclusive=False))
[[UUID('ac8be800-0de6-11e9-889a-5eec84ba8a7b'), {'times': 100, 'action': 'jump', 'animal': 'fox'}, 'jumped over the', array([ 1. , 10.8], dtype=float32), 0.00016793422934946456]] Notice how the results are different when using the `start_inclusive=False` option because the first row has the exact timestamp specified by `start_date`. It is also easy to integrate time filters using the `filter` and `predicates` parameters described above using special reserved key names to make it appear that the timestamps are part of your metadata. This is useful when integrating with other systems that just want to specify a set of filters (often these are "auto retriever" type systems). The reserved key names are `__start_date` and `__end_date` for filters and `__uuid_timestamp` for predicates. Some examples below:python tpvec.search([1.0, 9.0], limit=4, filter={ "start_date": specific_datetime, "end_date": specific_datetime+timedelta(days=1)})
[[UUID('33c52800-ef15-11e7-be03-4f1f9a1bde5a'), {'times': 1, 'action': 'sit', 'animal': 'fox'}, 'the brown fox', array([1. , 1.3], dtype=float32), 0.14489260377438218]]python tpvec.search([1.0, 9.0], limit=4,
predicates=client.Predicates("__uuid_timestamp", ">", specific_datetime) & client.Predicates("__uuid_timestamp", "<", specific_datetime+timedelta(days=1)))[[UUID('33c52800-ef15-11e7-be03-4f1f9a1bde5a'), {'times': 1, 'action': 'sit', 'animal': 'fox'}, 'the brown fox', array([1. , 1.3], dtype=float32), 0.14489260377438218]] ### Indexing Indexing speeds up queries over your data. By default, the system creates indexes to query your data by the UUID and the metadata. To speed up similarity search based on the embeddings, you have to create additional indexes. Note that if performing a query without an index, you always get an exact result, but the query is slow (it has to read all of the data you store for every query). With an index, your queries are order-of-magnitude faster, but the results are approximate (because there are no known indexing techniques that are exact). Luckily, TimescaleDB provides 3 excellent approximate indexing algorithms, StreamingDiskANN, HNSW, and ivfflat. Below are the trade-offs between these algorithms: | Algorithm | Build speed | Query speed | Need to rebuild after updates | |------------------|-------------|-------------|-------------------------------| | StreamingDiskAnn | Fast | Fastest | No | | HNSW | Fast | Faster | No | | ivfflat | Fastest | Slowest | Yes | You can see [benchmarks](https://www.timescale.com/blog/how-we-made-postgresql-the-best-vector-database/) on the blog. You should use the StreamingDiskANN index for most use cases. This can be created with:python vec.create_embedding_index(client.TimescaleVectorIndex())
Indexes are created for a particular distance metric type. So it is important that the same distance metric is set on the client during index creation as it is during queries. See the `distance type` section below. Each of these indexes has a set of build-time options for controlling the speed/accuracy trade-off when creating the index and an additional query-time option for controlling accuracy during a particular query. The library uses smart defaults for all of these options. The details for how to adjust these options manually are below. <!-- vale Google.Headings = NO --> #### StreamingDiskANN index <!-- vale Google.Headings = YES --> The StreamingDiskANN index is a graph-based algorithm that uses the [DiskANN](https://github.com/microsoft/DiskANN) algorithm. You can read more about it in the [blog](https://www.timescale.com/blog/how-we-made-postgresql-the-best-vector-database/) announcing its release. To create this index, run:python vec.create_embedding_index(client.TimescaleVectorIndex())
The above command creates the index using smart defaults. There are a number of parameters you could tune to adjust the accuracy/speed trade-off. The parameters you can set at index build time are: | Parameter name | Description | Default value | |------------------|---------------------------------------------------------------------------------------------------------------------------------------------------------------|---------------| | `num_neighbors` | Sets the maximum number of neighbors per node. Higher values increase accuracy but make the graph traversal slower. | 50 | | `search_list_size` | This is the S parameter used in the greedy search algorithm used during construction. Higher values improve graph quality at the cost of slower index builds. | 100 | | `max_alpha` | Is the alpha parameter in the algorithm. Higher values improve graph quality at the cost of slower index builds. | 1.0 | To set these parameters, you could run:python vec.create_embedding_index(client.TimescaleVectorIndex(num_neighbors=50, search_list_size=100, max_alpha=1.0))
You can also set a parameter to control the accuracy vs. query speed trade-off at query time. The parameter is set in the `search()` function using the `query_params` argument. You can set the `search_list_size`(default: 100). This is the number of additional candidates considered during the graph search at query time. Higher values improve query accuracy while making the query slower. You can specify this value during search as follows:python vec.search([1.0, 9.0], limit=4, query_params=TimescaleVectorIndexParams(search_list_size=10))
To drop the index, run:python vec.drop_embedding_index()
#### pgvector HNSW index Pgvector provides a graph-based indexing algorithm based on the popular [HNSW algorithm](https://arxiv.org/abs/1603.09320). To create this index, run:python vec.create_embedding_index(client.HNSWIndex())
The above command creates the index using smart defaults. There are a number of parameters you could tune to adjust the accuracy/speed trade-off. The parameters you can set at index build time are: | Parameter name | Description | Default value | |-----------------|------------------------------------------------------------------------------------------------------------------------------------------------------------------------------------------------------------------------------------------------------------------------|---------------| | `m` | Represents the maximum number of connections per layer. Think of these connections as edges created for each node during graph construction. Increasing m increases accuracy but also increases index build time and size. | 16 | | `ef_construction` | Represents the size of the dynamic candidate list for constructing the graph. It influences the trade-off between index quality and construction speed. Increasing `ef_construction` enables more accurate search results at the expense of lengthier index build times. | 64 | To set these parameters, you could run:python vec.create_embedding_index(client.HNSWIndex(m=16, ef_construction=64))
You can also set a parameter to control the accuracy vs. query speed trade-off at query time. The parameter is set in the `search()` function using the `query_params` argument. You can set the `ef_search`(default: 40). This parameter specifies the size of the dynamic candidate list used during search. Higher values improve query accuracy while making the query slower. You can specify this value during search as follows:python vec.search([1.0, 9.0], limit=4, query_params=HNSWIndexParams(ef_search=10))
To drop the index run:python vec.drop_embedding_index()
#### pgvector ivfflat index Pgvector provides a clustering-based indexing algorithm. The [blog post](https://www.timescale.com/blog/nearest-neighbor-indexes-what-are-ivfflat-indexes-in-pgvector-and-how-do-they-work/) describes how it works in detail. It provides the fastest index-build speed but the slowest query speeds of any indexing algorithm. To create this index, run:python vec.create_embedding_index(client.IvfflatIndex())
Note: *ivfflat should never be created on empty tables* because it needs to cluster data, and that only happens when an index is first created, not when new rows are inserted or modified. Also, if your table undergoes a lot of modifications, you need to rebuild this index occasionally to maintain good accuracy. See the [blog post](https://www.timescale.com/blog/nearest-neighbor-indexes-what-are-ivfflat-indexes-in-pgvector-and-how-do-they-work/) for details. Pgvector ivfflat has a `lists` index parameter that is automatically set with a smart default based on the number of rows in your table. If you know that you'll have a different table size, you can specify the number of records to use for calculating the `lists` parameter as follows:python vec.create_embedding_index(client.IvfflatIndex(num_records=1000000))
You can also set the `lists` parameter directly:python vec.create_embedding_index(client.IvfflatIndex(num_lists=100))
You can also set a parameter to control the accuracy vs. query speed trade-off at query time. The parameter is set in the `search()` function using the `query_params` argument. You can set the `probes`. This parameter specifies the number of clusters searched during a query. It is recommended to set this parameter to `sqrt(lists)` where lists is the `num_list` parameter used above during index creation. Higher values improve query accuracy while making the query slower. You can specify this value during search as follows:python vec.search([1.0, 9.0], limit=4, query_params=IvfflatIndexParams(probes=10))
To drop the index, run:python vec.drop_embedding_index()
### Time partitioning In many use cases where you have many embeddings, time is an important component associated with the embeddings. For example, when embedding news stories, you often search by time as well as similarity (for example, stories related to Bitcoin in the past week or stories about Clinton in November 2016). Yet, traditionally, searching by two components "similarity" and "time" is challenging for Approximate Nearest Neighbor (ANN) indexes and makes the similarity-search index less effective. One approach to solving this is partitioning the data by time and creating ANN indexes on each partition individually. Then, during search, you can: - Step 1: filter partitions that don't match the time predicate. - Step 2: perform the similarity search on all matching partitions. - Step 3: combine all the results from each partition in step 2, re-rank, and filter out results by time. Step 1 makes the search a lot more efficient by filtering out whole swaths of data in one go. Timescale-vector supports time partitioning using TimescaleDB's hypertables. To use this feature, simply indicate the length of time for each partition when creating the client:python from datetime import timedelta from datetime import datetime
python vec = client.Async(service_url, "my_data_with_time_partition", 2, time_partition_interval=timedelta(hours=6)) await vec.create_tables()
Then, insert data where the IDs use UUIDs v1 and the time component of the UUIDspecifies the time of the embedding. For example, to create an embedding for the current time, simply do:python id = uuid.uuid1() await vec.upsert([(id, {"key": "val"}, "the brown fox", [1.0, 1.2])])
To insert data for a specific time in the past, create the UUID using the `uuid_from_time` functionpython specific_datetime = datetime(2018, 8, 10, 15, 30, 0) await vec.upsert([(client.uuid_from_time(specific_datetime), {"key": "val"}, "the brown fox", [1.0, 1.2])])
You can then query the data by specifying a `uuid_time_filter` in the search call:python rec = await vec.search([1.0, 2.0], limit=4, uuid_time_filter=client.UUIDTimeRange(specific_datetime-timedelta(days=7), specific_datetime+timedelta(days=7)))
### Distance metrics Cosine distance is used by default to measure how similarly an embedding is to a given query. In addition to cosine distance, Euclidean/L2 distance is also supported. The distance type is set when creating the client using the `distance_type` parameter. For example, to use the Euclidean distance metric, you can create the client with:python vec = client.Sync(service_url, "my_data", 2, distance_type="euclidean")
Valid values for `distance_type` are `cosine` and `euclidean`. It is important to note that you should use consistent distance types on clients that create indexes and perform queries. That is because an index is only valid for one particular type of distance measure. Note that the StreamingDiskANN index only supports cosine distance at this time. ===== PAGE: https://docs.tigerdata.com/ai/langchain-integration-for-pgvector-and-timescale-vector/ ===== # LangChain Integration for pgvector, pgvectorscale, and pgai [LangChain](https://www.langchain.com/) is a popular framework for development applications powered by LLMs. pgai on Tiger Cloud has a native LangChain integration, enabling you to use it as a vector store and leverage all its capabilities in your applications built with LangChain. Here are resources about using pgai on Tiger Cloud with LangChain: - [Getting started with LangChain and pgvectorscale](https://python.langchain.com/docs/integrations/vectorstores/timescalevector): You'll learn how to use pgai on Tiger Data for (1) semantic search, (2) time-based vector search, (3) self-querying, and (4) how to create indexes to speed up queries. - [Postgres Self Querying](https://python.langchain.com/docs/integrations/retrievers/self_query/timescalevector_self_query): Learn how to use pgai on Tiger Data with self-querying in LangChain. - [Learn more about pgai on Tiger Data and LangChain](https://blog.langchain.dev/timescale-vector-x-langchain-making-postgresql-a-better-vector-database-for-ai-applications/): A blog post about the unique capabilities that pgai on Tiger Cloud brings to the LangChain ecosystem. ===== PAGE: https://docs.tigerdata.com/ai/llamaindex-integration-for-pgvector-and-timescale-vector/ ===== # LlamaIndex Integration for pgvector and Tiger Data Vector ## LlamaIndex integration for pgvector and Tiger Data Vector [LlamaIndex](https://www.llamaindex.ai/) is a popular data framework for connecting custom data sources to large language models (LLMs). Tiger Data Vector has a native LlamaIndex integration that supports all the features of pgvector and Tiger Data Vector. It enables you to use Tiger Data Vector as a vector store and leverage all its capabilities in your applications built with LlamaIndex. Here are resources about using Tiger Data Vector with LlamaIndex: - [Getting started with LlamaIndex and TigerData Vector](https://docs.llamaindex.ai/en/stable/examples/vector_stores/Timescalevector.html): You'll learn how to use Tiger Data Vector for (1) similarity search, (2) time-based vector search, (3) faster search with indexes, and (4) retrieval and query engine. - [Time-based retrieval](https://youtu.be/EYMZVfKcRzM?si=I0H3uUPgzKbQw__W): Learn how to power RAG applications with time-based retrieval. - [Llama Pack: Auto Retrieval with time-based search](https://github.com/run-llama/llama-hub/tree/main/llama_hub/llama_packs/timescale_vector_autoretrieval): This pack demonstrates performing auto-retrieval for hybrid search based on both similarity and time, using the timescale-vector (Postgres) vector store. - [Learn more about TigerData Vector and LlamaIndex ](https://www.timescale.com/blog/timescale-vector-x-llamaindex-making-postgresql-a-better-vector-database-for-ai-applications/): How Tiger Data Vector is a better Postgres for AI applications. ===== PAGE: https://docs.tigerdata.com/ai/pgvectorizer/ ===== # Embed your Postgres data with PgVectorizer ## Embed Postgres data with PgVectorizer PgVectorizer enables you to create vector embeddings from any data that you already have stored in Postgres. You can get more background information in the [blog post](https://www.timescale.com/blog/a-complete-guide-to-creating-and-storing-embeddings-for-postgresql-data/) announcing this feature, as well as the ["how we built it"](https://www.timescale.com/blog/how-we-designed-a-resilient-vector-embedding-creation-system-for-postgresql-data/) post going into the details of the design. To create vector embeddings, simply attach PgVectorizer to any Postgres table to automatically sync that table's data with a set of embeddings stored in Postgres. For example, say you have a blog table defined in the following way:python import psycopg2 from langchain.docstore.document import Document from langchain.text_splitter import CharacterTextSplitter from timescale_vector import client, pgvectorizer from langchain.embeddings.openai import OpenAIEmbeddings from langchain.vectorstores.timescalevector import TimescaleVector from datetime import timedelta
python with psycopg2.connect(service_url) as conn:
with conn.cursor() as cursor: cursor.execute(''' CREATE TABLE IF NOT EXISTS blog ( id INT PRIMARY KEY GENERATED BY DEFAULT AS IDENTITY, title TEXT NOT NULL, author TEXT NOT NULL, contents TEXT NOT NULL, category TEXT NOT NULL, published_time TIMESTAMPTZ NULL --NULL if not yet published ); ''')You can insert some data as follows:python with psycopg2.connect(service_url) as conn:
with conn.cursor() as cursor: cursor.execute(''' INSERT INTO blog (title, author, contents, category, published_time) VALUES ('First Post', 'Matvey Arye', 'some super interesting content about cats.', 'AI', '2021-01-01'); ''')Now, say you want to embed these blogs and store the embeddings in Postgres. First, you need to define an `embed_and_write` function that takes a set of blog posts, creates the embeddings, and writes them into TigerData Vector. For example, if using LangChain, it could look something like the following.python def get_document(blog):
text_splitter = CharacterTextSplitter( chunk_size=1000, chunk_overlap=200, ) docs = [] for chunk in text_splitter.split_text(blog['contents']): content = f"Author {blog['author']}, title: {blog['title']}, contents:{chunk}" metadata = { "id": str(client.uuid_from_time(blog['published_time'])), "blog_id": blog['id'], "author": blog['author'], "category": blog['category'], "published_time": blog['published_time'].isoformat(), } docs.append(Document(page_content=content, metadata=metadata)) return docsdef embed_and_write(blog_instances, vectorizer):
embedding = OpenAIEmbeddings() vector_store = TimescaleVector( collection_name="blog_embedding", service_url=service_url, embedding=embedding, time_partition_interval=timedelta(days=30), ) metadata_for_delete = [{"blog_id": blog['locked_id']} for blog in blog_instances] vector_store.delete_by_metadata(metadata_for_delete) documents = [] for blog in blog_instances: if blog['published_time'] != None: documents.extend(get_document(blog)) if len(documents) == 0: return texts = [d.page_content for d in documents] metadatas = [d.metadata for d in documents] ids = [d.metadata["id"] for d in documents] vector_store.add_texts(texts, metadatas, ids)Then, all you have to do is run the following code in a scheduled job (cron job, Lambda job, etc):python vectorizer = pgvectorizer.Vectorize(service_url, 'blog') while vectorizer.process(embed_and_write) > 0:
passEvery time that job runs, it syncs the table with your embeddings. It syncs all inserts, updates, and deletes to an embeddings table called `blog_embedding`. Now, you can simply search the embeddings as follows (again, using LangChain in the example):python embedding = OpenAIEmbeddings() vector_store = TimescaleVector(
collection_name="blog_embedding", service_url=service_url, embedding=embedding, time_partition_interval=timedelta(days=30),)
res = vector_store.similarity_search_with_score("Blogs about cats") res
[(Document(page_content='Author Matvey Arye, title: First Post, contents:some super interesting content about cats.', metadata={'id': '4a784000-4bc4-11eb-855a-06302dbc8ce7', 'author': 'Matvey Arye', 'blog_id': 1, 'category': 'AI', 'published_time': '2021-01-01T00:00:00+00:00'}), 0.12595687795193833)] ===== PAGE: https://docs.tigerdata.com/README/ ===== <div align=center> <picture align=center> <source media="(prefers-color-scheme: dark)" srcset="https://assets.timescale.com/docs/images/tigerdata-gradient-white.svg"> <source media="(prefers-color-scheme: light)" srcset="https://assets.timescale.com/docs/images/tigerdata-gradient-black.svg"> <img alt="Tiger Data logo" > </picture> </div> <div align=center> <h3>Tiger Cloud is the modern Postgres data platform for all your applications. It enhances Postgres to handle time series, events, real-time analytics, and vector search—all in a single database alongside transactional workloads. </h3> [](https://docs.tigerdata.com/) [](https://timescaledb.slack.com/archives/C4GT3N90X) [](https://console.cloud.timescale.com/signup) </div> This repository contains the current source for Tiger Data documentation available at https://docs.tigerdata.com/. We welcome contributions! You can contribute to Tiger Data documentation in the following ways: - [Create an issue][docs-issues] in this repository and describe the proposed change. Our doc team takes care of it. - Update the docs yourself and have your change reviewed and published by our doc team. ## Contribute to the Tiger Data docs To make the contribution yourself: 1. Get the documentation source: - No write access? [Fork this repository][github-fork]. - Already have a write access? [Clone this repository][github-clone]. 2. Create a branch from `latest`, make your changes, and raise a pull request back to `latest`. 3. Sign a Contributor License Agreement (CLA). You have to sign the CLA only the first time you raise a PR. This helps to ensure that the community is free to use your contributions. 4. Review your changes. The documentation site is generated in a separate private repository using [Gatsby][gatsby]. Once you raise a PR for any branch, GitHub **automatically** generates a preview for your changes and attaches the link in the comments. Any new commits are visible at the same URL. If you don't see the latest changes, try an incognito browser window. Automated builds are not available for PRs from forked repositories. See the [Contributing guide](CONTRIBUTING.md) for style and language guidance. ## Learn about Tiger Data Tiger Data is Postgres made powerful. To learn more about the company and its products, visit [tigerdata.com](https://www.tigerdata.com). ===== PAGE: https://docs.tigerdata.com/CONTRIBUTING/ ===== # Contribute to Tiger Data documentation Tiger Data documentation is open for contribution from all community members. The current source is in this repository. This page explains the structure and language guidelines for contributing to Tiger Data documentation. See the [README][readme] for how to contribute. ## Language Write in a clear, concise, and actionable manner. Tiger Data documentation uses the [Google Developer Documentation Style Guide][google-style] with the following exceptions: - Do not capitalize the first word after a colon. - Use code font (back ticks) for UI elements instead of semi-bold. ## Edit individual pages Each major doc section has a dedicated directory with `.md` files inside, representing its child pages. This includes an `index.md` file that serves as a landing page for that doc section by default, unless specifically changed in the navigation tree. To edit a page, modify the corresponding `.md` file following these recommendations: - **Regular pages** should include: - A short intro describing the main subject of the page. - A visual illustrating the main concept, if relevant. - Paragraphs with descriptive headers, organizing the content into logical sections. - Procedures to describe the sequence of steps to reach a certain goal. For example, create a Tiger Cloud service. - Other visual aids, if necessary. - Links to other relevant resources. - **API pages** should include: - The function name, with empty parentheses if it takes arguments. - A brief, specific description of the function, including any possible warnings. - One or two samples of the function being used to demonstrate argument syntax. - An argument table with `Name`, `Type`, `Default`, `Required`, `Description` columns. - A return table with `Column`, `Type`, and `Description` columns. - **Troubleshooting pages** are not written as whole Markdown files, but are programmatically assembled from individual files in the`_troubleshooting` folder. Each entry describes a single troubleshooting case and its solution, and contains the following front matter: |Key| Type |Required| Description | |-|-------|-|---------------------------------------------------------------------------------------------------------------------------------------------------------------------------------------| |`title`| string |✅| The title of the troubleshooting entry, displayed as a heading above it | |`section`| The literal string `troubleshooting` |✅| Must be `troubleshooting`, used to identify troubleshooting entries during site build | |`products` or `topics`| array of strings |✅ (can have either or both, but must have at least one)| The products or topics related to the entry. The entry shows up on the troubleshooting pages for the listed products and topics. | |`errors`| object of form `{language: string, message: string}` |❌| The error, if any, related to the troubleshooting entry. Displayed as a code block right underneath the title. `language` is the programming language to use for syntax highlighting. | |`keywords`| array of strings |❌| These are displayed at the bottom of every troubleshooting page. Each keyword links to a collection of all pages associated with that keyword. | |`tags`| array of strings |❌| Concepts, actions, or things associated with the troubleshooting entry. These are not displayed in the UI, but they affect the calculation of related pages. | Beneath the front matter, describe the error and its solution in regular Markdown. You can also use any other components allowed within the docs site. The entry shows up on the troubleshooting pages for its associated products and topics. If the page doesn't already exist, add an entry for it in the page index, setting `type` to `placeholder`. See [Navigation tree](#navigation-tree). ## Edit the navigation hierarchy The navigation hierarchy of a doc section is governed by `page-index/page-index.js` within the corresponding directory. For example:js
{ title: "Tiger Cloud services", href: "services", excerpt: "About Tiger Cloud services", children: [ { title: "Services overview", href: "service-overview", excerpt: "Tiger Cloud services overview", }, { title: "Service explorer", href: "service-explorer", excerpt: "Tiger Cloud services explorer", }, { title: "Troubleshooting Tiger Cloud services", href: "troubleshooting", type: "placeholder", }, ], },See [Use Tiger Cloud section navigation][use-navigation] for reference. To change the structure, add or delete pages in a section, modify the corresponding `page-index.js`. An entry in a `page-index.js` includes the following fields: | Key | Type | Required | Description | |--------------------|-----------------------------------------------------------|----------|---------------------------------------------------------------------------------------------------------------------------------------------------------------------------------------------------------------------------------------------------------------------------------------------------------------------------------------------------------------------------------------------------------------------------------------------------------------------------------------------------------------------------------------------------------------------------------------------------------------------------------------------------------------------------------------------------------------------------------------------------------------------------------------------| | `href` | string | ✅ | The URL segment to use for the page. If there is a corresponding Markdown file, `href` must match the name of the Markdown file, minus the file extension. | | `title` | string | ✅ | The title of the page, used as the page name within the TOC on the left. Must be the same as the first header in the corresponding Markdown file. | | `excerpt` | string | ✅ | The short description of the page, used for the page card if `pageComponents` is set to `featured-cards`. Should be up to 100 characters. See `pageComponents` for details. | | `type` | One of `[directory, placeholder, redirect-to-child-page]` | ❌ | If no type is specified, the page is built as a regular webpage. The structure of its children, if present, is defined by `children` entries and the corresponding structure of subfolders. If the type is `directory`, the corresponding file becomes a directory. The difference of the directory page is that its child pages sit at the same level as the `directory` page. They only become children during the site build. If the type is `placeholder`, the corresponding page is produced programmatically upon site build. If not produced, the link in the navigation tree returns a 404. In particular, this is used for troubleshooting pages. If the type is `redirect-to-child-page`, no page is built and the link in the navigation tree goes directly to the first child. | | `children` | Array of page entries | ❌ | Child pages of the current page. For regular pages, the children should be located in a directory with the same name as the parent. The parent is the `index.md` file in that directory. For`directory` pages, the children should be located in the same directory as the parent. | | `pageComponents` | One of `[['featured-cards'], ['content-list']]` | ❌ | Any page that has child pages can list its children in either card or list style at the bottom of the page. Specify the desired style with this key. | | `featuredChildren` | Array of URLs | ❌ | Similar to `pageComponents`, this displays the children of the current page, but only the selected ones. | | `index` | string | ❌ | If a section landing page needs to be different from the `index.md` file in that directory, this field specifies the corresponding Markdown file name. | ## Reuse text in multiple pages Partials allow you to reuse snippets of content in multiple places. All partials live in the `_partials` top-level directory. To make a new partial, create a new `.md` file in this directory. The filename must start with an underscore. Then import it into the target page as an `.mdx` file and reference in the relevant place. See [Formatting examples][formatting]. ## Formatting In addition to all the [regular Markdown formatting][markdown-syntax], the following elements are available for Tiger Data docs: - Procedure blocks - Highlight blocks - Tabs - Code blocks without line numbers and the copy button - Multi-tab code blocks - Tags See [Formatting examples][formatting] for how to use them. ## Variables Tiger Data documentation uses variables for its product names, features, and UI elements in Tiger Cloud Console with the following syntax: `$VARIABLE_NAME`. Variables do not work inside the following: - Front matter on each page - HTML tables and tabs See the [full list of available variables][variables]. ## Links - Internal page links: internal links do not need to include the domain name `https://docs.tigerdata.com`. Use the `:currentVersion:` variable instead of `latest` in the URL. - External links: input external links as is. See [Formatting examples][formatting] for details. ## Visuals When adding screenshots to the docs, aim for a full-screen view to provide better context. Reduce the size of your browser so there is as little wasted space as possible. Attach the image to your issue or PR, and the doc team uploads and inserts it for you. ## SEO optimization To make a documentation page more visible and clear for Google: - Include the `title` and `excerpt` meta tags at the top of the page. These represent meta title and description required for SEO optimization. - `title`: up to 60 characters, a short description of the page contents. In most cases a variation of the page title. - `excerpt`: under 200 characters, a longer description of the page contents. In most cases a variation of the page intro. - Summarize the contents of each paragraph in the first sentence of that paragraph. - Include main page keywords into the meta tags, page title, first header, and intro. These are usually the names of features described in the page. For example, for a page dedicated to creating hypertables, you can use the keyword **hypertable** in the following way: - Title: Create a hypertable in Tiger Cloud - Description: Turn a regular Postgres table into a hypertable in a few steps, using Tiger Cloud Console. - First header: Create a hypertable ## Docs for deprecated products The previous documentation source is in the deprecated repository called [docs.timescale.com-content][legacy-source]. ===== PAGE: https://docs.tigerdata.com/mst/index/ ===== # Managed Service for TimescaleDB Managed Service for TimescaleDB (MST) is [TimescaleDB ](https://github.com/timescale/timescaledb) hosted on Azure and GCP. MST is offered in partnership with Aiven. Tiger Cloud is a high-performance developer focused cloud that provides Postgres services enhanced with our blazing fast vector search. You can securely integrate Tiger Cloud with your AWS, GCS or Azure infrastructure. [Create a Tiger Cloud service][timescale-service] and try for free. If you need to run TimescaleDB on GCP or Azure, you're in the right place — keep reading. ===== PAGE: https://docs.tigerdata.com/.helper-scripts/README/ ===== # README This directory includes helper scripts for writing and editing docs content. It doesn't include scripts for building content; those are in the web-documentation repo. ## Bulk editing for API frontmatter API frontmatter metadata is stored with the API content it describes. This makes sense in most cases, but sometimes you want to bulk edit metadata or compare phrasing across all API references. There are 2 scripts to help with this. They are currently written to edit the `excerpts` field, but can be adapted for other fields. ### `extract_excerpts.sh` This extracts the excerpt from every API reference into a single file named `extracted_excerpts.md`. To use: 1. `cd` into the `_scripts/` directory. 1. If you already have an `extracted_excerpts.md` file from a previous run, delete it. 1. Run `./extract_excerpts.sh`. 1. Open `extracted_excerpts.md` and edit the excerpts directly within the file. Only change the actual excerpts, not the filename or `excerpt: ` label. Otherwise, the next script fails. ### `insert_excerpts.sh` This takes the edited excerpts from `extracted_excerpts.md` and updates the original files with the new edits. A backup is created so the data is saved if something goes horribly wrong. (If something goes wrong with the backup, you can always also restore from git.) To use: 1. Save your edited `extracted_excerpts.md`. 1. Make sure you are in the `_scripts/` directory. 1. Run `./insert_excerpts.sh`. 1. Run `git diff` to double-check that the update worked correctly. 1. Delete the unnecessary backups. ===== PAGE: https://docs.tigerdata.com/navigation/index/ ===== # Find a docs page Looking for information on something specific? There are several ways to find it: 1. For help with the [Tiger Cloud Console][cloud-console], try the [Tiger Cloud Console index][cloud-console-index]. 1. For help on a specific topic, try browsing by [keyword][keywords]. 1. Or try the [full search][search], which also returns results from the Tiger Data blog and forum. ===== PAGE: https://docs.tigerdata.com/about/index/ ===== # About Tiger Data products ===== PAGE: https://docs.tigerdata.com/use-timescale/index/ ===== # Use Tiger Data products This section contains information about using TimescaleDB and Tiger Cloud. If you're not sure how to find the information you need, try the [Find a docs page][find-docs] section. ===== PAGE: https://docs.tigerdata.com/use-timescale/OLD-cloud-multi-node/ ===== # Multi-node If you have a larger workload, you might need more than one Timescale instance. Multi-node can give you faster data ingest, and more responsive and efficient queries for many large workloads. This section shows you how to use multi-node on Timescale. You can also set up multi-node on [self-hosted TimescaleDB][multinode-timescaledb]. Early access: TimescaleDB v2.18.0 In some cases, your processing speeds could be slower in a multi-node cluster, because distributed hypertables need to push operations down to the various data nodes. It is important that you understand multi-node architecture before you begin, and plan your database according to your specific environment. ## Set up multi-node To create a multi-node cluster, you need an access node that stores metadata for the distributed hypertable and performs query planning across the cluster, and any number of data nodes that store subsets of the distributed hypertable dataset and run queries locally. ### Setting up multi-node 1. [Log in to your Tiger Cloud account][cloud-login] and click `Create Service`. 1. Click `Advanced configuration`. 1. Under `Choose your architecture`, click `Multi-node`. 1. The customer support team contacts you. When your request is approved, return to the screen for creating a multi-node service. 1. Choose your preferred region, or accept the default region of `us-east-1`. 1. Accept the default for the data nodes, or click `Edit` to choose the number of data nodes, and their compute and disk size. 1. Accept the default for the access node, or click `Edit` to choose the compute and disk size. 1. Click `Create service`. Take a note of the service information, you need these details to connect to your multi-node cluster. The service takes a few minutes to start up. 1. When the service is ready, you can see the service in the Service Overview page. Click on the name of your new multi-node service to see more information, and to make changes. <img class="main-content__illustration" src="https://assets.timescale.com/docs/images/tsc-running-service-multinode.png" alt="TimescaleDB running multi-node service"/> ===== PAGE: https://docs.tigerdata.com/_partials/_migrate_live_migration_rds_roles/ =====bash pg_dumpall -d "source" \ --quote-all-identifiers \ --roles-only \ --no-role-passwords \ --file=roles.sql
AWS RDS does not permit dumping of roles with passwords, which is why the above command is executed with the `--no-role-passwords`. However, when the migration of roles to your Tiger Cloud service is complete, you need to manually assign passwords to the necessary roles using the following command:`ALTER ROLE name WITH PASSWORD 'password';` Tiger Cloud services do not support roles with superuser access. If your SQL dump includes roles that have such permissions, you'll need to modify the file to be compliant with the security model. You can use the following `sed` command to remove unsupported statements and permissions from your roles.sql file:bash sed -i -E \ -e '/CREATE ROLE "postgres";/d' \ -e '/ALTER ROLE "postgres"/d' \ -e '/CREATE ROLE "rds/d' \ -e '/ALTER ROLE "rds/d' \ -e '/TO "rds/d' \ -e '/GRANT "rds/d' \ -e 's/(NO)*SUPERUSER//g' \ -e 's/(NO)*REPLICATION//g' \ -e 's/(NO)BYPASSRLS//g' \ -e 's/GRANTED BY "[^"]"//g' \ roles.sql
This command works only with the GNU implementation of sed (sometimes referred to as gsed). For the BSD implementation (the default on macOS), you need to add an extra argument to change the `-i` flag to `-i ''`. To check the sed version, you can use the command `sed --version`. While the GNU version explicitly identifies itself as GNU, the BSD version of sed generally doesn't provide a straightforward --version flag and simply outputs an "illegal option" error. A brief explanation of this script is: - `CREATE ROLE "postgres"`; and `ALTER ROLE "postgres"`: These statements are removed because they require superuser access, which is not supported by Timescale. - `(NO)SUPERUSER` | `(NO)REPLICATION` | `(NO)BYPASSRLS`: These are permissions that require superuser access. - `CREATE ROLE "rds`, `ALTER ROLE “rds`, `TO "rds`, `GRANT "rds`: Any creation or alteration of rds prefixed roles are removed because of their lack of any use in a Tiger Cloud service. Similarly, any grants to or from "rds" prefixed roles are ignored as well. - `GRANTED BY role_specification`: The GRANTED BY clause can also have permissions that require superuser access and should therefore be removed. Note: Per the TimescaleDB documentation, the GRANTOR in the GRANTED BY clause must be the current user, and this clause mainly serves the purpose of SQL compatibility. Therefore, it's safe to remove it. ===== PAGE: https://docs.tigerdata.com/_partials/_migrate_set_up_align_db_extensions_timescaledb/ ===== 1. Ensure that the source and target databases are running the same version of TimescaleDB. 1. Check the version of TimescaleDB running on your Tiger Cloud service: ```bash psql target -c "SELECT extversion FROM pg_extension WHERE extname = 'timescaledb';" ``` 1. Update the TimescaleDB extension in your source database to match the target service: If the TimescaleDB extension is the same version on the source database and target service, you do not need to do this. ```bash psql source -c "ALTER EXTENSION timescaledb UPDATE TO '<version here>';" ``` For more information and guidance, see [Upgrade TimescaleDB](https://docs.tigerdata.com/self-hosted/latest/upgrades/). 1. Ensure that the Tiger Cloud service is running the Postgres extensions used in your source database. 1. Check the extensions on the source database: ```bash psql source -c "SELECT * FROM pg_extension;" ``` 1. For each extension, enable it on your target Tiger Cloud service: ```bash psql target -c "CREATE EXTENSION IF NOT EXISTS <extension name> CASCADE;" ``` ===== PAGE: https://docs.tigerdata.com/_partials/_beta/ ===== This feature is in beta. Beta features are experimental, and should not be used on production systems. If you have feedback, reach out to your customer success manager, or [contact us](https://www.tigerdata.com/contact/). ===== PAGE: https://docs.tigerdata.com/_partials/_manage-a-data-exporter/ ===== ### Attach a data exporter to a Tiger Cloud service To send telemetry data to an external monitoring tool, you attach a data exporter to your Tiger Cloud service. You can attach only one exporter to a service. To attach an exporter: 1. **In [Tiger Cloud Console][console-services], choose the service** 1. **Click `Operations` > `Exporters`** 1. **Select the exporter, then click `Attach exporter`** 1. **If you are attaching a first `Logs` data type exporter, restart the service** ### Monitor Tiger Cloud service metrics You can now monitor your service metrics. Use the following metrics to check the service is running correctly: * `timescale.cloud.system.cpu.usage.millicores` * `timescale.cloud.system.cpu.total.millicores` * `timescale.cloud.system.memory.usage.bytes` * `timescale.cloud.system.memory.total.bytes` * `timescale.cloud.system.disk.usage.bytes` * `timescale.cloud.system.disk.total.bytes` Additionally, use the following tags to filter your results. |Tag|Example variable| Description | |-|-|----------------------------| |`host`|`us-east-1.timescale.cloud`| | |`project-id`|| | |`service-id`|| | |`region`|`us-east-1`| AWS region | |`role`|`replica` or `primary`| For service with replicas | |`node-id`|| For multi-node services | ### Edit a data exporter To update a data exporter: 1. **In Tiger Cloud Console, open [Exporters][console-integrations]** 1. **Next to the exporter you want to edit, click the menu > `Edit`** 1. **Edit the exporter fields and save your changes** You cannot change fields such as the provider or the AWS region. ### Delete a data exporter To remove a data exporter that you no longer need: 1. **Disconnect the data exporter from your Tiger Cloud services** 1. In [Tiger Cloud Console][console-services], choose the service. 1. Click `Operations` > `Exporters`. 1. Click the trash can icon. 1. Repeat for every service attached to the exporter you want to remove. The data exporter is now unattached from all services. However, it still exists in your project. 1. **Delete the exporter on the project level** 1. In Tiger Cloud Console, open [Exporters][console-integrations] 1. Next to the exporter you want to edit, click menu > `Delete` 1. Confirm that you want to delete the data exporter. ### Reference When you create the IAM OIDC provider, the URL must match the region you create the exporter in. It must be one of the following: | Region | Zone | Location | URL |------------------|---------------|----------------|--------------------| | `ap-southeast-1` | Asia Pacific | Singapore | `irsa-oidc-discovery-prod-ap-southeast-1.s3.ap-southeast-1.amazonaws.com` | `ap-southeast-2` | Asia Pacific | Sydney | `irsa-oidc-discovery-prod-ap-southeast-2.s3.ap-southeast-2.amazonaws.com` | `ap-northeast-1` | Asia Pacific | Tokyo | `irsa-oidc-discovery-prod-ap-northeast-1.s3.ap-northeast-1.amazonaws.com` | `ca-central-1` | Canada | Central | `irsa-oidc-discovery-prod-ca-central-1.s3.ca-central-1.amazonaws.com` | `eu-central-1` | Europe | Frankfurt | `irsa-oidc-discovery-prod-eu-central-1.s3.eu-central-1.amazonaws.com` | `eu-west-1` | Europe | Ireland | `irsa-oidc-discovery-prod-eu-west-1.s3.eu-west-1.amazonaws.com` | `eu-west-2` | Europe | London | `irsa-oidc-discovery-prod-eu-west-2.s3.eu-west-2.amazonaws.com` | `sa-east-1` | South America | São Paulo | `irsa-oidc-discovery-prod-sa-east-1.s3.sa-east-1.amazonaws.com` | `us-east-1` | United States | North Virginia | `irsa-oidc-discovery-prod.s3.us-east-1.amazonaws.com` | `us-east-2` | United States | Ohio | `irsa-oidc-discovery-prod-us-east-2.s3.us-east-2.amazonaws.com` | `us-west-2` | United States | Oregon | `irsa-oidc-discovery-prod-us-west-2.s3.us-west-2.amazonaws.com` ===== PAGE: https://docs.tigerdata.com/_partials/_early_access_2_18_0/ ===== Early access: TimescaleDB v2.18.0 ===== PAGE: https://docs.tigerdata.com/_partials/_multi-node-deprecation/ ===== [Multi-node support is sunsetted][multi-node-deprecation]. TimescaleDB v2.13 is the last release that includes multi-node support for Postgres versions 13, 14, and 15. ===== PAGE: https://docs.tigerdata.com/_partials/_migrate_prerequisites/ ===== Best practice is to use an [Ubuntu EC2 instance][create-ec2-instance] hosted in the same region as your Tiger Cloud service to move data. That is, the machine you run the commands on to move your data from your source database to your target Tiger Cloud service. Before you move your data: - Create a target [Tiger Cloud service][created-a-database-service-in-timescale]. Each Tiger Cloud service has a single Postgres instance that supports the [most popular extensions][all-available-extensions]. Tiger Cloud services do not support tablespaces, and there is no superuser associated with a service. Best practice is to create a Tiger Cloud service with at least 8 CPUs for a smoother experience. A higher-spec instance can significantly reduce the overall migration window. - To ensure that maintenance does not run while migration is in progress, best practice is to [adjust the maintenance window][adjust-maintenance-window]. ===== PAGE: https://docs.tigerdata.com/_partials/_migrate_open_support_request/ ===== You can open a support request directly from [Tiger Cloud Console][support-link], or by email to [support@tigerdata.com](mailto:support@tigerdata.com). ===== PAGE: https://docs.tigerdata.com/_partials/_install-self-hosted-debian-based-end/ ===== 1. **Update your local repository list** ```bash sudo apt update ``` 1. **Install TimescaleDB** ```bash sudo apt install timescaledb-2-postgresql-17 postgresql-client-17 ``` To install a specific TimescaleDB [release][releases-page], set the version. For example: `sudo apt-get install timescaledb-2-postgresql-14='2.6.0*' timescaledb-2-loader-postgresql-14='2.6.0*'` Older versions of TimescaleDB may not support all the OS versions listed on this page. 1. **Tune your Postgres instance for TimescaleDB** ```bash sudo timescaledb-tune ``` By default, this script is included with the `timescaledb-tools` package when you install TimescaleDB. Use the prompts to tune your development or production environment. For more information on manual configuration, see [Configuration][config]. If you have an issue, run `sudo apt install timescaledb-tools`. 1. **Restart Postgres** ```bash sudo systemctl restart postgresql ``` 1. **Log in to Postgres as `postgres`** ```bash sudo -u postgres psql ``` You are in the psql shell. 1. **Set the password for `postgres`** ```bash \password postgres ``` When you have set the password, type `\q` to exit psql. ===== PAGE: https://docs.tigerdata.com/_partials/_prereqs-cloud-and-self/ ===== To follow the procedure on this page you need to: * Create a [target Tiger Cloud service][create-service]. This procedure also works for [self-hosted TimescaleDB][enable-timescaledb]. ===== PAGE: https://docs.tigerdata.com/_partials/_migrate_live_setup_environment_awsrds/ ===== ## Set your connection strings These variables hold the connection information for the source database and target Tiger Cloud service. In Terminal on your migration machine, set the following:bash export SOURCE="postgres://:@:/" export TARGET="postgres://tsdbadmin:@:/tsdb?sslmode=require"
You find the connection information for your Tiger Cloud service in the configuration file you downloaded when you created the service. Avoid using connection strings that route through connection poolers like PgBouncer or similar tools. This tool requires a direct connection to the database to function properly. ## Align the extensions on the source and target 1. Ensure that the Tiger Cloud service is running the Postgres extensions used in your source database. 1. Check the extensions on the source database: ```bash psql source -c "SELECT * FROM pg_extension;" ``` 1. For each extension, enable it on your target Tiger Cloud service: ```bash psql target -c "CREATE EXTENSION IF NOT EXISTS <extension name> CASCADE;" ``` ## Tune your source database Updating parameters on a Postgres instance will cause an outage. Choose a time that will cause the least issues to tune this database. 1. **Update the DB instance parameter group for your source database** 1. In [https://console.aws.amazon.com/rds/home#databases:][databases], select the RDS instance to migrate. 1. Click `Configuration`, scroll down and note the `DB instance parameter group`, then click `Parameter groups` <img class="main-content__illustration" src="https://assets.timescale.com/docs/images/migrate/awsrds-parameter-groups.png" alt="Create security rule to enable RDS EC2 connection"/> 1. Click `Create parameter group`, fill in the form with the following values, then click `Create`. - **Parameter group name** - whatever suits your fancy. - **Description** - knock yourself out with this one. - **Engine type** - `PostgreSQL` - **Parameter group family** - the same as `DB instance parameter group` in your `Configuration`. 1. In `Parameter groups`, select the parameter group you created, then click `Edit`. 1. Update the following parameters, then click `Save changes`. - `rds.logical_replication` set to `1`: record the information needed for logical decoding. - `wal_sender_timeout` set to `0`: disable the timeout for the sender process. 1. In RDS, navigate back to your [databases][databases], select the RDS instance to migrate, and click `Modify`. 1. Scroll down to `Database options`, select your new parameter group, and click `Continue`. 1. Click `Apply immediately` or choose a maintenance window, then click `Modify DB instance`. Changing parameters will cause an outage. Wait for the database instance to reboot before continuing. 1. Verify that the settings are live in your database. 1. **Enable replication `DELETE` and`UPDATE` operations** Replica identity assists data replication by identifying the rows being modified. Your options are that each table and hypertable in the source database should either have: - **A primary key**: data replication defaults to the primary key of the table being replicated. Nothing to do. - **A viable unique index**: each table has a unique, non-partial, non-deferrable index that includes only columns marked as `NOT NULL`. If a UNIQUE index does not exist, create one to assist the migration. You can delete if after migration. For each table, set `REPLICA IDENTITY` to the viable unique index:shell psql -X -d source -c 'ALTER TABLE REPLICA IDENTITY USING INDEX <_index_name>'
- **No primary key or viable unique index**: use brute force. For each table, set `REPLICA IDENTITY` to `FULL`:shell psql -X -d source -c 'ALTER TABLE {table_name} REPLICA IDENTITY FULL'
For each `UPDATE` or `DELETE` statement, Postgres reads the whole table to find all matching rows. This results in significantly slower replication. If you are expecting a large number of `UPDATE` or `DELETE` operations on the table, best practice is to not use `FULL`. ===== PAGE: https://docs.tigerdata.com/_partials/_migrate_source_target_note/ ===== In the context of migrations, your existing production database is referred to as the SOURCE database, the Tiger Cloud service that you are migrating your data to is the TARGET. ===== PAGE: https://docs.tigerdata.com/_partials/_not-available-in-free-plan/ ===== This feature is not available under the Free pricing plan. ===== PAGE: https://docs.tigerdata.com/_partials/_migrate_live_migration_docker_subcommand/ ===== Next, download the live-migration docker image:sh docker run --rm -it --name live-migration
-e PGCOPYDB_SOURCE_PGURI=source \ -e PGCOPYDB_TARGET_PGURI=target \ --pid=host \ -v ~/live-migration:/opt/timescale/ts_cdc \ timescale/live-migration:latest --helpLive migration moves your PostgreSQL/TimescaleDB to your Tiger Cloud service with minimal downtime.
options: -h, --help Show this help message and exit -v, --version Show the version of live-migration tool
Subcommands: {snapshot,clean,migrate}
Subcommand help snapshot Create a snapshot clean Clean up resources migrate Start the migrationLive-migration contains 3 subcommands: 1. Snapshot 1. Clean 1. Migrate On a high-level, the `snapshot` subcommand creates a Postgres snapshot connection to the source database along with a replication slot. This is pre-requisite before running the `migrate` subcommand. The `migrate` subcommand carries out the live-migration process by taking help of the snapshot and replication slot created by the `snapshot` subcommand. The `clean` subcommand is designed to remove resources related to live migration. It should be run once the migration has successfully completed or, if you need to restart the migration process from the very start. You should not run `clean` if you want to resume the last interrupted live migration. ### 3.a Create a snapshot Execute this command to establish a snapshot connection; do not interrupt the process. For convenience, consider using a terminal multiplexer such as `tmux` or `screen`, which enables the command to run in the background.sh docker run --rm -it --name live-migration-snapshot
-e PGCOPYDB_SOURCE_PGURI=source \ -e PGCOPYDB_TARGET_PGURI=target \ --pid=host \ -v ~/live-migration:/opt/timescale/ts_cdc \ timescale/live-migration:latest snapshotIn addition to creating a snapshot, this process also validates prerequisites on the source and target to ensure the database instances are ready for replication. For example, it checks if all tables on the source have either a PRIMARY KEY or REPLICA IDENTITY set. If not, it displays a warning message listing the tables without REPLICA IDENTITY and waits for user confirmation before proceeding with the snapshot creation.sh 2024-03-25T12:40:40.884 WARNING: The following tables in the Source DB have neither a primary key nor a REPLICA IDENTITY (FULL/INDEX) 2024-03-25T12:40:40.884 WARNING: UPDATE and DELETE statements on these tables will not be replicated to the Target DB 2024-03-25T12:40:40.884 WARNING: - public.metrics Press 'c' and ENTER to continue
### 3.b Perform live-migration The `migrate` subcommand supports following flagssh docker run --rm -it --name live-migration-migrate
-e PGCOPYDB_SOURCE_PGURI=source \ -e PGCOPYDB_TARGET_PGURI=target \ --pid=host \ -v ~/live-migration:/opt/timescale/ts_cdc \ timescale/live-migration:latest migrate --helpusage: main.py migrate [-h] [--dir DIR] [--resume] [--skip-roles] [--table-jobs TABLE_JOBS] [--index-jobs INDEX_JOBS]
[--skip-extensions [SKIP_EXTENSIONS ...]] [--skip-table-data SKIP_TABLE_DATA [SKIP_TABLE_DATA ...]]options: -h, --help Show this help message and exit --resume Resume the migration --skip-roles Skip roles migration --table-jobs TABLE_JOBS
Number of parallel jobs to copy "existing data" from source db to target db (Default: 8)--index-jobs INDEX_JOBS
Number of parallel jobs to create indexes in target db (Default: 8)--skip-extensions [SKIP_EXTENSIONS ...]
Skips the given extensions during migration. Empty list skips all extensions.--skip-table-data SKIP_TABLE_DATA [SKIP_TABLE_DATA ...]
Skips data from the given table during migration. However, the table schema will be migrated. To skip data from a Hypertable, you will need to specify a list of schema qualified chunks belonging to the Hypertable. Currently, this flag does not skip data during live replay from the specified table. Values for this flag must be schema qualified. Eg: --skip-table-data public.exclude_table_1 public.exclude_table_2Next, we will start the migration process. Open a new terminal and initiate the live migration, and allow it to run uninterrupted.sh docker run --rm -it --name live-migration-migrate
-e PGCOPYDB_SOURCE_PGURI=source \ -e PGCOPYDB_TARGET_PGURI=target \ --pid=host \ -v ~/live-migration:/opt/timescale/ts_cdc \ timescale/live-migration:latest migrateIf the migrate command stops for any reason during execution, you can resume the migration from where it left off by adding a `--resume` flag. This is only possible if the `snapshot` command is intact and if a volume mount, such as `~/live-migration`, is utilized. ===== PAGE: https://docs.tigerdata.com/_partials/_migrate_live_migration_step2/ ===== For the sake of convenience, connection strings to the source and target databases are referred to as `source` and `target` throughout this guide. This can be set in your shell, for example:bash export SOURCE="postgres://:@:/" export TARGET="postgres://:@:/"
Do not use a Tiger Cloud connection pooler connection for live migration. There are a number of issues which can arise when using a connection pooler, and no advantage. Very small instances may not have enough connections configured by default, in which case you should modify the value of `max_connections`, in your instance, as shown on [Configure database parameters][configure-instance-parameters]. It's important to ensure that the `old_snapshot_threshold` value is set to the default value of `-1` in your source database. This prevents Postgres from treating the data in a snapshot as outdated. If this value is set other than `-1`, it might affect the existing data migration step. To check the current value of `old_snapshot_threshold`, run the command:sh psql -X -d source -c 'show old_snapshot_threshold'
If the query returns something other than `-1`, you must change it. If you have a superuser on a self-hosted database, run the following command:sh psql -X -d source -c 'alter system set old_snapshot_threshold=-1'
Otherwise, if you are using a managed service, use your cloud provider's configuration mechanism to set `old_snapshot_threshold` to `-1`. Next, you should set `wal_level` to `logical` so that the write-ahead log (WAL) records information that is needed for logical decoding. To check the current value of `wal_level`, run the command:sh psql -X -d source -c 'show wal_level'
If the query returns something other than `logical`, you must change it. If you have a superuser on a self-hosted database, run the following command:sh psql -X -d source -c 'alter system set wal_level=logical'
Otherwise, if you are using a managed service, use your cloud provider's configuration mechanism to set `wal_level` to `logical`. Restart your database for the changes to take effect, and verify that the settings are reflected in your database. ===== PAGE: https://docs.tigerdata.com/_partials/_prometheus-integrate/ ===== [Prometheus][prometheus] is an open-source monitoring system with a dimensional data model, flexible query language, and a modern alerting approach. This page shows you how to export your service telemetry to Prometheus: - For Tiger Cloud, using a dedicated Prometheus exporter in Tiger Cloud Console. - For self-hosted TimescaleDB, using [Postgres Exporter][postgresql-exporter]. ## Prerequisites To follow the steps on this page: - [Download and run Prometheus][install-prometheus]. - For Tiger Cloud: Create a target [Tiger Cloud service][create-service] with the time-series and analytics capability enabled. - For self-hosted TimescaleDB: - Create a target [self-hosted TimescaleDB][enable-timescaledb] instance. You need your [connection details][connection-info]. - [Install Postgres Exporter][install-exporter]. To reduce latency and potential data transfer costs, install Prometheus and Postgres Exporter on a machine in the same AWS region as your Tiger Cloud service. ## Export Tiger Cloud service telemetry to Prometheus To export your data, do the following: To export metrics from a Tiger Cloud service, you create a dedicated Prometheus exporter in Tiger Cloud Console, attach it to your service, then configure Prometheus to scrape metrics using the exposed URL. The Prometheus exporter exposes the metrics related to the Tiger Cloud service like CPU, memory, and storage. To scrape other metrics, use Postgres Exporter as described for self-hosted TimescaleDB. The Prometheus exporter is available for [Scale and Enterprise][pricing-plan-features] pricing plans. 1. **Create a Prometheus exporter** 1. In [Tiger Cloud Console][open-console], click `Exporters` > `+ New exporter`. 1. Select `Metrics` for data type and `Prometheus` for provider. 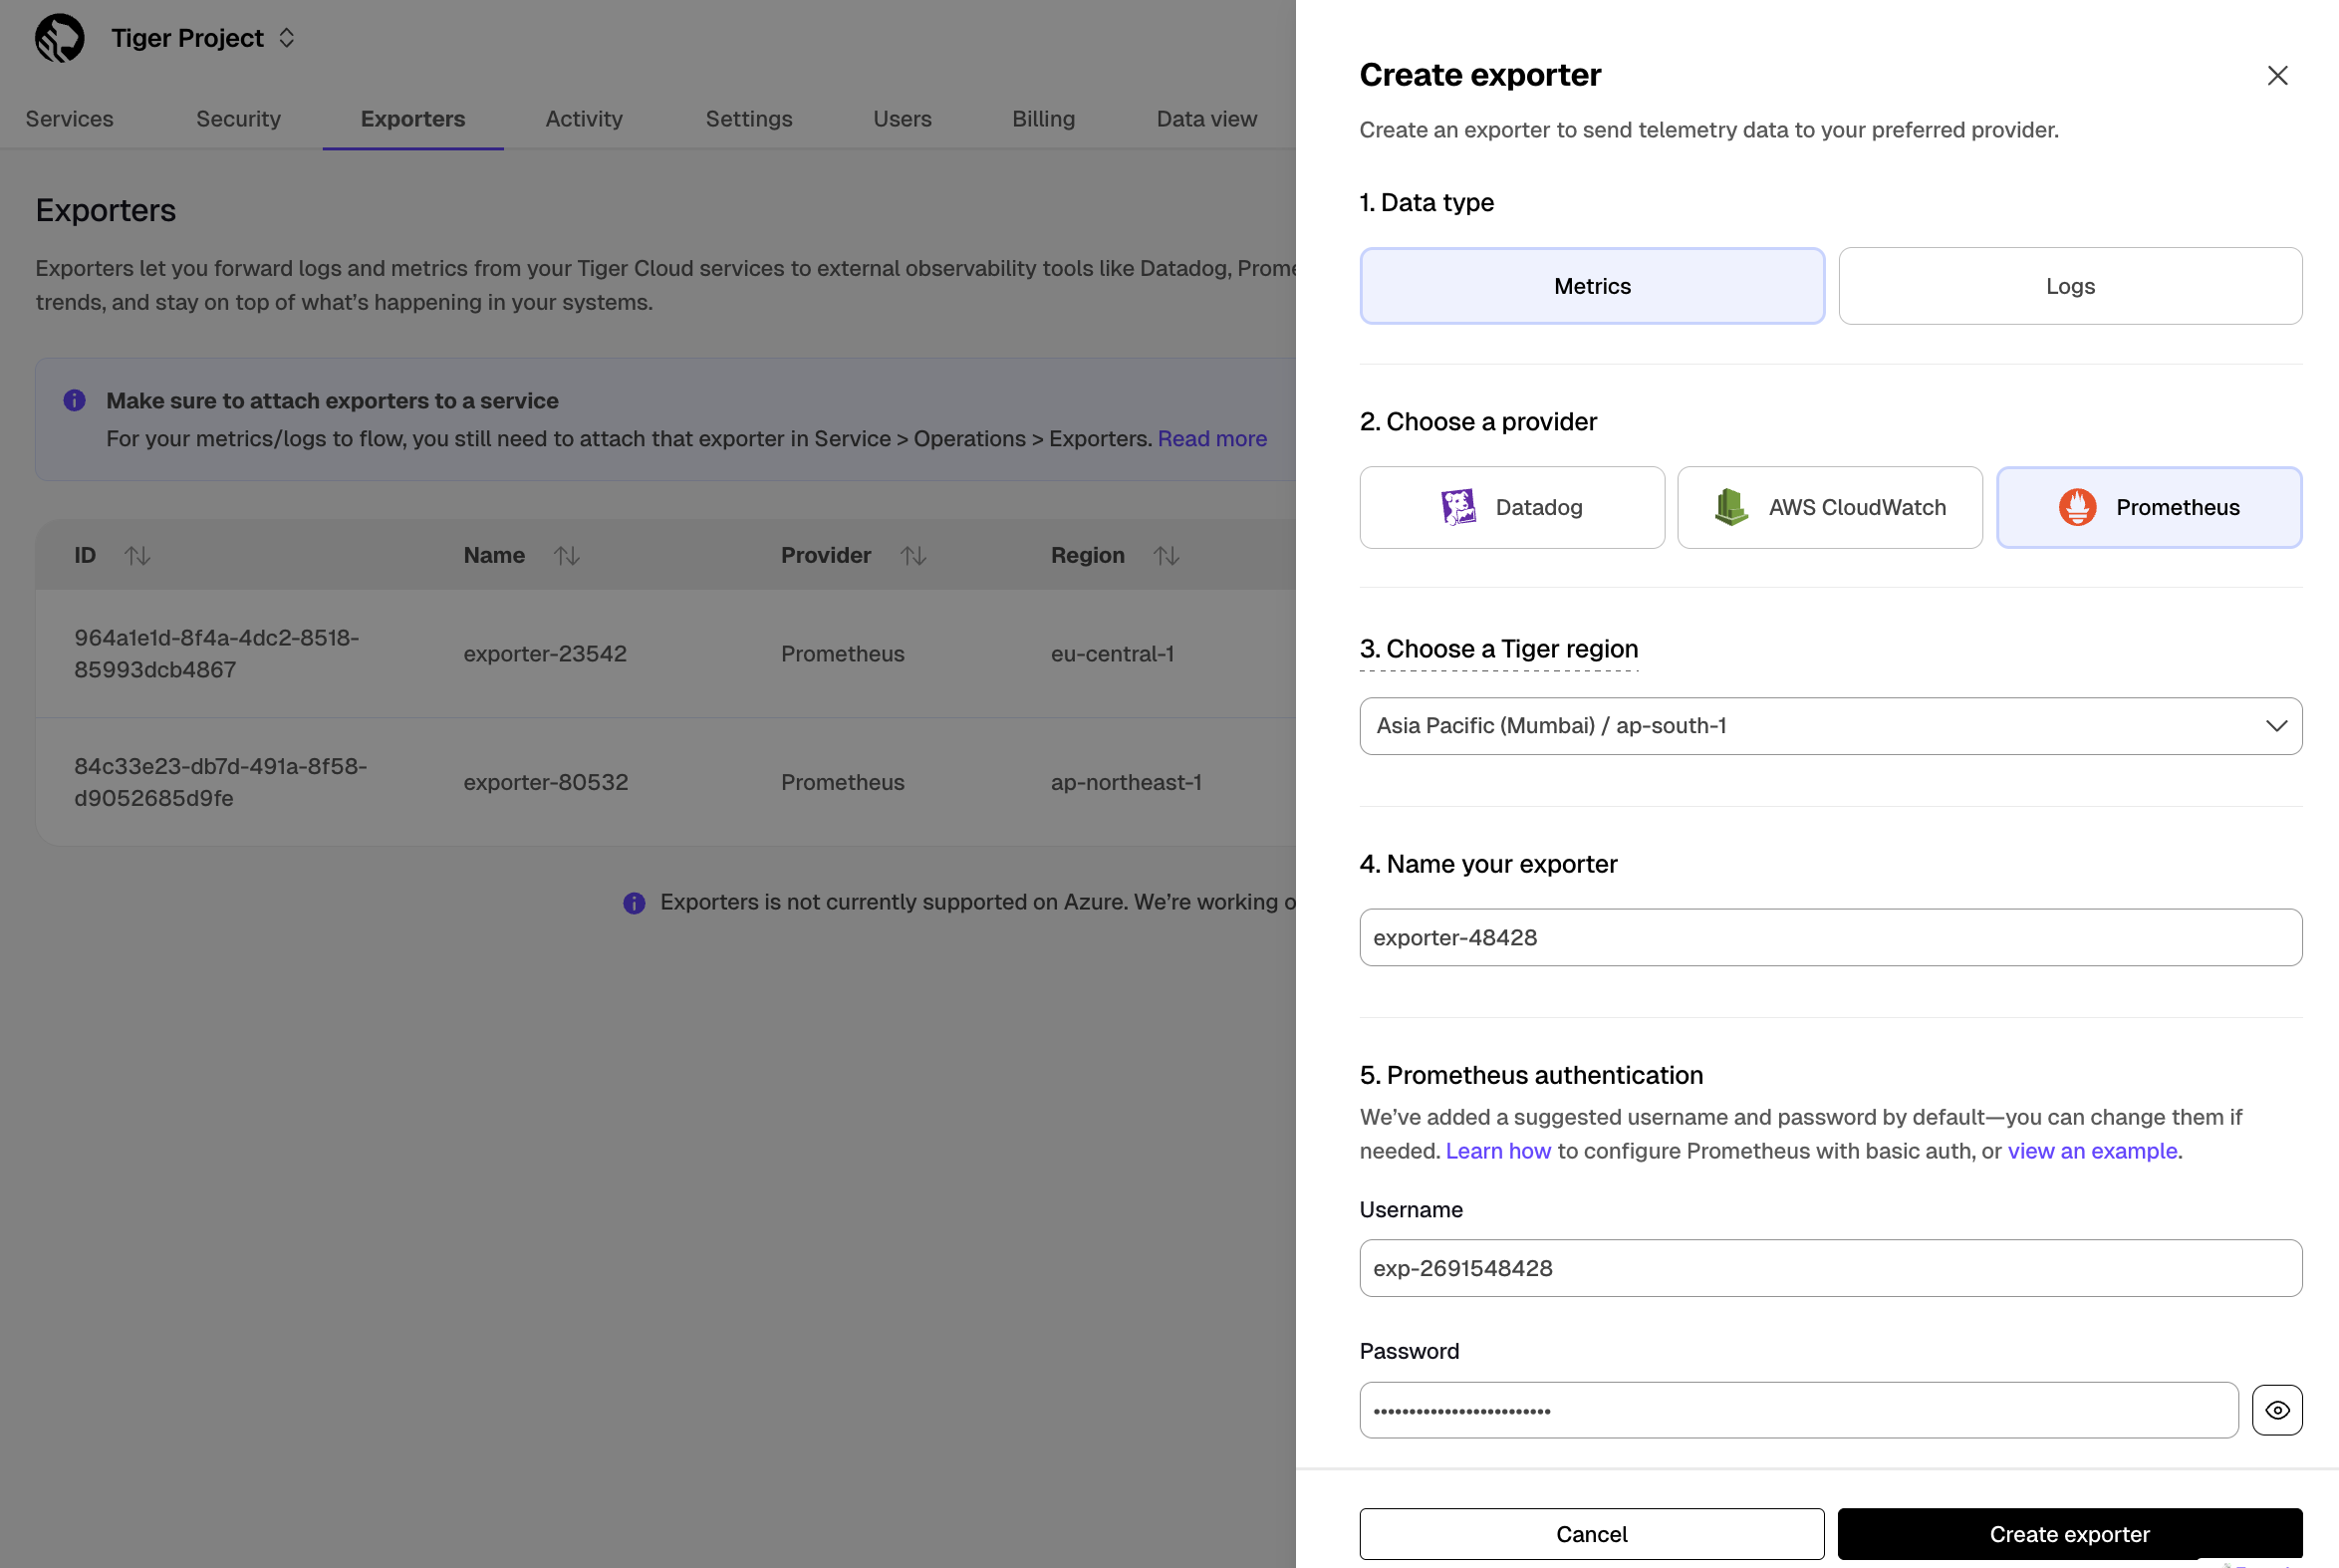 1. Choose the region for the exporter. Only services in the same project and region can be attached to this exporter. 1. Name your exporter. 1. Change the auto-generated Prometheus credentials, if needed. See [official documentation][prometheus-authentication] on basic authentication in Prometheus. 1. **Attach the exporter to a service** 1. Select a service, then click `Operations` > `Exporters`. 1. Select the exporter in the drop-down, then click `Attach exporter`. 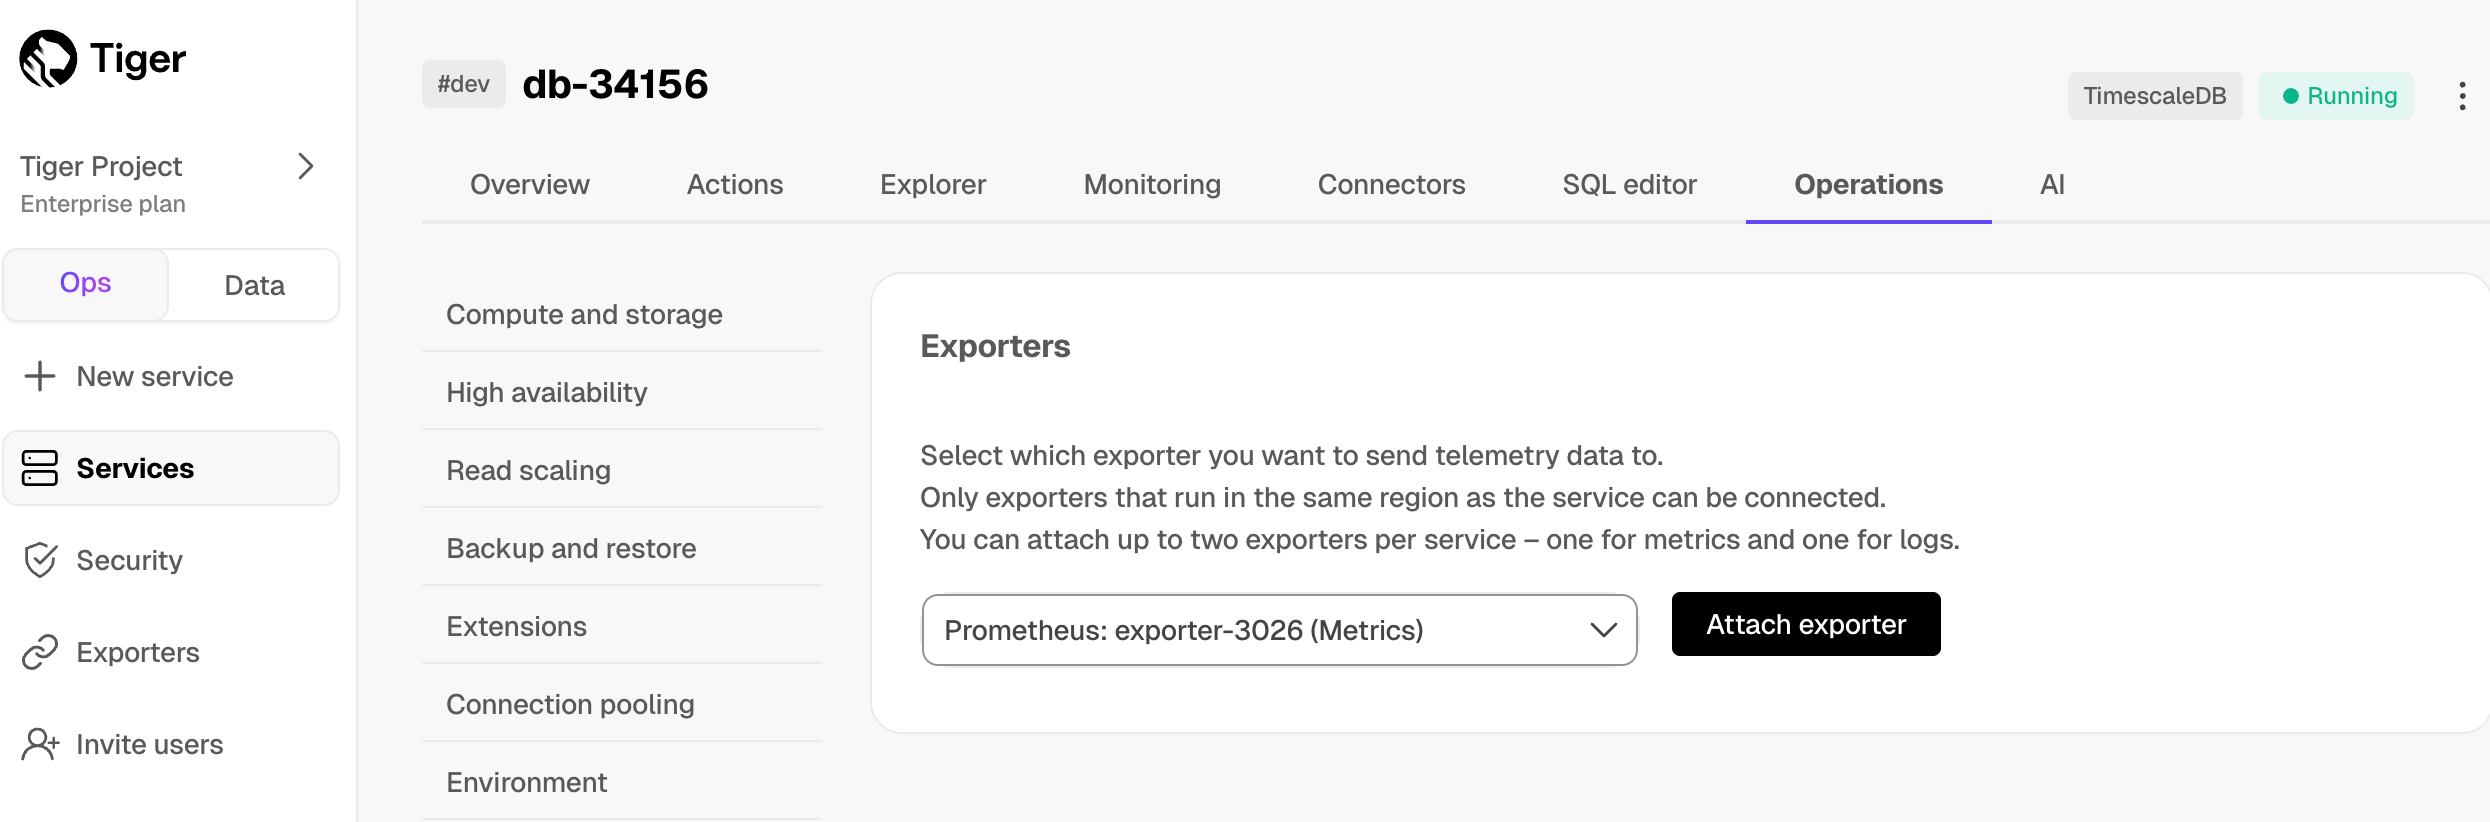 The exporter is now attached to your service. To unattach it, click the trash icon in the exporter list. 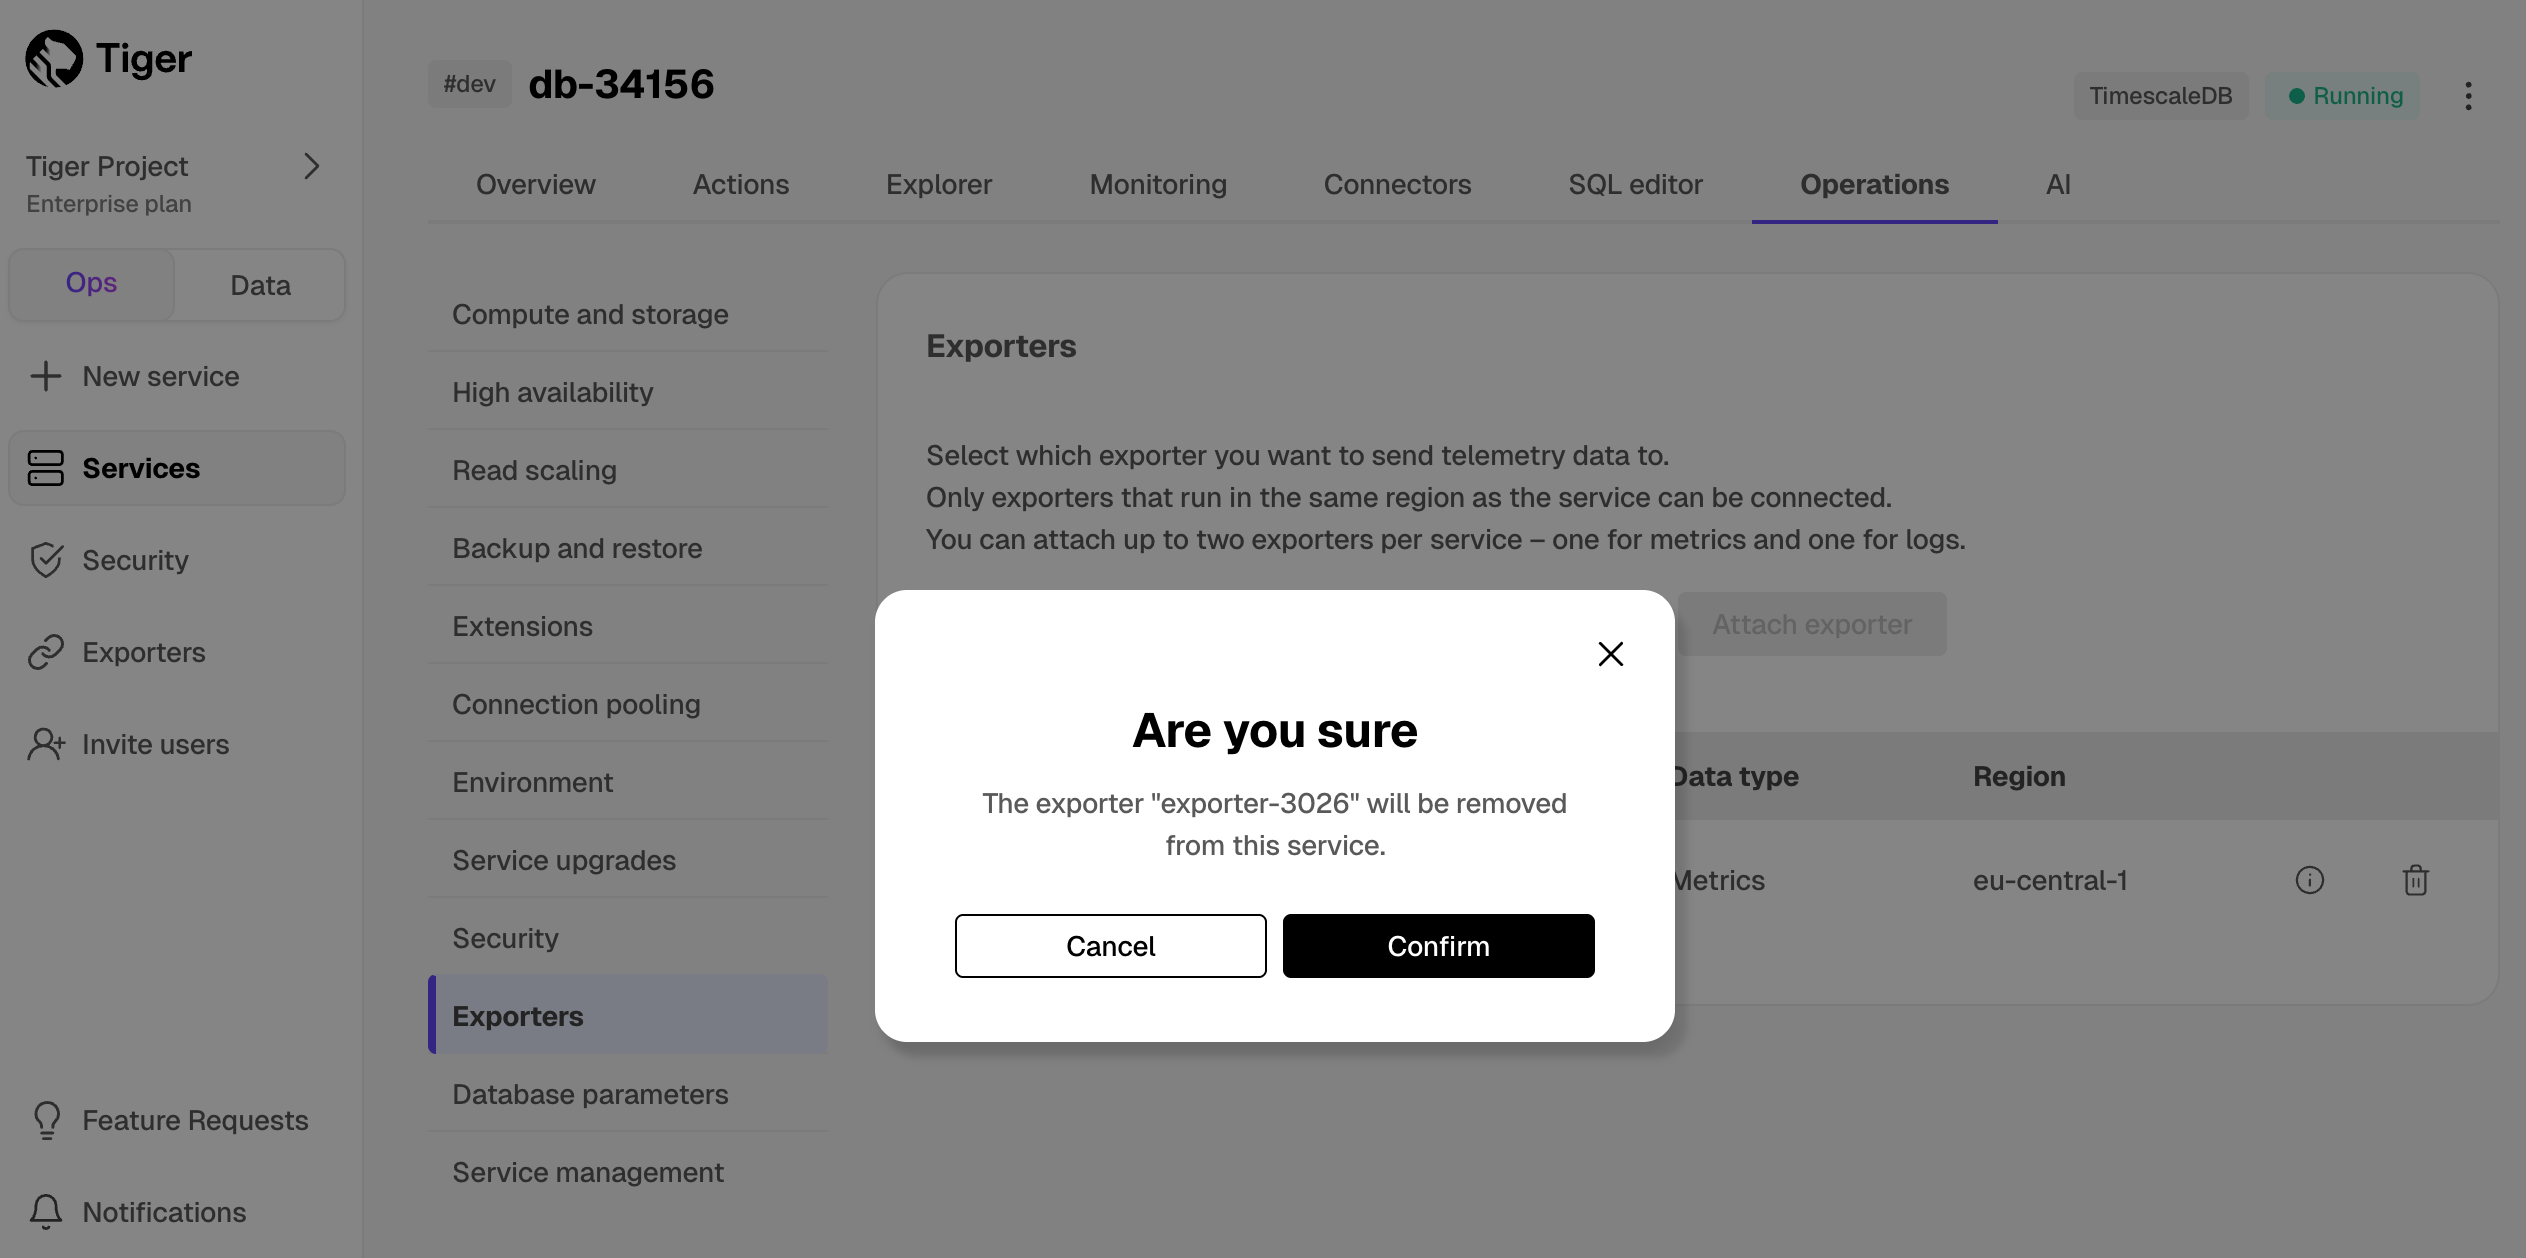 1. **Configure the Prometheus scrape target** 1. Select your service, then click `Operations` > `Exporters` and click the information icon next to the exporter. You see the exporter details. 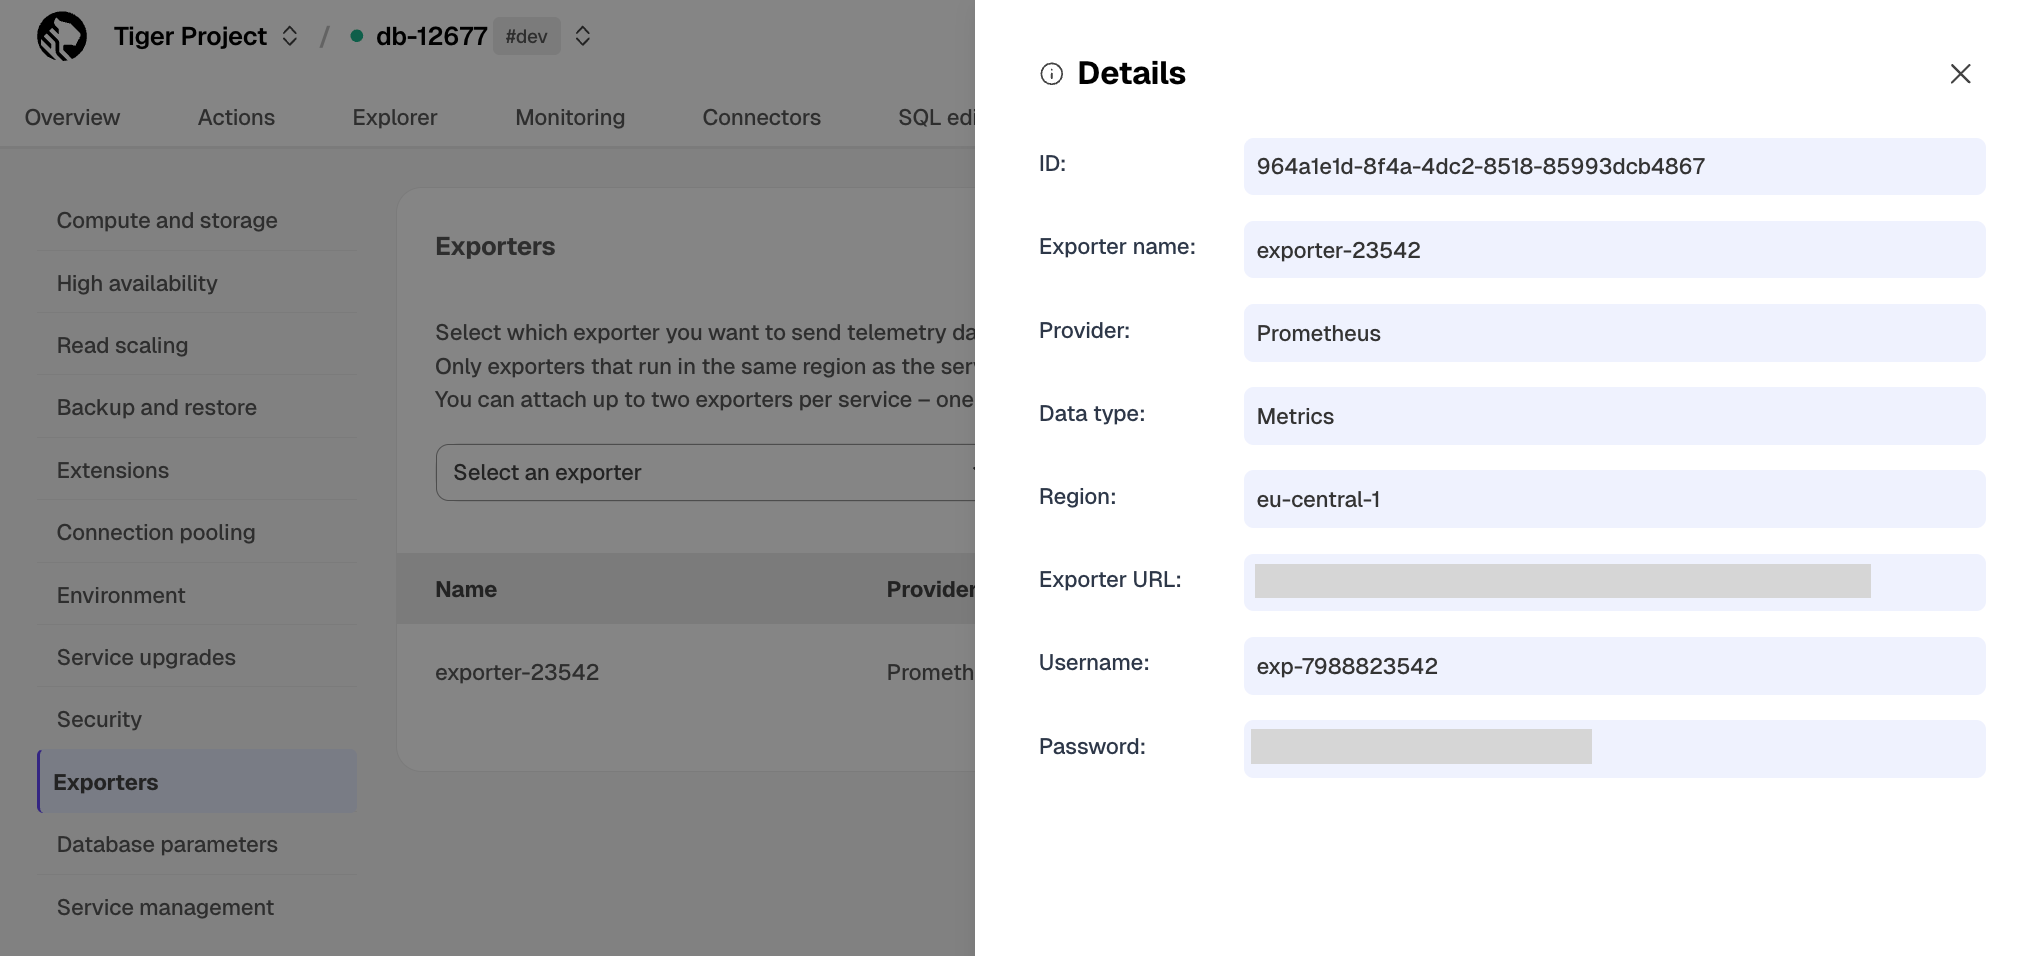 1. Copy the exporter URL. 1. In your Prometheus installation, update `prometheus.yml` to point to the exporter URL as a scrape target: ```yml scrape_configs: - job_name: "timescaledb-exporter" scheme: https static_configs: - targets: ["my-exporter-url"] basic_auth: username: "user" password: "pass" ``` See the [Prometheus documentation][scrape-targets] for details on configuring scrape targets. You can now monitor your service metrics. Use the following metrics to check the service is running correctly: * `timescale.cloud.system.cpu.usage.millicores` * `timescale.cloud.system.cpu.total.millicores` * `timescale.cloud.system.memory.usage.bytes` * `timescale.cloud.system.memory.total.bytes` * `timescale.cloud.system.disk.usage.bytes` * `timescale.cloud.system.disk.total.bytes` Additionally, use the following tags to filter your results. |Tag|Example variable| Description | |-|-|----------------------------| |`host`|`us-east-1.timescale.cloud`| | |`project-id`|| | |`service-id`|| | |`region`|`us-east-1`| AWS region | |`role`|`replica` or `primary`| For service with replicas | To export metrics from self-hosted TimescaleDB, you import telemetry data about your database to Postgres Exporter, then configure Prometheus to scrape metrics from it. Postgres Exporter exposes metrics that you define, excluding the system metrics. 1. **Create a user to access telemetry data about your database** 1. Connect to your database in [`psql`][psql] using your [connection details][connection-info]. 1. Create a user named `monitoring` with a secure password: ```sql CREATE USER monitoring WITH PASSWORD '<password>'; ``` 1. Grant the `pg_read_all_stats` permission to the `monitoring` user: ```sql GRANT pg_read_all_stats to monitoring; ``` 1. **Import telemetry data about your database to Postgres Exporter** 1. Connect Postgres Exporter to your database: Use your [connection details][connection-info] to import telemetry data about your database. You connect as the `monitoring` user: - Local installation: ```shell export DATA_SOURCE_NAME="postgres://<user>:<password>@<host>:<port>/<database>?sslmode=<sslmode>" ./postgres_exporter ``` - Docker: ```shell docker run -d \ -e DATA_SOURCE_NAME="postgres://<user>:<password>@<host>:<port>/<database>?sslmode=<sslmode>" \ -p 9187:9187 \ prometheuscommunity/postgres-exporter ``` 1. Check the metrics for your database in the Prometheus format: - Browser: Navigate to `http://<exporter-host>:9187/metrics`. - Command line: ```shell curl http://<exporter-host>:9187/metrics ``` 1. **Configure Prometheus to scrape metrics** 1. In your Prometheus installation, update `prometheus.yml` to point to your Postgres Exporter instance as a scrape target. In the following example, you replace `<exporter-host>` with the hostname or IP address of the PostgreSQL Exporter. ```yaml global: scrape_interval: 15s scrape_configs: - job_name: 'postgresql' static_configs: - targets: ['<exporter-host>:9187'] ``` If `prometheus.yml` has not been created during installation, create it manually. If you are using Docker, you can find the IPAddress in `Inspect` > `Networks` for the container running Postgres Exporter. 1. Restart Prometheus. 1. Check the Prometheus UI at `http://<prometheus-host>:9090/targets` and `http://<prometheus-host>:9090/tsdb-status`. You see the Postgres Exporter target and the metrics scraped from it. You can further [visualize your data][grafana-prometheus] with Grafana. Use the [Grafana Postgres dashboard][postgresql-exporter-dashboard] or [create a custom dashboard][grafana] that suits your needs. ===== PAGE: https://docs.tigerdata.com/_partials/_early_access_11_25/ ===== Early access: October 2025 ===== PAGE: https://docs.tigerdata.com/_partials/_devops-cli-service-forks/ ===== To manage development forks: 1. **Install Tiger CLI** Use the terminal to install the CLI: ```shell curl -s https://packagecloud.io/install/repositories/timescale/tiger-cli/script.deb.sh | sudo os=any dist=any bash sudo apt-get install tiger-cli ``` ```shell curl -s https://packagecloud.io/install/repositories/timescale/tiger-cli/script.deb.sh | sudo os=any dist=any bash sudo apt-get install tiger-cli ``` ```shell curl -s https://packagecloud.io/install/repositories/timescale/tiger-cli/script.rpm.sh | sudo os=rpm_any dist=rpm_any bash sudo yum install tiger-cli ``` ```shell curl -s https://packagecloud.io/install/repositories/timescale/tiger-cli/script.rpm.sh | sudo os=rpm_any dist=rpm_any bash sudo yum install tiger-cli ``` ```shell brew install --cask timescale/tap/tiger-cli ``` ```shell curl -fsSL https://cli.tigerdata.com | sh ``` 1. **Set up API credentials** 1. Log Tiger CLI into your Tiger Data account: ```shell tiger auth login ``` Tiger CLI opens Console in your browser. Log in, then click `Authorize`. You can have a maximum of 10 active client credentials. If you get an error, open [credentials][rest-api-credentials] and delete an unused credential. 1. Select a Tiger Cloud project: ```terminaloutput Auth URL is: https://console.cloud.timescale.com/oauth/authorize?client_id=lotsOfURLstuff Opening browser for authentication... Select a project: > 1. Tiger Project (tgrproject) 2. YourCompany (Company wide project) (cpnproject) 3. YourCompany Department (dptproject) Use ↑/↓ arrows or number keys to navigate, enter to select, q to quit ``` If only one project is associated with your account, this step is not shown. Where possible, Tiger CLI stores your authentication information in the system keychain/credential manager. If that fails, the credentials are stored in `~/.config/tiger/credentials` with restricted file permissions (600). By default, Tiger CLI stores your configuration in `~/.config/tiger/config.yaml`. 1. **Test your authenticated connection to Tiger Cloud by listing services** ```bash tiger service list ``` This call returns something like: - No services: ```terminaloutput 🏜️ No services found! Your project is looking a bit empty. 🚀 Ready to get started? Create your first service with: tiger service create ``` - One or more services: ```terminaloutput ┌────────────┬─────────────────────┬────────┬─────────────┬──────────────┬──────────────────┐ │ SERVICE ID │ NAME │ STATUS │ TYPE │ REGION │ CREATED │ ├────────────┼─────────────────────┼────────┼─────────────┼──────────────┼──────────────────┤ │ tgrservice │ tiger-agent-service │ READY │ TIMESCALEDB │ eu-central-1 │ 2025-09-25 16:09 │ └────────────┴─────────────────────┴────────┴─────────────┴──────────────┴──────────────────┘ ``` 1. **Fork the service**shell
tiger service fork tgrservice --now --no-wait --name bobBy default a fork matches the resource of the parent Tiger Cloud services. For paid plans specify `--cpu` and/or `--memory` for dedicated resources. You see something like: ```terminaloutput 🍴 Forking service 'tgrservice' to create 'bob' at current state... ✅ Fork request accepted! 📋 New Service ID: <service_id> 🔐 Password saved to system keyring for automatic authentication 🎯 Set service '<service_id>' as default service. ⏳ Service is being forked. Use 'tiger service list' to check status. ┌───────────────────┬──────────────────────────────────────────────────────────────────────────────────────────────────┐ │ PROPERTY │ VALUE │ ├───────────────────┼──────────────────────────────────────────────────────────────────────────────────────────────────┤ │ Service ID │ <service_id> │ │ Name │ bob │ │ Status │ │ │ Type │ TIMESCALEDB │ │ Region │ eu-central-1 │ │ CPU │ 0.5 cores (500m) │ │ Memory │ 2 GB │ │ Direct Endpoint │ <service-id>.<project-id>.tsdb.cloud.timescale.com:<port> │ │ Created │ 2025-10-08 13:58:07 UTC │ │ Connection String │ postgresql://tsdbadmin@<service-id>.<project-id>.tsdb.cloud.timescale.com:<port>/tsdb?sslmode=require │ └───────────────────┴──────────────────────────────────────────────────────────────────────────────────────────────────┘When you are done, delete your forked service
Use the CLI to request service delete:
tiger service delete <service_id>Validate the service delete:
Are you sure you want to delete service '<service_id>'? This operation cannot be undone. Type the service ID '<service_id>' to confirm: <service_id>
You see something like:
```terminaloutput 🗑️ Delete request accepted for service '<service_id>'. ✅ Service '<service_id>' has been successfully deleted. ```
===== PAGE: https://docs.tigerdata.com/_partials/_cloud-intro/ =====
Tiger Cloud is the modern Postgres data platform for all your applications. It enhances Postgres to handle time series, events, real-time analytics, and vector search—all in a single database alongside transactional workloads.
You get one system that handles live data ingestion, late and out-of-order updates, and low latency queries, with the performance, reliability, and scalability your app needs. Ideal for IoT, crypto, finance, SaaS, and a myriad other domains, Tiger Cloud allows you to build data-heavy, mission-critical apps while retaining the familiarity and reliability of Postgres.
===== PAGE: https://docs.tigerdata.com/_partials/_add-timescaledb-to-a-database/ =====
- Connect to a database on your Postgres instance
In Postgres, the default user and database are both
postgres. To use a different database, set<database-name>to the name of that database:psql -d "postgres://<username>:<password>@<host>:<port>/<database-name>"Add TimescaleDB to the database
CREATE EXTENSION IF NOT EXISTS timescaledb;Check that TimescaleDB is installed
\dxYou see the list of installed extensions:
List of installed extensions Name | Version | Schema | Description -------------+---------+------------+--------------------------------------------------------------------------------------- plpgsql | 1.0 | pg_catalog | PL/pgSQL procedural language timescaledb | 2.17.2 | public | Enables scalable inserts and complex queries for time-series data (Community Edition)Press q to exit the list of extensions.
===== PAGE: https://docs.tigerdata.com/_partials/_cloudtrial_unused/ =====
- Get started at the click of a button
- Get access to advanced cloud features like transparent bottomless object storage
- Don't waste time running high performance, highly available TimescaleDB and Postgres in the cloud
===== PAGE: https://docs.tigerdata.com/_partials/_integration-debezium-self-hosted-config-database/ =====
Configure your self-hosted Postgres deployment
- Open
postgresql.conf.
The Postgres configuration files are usually located in:
- Docker:
/home/postgres/pgdata/data/ - Linux:
/etc/postgresql/<version>/main/or/var/lib/pgsql/<version>/data/ - MacOS:
/opt/homebrew/var/postgresql@<version>/ - Windows:
C:\Program Files\PostgreSQL\<version>\data\
- Enable logical replication.
Modify the following settings in
postgresql.conf:wal_level = logical max_replication_slots = 10 max_wal_senders = 10- Open
pg_hba.confand enable host replication.
To allow replication connections, add the following:
local replication debezium trustThis permission is for the
debeziumPostgres user running on a local or Docker deployment. For more about replication permissions, see Configuring Postgres to allow replication with the Debezium connector host.- Restart Postgres.
- Open
Connect to your self-hosted TimescaleDB instance
Use
psql.- Create a Debezium user in Postgres
Create a user with the
LOGINandREPLICATIONpermissions:```sql CREATE ROLE debezium WITH LOGIN REPLICATION PASSWORD '<debeziumpassword>'; ```Enable a replication spot for Debezium
Create a table for Debezium to listen to:
CREATE TABLE accounts (created_at TIMESTAMPTZ DEFAULT NOW(), name TEXT, city TEXT);Turn the table into a hypertable:
SELECT create_hypertable('accounts', 'created_at');
Debezium also works with continuous aggregates.
Create a publication and enable a replication slot:
CREATE PUBLICATION dbz_publication FOR ALL TABLES WITH (publish = 'insert, update');
===== PAGE: https://docs.tigerdata.com/_partials/_migrate_self_postgres_check_versions/ =====
To see the versions of Postgres and TimescaleDB running in a self-hosted database instance:
- Set your connection string
This variable holds the connection information for the database to upgrade:
export SOURCE="postgres://<user>:<password>@<source host>:<source port>/<db_name>"Retrieve the version of Postgres that you are running
psql -X -d source -c "SELECT version();"Postgres returns something like:
----------------------------------------------------------------------------------------------------------------------------------------- PostgreSQL 17.2 (Ubuntu 17.2-1.pgdg22.04+1) on aarch64-unknown-linux-gnu, compiled by gcc (Ubuntu 11.4.0-1ubuntu1~22.04) 11.4.0, 64-bit (1 row)Retrieve the version of TimescaleDB that you are running
psql -X -d source -c "\dx timescaledb;"Postgres returns something like:
Name | Version | Schema | Description -------------+---------+------------+--------------------------------------------------------------------- timescaledb | 2.17.2 | public | Enables scalable inserts and complex queries for time-series data (1 row)
===== PAGE: https://docs.tigerdata.com/_partials/_create-hypertable-energy/ =====
Optimize time-series data in hypertables
Hypertables are Postgres tables in TimescaleDB that automatically partition your time-series data by time. Time-series data represents the way a system, process, or behavior changes over time. Hypertables enable TimescaleDB to work efficiently with time-series data. Each hypertable is made up of child tables called chunks. Each chunk is assigned a range of time, and only contains data from that range. When you run a query, TimescaleDB identifies the correct chunk and runs the query on it, instead of going through the entire table.
Hypercore is the hybrid row-columnar storage engine in TimescaleDB used by hypertables. Traditional databases force a trade-off between fast inserts (row-based storage) and efficient analytics (columnar storage). Hypercore eliminates this trade-off, allowing real-time analytics without sacrificing transactional capabilities.
Hypercore dynamically stores data in the most efficient format for its lifecycle:
- Row-based storage for recent data: the most recent chunk (and possibly more) is always stored in the rowstore, ensuring fast inserts, updates, and low-latency single record queries. Additionally, row-based storage is used as a writethrough for inserts and updates to columnar storage.
- Columnar storage for analytical performance: chunks are automatically compressed into the columnstore, optimizing storage efficiency and accelerating analytical queries.
Unlike traditional columnar databases, hypercore allows data to be inserted or modified at any stage, making it a flexible solution for both high-ingest transactional workloads and real-time analytics—within a single database.
Because TimescaleDB is 100% Postgres, you can use all the standard Postgres tables, indexes, stored procedures, and other objects alongside your hypertables. This makes creating and working with hypertables similar to standard Postgres.
To create a hypertable to store the energy consumption data, call CREATE TABLE.
CREATE TABLE "metrics"( created timestamp with time zone default now() not null, type_id integer not null, value double precision not null ) WITH ( tsdb.hypertable, tsdb.partition_column='time' );If you are self-hosting TimescaleDB v2.19.3 and below, create a Postgres relational table, then convert it using create_hypertable. You then enable hypercore with a call to ALTER TABLE.
===== PAGE: https://docs.tigerdata.com/_partials/_livesync-limitations/ =====
This works for Postgres databases only as source. TimescaleDB is not yet supported.
The source must be running Postgres 13 or later.
Schema changes must be co-ordinated.
Make compatible changes to the schema in your Tiger Cloud service first, then make the same changes to the source Postgres instance.
- Ensure that the source Postgres instance and the target Tiger Cloud service have the same extensions installed.
The source Postgres connector does not create extensions on the target. If the table uses column types from an extension, first create the extension on the target Tiger Cloud service before syncing the table.
There is WAL volume growth on the source Postgres instance during large table copy.
Continuous aggregate invalidation
The connector uses
session_replication_role=replicaduring data replication, which prevents table triggers from firing. This includes the internal triggers that mark continuous aggregates as invalid when underlying data changes.If you have continuous aggregates on your target database, they do not automatically refresh for data inserted during the migration. This limitation only applies to data below the continuous aggregate's materialization watermark. For example, backfilled data. New rows synced above the continuous aggregate watermark are used correctly when refreshing.
This can lead to:
- Missing data in continuous aggregates for the migration period.
- Stale aggregate data.
- Queries returning incomplete results.
If the continuous aggregate exists in the source database, best practice is to add it to the Postgres connector publication. If it only exists on the target database, manually refresh the continuous aggregate using the
forceoption of refresh_continuous_aggregate.===== PAGE: https://docs.tigerdata.com/_partials/_financial-industry-data-analysis/ =====
The financial industry is extremely data-heavy and relies on real-time and historical data for decision-making, risk assessment, fraud detection, and market analysis. Tiger Data simplifies management of these large volumes of data, while also providing you with meaningful analytical insights and optimizing storage costs.
===== PAGE: https://docs.tigerdata.com/_partials/_migrate_live_setup_environment_postgres/ =====
Set your connection strings
These variables hold the connection information for the source database and target Tiger Cloud service. In Terminal on your migration machine, set the following:
export SOURCE="postgres://<user>:<password>@<source host>:<source port>/<db_name>" export TARGET="postgres://tsdbadmin:<PASSWORD>@<HOST>:<PORT>/tsdb?sslmode=require"You find the connection information for your Tiger Cloud service in the configuration file you downloaded when you created the service.
Avoid using connection strings that route through connection poolers like PgBouncer or similar tools. This tool requires a direct connection to the database to function properly.
Align the extensions on the source and target
Ensure that the Tiger Cloud service is running the Postgres extensions used in your source database.
Check the extensions on the source database:
psql source -c "SELECT * FROM pg_extension;"For each extension, enable it on your target Tiger Cloud service:
psql target -c "CREATE EXTENSION IF NOT EXISTS <extension name> CASCADE;"
Tune your source database
You need admin rights to to update the configuration on your source database. If you are using a managed service, follow the instructions in the
From AWS RDS/Auroratab on this page.- Install the
wal2jsonextension on your source database
Install wal2json on your source database.
Prevent Postgres from treating the data in a snapshot as outdated
psql -X -d source -c 'alter system set old_snapshot_threshold=-1'
This is not applicable if the source database is Postgres 17 or later.
Set the write-Ahead Log (WAL) to record the information needed for logical decoding
psql -X -d source -c 'alter system set wal_level=logical'Restart the source database
Your configuration changes are now active. However, verify that the settings are live in your database.
- Enable live-migration to replicate
DELETEandUPDATEoperations
Replica identity assists data replication by identifying the rows being modified. Your options are that each table and hypertable in the source database should either have:
- A primary key: data replication defaults to the primary key of the table being replicated. Nothing to do.
- A viable unique index: each table has a unique, non-partial, non-deferrable index that includes only columns
marked as
NOT NULL. If a UNIQUE index does not exist, create one to assist the migration. You can delete if after migration.
For each table, set
REPLICA IDENTITYto the viable unique index:psql -X -d source -c 'ALTER TABLE REPLICA IDENTITY USING INDEX <_index_name>'- No primary key or viable unique index: use brute force.
For each table, set
REPLICA IDENTITYtoFULL:psql -X -d source -c 'ALTER TABLE {table_name} REPLICA IDENTITY FULL'For each
UPDATEorDELETEstatement, Postgres reads the whole table to find all matching rows. This results in significantly slower replication. If you are expecting a large number ofUPDATEorDELETEoperations on the table, best practice is to not useFULL.===== PAGE: https://docs.tigerdata.com/_partials/_migrate_using_postgres_copy/ =====
Restoring data into a Tiger Cloud service with COPY
Connect to your Tiger Cloud service:
psql "postgres://tsdbadmin:<PASSWORD>@<HOST>:<PORT>/tsdb?sslmode=require"Restore the data to your Tiger Cloud service:
\copy FROM '.csv' WITH (FORMAT CSV);Repeat for each table and hypertable you want to migrate.
===== PAGE: https://docs.tigerdata.com/_partials/_services-intro/ =====
A Tiger Cloud service is a single optimised Postgres instance extended with innovations in the database engine and cloud infrastructure to deliver speed without sacrifice. A Tiger Cloud service is 10-1000x faster at scale! It is ideal for applications requiring strong data consistency, complex relationships, and advanced querying capabilities. Get ACID compliance, extensive SQL support, JSON handling, and extensibility through custom functions, data types, and extensions.
Each service is associated with a project in Tiger Cloud. Each project can have multiple services. Each user is a member of one or more projects.
You create free and standard services in Tiger Cloud Console, depending on your pricing plan. A free service comes at zero cost and gives you limited resources to get to know Tiger Cloud. Once you are ready to try out more advanced features, you can switch to a paid plan and convert your free service to a standard one.
The Free pricing plan and services are currently in beta.
To the Postgres you know and love, Tiger Cloud adds the following capabilities:
Standard services:
- Real-time analytics: store and query time-series data at scale for real-time analytics and other use cases. Get faster time-based queries with hypertables, continuous aggregates, and columnar storage. Save money by compressing data into the columnstore, moving cold data to low-cost bottomless storage in Amazon S3, and deleting old data with automated policies.
- AI-focused: build AI applications from start to scale. Get fast and accurate similarity search with the pgvector and pgvectorscale extensions.
- Hybrid applications: get a full set of tools to develop applications that combine time-based data and AI.
All standard Tiger Cloud services include the tooling you expect for production and developer environments: live migration, automatic backups and PITR, high availability, read replicas, data forking, connection pooling, tiered storage, usage-based storage, secure in-Tiger Cloud Console SQL editing, service metrics and insights, streamlined maintenance, and much more. Tiger Cloud continuously monitors your services and prevents common Postgres out-of-memory crashes.
- Free services:
Postgres with TimescaleDB and vector extensions
Free services offer limited resources and a basic feature scope, perfect to get to know Tiger Cloud in a development environment.
===== PAGE: https://docs.tigerdata.com/_partials/_mst-intro/ =====
Managed Service for TimescaleDB (MST) is TimescaleDB hosted on Azure and GCP. MST is offered in partnership with Aiven.
===== PAGE: https://docs.tigerdata.com/_partials/_migrate_live_migrate_data/ =====
Migrate your data, then start downtime
Pull the live-migration docker image to you migration machine
sudo docker pull timescale/live-migration:latest
To list the available commands, run:
sudo docker run --rm -it -e PGCOPYDB_SOURCE_PGURI=source timescale/live-migration:latest --helpTo see the available flags for each command, run
--helpfor that command. For example:sudo docker run --rm -it -e PGCOPYDB_SOURCE_PGURI=source timescale/live-migration:latest migrate --help- Create a snapshot image of your source database in your Tiger Cloud service
This process checks that you have tuned your source database and target service correctly for replication, then creates a snapshot of your data on the migration machine:
docker run --rm -it --name live-migration-snapshot \ -e PGCOPYDB_SOURCE_PGURI=source \ -e PGCOPYDB_TARGET_PGURI=target \ --pid=host \ -v ~/live-migration:/opt/timescale/ts_cdc \ timescale/live-migration:latest snapshotLive-migration supplies information about updates you need to make to the source database and target service. For example:
2024-03-25T12:40:40.884 WARNING: The following tables in the Source DB have neither a primary key nor a REPLICA IDENTITY (FULL/INDEX) 2024-03-25T12:40:40.884 WARNING: UPDATE and DELETE statements on these tables will not be replicated to the Target DB 2024-03-25T12:40:40.884 WARNING: - public.metricsIf you have warnings, stop live-migration, make the suggested changes and start again.
Synchronize data between your source database and your Tiger Cloud service
This command migrates data from the snapshot to your Tiger Cloud service, then streams transactions from the source to the target.
docker run --rm -it --name live-migration-migrate \ -e PGCOPYDB_SOURCE_PGURI=source \ -e PGCOPYDB_TARGET_PGURI=target \ --pid=host \ -v ~/live-migration:/opt/timescale/ts_cdc \ timescale/live-migration:latest migrate
If the source Postgres version is 17 or later, you need to pass additional flag
-e PGVERSION=17to themigratecommand.After migrating the schema, live-migration prompts you to create hypertables for tables that contain time-series data in your Tiger Cloud service. Run
create_hypertable()to convert these table. For more information, see the Hypertable docs.During this process, you see the migration process:
Live-replay will complete in 1 minute 38.631 seconds (source_wal_rate: 106.0B/s, target_replay_rate: 589.0KiB/s, replay_lag: 56MiB)If
migratestops add--resumeto start from where it left off.Once the data in your target Tiger Cloud service has almost caught up with the source database, you see the following message:
Target has caught up with source (source_wal_rate: 751.0B/s, target_replay_rate: 0B/s, replay_lag: 7KiB) To stop replication, hit 'c' and then ENTERWait until
replay_lagis down to a few kilobytes before you move to the next step. Otherwise, data replication may not have finished.Start app downtime
Stop your app writing to the source database, then let the the remaining transactions finish to fully sync with the target. You can use tools like the
pg_topCLI orpg_stat_activityto view the current transaction on the source database.Stop Live-migration.
hit 'c' and then ENTER
Live-migration continues the remaining work. This includes copying TimescaleDB metadata, sequences, and run policies. When the migration completes, you see the following message:
Migration successfully completed
===== PAGE: https://docs.tigerdata.com/_partials/_hypershift-intro/ =====
You can use hypershift to migrate existing Postgres databases in one step, and enable compression and create hypertables instantly.
Use Hypershift to migrate your data to a Tiger Cloud service from these sources:
- Standard Postgres databases
- Amazon RDS databases
- Other Tiger Data databases, including Managed Service for TimescaleDB and self-hosted TimescaleDB
===== PAGE: https://docs.tigerdata.com/_partials/_import-data-nyc-taxis/ =====
Hypertables are Postgres tables in TimescaleDB that automatically partition your time-series data by time. Time-series data represents the way a system, process, or behavior changes over time. Hypertables enable TimescaleDB to work efficiently with time-series data. Each hypertable is made up of child tables called chunks. Each chunk is assigned a range of time, and only contains data from that range. When you run a query, TimescaleDB identifies the correct chunk and runs the query on it, instead of going through the entire table.
Hypercore is the hybrid row-columnar storage engine in TimescaleDB used by hypertables. Traditional databases force a trade-off between fast inserts (row-based storage) and efficient analytics (columnar storage). Hypercore eliminates this trade-off, allowing real-time analytics without sacrificing transactional capabilities.
Hypercore dynamically stores data in the most efficient format for its lifecycle:
- Row-based storage for recent data: the most recent chunk (and possibly more) is always stored in the rowstore, ensuring fast inserts, updates, and low-latency single record queries. Additionally, row-based storage is used as a writethrough for inserts and updates to columnar storage.
- Columnar storage for analytical performance: chunks are automatically compressed into the columnstore, optimizing storage efficiency and accelerating analytical queries.
Unlike traditional columnar databases, hypercore allows data to be inserted or modified at any stage, making it a flexible solution for both high-ingest transactional workloads and real-time analytics—within a single database.
Because TimescaleDB is 100% Postgres, you can use all the standard Postgres tables, indexes, stored procedures, and other objects alongside your hypertables. This makes creating and working with hypertables similar to standard Postgres.
Import time-series data into a hypertable
- Unzip nyc_data.tar.gz to a
<local folder>.
This test dataset contains historical data from New York's yellow taxi network.
To import up to 100GB of data directly from your current Postgres-based database, migrate with downtime using native Postgres tooling. To seamlessly import 100GB-10TB+ of data, use the live migration tooling supplied by Tiger Data. To add data from non-Postgres data sources, see Import and ingest data.
In Terminal, navigate to
<local folder>and update the following string with your connection details to connect to your service.psql -d "postgres://<username>:<password>@<host>:<port>/<database-name>?sslmode=require"Create an optimized hypertable for your time-series data:
Create a hypertable with hypercore enabled by default for your time-series data using CREATE TABLE. For efficient queries on data in the columnstore, remember to
segmentbythe column you will use most often to filter your data.In your sql client, run the following command:
CREATE TABLE "rides"( vendor_id TEXT, pickup_datetime TIMESTAMP WITHOUT TIME ZONE NOT NULL, dropoff_datetime TIMESTAMP WITHOUT TIME ZONE NOT NULL, passenger_count NUMERIC, trip_distance NUMERIC, pickup_longitude NUMERIC, pickup_latitude NUMERIC, rate_code INTEGER, dropoff_longitude NUMERIC, dropoff_latitude NUMERIC, payment_type INTEGER, fare_amount NUMERIC, extra NUMERIC, mta_tax NUMERIC, tip_amount NUMERIC, tolls_amount NUMERIC, improvement_surcharge NUMERIC, total_amount NUMERIC ) WITH ( tsdb.hypertable, tsdb.partition_column='pickup_datetime', tsdb.create_default_indexes=false, tsdb.segmentby='vendor_id', tsdb.orderby='pickup_datetime DESC' );If you are self-hosting TimescaleDB v2.19.3 and below, create a Postgres relational table, then convert it using create_hypertable. You then enable hypercore with a call to ALTER TABLE.
Add another dimension to partition your hypertable more efficiently:
SELECT add_dimension('rides', by_hash('payment_type', 2));Create an index to support efficient queries by vendor, rate code, and passenger count:
CREATE INDEX ON rides (vendor_id, pickup_datetime DESC); CREATE INDEX ON rides (rate_code, pickup_datetime DESC); CREATE INDEX ON rides (passenger_count, pickup_datetime DESC);
Create Postgres tables for relational data:
Add a table to store the payment types data:
CREATE TABLE IF NOT EXISTS "payment_types"( payment_type INTEGER, description TEXT ); INSERT INTO payment_types(payment_type, description) VALUES (1, 'credit card'), (2, 'cash'), (3, 'no charge'), (4, 'dispute'), (5, 'unknown'), (6, 'voided trip');Add a table to store the rates data:
CREATE TABLE IF NOT EXISTS "rates"( rate_code INTEGER, description TEXT ); INSERT INTO rates(rate_code, description) VALUES (1, 'standard rate'), (2, 'JFK'), (3, 'Newark'), (4, 'Nassau or Westchester'), (5, 'negotiated fare'), (6, 'group ride');Upload the dataset to your service
\COPY rides FROM nyc_data_rides.csv CSV;
- Unzip nyc_data.tar.gz to a
Have a quick look at your data
You query hypertables in exactly the same way as you would a relational Postgres table. Use one of the following SQL editors to run a query and see the data you uploaded:
- Data mode: write queries, visualize data, and share your results in Tiger Cloud Console for all your Tiger Cloud services.
- SQL editor: write, fix, and organize SQL faster and more accurately in Tiger Cloud Console for a Tiger Cloud service.
- psql: easily run queries on your Tiger Cloud services or self-hosted TimescaleDB deployment from Terminal.
For example:
Display the number of rides for each fare type:
SELECT rate_code, COUNT(vendor_id) AS num_trips FROM rides WHERE pickup_datetime < '2016-01-08' GROUP BY rate_code ORDER BY rate_code;This simple query runs in 3 seconds. You see something like:
| rate_code | num_trips | |-----------------|-----------| |1 | 2266401| |2 | 54832| |3 | 4126| |4 | 967| |5 | 7193| |6 | 17| |99 | 42|
To select all rides taken in the first week of January 2016, and return the total number of trips taken for each rate code:
SELECT rates.description, COUNT(vendor_id) AS num_trips FROM rides JOIN rates ON rides.rate_code = rates.rate_code WHERE pickup_datetime < '2016-01-08' GROUP BY rates.description ORDER BY LOWER(rates.description);On this large amount of data, this analytical query on data in the rowstore takes about 59 seconds. You see something like:
| description | num_trips | |-----------------|-----------| | group ride | 17 | | JFK | 54832 | | Nassau or Westchester | 967 | | negotiated fare | 7193 | | Newark | 4126 | | standard rate | 2266401 |
===== PAGE: https://docs.tigerdata.com/_partials/_create-hypertable-twelvedata-stocks/ =====
Optimize time-series data in hypertables
Hypertables are Postgres tables in TimescaleDB that automatically partition your time-series data by time. Time-series data represents the way a system, process, or behavior changes over time. Hypertables enable TimescaleDB to work efficiently with time-series data. Each hypertable is made up of child tables called chunks. Each chunk is assigned a range of time, and only contains data from that range. When you run a query, TimescaleDB identifies the correct chunk and runs the query on it, instead of going through the entire table.
Hypercore is the hybrid row-columnar storage engine in TimescaleDB used by hypertables. Traditional databases force a trade-off between fast inserts (row-based storage) and efficient analytics (columnar storage). Hypercore eliminates this trade-off, allowing real-time analytics without sacrificing transactional capabilities.
Hypercore dynamically stores data in the most efficient format for its lifecycle:
- Row-based storage for recent data: the most recent chunk (and possibly more) is always stored in the rowstore, ensuring fast inserts, updates, and low-latency single record queries. Additionally, row-based storage is used as a writethrough for inserts and updates to columnar storage.
- Columnar storage for analytical performance: chunks are automatically compressed into the columnstore, optimizing storage efficiency and accelerating analytical queries.
Unlike traditional columnar databases, hypercore allows data to be inserted or modified at any stage, making it a flexible solution for both high-ingest transactional workloads and real-time analytics—within a single database.
Because TimescaleDB is 100% Postgres, you can use all the standard Postgres tables, indexes, stored procedures, and other objects alongside your hypertables. This makes creating and working with hypertables similar to standard Postgres.
- Connect to your Tiger Cloud service
In Tiger Cloud Console open an SQL editor. You can also connect to your service using psql.
Create a hypertable to store the real-time stock data
CREATE TABLE stocks_real_time ( time TIMESTAMPTZ NOT NULL, symbol TEXT NOT NULL, price DOUBLE PRECISION NULL, day_volume INT NULL ) WITH ( tsdb.hypertable, tsdb.partition_column='time' );
If you are self-hosting TimescaleDB v2.19.3 and below, create a Postgres relational table, then convert it using create_hypertable. You then enable hypercore with a call to ALTER TABLE.
Create an index to support efficient queries
Index on the
symbolandtimecolumns:CREATE INDEX ix_symbol_time ON stocks_real_time (symbol, time DESC);
Create standard Postgres tables for relational data
When you have other relational data that enhances your time-series data, you can create standard Postgres tables just as you would normally. For this dataset, there is one other table of data called
company.Add a table to store the company data
CREATE TABLE company ( symbol TEXT NOT NULL, name TEXT NOT NULL );
You now have two tables in your Tiger Cloud service. One hypertable named
stocks_real_time, and one regular Postgres table namedcompany.===== PAGE: https://docs.tigerdata.com/_partials/_tiered-storage-billing/ =====
For low-cost storage, Tiger Data charges only for the size of your data in S3 in the Apache Parquet format, regardless of whether it was compressed in Tiger Cloud before tiering. There are no additional expenses, such as data transfer or compute.
===== PAGE: https://docs.tigerdata.com/_partials/_create-hypertable-blockchain/ =====
Optimize time-series data using hypertables
Hypertables are Postgres tables in TimescaleDB that automatically partition your time-series data by time. Time-series data represents the way a system, process, or behavior changes over time. Hypertables enable TimescaleDB to work efficiently with time-series data. Each hypertable is made up of child tables called chunks. Each chunk is assigned a range of time, and only contains data from that range. When you run a query, TimescaleDB identifies the correct chunk and runs the query on it, instead of going through the entire table.
Hypercore is the hybrid row-columnar storage engine in TimescaleDB used by hypertables. Traditional databases force a trade-off between fast inserts (row-based storage) and efficient analytics (columnar storage). Hypercore eliminates this trade-off, allowing real-time analytics without sacrificing transactional capabilities.
Hypercore dynamically stores data in the most efficient format for its lifecycle:
- Row-based storage for recent data: the most recent chunk (and possibly more) is always stored in the rowstore, ensuring fast inserts, updates, and low-latency single record queries. Additionally, row-based storage is used as a writethrough for inserts and updates to columnar storage.
- Columnar storage for analytical performance: chunks are automatically compressed into the columnstore, optimizing storage efficiency and accelerating analytical queries.
Unlike traditional columnar databases, hypercore allows data to be inserted or modified at any stage, making it a flexible solution for both high-ingest transactional workloads and real-time analytics—within a single database.
Because TimescaleDB is 100% Postgres, you can use all the standard Postgres tables, indexes, stored procedures, and other objects alongside your hypertables. This makes creating and working with hypertables similar to standard Postgres.
- Connect to your Tiger Cloud service
In Tiger Cloud Console open an SQL editor. The in-Console editors display the query speed. You can also connect to your service using psql.
Create a hypertable for your time-series data using CREATE TABLE. For efficient queries on data in the columnstore, remember to
segmentbythe column you will use most often to filter your data:CREATE TABLE transactions ( time TIMESTAMPTZ NOT NULL, block_id INT, hash TEXT, size INT, weight INT, is_coinbase BOOLEAN, output_total BIGINT, output_total_usd DOUBLE PRECISION, fee BIGINT, fee_usd DOUBLE PRECISION, details JSONB ) WITH ( tsdb.hypertable, tsdb.partition_column='time', tsdb.segmentby='block_id', tsdb.orderby='time DESC' );If you are self-hosting TimescaleDB v2.19.3 and below, create a Postgres relational table, then convert it using create_hypertable. You then enable hypercore with a call to ALTER TABLE.
Create an index on the
hashcolumn to make queries for individual transactions faster:CREATE INDEX hash_idx ON public.transactions USING HASH (hash);Create an index on the
block_idcolumn to make block-level queries faster:
When you create a hypertable, it is partitioned on the time column. TimescaleDB automatically creates an index on the time column. However, you'll often filter your time-series data on other columns as well. You use indexes to improve query performance.
```sql CREATE INDEX block_idx ON public.transactions (block_id); ```Create a unique index on the
timeandhashcolumns to make sure you don't accidentally insert duplicate records:CREATE UNIQUE INDEX time_hash_idx ON public.transactions (time, hash);
===== PAGE: https://docs.tigerdata.com/_partials/_migrate_live_run_cleanup/ =====
- Validate the migrated data
The contents of both databases should be the same. To check this you could compare the number of rows, or an aggregate of columns. However, the best validation method depends on your app.
- Stop app downtime
Once you are confident that your data is successfully replicated, configure your apps to use your Tiger Cloud service.
- Cleanup resources associated with live-migration from your migration machine
This command removes all resources and temporary files used in the migration process. When you run this command, you can no longer resume live-migration.
docker run --rm -it --name live-migration-clean \ -e PGCOPYDB_SOURCE_PGURI=source \ -e PGCOPYDB_TARGET_PGURI=target \ --pid=host \ -v ~/live-migration:/opt/timescale/ts_cdc \ timescale/live-migration:latest clean --prune===== PAGE: https://docs.tigerdata.com/_partials/_timescale-cloud-services/ =====
Tiger Cloud services run optimized Tiger Data extensions on latest Postgres, in a highly secure cloud environment. Each service is a specialized database instance tuned for your workload. Available capabilities are:
<thead> <tr> <th>Capability</th> <th>Extensions</th> </tr> </thead> <tbody> <tr> <td><strong>Real-time analytics</strong> <p>Lightning-fast ingest and querying of time-based and event data.</p></td> <td><ul><li>TimescaleDB</li><li>TimescaleDB Toolkit</li></ul> </td> </tr> <tr> <td ><strong>AI and vector </strong><p>Seamlessly build RAG, search, and AI agents.</p></td> <td><ul><li>TimescaleDB</li><li>pgvector</li><li>pgvectorscale</li><li>pgai</li></ul></td> </tr> <tr> <td ><strong>Hybrid</strong><p>Everything for real-time analytics and AI workloads, combined.</p></td> <td><ul><li>TimescaleDB</li><li>TimescaleDB Toolkit</li><li>pgvector</li><li>pgvectorscale</li><li>pgai</li></ul></td> </tr> <tr> <td ><strong>Support</strong></td> <td><ul><li>24/7 support no matter where you are.</li><li> Continuous incremental backup/recovery. </li><li>Point-in-time forking/branching.</li><li>Zero-downtime upgrades. </li><li>Multi-AZ high availability. </li><li>An experienced global ops and support team that can build and manage Postgres at scale.</li></ul></td> </tr> </tbody>===== PAGE: https://docs.tigerdata.com/_partials/_migrate_set_up_source_and_target/ =====
For the sake of convenience, connection strings to the source and target databases are referred to as
sourceandtargetthroughout this guide.This can be set in your shell, for example:
export SOURCE="postgres://<user>:<password>@<source host>:<source port>/<db_name>" export TARGET="postgres://<user>:<password>@<target host>:<target port>/<db_name>"===== PAGE: https://docs.tigerdata.com/_partials/_start-coding-ruby/ =====
"Quick Start: Ruby and TimescaleDB"
Prerequisites
To follow the steps on this page:
- Create a target Tiger Cloud service with the Real-time analytics capability.
You need your connection details. This procedure also works for self-hosted TimescaleDB.
- Install Rails.
Connect a Rails app to your service
Every Tiger Cloud service is a 100% Postgres database hosted in Tiger Cloud with Tiger Data extensions such as TimescaleDB. You connect to your Tiger Cloud service from a standard Rails app configured for Postgres.
Create a new Rails app configured for Postgres
Rails creates and bundles your app, then installs the standard Postgres Gems.
rails new my_app -d=postgresql cd my_appInstall the TimescaleDB gem
Open
Gemfile, add the following line, then save your changes:gem 'timescaledb'In Terminal, run the following command:
bundle install
Connect your app to your Tiger Cloud service
In
<my_app_home>/config/database.ymlupdate the configuration to read securely connect to your Tiger Cloud service by addingurl: <%= ENV['DATABASE_URL'] %>to the default configuration:default: &default adapter: postgresql encoding: unicode pool: <%= ENV.fetch("RAILS_MAX_THREADS") { 5 } %> url: <%= ENV['DATABASE_URL'] %>Set the environment variable for
DATABASE_URLto the value ofService URLfrom your connection detailsexport DATABASE_URL="value of Service URL"Create the database:
- Tiger Cloud: nothing to do. The database is part of your Tiger Cloud service.
Self-hosted TimescaleDB, create the database for the project:
rails db:create
Run migrations:
rails db:migrateVerify the connection from your app to your Tiger Cloud service:
echo "\dx" | rails dbconsole
The result shows the list of extensions in your Tiger Cloud service
| Name | Version | Schema | Description | | -- | -- | -- | -- | | pg_buffercache | 1.5 | public | examine the shared buffer cache| | pg_stat_statements | 1.11 | public | track planning and execution statistics of all SQL statements executed| | plpgsql | 1.0 | pg_catalog | PL/pgSQL procedural language| | postgres_fdw | 1.1 | public | foreign-data wrapper for remote Postgres servers| | timescaledb | 2.18.1 | public | Enables scalable inserts and complex queries for time-series data (Community Edition)| | timescaledb_toolkit | 1.19.0 | public | Library of analytical hyperfunctions, time-series pipelining, and other SQL utilities|
Optimize time-series data in hypertables
Hypertables are Postgres tables designed to simplify and accelerate data analysis. Anything you can do with regular Postgres tables, you can do with hypertables - but much faster and more conveniently.
In this section, you use the helpers in the TimescaleDB gem to create and manage a hypertable.
Generate a migration to create the page loads table
rails generate migration create_page_loads
This creates the
<my_app_home>/db/migrate/<migration-datetime>_create_page_loads.rbmigration file.- Add hypertable options
Replace the contents of
<my_app_home>/db/migrate/<migration-datetime>_create_page_loads.rbwith the following:```ruby class CreatePageLoads < ActiveRecord::Migration[8.0] def change hypertable_options = { time_column: 'created_at', chunk_time_interval: '1 day', compress_segmentby: 'path', compress_orderby: 'created_at', compress_after: '7 days', drop_after: '30 days' } create_table :page_loads, id: false, primary_key: [:created_at, :user_agent, :path], hypertable: hypertable_options do |t| t.timestamptz :created_at, null: false t.string :user_agent t.string :path t.float :performance end end end ``` The `id` column is not included in the table. This is because TimescaleDB requires that any `UNIQUE` or `PRIMARY KEY` indexes on the table include all partitioning columns. In this case, this is the time column. A new Rails model includes a `PRIMARY KEY` index for id by default: either remove the column or make sure that the index includes time as part of a "composite key."For more information, check the Roby docs around composite primary keys.
Create a
PageLoadmodelCreate a new file called
<my_app_home>/app/models/page_load.rband add the following code:class PageLoad < ApplicationRecord extend Timescaledb::ActsAsHypertable include Timescaledb::ContinuousAggregatesHelper acts_as_hypertable time_column: "created_at", segment_by: "path", value_column: "performance" scope :chrome_users, -> { where("user_agent LIKE ?", "%Chrome%") } scope :firefox_users, -> { where("user_agent LIKE ?", "%Firefox%") } scope :safari_users, -> { where("user_agent LIKE ?", "%Safari%") } scope :performance_stats, -> { select("stats_agg(#{value_column}) as stats_agg") } scope :slow_requests, -> { where("performance > ?", 1.0) } scope :fast_requests, -> { where("performance < ?", 0.1) } continuous_aggregates scopes: [:performance_stats], timeframes: [:minute, :hour, :day], refresh_policy: { minute: { start_offset: '3 minute', end_offset: '1 minute', schedule_interval: '1 minute' }, hour: { start_offset: '3 hours', end_offset: '1 hour', schedule_interval: '1 minute' }, day: { start_offset: '3 day', end_offset: '1 day', schedule_interval: '1 minute' } } endRun the migration
rails db:migrate
Insert data your service
The TimescaleDB gem provides efficient ways to insert data into hypertables. This section shows you how to ingest test data into your hypertable.
Create a controller to handle page loads
Create a new file called
<my_app_home>/app/controllers/application_controller.rband add the following code:class ApplicationController < ActionController::Base around_action :track_page_load private def track_page_load start_time = Time.current yield end_time = Time.current PageLoad.create( path: request.path, user_agent: request.user_agent, performance: (end_time - start_time) ) end endGenerate some test data
Use
bin/consoleto join a Rails console session and run the following code to define some random page load access data:def generate_sample_page_loads(total: 1000) time = 1.month.ago paths = %w[/ /about /contact /products /blog] browsers = [ "Mozilla/5.0 (Macintosh; Intel Mac OS X 10_15_7) AppleWebKit/537.36 (KHTML, like Gecko) Chrome/91.0.4472.114 Safari/537.36", "Mozilla/5.0 (Macintosh; Intel Mac OS X 10.15; rv:89.0) Gecko/20100101 Firefox/89.0", "Mozilla/5.0 (Macintosh; Intel Mac OS X 10_15_7) AppleWebKit/605.1.15 (KHTML, like Gecko) Version/14.1.1 Safari/605.1.15" ] total.times.map do time = time + rand(60).seconds { path: paths.sample, user_agent: browsers.sample, performance: rand(0.1..2.0), created_at: time, updated_at: time } end endInsert the generated data into your Tiger Cloud service
PageLoad.insert_all(generate_sample_page_loads, returning: false)Validate the test data in your Tiger Cloud service
PageLoad.count PageLoad.first
Reference
This section lists the most common tasks you might perform with the TimescaleDB gem.
Query scopes
The TimescaleDB gem provides several convenient scopes for querying your time-series data.
Built-in time-based scopes:
PageLoad.last_hour.count PageLoad.today.count PageLoad.this_week.count PageLoad.this_month.countBrowser-specific scopes:
PageLoad.chrome_users.last_hour.count PageLoad.firefox_users.last_hour.count PageLoad.safari_users.last_hour.count PageLoad.slow_requests.last_hour.count PageLoad.fast_requests.last_hour.countQuery continuous aggregates:
This query fetches the average and standard deviation from the performance stats for the
/productspath over the last day.```ruby PageLoad::PerformanceStatsPerMinute.last_hour PageLoad::PerformanceStatsPerHour.last_day PageLoad::PerformanceStatsPerDay.last_month stats = PageLoad::PerformanceStatsPerHour.last_day.where(path: '/products').select("average(stats_agg) as average, stddev(stats_agg) as stddev").first puts "Average: #{stats.average}" puts "Standard Deviation: #{stats.stddev}" ```TimescaleDB features
The TimescaleDB gem provides utility methods to access hypertable and chunk information. Every model that uses the
acts_as_hypertablemethod has access to these methods.Access hypertable and chunk information
View chunk or hypertable information:
PageLoad.chunks.count PageLoad.hypertable.detailed_sizeCompress/Decompress chunks:
PageLoad.chunks.uncompressed.first.compress! # Compress the first uncompressed chunk PageLoad.chunks.compressed.first.decompress! # Decompress the oldest chunk PageLoad.hypertable.compression_stats # View compression stats
Access hypertable stats
You collect hypertable stats using methods that provide insights into your hypertable's structure, size, and compression status:
Get basic hypertable information:
hypertable = PageLoad.hypertable hypertable.hypertable_name # The name of your hypertable hypertable.schema_name # The schema where the hypertable is locatedGet detailed size information:
hypertable.detailed_size # Get detailed size information for the hypertable hypertable.compression_stats # Get compression statistics hypertable.chunks_detailed_size # Get chunk information hypertable.approximate_row_count # Get approximate row count hypertable.dimensions.map(&:column_name) # Get dimension information hypertable.continuous_aggregates.map(&:view_name) # Get continuous aggregate view names
Continuous aggregates
The
continuous_aggregatesmethod generates a class for each continuous aggregate.Get all the continuous aggregate classes:
PageLoad.descendants # Get all continuous aggregate classesManually refresh a continuous aggregate:
PageLoad.refresh_aggregatesCreate or drop a continuous aggregate:
Create or drop all the continuous aggregates in the proper order to build them hierarchically. See more about how it works in this blog post.
PageLoad.create_continuous_aggregates PageLoad.drop_continuous_aggregatesNext steps
Now that you have integrated the ruby gem into your app:
- Learn more about the TimescaleDB gem.
- Check out the official docs.
- Follow the LTTB, Open AI long-term storage, and candlesticks tutorials.
===== PAGE: https://docs.tigerdata.com/_partials/_add-data-energy/ =====
Load energy consumption data
When you have your database set up, you can load the energy consumption data into the
metricshypertable.This is a large dataset, so it might take a long time, depending on your network connection.
- Download the dataset:
Use your file manager to decompress the downloaded dataset, and take a note of the path to the
metrics.csvfile.At the psql prompt, copy the data from the
metrics.csvfile into your hypertable. Make sure you point to the correct path, if it is not in your current working directory:\COPY metrics FROM metrics.csv CSV;You can check that the data has been copied successfully with this command:
SELECT * FROM metrics LIMIT 5;
You should get five records that look like this:
created | type_id | value -------------------------------+---------+------- 2023-05-31 23:59:59.043264+00 | 13 | 1.78 2023-05-31 23:59:59.042673+00 | 2 | 126 2023-05-31 23:59:59.042667+00 | 11 | 1.79 2023-05-31 23:59:59.042623+00 | 23 | 0.408 2023-05-31 23:59:59.042603+00 | 12 | 0.96===== PAGE: https://docs.tigerdata.com/_partials/_migrate_dual_write_dump_database_roles/ =====
pg_dumpall -d "source" \ -l database name \ --quote-all-identifiers \ --roles-only \ --file=roles.sqlTiger Cloud services do not support roles with superuser access. If your SQL dump includes roles that have such permissions, you'll need to modify the file to be compliant with the security model.
You can use the following
sedcommand to remove unsupported statements and permissions from your roles.sql file:sed -i -E \ -e '/CREATE ROLE "postgres";/d' \ -e '/ALTER ROLE "postgres"/d' \ -e '/CREATE ROLE "tsdbadmin";/d' \ -e '/ALTER ROLE "tsdbadmin"/d' \ -e 's/(NO)*SUPERUSER//g' \ -e 's/(NO)*REPLICATION//g' \ -e 's/(NO)*BYPASSRLS//g' \ -e 's/GRANTED BY "[^"]*"//g' \ roles.sqlThis command works only with the GNU implementation of sed (sometimes referred to as gsed). For the BSD implementation (the default on macOS), you need to add an extra argument to change the
-iflag to-i ''.To check the sed version, you can use the command
sed --version. While the GNU version explicitly identifies itself as GNU, the BSD version of sed generally doesn't provide a straightforward --version flag and simply outputs an "illegal option" error.A brief explanation of this script is:
CREATE ROLE "postgres"; andALTER ROLE "postgres": These statements are removed because they require superuser access, which is not supported by Timescale.(NO)SUPERUSER|(NO)REPLICATION|(NO)BYPASSRLS: These are permissions that require superuser access.GRANTED BY role_specification: The GRANTED BY clause can also have permissions that require superuser access and should therefore be removed. Note: according to the TimescaleDB documentation, the GRANTOR in the GRANTED BY clause must be the current user, and this clause mainly serves the purpose of SQL compatibility. Therefore, it's safe to remove it.
===== PAGE: https://docs.tigerdata.com/_partials/_install-self-hosted-debian-based-start/ =====
Install the latest Postgres packages
sudo apt install gnupg postgresql-common apt-transport-https lsb-release wgetRun the Postgres package setup script
sudo /usr/share/postgresql-common/pgdg/apt.postgresql.org.sh
===== PAGE: https://docs.tigerdata.com/_partials/_free-plan-beta/ =====
The Free pricing plan and services are currently in beta.
===== PAGE: https://docs.tigerdata.com/_partials/_livesync-configure-source-database/ =====
Tune the Write Ahead Log (WAL) on the Postgres source database
psql source <<EOF ALTER SYSTEM SET wal_level='logical'; ALTER SYSTEM SET max_wal_senders=10; ALTER SYSTEM SET wal_sender_timeout=0; EOF
This will require a restart of the Postgres source database.
Create a user for the connector and assign permissions
Create
<pg connector username>:psql source -c "CREATE USER <pg connector username> PASSWORD '<password>'"
You can use an existing user. However, you must ensure that the user has the following permissions.
Grant permissions to create a replication slot:
psql source -c "ALTER ROLE <pg connector username> REPLICATION"Grant permissions to create a publication:
psql source -c "GRANT CREATE ON DATABASE <database name> TO <pg connector username>"Assign the user permissions on the source database:
psql source <<EOF GRANT USAGE ON SCHEMA "public" TO <pg connector username>; GRANT SELECT ON ALL TABLES IN SCHEMA "public" TO <pg connector username>; ALTER DEFAULT PRIVILEGES IN SCHEMA "public" GRANT SELECT ON TABLES TO <pg connector username>; EOF
If the tables you are syncing are not in the
publicschema, grant the user permissions for each schema you are syncing:psql source <<EOF GRANT USAGE ON SCHEMA <schema> TO <pg connector username>; GRANT SELECT ON ALL TABLES IN SCHEMA <schema> TO <pg connector username>; ALTER DEFAULT PRIVILEGES IN SCHEMA <schema> GRANT SELECT ON TABLES TO <pg connector username>; EOFOn each table you want to sync, make
<pg connector username>the owner:psql source -c 'ALTER TABLE OWNER TO <pg connector username>;'
You can skip this step if the replicating user is already the owner of the tables.
Enable replication
DELETEandUPDATEoperations
Replica identity assists data replication by identifying the rows being modified. Your options are that each table and hypertable in the source database should either have:
- A primary key: data replication defaults to the primary key of the table being replicated. Nothing to do.
- A viable unique index: each table has a unique, non-partial, non-deferrable index that includes only columns
marked as
NOT NULL. If a UNIQUE index does not exist, create one to assist the migration. You can delete if after migration.
For each table, set
REPLICA IDENTITYto the viable unique index:psql -X -d source -c 'ALTER TABLE REPLICA IDENTITY USING INDEX <_index_name>'- No primary key or viable unique index: use brute force.
For each table, set
REPLICA IDENTITYtoFULL:psql -X -d source -c 'ALTER TABLE {table_name} REPLICA IDENTITY FULL'For each
UPDATEorDELETEstatement, Postgres reads the whole table to find all matching rows. This results in significantly slower replication. If you are expecting a large number ofUPDATEorDELETEoperations on the table, best practice is to not useFULL.===== PAGE: https://docs.tigerdata.com/_partials/_datadog-data-exporter/ =====
- In Tiger Cloud Console, open Exporters
- Click
New exporter Select
MetricsforData typeandDatadogfor provider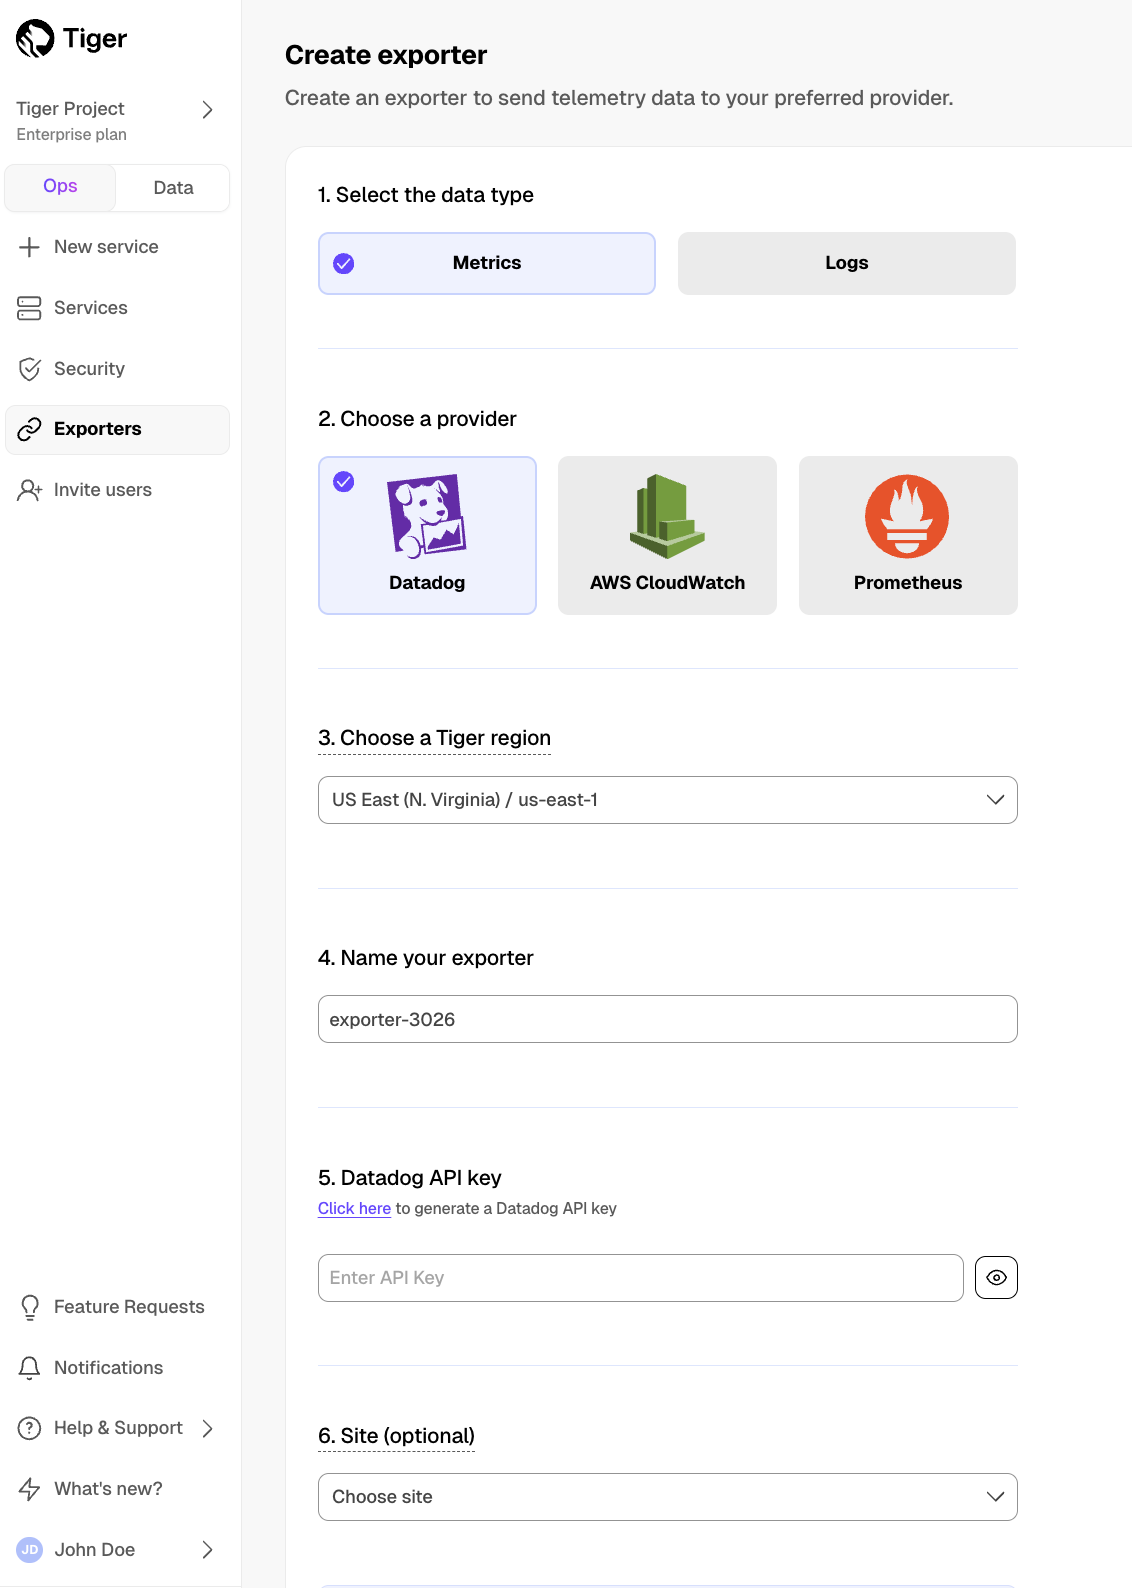
Choose your AWS region and provide the API key
The AWS region must be the same for your Tiger Cloud exporter and the Datadog provider.
Set
Siteto your Datadog region, then clickCreate exporter
===== PAGE: https://docs.tigerdata.com/_partials/_migrate_dual_write_6e_turn_on_compression_policies/ =====
6e. Enable policies that compress data in the target hypertable
In the following command, replace
<hypertable>with the fully qualified table name of the target hypertable, for examplepublic.metrics:psql -d target -f -v hypertable=<hypertable> - <<'EOF' SELECT public.alter_job(j.id, scheduled=>true) FROM _timescaledb_config.bgw_job j JOIN _timescaledb_catalog.hypertable h ON h.id = j.hypertable_id WHERE j.proc_schema IN ('_timescaledb_internal', '_timescaledb_functions') AND j.proc_name = 'policy_compression' AND j.id >= 1000 AND format('%I.%I', h.schema_name, h.table_name)::text::regclass = :'hypertable'::text::regclass; EOF===== PAGE: https://docs.tigerdata.com/_partials/_install-self-hosted-redhat-rocky/ =====
Install TimescaleDB
To avoid errors, do not install TimescaleDB Apache 2 Edition and TimescaleDB Community Edition at the same time.
sudo dnf install -y postgresql16-server postgresql16-contrib timescaledb-2-postgresql-16Initialize the Postgres instance
sudo /usr/pgsql-16/bin/postgresql-16-setup initdb
Tune your Postgres instance for TimescaleDB
sudo timescaledb-tune --pg-config=/usr/pgsql-16/bin/pg_configThis script is included with the
timescaledb-toolspackage when you install TimescaleDB. For more information, see configuration.Enable and start Postgres
sudo systemctl enable postgresql-16 sudo systemctl start postgresql-16Log in to Postgres as
postgressudo -u postgres psqlYou are now in the psql shell.
Set the password for
postgres\password postgresWhen you have set the password, type
\qto exit psql.
===== PAGE: https://docs.tigerdata.com/_partials/_cloud-mst-restart-workers/ =====
On Tiger Cloud and Managed Service for TimescaleDB, restart background workers by doing one of the following:
- Run
SELECT timescaledb_pre_restore(), followed bySELECT timescaledb_post_restore(). - Power the service off and on again. This might cause a downtime of a few minutes while the service restores from backup and replays the write-ahead log.
===== PAGE: https://docs.tigerdata.com/_partials/_migrate_live_setup_enable_replication/ =====
Replica identity assists data replication by identifying the rows being modified. Your options are that each table and hypertable in the source database should either have:
- A primary key: data replication defaults to the primary key of the table being replicated. Nothing to do.
- A viable unique index: each table has a unique, non-partial, non-deferrable index that includes only columns
marked as
NOT NULL. If a UNIQUE index does not exist, create one to assist the migration. You can delete if after migration.
For each table, set
REPLICA IDENTITYto the viable unique index:psql -X -d source -c 'ALTER TABLE REPLICA IDENTITY USING INDEX <_index_name>'- No primary key or viable unique index: use brute force.
For each table, set
REPLICA IDENTITYtoFULL:psql -X -d source -c 'ALTER TABLE {table_name} REPLICA IDENTITY FULL'For each
UPDATEorDELETEstatement, Postgres reads the whole table to find all matching rows. This results in significantly slower replication. If you are expecting a large number ofUPDATEorDELETEoperations on the table, best practice is to not useFULL.===== PAGE: https://docs.tigerdata.com/_partials/_timescale-cloud-platforms/ =====
You use Tiger Data's open-source products to create your best app from the comfort of your own developer environment.
See the available services and supported systems.
Available services
Tiger Data offers the following services for your self-hosted installations:
<thead> <tr> <th>Service type</th> <th>Description</th> </tr> </thead> <tbody> <tr> <td><strong>Self-hosted support</strong></td> <td><ul><li>24/7 support no matter where you are.</li><li>An experienced global ops and support team that can build and manage Postgres at scale.</li></ul> Want to try it out? <a href="https://www.tigerdata.com/self-managed-support">See how we can help</a>. </td> </tr> </tbody>Postgres, TimescaleDB support matrix
TimescaleDB and TimescaleDB Toolkit run on Postgres v10, v11, v12, v13, v14, v15, v16, and v17. Currently Postgres 15 and higher are supported.
| TimescaleDB version |Postgres 17|Postgres 16|Postgres 15|Postgres 14|Postgres 13|Postgres 12|Postgres 11|Postgres 10| |-----------------------|-|-|-|-|-|-|-|-| | 2.22.x |✅|✅|✅|❌|❌|❌|❌|❌|❌| | 2.21.x |✅|✅|✅|❌|❌|❌|❌|❌|❌| | 2.20.x |✅|✅|✅|❌|❌|❌|❌|❌|❌| | 2.17 - 2.19 |✅|✅|✅|✅|❌|❌|❌|❌|❌| | 2.16.x |❌|✅|✅|✅|❌|❌|❌|❌|❌|❌| | 2.13 - 2.15 |❌|✅|✅|✅|✅|❌|❌|❌|❌| | 2.12.x |❌|❌|✅|✅|✅|❌|❌|❌|❌| | 2.10.x |❌|❌|✅|✅|✅|✅|❌|❌|❌| | 2.5 - 2.9 |❌|❌|❌|✅|✅|✅|❌|❌|❌| | 2.4 |❌|❌|❌|❌|✅|✅|❌|❌|❌| | 2.1 - 2.3 |❌|❌|❌|❌|✅|✅|✅|❌|❌| | 2.0 |❌|❌|❌|❌|❌|✅|✅|❌|❌ | 1.7 |❌|❌|❌|❌|❌|✅|✅|✅|✅|
We recommend not using TimescaleDB with Postgres 17.1, 16.5, 15.9, 14.14, 13.17, 12.21. These minor versions introduced a breaking binary interface change that, once identified, was reverted in subsequent minor Postgres versions 17.2, 16.6, 15.10, 14.15, 13.18, and 12.22. When you build from source, best practice is to build with Postgres 17.2, 16.6, etc and higher. Users of Tiger Cloud and platform packages for Linux, Windows, MacOS, Docker, and Kubernetes are unaffected.
Supported operating system
You can deploy TimescaleDB and TimescaleDB Toolkit on the following systems:
Operation system Version Debian 13 Trixe, 12 Bookworm, 11 Bullseye Ubuntu 24.04 Noble Numbat, 22.04 LTS Jammy Jellyfish Red Hat Enterprise Linux 9, Linux 8 Fedora Fedora 35, Fedora 34, Fedora 33 Rocky Linux Rocky Linux 9 (x86_64), Rocky Linux 8 ArchLinux (community-supported) Check the available packages Operation system Version Microsoft Windows 10, 11 Microsoft Windows Server 2019, 2020 Operation system Version macOS From 10.15 Catalina to 14 Sonoma ===== PAGE: https://docs.tigerdata.com/_partials/_migrate_install_psql_ec2_instance/ =====
Install the psql client tools on the intermediary instance
Connect to your intermediary EC2 instance. For example:
ssh -i "<key-pair>.pem" ubuntu@<EC2 instance's Public IPv4>On your intermediary EC2 instance, install the Postgres client.
sudo sh -c 'echo "deb http://apt.postgresql.org/pub/repos/apt $(lsb_release -cs)-pgdg main" > /etc/apt/sources.list.d/pgdg.list' wget -qO- https://www.postgresql.org/media/keys/ACCC4CF8.asc | sudo tee /etc/apt/trusted.gpg.d/pgdg.asc &>/dev/null sudo apt update sudo apt install postgresql-client-16 -y # "postgresql-client-16" if your source DB is using PG 16. psql --version && pg_dump --version
Keep this terminal open, you need it to connect to the RDS instance for migration.
Setup secure connectivity between your RDS and EC2 instances
- In https://console.aws.amazon.com/rds/home#databases:, select the RDS instance to migrate.
- Scroll down to
Security group rules (1)and select theEC2 Security Group - Inboundgroup. TheSecurity Groups (1)window opens. Click theSecurity group ID, then clickEdit inbound rules

On your intermediary EC2 instance, get your local IP address:
ec2metadata --local-ipv4Bear with me on this one, you need this IP address to enable access to your RDS instance,
In
Edit inbound rules, clickAdd rule, then create aPostgreSQL,TCPrule granting access to the local IP address for your EC2 instance (told you :-)). Then clickSave rules.

Test the connection between your RDS and EC2 instances
- In https://console.aws.amazon.com/rds/home#databases:, select the RDS instance to migrate.
- On your intermediary EC2 instance, use the values of
Endpoint,Port,Master username, andDB nameto create the postgres connectivity string to theSOURCEvariable.

export SOURCE="postgres://<Master username>:<Master password>@<Endpoint>:<Port>/<DB name>"The value of
Master passwordwas supplied when this Postgres RDS instance was created.Test your connection:
psql -d sourceYou are connected to your RDS instance from your intermediary EC2 instance.
===== PAGE: https://docs.tigerdata.com/_partials/_migrate_live_setup_connection_strings/ =====
These variables hold the connection information for the source database and target Tiger Cloud service. In Terminal on your migration machine, set the following:
export SOURCE="postgres://<user>:<password>@<source host>:<source port>/<db_name>" export TARGET="postgres://tsdbadmin:<PASSWORD>@<HOST>:<PORT>/tsdb?sslmode=require"You find the connection information for your Tiger Cloud service in the configuration file you downloaded when you created the service.
Avoid using connection strings that route through connection poolers like PgBouncer or similar tools. This tool requires a direct connection to the database to function properly.
===== PAGE: https://docs.tigerdata.com/_partials/_psql-installation-windows/ =====
Install psql on Windows
The
psqltool is installed by default on Windows systems when you install Postgres, and this is the most effective way to install the tool. These instructions use the interactive installer provided by Postgres and EnterpriseDB.Installing psql on Windows
- Download and run the Postgres installer from www.enterprisedb.com.
- In the
Select Componentsdialog, checkCommand Line Tools, along with any other components you want to install, and clickNext. - Complete the installation wizard to install the package.
===== PAGE: https://docs.tigerdata.com/_partials/_migrate_live_run_live_migration/ =====
Pull the live-migration docker image to you migration machine
sudo docker pull timescale/live-migration:latest
To list the available commands, run:
sudo docker run --rm -it -e PGCOPYDB_SOURCE_PGURI=source timescale/live-migration:latest --helpTo see the available flags for each command, run
--helpfor that command. For example:sudo docker run --rm -it -e PGCOPYDB_SOURCE_PGURI=source timescale/live-migration:latest migrate --help- Create a snapshot image of your source database in your Tiger Cloud service
This process checks that you have tuned your source database and target service correctly for replication, then creates a snapshot of your data on the migration machine:
docker run --rm -it --name live-migration-snapshot \ -e PGCOPYDB_SOURCE_PGURI=source \ -e PGCOPYDB_TARGET_PGURI=target \ --pid=host \ -v ~/live-migration:/opt/timescale/ts_cdc \ timescale/live-migration:latest snapshotLive-migration supplies information about updates you need to make to the source database and target service. For example:
2024-03-25T12:40:40.884 WARNING: The following tables in the Source DB have neither a primary key nor a REPLICA IDENTITY (FULL/INDEX) 2024-03-25T12:40:40.884 WARNING: UPDATE and DELETE statements on these tables will not be replicated to the Target DB 2024-03-25T12:40:40.884 WARNING: - public.metricsIf you have warnings, stop live-migration, make the suggested changes and start again.
Synchronize data between your source database and your Tiger Cloud service
This command migrates data from the snapshot to your Tiger Cloud service, then streams transactions from the source to the target.
docker run --rm -it --name live-migration-migrate \ -e PGCOPYDB_SOURCE_PGURI=source \ -e PGCOPYDB_TARGET_PGURI=target \ --pid=host \ -v ~/live-migration:/opt/timescale/ts_cdc \ timescale/live-migration:latest migrate
If the source Postgres version is 17 or later, you need to pass additional flag
-e PGVERSION=17to themigratecommand.After migrating the schema, live-migration prompts you to create hypertables for tables that contain time-series data in your Tiger Cloud service. Run
create_hypertable()to convert these table. For more information, see the Hypertable docs.During this process, you see the migration process:
Live-replay will complete in 1 minute 38.631 seconds (source_wal_rate: 106.0B/s, target_replay_rate: 589.0KiB/s, replay_lag: 56MiB)If
migratestops add--resumeto start from where it left off.Once the data in your target Tiger Cloud service has almost caught up with the source database, you see the following message:
Target has caught up with source (source_wal_rate: 751.0B/s, target_replay_rate: 0B/s, replay_lag: 7KiB) To stop replication, hit 'c' and then ENTERWait until
replay_lagis down to a few kilobytes before you move to the next step. Otherwise, data replication may not have finished.Start app downtime
Stop your app writing to the source database, then let the the remaining transactions finish to fully sync with the target. You can use tools like the
pg_topCLI orpg_stat_activityto view the current transaction on the source database.Stop Live-migration.
hit 'c' and then ENTER
Live-migration continues the remaining work. This includes copying TimescaleDB metadata, sequences, and run policies. When the migration completes, you see the following message:
Migration successfully completed
===== PAGE: https://docs.tigerdata.com/_partials/_experimental/ =====
Experimental features could have bugs. They might not be backwards compatible, and could be removed in future releases. Use these features at your own risk, and do not use any experimental features in production.
===== PAGE: https://docs.tigerdata.com/_partials/_compression-intro/ =====
Compressing your time-series data allows you to reduce your chunk size by more than 90%. This saves on storage costs, and keeps your queries operating at lightning speed.
When you enable compression, the data in your hypertable is compressed chunk by chunk. When the chunk is compressed, multiple records are grouped into a single row. The columns of this row hold an array-like structure that stores all the data. This means that instead of using lots of rows to store the data, it stores the same data in a single row. Because a single row takes up less disk space than many rows, it decreases the amount of disk space required, and can also speed up your queries.
For example, if you had a table with data that looked a bit like this:
|Timestamp|Device ID|Device Type|CPU|Disk IO| |-|-|-|-|-| |12:00:01|A|SSD|70.11|13.4| |12:00:01|B|HDD|69.70|20.5| |12:00:02|A|SSD|70.12|13.2| |12:00:02|B|HDD|69.69|23.4| |12:00:03|A|SSD|70.14|13.0| |12:00:03|B|HDD|69.70|25.2|
You can convert this to a single row in array form, like this:
|Timestamp|Device ID|Device Type|CPU|Disk IO| |-|-|-|-|-| |[12:00:01, 12:00:01, 12:00:02, 12:00:02, 12:00:03, 12:00:03]|[A, B, A, B, A, B]|[SSD, HDD, SSD, HDD, SSD, HDD]|[70.11, 69.70, 70.12, 69.69, 70.14, 69.70]|[13.4, 20.5, 13.2, 23.4, 13.0, 25.2]|
===== PAGE: https://docs.tigerdata.com/_partials/_prereqs-cloud-only/ =====
To follow the steps on this page:
- Create a target Tiger Cloud service with real-time analytics enabled.
You need your connection details.
===== PAGE: https://docs.tigerdata.com/_partials/_hypercore_manual_workflow/ =====
- Stop the jobs that are automatically adding chunks to the columnstore
Retrieve the list of jobs from the timescaledb_information.jobs view to find the job you need to alter_job.
SELECT alter_job(JOB_ID, scheduled => false);Convert a chunk to update back to the rowstore
CALL convert_to_rowstore('_timescaledb_internal._hyper_2_2_chunk');Update the data in the chunk you added to the rowstore
Best practice is to structure your INSERT statement to include appropriate partition key values, such as the timestamp. TimescaleDB adds the data to the correct chunk:
INSERT INTO metrics (time, value) VALUES ('2025-01-01T00:00:00', 42);Convert the updated chunks back to the columnstore
CALL convert_to_columnstore('_timescaledb_internal._hyper_1_2_chunk');Restart the jobs that are automatically converting chunks to the columnstore
SELECT alter_job(JOB_ID, scheduled => true);
===== PAGE: https://docs.tigerdata.com/_partials/_migrate_dump_roles_schema_data_mst/ =====
- Dump the roles from your source database
Export your role-based security hierarchy.
<db_name>has the same value as<db_name>insource. I know, it confuses me as well.pg_dumpall -d "source" \ -l <db_name> \ --quote-all-identifiers \ --roles-only \ --no-role-passwords \ --file=roles.sqlMST does not allow you to export passwords with roles. You assign passwords to these roles when you have uploaded them to your Tiger Cloud service.
- Remove roles with superuser access
Tiger Cloud services do not support roles with superuser access. Run the following script to remove statements, permissions and clauses that require superuser permissions from
roles.sql:sed -i -E \ -e '/DROP ROLE IF EXISTS "postgres";/d' \ -e '/DROP ROLE IF EXISTS "tsdbadmin";/d' \ -e '/CREATE ROLE "postgres";/d' \ -e '/ALTER ROLE "postgres"/d' \ -e '/CREATE ROLE "rds/d' \ -e '/ALTER ROLE "rds/d' \ -e '/TO "rds/d' \ -e '/GRANT "rds/d' \ -e '/GRANT "pg_read_all_stats" TO "tsdbadmin"/d' \ -e 's/(NO)*SUPERUSER//g' \ -e 's/(NO)*REPLICATION//g' \ -e 's/(NO)*BYPASSRLS//g' \ -e 's/GRANTED BY "[^"]*"//g' \ -e '/CREATE ROLE "tsdbadmin";/d' \ -e '/ALTER ROLE "tsdbadmin"/d' \ -e 's/WITH ADMIN OPTION,/WITH /g' \ -e 's/WITH ADMIN OPTION//g' \ -e 's/GRANTED BY ".*"//g' \ -e '/GRANT "pg_.*" TO/d' \ -e '/CREATE ROLE "_aiven";/d' \ -e '/ALTER ROLE "_aiven"/d' \ -e '/GRANT SET ON PARAMETER "pgaudit\.[^"]+" TO "_tsdbadmin_auditing"/d' \ -e '/GRANT SET ON PARAMETER "anon\.[^"]+" TO "tsdbadmin_group"/d' \ roles.sql- Dump the source database schema and data
The
pg_dumpflags remove superuser access and tablespaces from your data. When you runpgdump, check the run time, a long-runningpg_dumpcan cause issues.pg_dump -d "source" \ --format=plain \ --quote-all-identifiers \ --no-tablespaces \ --no-owner \ --no-privileges \ --file=dump.sqlTo dramatically reduce the time taken to dump the source database, using multiple connections. For more information, see dumping with concurrency and restoring with concurrency.
===== PAGE: https://docs.tigerdata.com/_partials/_migrate_live_migrate_data_timescaledb/ =====
Migrate your data, then start downtime
Pull the live-migration docker image to you migration machine
sudo docker pull timescale/live-migration:latest
To list the available commands, run:
sudo docker run --rm -it -e PGCOPYDB_SOURCE_PGURI=source timescale/live-migration:latest --helpTo see the available flags for each command, run
--helpfor that command. For example:sudo docker run --rm -it -e PGCOPYDB_SOURCE_PGURI=source timescale/live-migration:latest migrate --help- Create a snapshot image of your source database in your Tiger Cloud service
This process checks that you have tuned your source database and target service correctly for replication, then creates a snapshot of your data on the migration machine:
docker run --rm -it --name live-migration-snapshot \ -e PGCOPYDB_SOURCE_PGURI=source \ -e PGCOPYDB_TARGET_PGURI=target \ --pid=host \ -v ~/live-migration:/opt/timescale/ts_cdc \ timescale/live-migration:latest snapshotLive-migration supplies information about updates you need to make to the source database and target service. For example:
2024-03-25T12:40:40.884 WARNING: The following tables in the Source DB have neither a primary key nor a REPLICA IDENTITY (FULL/INDEX) 2024-03-25T12:40:40.884 WARNING: UPDATE and DELETE statements on these tables will not be replicated to the Target DB 2024-03-25T12:40:40.884 WARNING: - public.metricsIf you have warnings, stop live-migration, make the suggested changes and start again.
Synchronize data between your source database and your Tiger Cloud service
This command migrates data from the snapshot to your Tiger Cloud service, then streams transactions from the source to the target.
docker run --rm -it --name live-migration-migrate \ -e PGCOPYDB_SOURCE_PGURI=source \ -e PGCOPYDB_TARGET_PGURI=target \ --pid=host \ -v ~/live-migration:/opt/timescale/ts_cdc \ timescale/live-migration:latest migrate
If the source Postgres version is 17 or later, you need to pass additional flag
-e PGVERSION=17to themigratecommand.During this process, you see the migration process:
Live-replay will complete in 1 minute 38.631 seconds (source_wal_rate: 106.0B/s, target_replay_rate: 589.0KiB/s, replay_lag: 56MiB)If
migratestops add--resumeto start from where it left off.Once the data in your target Tiger Cloud service has almost caught up with the source database, you see the following message:
Target has caught up with source (source_wal_rate: 751.0B/s, target_replay_rate: 0B/s, replay_lag: 7KiB) To stop replication, hit 'c' and then ENTERWait until
replay_lagis down to a few kilobytes before you move to the next step. Otherwise, data replication may not have finished.Start app downtime
Stop your app writing to the source database, then let the the remaining transactions finish to fully sync with the target. You can use tools like the
pg_topCLI orpg_stat_activityto view the current transaction on the source database.Stop Live-migration.
hit 'c' and then ENTER
Live-migration continues the remaining work. This includes copying TimescaleDB metadata, sequences, and run policies. When the migration completes, you see the following message:
Migration successfully completed
===== PAGE: https://docs.tigerdata.com/_partials/_prereqs-cloud-account-only/ =====
To follow the steps on this page:
- Create a target Tiger Data account.
===== PAGE: https://docs.tigerdata.com/_partials/_migrate_set_up_database_first_steps/ =====
- Take the applications that connect to the source database offline
The duration of the migration is proportional to the amount of data stored in your database. By disconnection your app from your database you avoid and possible data loss.
- Set your connection strings
These variables hold the connection information for the source database and target Tiger Cloud service:
export SOURCE="postgres://<user>:<password>@<source host>:<source port>/<db_name>" export TARGET="postgres://tsdbadmin:<PASSWORD>@<HOST>:<PORT>/tsdb?sslmode=require"You find the connection information for your Tiger Cloud service in the configuration file you downloaded when you created the service.
===== PAGE: https://docs.tigerdata.com/_partials/_install-self-hosted-redhat/ =====
Install the latest Postgres packages
sudo yum install https://download.postgresql.org/pub/repos/yum/reporpms/EL-$(rpm -E %{rhel})-x86_64/pgdg-redhat-repo-latest.noarch.rpmAdd the TimescaleDB repository
sudo tee /etc/yum.repos.d/timescale_timescaledb.repo <<EOL [timescale_timescaledb] name=timescale_timescaledb baseurl=https://packagecloud.io/timescale/timescaledb/el/$(rpm -E %{rhel})/\$basearch repo_gpgcheck=1 gpgcheck=0 enabled=1 gpgkey=https://packagecloud.io/timescale/timescaledb/gpgkey sslverify=1 sslcacert=/etc/pki/tls/certs/ca-bundle.crt metadata_expire=300 EOLUpdate your local repository list
sudo yum updateInstall TimescaleDB
To avoid errors, do not install TimescaleDB Apache 2 Edition and TimescaleDB Community Edition at the same time.
sudo yum install timescaledb-2-postgresql-17 postgresql17On Red Hat Enterprise Linux 8 and later, disable the built-in Postgres module:
sudo dnf -qy module disable postgresqlInitialize the Postgres instance
sudo /usr/pgsql-17/bin/postgresql-17-setup initdb
Tune your Postgres instance for TimescaleDB
sudo timescaledb-tune --pg-config=/usr/pgsql-17/bin/pg_configThis script is included with the
timescaledb-toolspackage when you install TimescaleDB. For more information, see configuration.Enable and start Postgres
sudo systemctl enable postgresql-17 sudo systemctl start postgresql-17Log in to Postgres as
postgressudo -u postgres psqlYou are now in the psql shell.
Set the password for
postgres\password postgresWhen you have set the password, type
\qto exit psql.
===== PAGE: https://docs.tigerdata.com/_partials/_chunk-interval/ =====
Postgres builds the index on the fly during ingestion. That means that to build a new entry on the index, a significant portion of the index needs to be traversed during every row insertion. When the index does not fit into memory, it is constantly flushed to disk and read back. This wastes IO resources which would otherwise be used for writing the heap/WAL data to disk.
The default chunk interval is 7 days. However, best practice is to set
chunk_intervalso that prior to processing, the indexes for chunks currently being ingested into fit within 25% of main memory. For example, on a system with 64 GB of memory, if index growth is approximately 2 GB per day, a 1-week chunk interval is appropriate. If index growth is around 10 GB per day, use a 1-day interval.You set
chunk_intervalwhen you create a hypertable, or by callingset_chunk_time_intervalon an existing hypertable.===== PAGE: https://docs.tigerdata.com/_partials/_migrate_live_tune_source_database_mst/ =====
- Enable live-migration to replicate
DELETEandUPDATEoperations
Replica identity assists data replication by identifying the rows being modified. Your options are that each table and hypertable in the source database should either have:
- A primary key: data replication defaults to the primary key of the table being replicated. Nothing to do.
- A viable unique index: each table has a unique, non-partial, non-deferrable index that includes only columns
marked as
NOT NULL. If a UNIQUE index does not exist, create one to assist the migration. You can delete if after migration.
For each table, set
REPLICA IDENTITYto the viable unique index:psql -X -d source -c 'ALTER TABLE REPLICA IDENTITY USING INDEX <_index_name>'- No primary key or viable unique index: use brute force.
For each table, set
REPLICA IDENTITYtoFULL:psql -X -d source -c 'ALTER TABLE {table_name} REPLICA IDENTITY FULL'For each
UPDATEorDELETEstatement, Postgres reads the whole table to find all matching rows. This results in significantly slower replication. If you are expecting a large number ofUPDATEorDELETEoperations on the table, best practice is to not useFULL.===== PAGE: https://docs.tigerdata.com/_partials/_tutorials_hypertable_intro/ =====
Hypertables are Postgres tables in TimescaleDB that automatically partition your time-series data by time. Time-series data represents the way a system, process, or behavior changes over time. Hypertables enable TimescaleDB to work efficiently with time-series data. Each hypertable is made up of child tables called chunks. Each chunk is assigned a range of time, and only contains data from that range. When you run a query, TimescaleDB identifies the correct chunk and runs the query on it, instead of going through the entire table.
Hypercore is the hybrid row-columnar storage engine in TimescaleDB used by hypertables. Traditional databases force a trade-off between fast inserts (row-based storage) and efficient analytics (columnar storage). Hypercore eliminates this trade-off, allowing real-time analytics without sacrificing transactional capabilities.
Hypercore dynamically stores data in the most efficient format for its lifecycle:
- Row-based storage for recent data: the most recent chunk (and possibly more) is always stored in the rowstore, ensuring fast inserts, updates, and low-latency single record queries. Additionally, row-based storage is used as a writethrough for inserts and updates to columnar storage.
- Columnar storage for analytical performance: chunks are automatically compressed into the columnstore, optimizing storage efficiency and accelerating analytical queries.
Unlike traditional columnar databases, hypercore allows data to be inserted or modified at any stage, making it a flexible solution for both high-ingest transactional workloads and real-time analytics—within a single database.
Because TimescaleDB is 100% Postgres, you can use all the standard Postgres tables, indexes, stored procedures, and other objects alongside your hypertables. This makes creating and working with hypertables similar to standard Postgres.
===== PAGE: https://docs.tigerdata.com/_partials/_hypertable-intro/ =====
Tiger Cloud supercharges your real-time analytics by letting you run complex queries continuously, with near-zero latency. Under the hood, this is achieved by using hypertables—Postgres tables that automatically partition your time-series data by time and optionally by other dimensions. When you run a query, Tiger Cloud identifies the correct partition, called chunk, and runs the query on it, instead of going through the entire table.
Hypertables offer the following benefits:
Efficient data management with automated partitioning by time: Tiger Cloud splits your data into chunks that hold data from a specific time range. For example, one day or one week. You can configure this range to better suit your needs.
Better performance with strategic indexing: an index on time in the descending order is automatically created when you create a hypertable. More indexes are created on the chunk level, to optimize performance. You can create additional indexes, including unique indexes, on the columns you need.
Faster queries with chunk skipping: Tiger Cloud skips the chunks that are irrelevant in the context of your query, dramatically reducing the time and resources needed to fetch results. Even more—you can enable chunk skipping on non-partitioning columns.
Advanced data analysis with hyperfunctions: Tiger Cloud enables you to efficiently process, aggregate, and analyze significant volumes of data while maintaining high performance.
To top it all, there is no added complexity—you interact with hypertables in the same way as you would with regular Postgres tables. All the optimization magic happens behind the scenes.
Inheritance is not supported for hypertables and may lead to unexpected behavior.
===== PAGE: https://docs.tigerdata.com/_partials/_kubernetes-install-self-hosted/ =====
Running TimescaleDB on Kubernetes is similar to running Postgres. This procedure outlines the steps for a non-distributed system.
To connect your Kubernetes cluster to self-hosted TimescaleDB running in the cluster:
Create a default namespace for Tiger Data components
Create the Tiger Data namespace:
kubectl create namespace timescaleSet this namespace as the default for your session:
kubectl config set-context --current --namespace=timescale
For more information, see Kubernetes Namespaces.
- Set up a persistent volume claim (PVC) storage
To manually set up a persistent volume and claim for self-hosted Kubernetes, run the following command:
kubectl apply -f - <<EOF apiVersion: v1 kind: PersistentVolumeClaim metadata: name: timescale-pvc spec: accessModes: - ReadWriteOnce resources: requests: storage: 10Gi EOF- Deploy TimescaleDB as a StatefulSet
By default, the TimescaleDB Docker image you are installing on Kubernetes uses the default Postgres database, user and password. To deploy TimescaleDB on Kubernetes, run the following command:
```yaml kubectl apply -f - <<EOF apiVersion: apps/v1 kind: StatefulSet metadata: name: timescaledb spec: serviceName: timescaledb replicas: 1 selector: matchLabels: app: timescaledb template: metadata: labels: app: timescaledb spec: containers: - name: timescaledb image: 'timescale/timescaledb:latest-pg17' env: - name: POSTGRES_USER value: postgres - name: POSTGRES_PASSWORD value: postgres - name: POSTGRES_DB value: postgres - name: PGDATA value: /var/lib/postgresql/data/pgdata ports: - containerPort: 5432 volumeMounts: - mountPath: /var/lib/postgresql/data name: timescale-storage volumes: - name: timescale-storage persistentVolumeClaim: claimName: timescale-pvc EOF ```Allow applications to connect by exposing TimescaleDB within Kubernetes
kubectl apply -f - <<EOF apiVersion: v1 kind: Service metadata: name: timescaledb spec: selector: app: timescaledb ports: - protocol: TCP port: 5432 targetPort: 5432 type: ClusterIP EOFCreate a Kubernetes secret to store the database credentials
kubectl create secret generic timescale-secret \ --from-literal=PGHOST=timescaledb \ --from-literal=PGPORT=5432 \ --from-literal=PGDATABASE=postgres \ --from-literal=PGUSER=postgres \ --from-literal=PGPASSWORD=postgresDeploy an application that connects to TimescaleDB
kubectl apply -f - <<EOF apiVersion: apps/v1 kind: Deployment metadata: name: timescale-app spec: replicas: 1 selector: matchLabels: app: timescale-app template: metadata: labels: app: timescale-app spec: containers: - name: timescale-container image: postgres:latest envFrom: - secretRef: name: timescale-secret EOFTest the database connection
Create and run a pod to verify database connectivity using your connection details saved in
timescale-secret:kubectl run test-pod --image=postgres --restart=Never \ --env="PGHOST=$(kubectl get secret timescale-secret -o=jsonpath='{.data.PGHOST}' | base64 --decode)" \ --env="PGPORT=$(kubectl get secret timescale-secret -o=jsonpath='{.data.PGPORT}' | base64 --decode)" \ --env="PGDATABASE=$(kubectl get secret timescale-secret -o=jsonpath='{.data.PGDATABASE}' | base64 --decode)" \ --env="PGUSER=$(kubectl get secret timescale-secret -o=jsonpath='{.data.PGUSER}' | base64 --decode)" \ --env="PGPASSWORD=$(kubectl get secret timescale-secret -o=jsonpath='{.data.PGPASSWORD}' | base64 --decode)" \ -- sleep infinityLaunch the Postgres interactive shell within the created
test-pod:kubectl exec -it test-pod -- bash -c "psql -h \$PGHOST -U \$PGUSER -d \$PGDATABASE"
You see the Postgres interactive terminal.
===== PAGE: https://docs.tigerdata.com/_partials/_caggs-migrate-permissions/ =====
You might get a permissions error when migrating a continuous aggregate from old to new format using
cagg_migrate. The user performing the migration must have the following permissions:- Select, insert, and update permissions on the tables
_timescale_catalog.continuous_agg_migrate_planand_timescale_catalog.continuous_agg_migrate_plan_step - Usage permissions on the sequence
_timescaledb_catalog.continuous_agg_migrate_plan_step_step_id_seq
To solve the problem, change to a user capable of granting permissions, and grant the following permissions to the user performing the migration:
GRANT SELECT, INSERT, UPDATE ON TABLE _timescaledb_catalog.continuous_agg_migrate_plan TO <USER>; GRANT SELECT, INSERT, UPDATE ON TABLE _timescaledb_catalog.continuous_agg_migrate_plan_step TO <USER>; GRANT USAGE ON SEQUENCE _timescaledb_catalog.continuous_agg_migrate_plan_step_step_id_seq TO <USER>;===== PAGE: https://docs.tigerdata.com/_partials/_candlestick_intro/ =====
The financial sector regularly uses candlestick charts to visualize the price change of an asset. Each candlestick represents a time period, such as one minute or one hour, and shows how the asset's price changed during that time.
Candlestick charts are generated from the open, high, low, close, and volume data for each financial asset during the time period. This is often abbreviated as OHLCV:
- Open: opening price
- High: highest price
- Low: lowest price
- Close: closing price
- Volume: volume of transactions
===== PAGE: https://docs.tigerdata.com/_partials/_start-coding-java/ =====
Prerequisites
To follow the steps on this page:
- Create a target Tiger Cloud service with the Real-time analytics capability.
You need your connection details. This procedure also works for self-hosted TimescaleDB.
- Install the Java Development Kit (JDK).
- Install the PostgreSQL JDBC driver.
All code in this quick start is for Java 16 and later. If you are working with older JDK versions, use legacy coding techniques.
Connect to your Tiger Cloud service
In this section, you create a connection to your service using an application in a single file. You can use any of your favorite build tools, including
gradleormaven.Create a directory containing a text file called
Main.java, with this content:package com.timescale.java; public class Main { public static void main(String... args) { System.out.println("Hello, World!"); } }From the command line in the current directory, run the application:
java Main.javaIf the command is successful,
Hello, World!line output is printed to your console.Import the PostgreSQL JDBC driver. If you are using a dependency manager, include the PostgreSQL JDBC Driver as a dependency.
Download the JAR artifact of the JDBC Driver and save it with the
Main.javafile.Import the
JDBC Driverinto the Java application and display a list of available drivers for the check:package com.timescale.java; import java.sql.DriverManager; public class Main { public static void main(String... args) { DriverManager.drivers().forEach(System.out::println); } }Run all the examples:
java -cp *.jar Main.java
If the command is successful, a string similar to
org.postgresql.Driver@7f77e91bis printed to your console. This means that you are ready to connect to TimescaleDB from Java.Locate your TimescaleDB credentials and use them to compose a connection string for JDBC.
You'll need:
- password
- username
- host URL
- port
- database name
Compose your connection string variable, using this format:
var connUrl = "jdbc:postgresql://<HOSTNAME>:<PORT>/<DATABASE_NAME>?user=<USERNAME>&password=<PASSWORD>";For more information about creating connection strings, see the JDBC documentation.
This method of composing a connection string is for test or development purposes only. For production, use environment variables for sensitive details like your password, hostname, and port number.
package com.timescale.java; import java.sql.DriverManager; import java.sql.SQLException; public class Main { public static void main(String... args) throws SQLException { var connUrl = "jdbc:postgresql://<HOSTNAME>:<PORT>/<DATABASE_NAME>?user=<USERNAME>&password=<PASSWORD>"; var conn = DriverManager.getConnection(connUrl); System.out.println(conn.getClientInfo()); } }Run the code:
java -cp *.jar Main.javaIf the command is successful, a string similar to
{ApplicationName=PostgreSQL JDBC Driver}is printed to your console.
Create a relational table
In this section, you create a table called
sensorswhich holds the ID, type, and location of your fictional sensors. Additionally, you create a hypertable calledsensor_datawhich holds the measurements of those sensors. The measurements contain the time, sensor_id, temperature reading, and CPU percentage of the sensors.Compose a string which contains the SQL statement to create a relational table. This example creates a table called
sensors, with columnsid,typeandlocation:CREATE TABLE sensors ( id SERIAL PRIMARY KEY, type TEXT NOT NULL, location TEXT NOT NULL );Create a statement, execute the query you created in the previous step, and check that the table was created successfully:
package com.timescale.java; import java.sql.DriverManager; import java.sql.SQLException; public class Main { public static void main(String... args) throws SQLException { var connUrl = "jdbc:postgresql://<HOSTNAME>:<PORT>/<DATABASE_NAME>?user=<USERNAME>&password=<PASSWORD>"; var conn = DriverManager.getConnection(connUrl); var createSensorTableQuery = """ CREATE TABLE sensors ( id SERIAL PRIMARY KEY, type TEXT NOT NULL, location TEXT NOT NULL ) """; try (var stmt = conn.createStatement()) { stmt.execute(createSensorTableQuery); } var showAllTablesQuery = "SELECT tablename FROM pg_catalog.pg_tables WHERE schemaname = 'public'"; try (var stmt = conn.createStatement(); var rs = stmt.executeQuery(showAllTablesQuery)) { System.out.println("Tables in the current database: "); while (rs.next()) { System.out.println(rs.getString("tablename")); } } } }
Create a hypertable
When you have created the relational table, you can create a hypertable. Creating tables and indexes, altering tables, inserting data, selecting data, and most other tasks are executed on the hypertable.
Create a
CREATE TABLESQL statement for your hypertable. Notice how the hypertable has the compulsory time column:CREATE TABLE sensor_data ( time TIMESTAMPTZ NOT NULL, sensor_id INTEGER REFERENCES sensors (id), value DOUBLE PRECISION );Create a statement, execute the query you created in the previous step:
SELECT create_hypertable('sensor_data', by_range('time'));The
by_rangeandby_hashdimension builder is an addition to TimescaleDB 2.13.Execute the two statements you created, and commit your changes to the database:
package com.timescale.java; import java.sql.Connection; import java.sql.DriverManager; import java.sql.SQLException; import java.util.List; public class Main { public static void main(String... args) { final var connUrl = "jdbc:postgresql://<HOSTNAME>:<PORT>/<DATABASE_NAME>?user=<USERNAME>&password=<PASSWORD>"; try (var conn = DriverManager.getConnection(connUrl)) { createSchema(conn); insertData(conn); } catch (SQLException ex) { System.err.println(ex.getMessage()); } } private static void createSchema(final Connection conn) throws SQLException { try (var stmt = conn.createStatement()) { stmt.execute(""" CREATE TABLE sensors ( id SERIAL PRIMARY KEY, type TEXT NOT NULL, location TEXT NOT NULL ) """); } try (var stmt = conn.createStatement()) { stmt.execute(""" CREATE TABLE sensor_data ( time TIMESTAMPTZ NOT NULL, sensor_id INTEGER REFERENCES sensors (id), value DOUBLE PRECISION ) """); } try (var stmt = conn.createStatement()) { stmt.execute("SELECT create_hypertable('sensor_data', by_range('time'))"); } } }
Insert data
You can insert data into your hypertables in several different ways. In this section, you can insert single rows, or insert by batches of rows.
Open a connection to the database, use prepared statements to formulate the
INSERTSQL statement, then execute the statement:final List<Sensor> sensors = List.of( new Sensor("temperature", "bedroom"), new Sensor("temperature", "living room"), new Sensor("temperature", "outside"), new Sensor("humidity", "kitchen"), new Sensor("humidity", "outside")); for (final var sensor : sensors) { try (var stmt = conn.prepareStatement("INSERT INTO sensors (type, location) VALUES (?, ?)")) { stmt.setString(1, sensor.type()); stmt.setString(2, sensor.location()); stmt.executeUpdate(); } }
If you want to insert a batch of rows by using a batching mechanism. In this example, you generate some sample time-series data to insert into the
sensor_datahypertable:Insert batches of rows:
final var sensorDataCount = 100; final var insertBatchSize = 10; try (var stmt = conn.prepareStatement(""" INSERT INTO sensor_data (time, sensor_id, value) VALUES ( generate_series(now() - INTERVAL '24 hours', now(), INTERVAL '5 minutes'), floor(random() * 4 + 1)::INTEGER, random() ) """)) { for (int i = 0; i < sensorDataCount; i++) { stmt.addBatch(); if ((i > 0 && i % insertBatchSize == 0) || i == sensorDataCount - 1) { stmt.executeBatch(); } } }
Execute a query
This section covers how to execute queries against your database.
Execute queries on TimescaleDB
Define the SQL query you'd like to run on the database. This example combines time-series and relational data. It returns the average values for every 15 minute interval for sensors with specific type and location.
SELECT time_bucket('15 minutes', time) AS bucket, avg(value)
FROM sensor_data
JOIN sensors ON sensors.id = sensor_data.sensor_id
WHERE sensors.type = ? AND sensors.location = ?
GROUP BY bucket
ORDER BY bucket DESC;
Execute the query with the prepared statement and read out the result set for all
a-type sensors located on thefloor:try (var stmt = conn.prepareStatement(""" SELECT time_bucket('15 minutes', time) AS bucket, avg(value) FROM sensor_data JOIN sensors ON sensors.id = sensor_data.sensor_id WHERE sensors.type = ? AND sensors.location = ? GROUP BY bucket ORDER BY bucket DESC """)) { stmt.setString(1, "temperature"); stmt.setString(2, "living room"); try (var rs = stmt.executeQuery()) { while (rs.next()) { System.out.printf("%s: %f%n", rs.getTimestamp(1), rs.getDouble(2)); } } }If the command is successful, you'll see output like this:
2021-05-12 23:30:00.0: 0,508649
2021-05-12 23:15:00.0: 0,477852
2021-05-12 23:00:00.0: 0,462298
2021-05-12 22:45:00.0: 0,457006
2021-05-12 22:30:00.0: 0,568744
...
Next steps
Now that you're able to connect, read, and write to a TimescaleDB instance from your Java application, and generate the scaffolding necessary to build a new application from an existing TimescaleDB instance, be sure to check out these advanced TimescaleDB tutorials:
Complete code samples
This section contains complete code samples.
Complete code sample
package com.timescale.java;

import java.sql.Connection;
import java.sql.DriverManager;
import java.sql.SQLException;
import java.util.List;

public class Main {

    public static void main(String... args) {
        final var connUrl = "jdbc:postgresql://<HOSTNAME>:<PORT>/<DATABASE_NAME>?user=<USERNAME>&password=<PASSWORD>";
        try (var conn = DriverManager.getConnection(connUrl)) {
            createSchema(conn);
            insertData(conn);
        } catch (SQLException ex) {
            System.err.println(ex.getMessage());
        }
    }

    private static void createSchema(final Connection conn) throws SQLException {
        try (var stmt = conn.createStatement()) {
            stmt.execute("""
                    CREATE TABLE sensors (
                        id SERIAL PRIMARY KEY,
                        type TEXT NOT NULL,
                        location TEXT NOT NULL
                    )
                    """);
        }

        try (var stmt = conn.createStatement()) {
            stmt.execute("""
                    CREATE TABLE sensor_data (
                        time TIMESTAMPTZ NOT NULL,
                        sensor_id INTEGER REFERENCES sensors (id),
                        value DOUBLE PRECISION
                    )
                    """);
        }

        try (var stmt = conn.createStatement()) {
            stmt.execute("SELECT create_hypertable('sensor_data', by_range('time'))");
        }
    }

    private static void insertData(final Connection conn) throws SQLException {
        final List<Sensor> sensors = List.of(
                new Sensor("temperature", "bedroom"),
                new Sensor("temperature", "living room"),
                new Sensor("temperature", "outside"),
                new Sensor("humidity", "kitchen"),
                new Sensor("humidity", "outside"));
        for (final var sensor : sensors) {
            try (var stmt = conn.prepareStatement("INSERT INTO sensors (type, location) VALUES (?, ?)")) {
                stmt.setString(1, sensor.type());
                stmt.setString(2, sensor.location());
                stmt.executeUpdate();
            }
        }

        final var sensorDataCount = 100;
        final var insertBatchSize = 10;
        try (var stmt = conn.prepareStatement("""
                INSERT INTO sensor_data (time, sensor_id, value)
                VALUES (
                    generate_series(now() - INTERVAL '24 hours', now(), INTERVAL '5 minutes'),
                    floor(random() * 4 + 1)::INTEGER,
                    random()
                )
                """)) {
            for (int i = 0; i < sensorDataCount; i++) {
                stmt.addBatch();

                if ((i > 0 && i % insertBatchSize == 0) || i == sensorDataCount - 1) {
                    stmt.executeBatch();
                }
            }
        }
    }

    private record Sensor(String type, String location) {
    }
}
Execute more complex queries
package com.timescale.java; import java.sql.Connection; import java.sql.DriverManager; import java.sql.SQLException; import java.util.List; public class Main { public static void main(String... args) { final var connUrl = "jdbc:postgresql://<HOSTNAME>:<PORT>/<DATABASE_NAME>?user=<USERNAME>&password=<PASSWORD>"; try (var conn = DriverManager.getConnection(connUrl)) { createSchema(conn); insertData(conn); executeQueries(conn); } catch (SQLException ex) { System.err.println(ex.getMessage()); } } private static void createSchema(final Connection conn) throws SQLException { try (var stmt = conn.createStatement()) { stmt.execute(""" CREATE TABLE sensors ( id SERIAL PRIMARY KEY, type TEXT NOT NULL, location TEXT NOT NULL ) """); } try (var stmt = conn.createStatement()) { stmt.execute(""" CREATE TABLE sensor_data ( time TIMESTAMPTZ NOT NULL, sensor_id INTEGER REFERENCES sensors (id), value DOUBLE PRECISION ) """); } try (var stmt = conn.createStatement()) { stmt.execute("SELECT create_hypertable('sensor_data', by_range('time'))"); } } private static void insertData(final Connection conn) throws SQLException { final List<Sensor> sensors = List.of( new Sensor("temperature", "bedroom"), new Sensor("temperature", "living room"), new Sensor("temperature", "outside"), new Sensor("humidity", "kitchen"), new Sensor("humidity", "outside")); for (final var sensor : sensors) { try (var stmt = conn.prepareStatement("INSERT INTO sensors (type, location) VALUES (?, ?)")) { stmt.setString(1, sensor.type()); stmt.setString(2, sensor.location()); stmt.executeUpdate(); } } final var sensorDataCount = 100; final var insertBatchSize = 10; try (var stmt = conn.prepareStatement(""" INSERT INTO sensor_data (time, sensor_id, value) VALUES ( generate_series(now() - INTERVAL '24 hours', now(), INTERVAL '5 minutes'), floor(random() * 4 + 1)::INTEGER, random() ) """)) { for (int i = 0; i < sensorDataCount; i++) { stmt.addBatch(); if ((i > 0 && i % insertBatchSize == 0) || i == sensorDataCount - 1) { stmt.executeBatch(); } } } } private static void executeQueries(final Connection conn) throws SQLException { try (var stmt = conn.prepareStatement(""" SELECT time_bucket('15 minutes', time) AS bucket, avg(value) FROM sensor_data JOIN sensors ON sensors.id = sensor_data.sensor_id WHERE sensors.type = ? AND sensors.location = ? GROUP BY bucket ORDER BY bucket DESC """)) { stmt.setString(1, "temperature"); stmt.setString(2, "living room"); try (var rs = stmt.executeQuery()) { while (rs.next()) { System.out.printf("%s: %f%n", rs.getTimestamp(1), rs.getDouble(2)); } } } } private record Sensor(String type, String location) { } }===== PAGE: https://docs.tigerdata.com/_partials/_migrate_self_postgres_implement_migration_path/ =====
You cannot upgrade TimescaleDB and Postgres at the same time. You upgrade each product in the following steps:
Upgrade TimescaleDB
psql -X -d source -c "ALTER EXTENSION timescaledb UPDATE TO '<version number>';"If your migration path dictates it, upgrade Postgres
Follow the procedure in Upgrade Postgres. The version of TimescaleDB installed in your Postgres deployment must be the same before and after the Postgres upgrade.
If your migration path dictates it, upgrade TimescaleDB again
psql -X -d source -c "ALTER EXTENSION timescaledb UPDATE TO '<version number>';"Check that you have upgraded to the correct version of TimescaleDB
psql -X -d source -c "\dx timescaledb;"
Postgres returns something like:
```shell Name | Version | Schema | Description -------------+---------+--------+--------------------------------------------------------------------------------------- timescaledb | 2.17.2 | public | Enables scalable inserts and complex queries for time-series data (Community Edition) ```===== PAGE: https://docs.tigerdata.com/_partials/_migrate_dual_write_validate_production_load/ =====
Now that dual-writes have been in place for a while, the target database should be holding up to production write traffic. Now would be the right time to determine if the target database can serve all production traffic (both reads and writes). How exactly this is done is application-specific and up to you to determine.
===== PAGE: https://docs.tigerdata.com/_partials/_prereqs-cloud-no-connection/ =====
To follow the steps on this page:
- Create a target Tiger Cloud service with real-time analytics enabled.
===== PAGE: https://docs.tigerdata.com/_partials/_migrate_import_prerequisites/ =====
Best practice is to use an Ubuntu EC2 instance hosted in the same region as your Tiger Cloud service as a migration machine. That is, the machine you run the commands on to move your data from your source database to your target Tiger Cloud service.
Before you migrate your data:
- Create a target Tiger Cloud service.
Each Tiger Cloud service has a single database that supports the most popular extensions. Tiger Cloud services do not support tablespaces, and there is no superuser associated with a service. Best practice is to create a Tiger Cloud service with at least 8 CPUs for a smoother experience. A higher-spec instance can significantly reduce the overall migration window.
- To ensure that maintenance does not run during the process, adjust the maintenance window.
===== PAGE: https://docs.tigerdata.com/_partials/_hypercore-intro-short/ =====
Hypercore is the hybrid row-columnar storage engine in TimescaleDB used by hypertables. Traditional databases force a trade-off between fast inserts (row-based storage) and efficient analytics (columnar storage). Hypercore eliminates this trade-off, allowing real-time analytics without sacrificing transactional capabilities.
Hypercore dynamically stores data in the most efficient format for its lifecycle:
- Row-based storage for recent data: the most recent chunk (and possibly more) is always stored in the rowstore, ensuring fast inserts, updates, and low-latency single record queries. Additionally, row-based storage is used as a writethrough for inserts and updates to columnar storage.
- Columnar storage for analytical performance: chunks are automatically compressed into the columnstore, optimizing storage efficiency and accelerating analytical queries.
Unlike traditional columnar databases, hypercore allows data to be inserted or modified at any stage, making it a flexible solution for both high-ingest transactional workloads and real-time analytics—within a single database.
===== PAGE: https://docs.tigerdata.com/_partials/_caggs-intro/ =====
In modern applications, data usually grows very quickly. This means that aggregating it into useful summaries can become very slow. If you are collecting data very frequently, you might want to aggregate your data into minutes or hours instead. For example, if an IoT device takes temperature readings every second, you might want to find the average temperature for each hour. Every time you run this query, the database needs to scan the entire table and recalculate the average. TimescaleDB makes aggregating data lightning fast, accurate, and easy with continuous aggregates.
Continuous aggregates in TimescaleDB are a kind of hypertable that is refreshed automatically in the background as new data is added, or old data is modified. Changes to your dataset are tracked, and the hypertable behind the continuous aggregate is automatically updated in the background.
Continuous aggregates have a much lower maintenance burden than regular Postgres materialized views, because the whole view is not created from scratch on each refresh. This means that you can get on with working your data instead of maintaining your database.
Because continuous aggregates are based on hypertables, you can query them in exactly the same way as your other tables. This includes continuous aggregates in the rowstore, compressed into the columnstore, or tiered to object storage. You can even create continuous aggregates on top of your continuous aggregates, for an even more fine-tuned aggregation.
Real-time aggregation enables you to combine pre-aggregated data from the materialized view with the most recent raw data. This gives you up-to-date results on every query. In TimescaleDB v2.13 and later, real-time aggregates are DISABLED by default. In earlier versions, real-time aggregates are ENABLED by default; when you create a continuous aggregate, queries to that view include the results from the most recent raw data.
===== PAGE: https://docs.tigerdata.com/_partials/_kubernetes-prereqs/ =====
- Install self-managed Kubernetes or sign up for a Kubernetes Turnkey Cloud Solution.
- Install kubectl for command-line interaction with your cluster.
===== PAGE: https://docs.tigerdata.com/_partials/_high-availability-setup/ =====
- In Tiger Cloud Console, select the service to enable replication for.
- Click
Operations, then selectHigh availability. Choose your replication strategy, then click
Change configuration.In
Change high availability configuration, clickChange config.
===== PAGE: https://docs.tigerdata.com/_partials/_vpc-limitations/ =====
- You can attach:
- Up to 50 Customer VPCs to a Peering VPC.
- A Tiger Cloud service to a single Peering VPC at a time. The service and the Peering VPC must be in the same AWS region. However, you can peer a Customer VPC and a Peering VPC that are in different regions.
- Multiple Tiger Cloud services to the same Peering VPC.
- You cannot attach a Tiger Cloud service to multiple Peering VPCs at the same time.
The number of Peering VPCs you can create in your project depends on your pricing plan. If you need another Peering VPC, either contact support@tigerdata.com or change your pricing plan in Tiger Cloud Console.
===== PAGE: https://docs.tigerdata.com/_partials/_integration-apache-kafka-install/ =====
Extract the Kafka binaries to a local folder
curl https://dlcdn.apache.org/kafka/3.9.0/kafka_2.13-3.9.0.tgz | tar -xzf - cd kafka_2.13-3.9.0
From now on, the folder where you extracted the Kafka binaries is called
<KAFKA_HOME>.Configure and run Apache Kafka
KAFKA_CLUSTER_ID="$(bin/kafka-storage.sh random-uuid)" ./bin/kafka-storage.sh format --standalone -t $KAFKA_CLUSTER_ID -c config/kraft/reconfig-server.properties ./bin/kafka-server-start.sh config/kraft/reconfig-server.properties
Use the
-daemonflag to run this process in the background.- Create Kafka topics
In another Terminal window, navigate to , then call
kafka-topics.shand create the following topics:accounts: publishes JSON messages that are consumed by the timescale-sink connector and inserted into your Tiger Cloud service.deadletter: stores messages that cause errors and that Kafka Connect workers cannot process../bin/kafka-topics.sh \ --create \ --topic accounts \ --bootstrap-server localhost:9092 \ --partitions 10 ./bin/kafka-topics.sh \ --create \ --topic deadletter \ --bootstrap-server localhost:9092 \ --partitions 10
Test that your topics are working correctly
Run
kafka-console-producerto send messages to theaccountstopic:bin/kafka-console-producer.sh --topic accounts --bootstrap-server localhost:9092Send some events. For example, type the following:
>Tiger >How CoolIn another Terminal window, navigate to , then run
kafka-console-consumerto consume the events you just sent:bin/kafka-console-consumer.sh --topic accounts --from-beginning --bootstrap-server localhost:9092You see
Tiger How Cool
Update the DB instance parameter group for your source database
In https://console.aws.amazon.com/rds/home#databases:, select the RDS instance to migrate.
Click
Configuration, scroll down and note theDB instance parameter group, then clickParameter groups
- Click
Create parameter group, fill in the form with the following values, then clickCreate.- Parameter group name - whatever suits your fancy.
- Description - knock yourself out with this one.
- Engine type -
PostgreSQL - Parameter group family - the same as
DB instance parameter groupin yourConfiguration.
- In
Parameter groups, select the parameter group you created, then clickEdit. Update the following parameters, then click
Save changes.rds.logical_replicationset to1: record the information needed for logical decoding.wal_sender_timeoutset to0: disable the timeout for the sender process.
In RDS, navigate back to your databases, select the RDS instance to migrate, and click
Modify.Scroll down to
Database options, select your new parameter group, and clickContinue.Click
Apply immediatelyor choose a maintenance window, then clickModify DB instance.
Changing parameters will cause an outage. Wait for the database instance to reboot before continuing.
- Verify that the settings are live in your database.
Enable replication
DELETEandUPDATEoperations- A primary key: data replication defaults to the primary key of the table being replicated. Nothing to do.
- A viable unique index: each table has a unique, non-partial, non-deferrable index that includes only columns
marked as
NOT NULL. If a UNIQUE index does not exist, create one to assist the migration. You can delete if after migration. - No primary key or viable unique index: use brute force.
- Other Tiger Cloud services
- Postgres databases outside of Tiger Cloud
- Create a target Tiger Cloud service with the Real-time analytics capability.
- Connect to your service
- Create a server
- Create user mapping
Import a foreign schema (recommended) or create a foreign table
Import the whole schema:
CREATE SCHEMA foreign_stuff; IMPORT FOREIGN SCHEMA public FROM SERVER myserver INTO foreign_stuff ;Alternatively, import a limited number of tables:
CREATE SCHEMA foreign_stuff; IMPORT FOREIGN SCHEMA public LIMIT TO (table1, table2) FROM SERVER myserver INTO foreign_stuff;Create a foreign table. Skip if you are importing a schema:
CREATE FOREIGN TABLE films ( code char(5) NOT NULL, title varchar(40) NOT NULL, did integer NOT NULL, date_prod date, kind varchar(10), len interval hour to minute ) SERVER film_server;
- Connect to your database
- Create a server
- Create user mapping
Import a foreign schema (recommended) or create a foreign table
Import the whole schema:
CREATE SCHEMA foreign_stuff; IMPORT FOREIGN SCHEMA public FROM SERVER myserver INTO foreign_stuff ;Alternatively, import a limited number of tables:
CREATE SCHEMA foreign_stuff; IMPORT FOREIGN SCHEMA public LIMIT TO (table1, table2) FROM SERVER myserver INTO foreign_stuff;Create a foreign table. Skip if you are importing a schema:
CREATE FOREIGN TABLE films ( code char(5) NOT NULL, title varchar(40) NOT NULL, did integer NOT NULL, date_prod date, kind varchar(10), len interval hour to minute ) SERVER film_server;
- Download the dataset:
Use your file manager to decompress the downloaded dataset, and take a note of the path to the
nyc_data_rides.csvfile.At the psql prompt, copy the data from the
nyc_data_rides.csvfile into your hypertable. Make sure you point to the correct path, if it is not in your current working directory:\COPY rides FROM nyc_data_rides.csv CSV;-
Sign in to the{" "} Tiger Cloud Console and click
Create service. -
Choose if you want a Time-series or Dynamic Postgres service.
{props.demoData && (
-
Click
Get startedto create your service with demo data, and launch theAllmilk Factoryinteractive demo. You can exit the demo at any time, and revisit it from the same point later on. You can also re-run the demo after you have completed it. )}
)}
-
Click
Download the cheatsheetto download an SQL file that contains the login details for your new service. You can also copy the details directly from this page. When you have copied your password, clickI stored my password, go to service overviewat the bottom of the page. -
When your service is ready to use, is shows a green
Runninglabel in the Service Overview. You also receive an email confirming that your service is ready to use. - In https://console.aws.amazon.com/rds/home#databases:, select the RDS/Aurora Postgres instance to migrate.
- Click
Actions>Set up EC2 connection. PressCreate EC2 instanceand use the following settings:- AMI: Ubuntu Server.
- Key pair: use an existing pair or create a new one that you will use to access the intermediary machine.
- VPC: by default, this is the same as the database instance.
- Configure Storage: adjust the volume to at least the size of RDS/Aurora Postgres instance you are migrating from. You can reduce the space used by your data on Tiger Cloud using Hypercore.
- Click
Lauch instance. AWS creates your EC2 instance, then clickConnect to instance>SSH client. Follow the instructions to create the connection to your intermediary EC2 instance. Connect to your intermediary EC2 instance. For example:
ssh -i "<key-pair>.pem" ubuntu@<EC2 instance's Public IPv4>On your intermediary EC2 instance, install the Postgres client.
sudo sh -c 'echo "deb http://apt.postgresql.org/pub/repos/apt $(lsb_release -cs)-pgdg main" > /etc/apt/sources.list.d/pgdg.list' wget -qO- https://www.postgresql.org/media/keys/ACCC4CF8.asc | sudo tee /etc/apt/trusted.gpg.d/pgdg.asc &>/dev/null sudo apt update sudo apt install postgresql-client-16 -y # "postgresql-client-16" if your source DB is using PG 16. psql --version && pg_dump --version- In https://console.aws.amazon.com/rds/home#databases:, select the RDS/Aurora Postgres instance to migrate.
- Scroll down to
Security group rules (1)and select theEC2 Security Group - Inboundgroup. TheSecurity Groups (1)window opens. Click theSecurity group ID, then clickEdit inbound rules On your intermediary EC2 instance, get your local IP address:
ec2metadata --local-ipv4Bear with me on this one, you need this IP address to enable access to your RDS/Aurora Postgres instance.
In
Edit inbound rules, clickAdd rule, then create aPostgreSQL,TCPrule granting access to the local IP address for your EC2 instance (told you :-)). Then clickSave rules.- In https://console.aws.amazon.com/rds/home#databases:, select the RDS/Aurora Postgres instance to migrate.
- On your intermediary EC2 instance, use the values of
Endpoint,Port,Master username, andDB nameto create the postgres connectivity string to theSOURCEvariable. Test your connection:
psql -d sourceYou are connected to your RDS/Aurora Postgres instance from your intermediary EC2 instance.
Create a Peering VPC in Tiger Cloud Console
- In
Security>VPC, clickCreate a VPC:
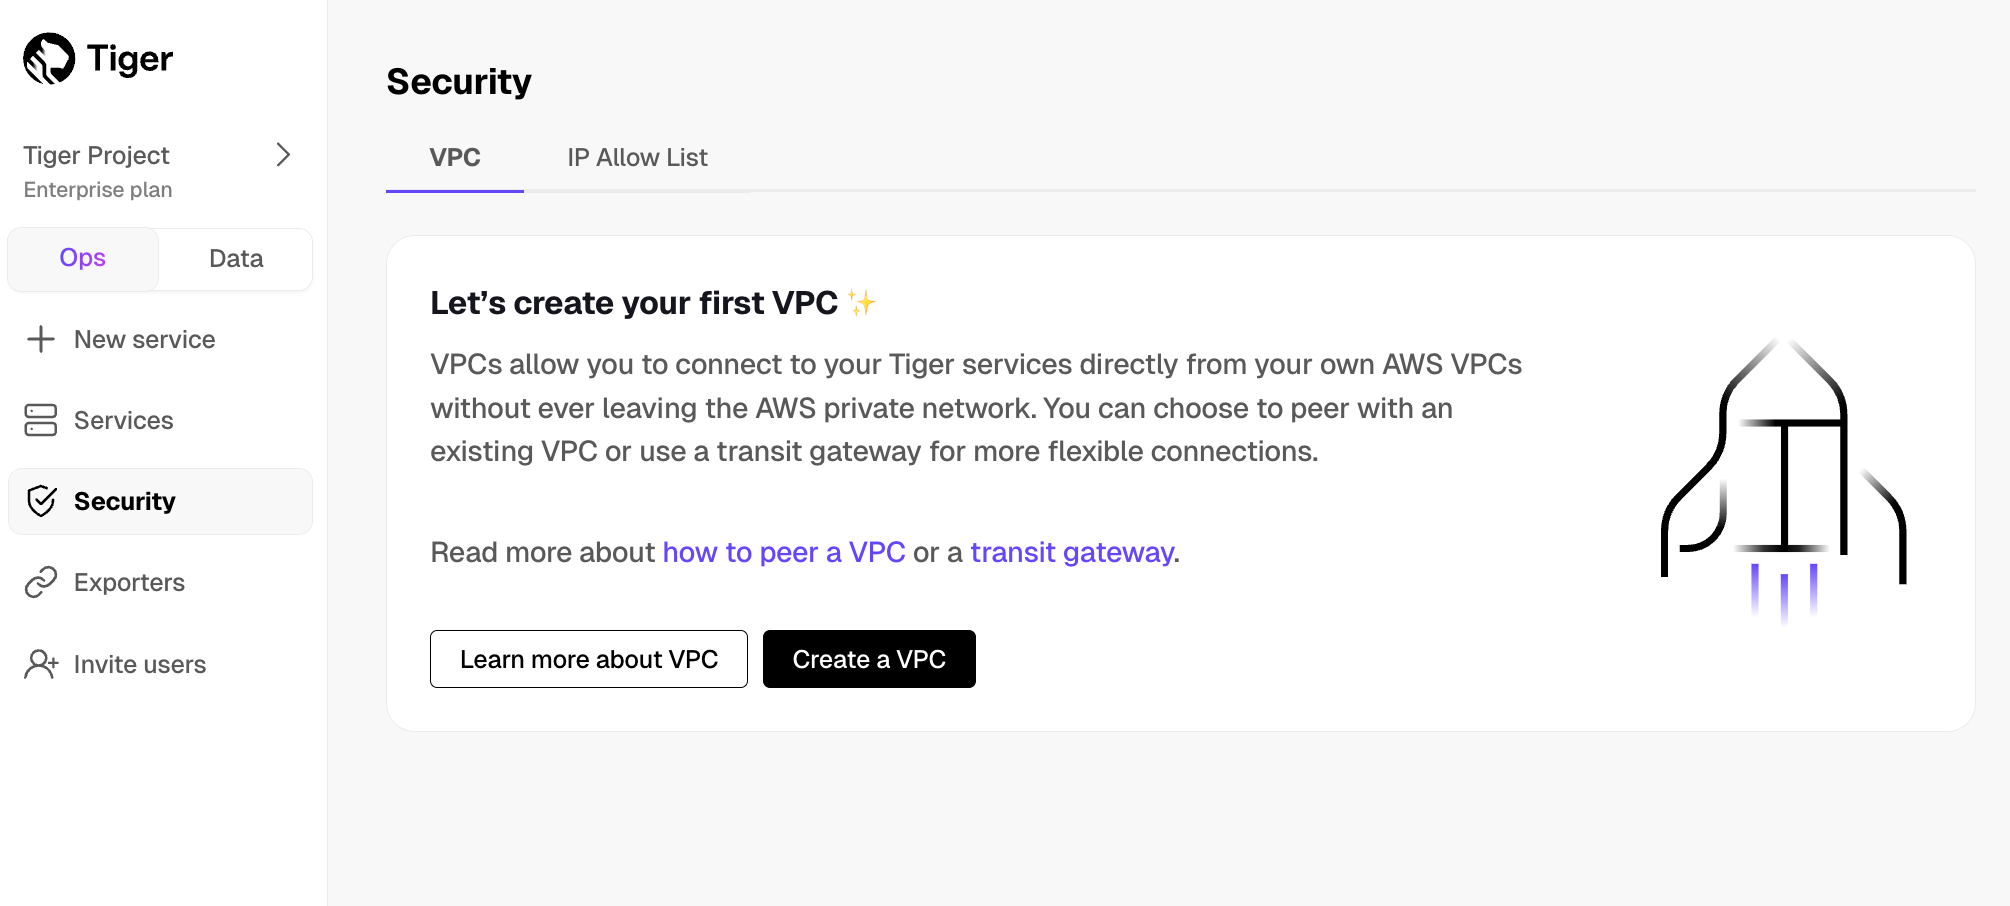
- Choose your region and IP range, name your VPC, then click
Create VPC:
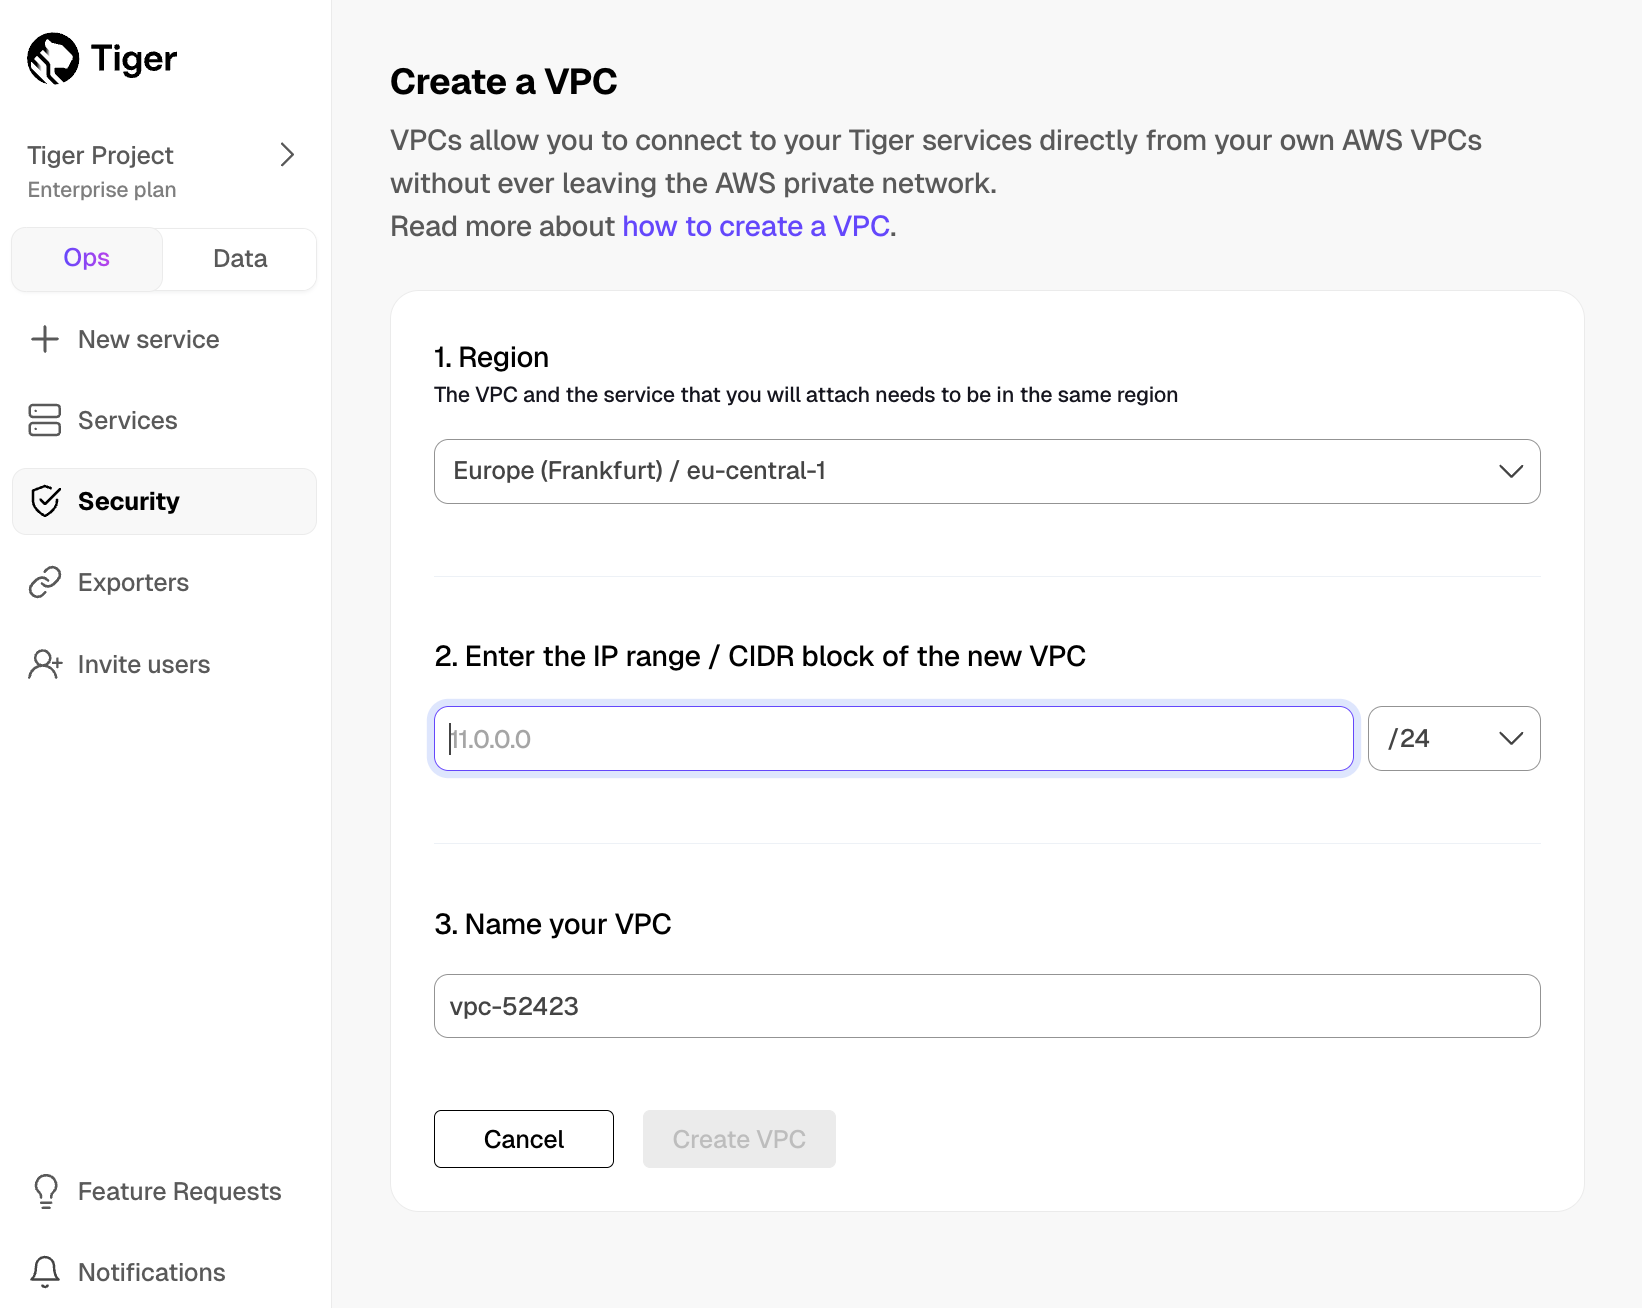
Your service and Peering VPC must be in the same AWS region. The number of Peering VPCs you can create in your project depends on your pricing plan. If you need another Peering VPC, either contact support@tigerdata.com or change your plan in Tiger Cloud Console.
Add a peering connection:
- In the
VPC Peeringcolumn, clickAdd. - Provide your AWS account ID, Transit Gateway ID, CIDR ranges, and AWS region. Tiger Cloud creates a new isolated connection for every unique Transit Gateway ID.
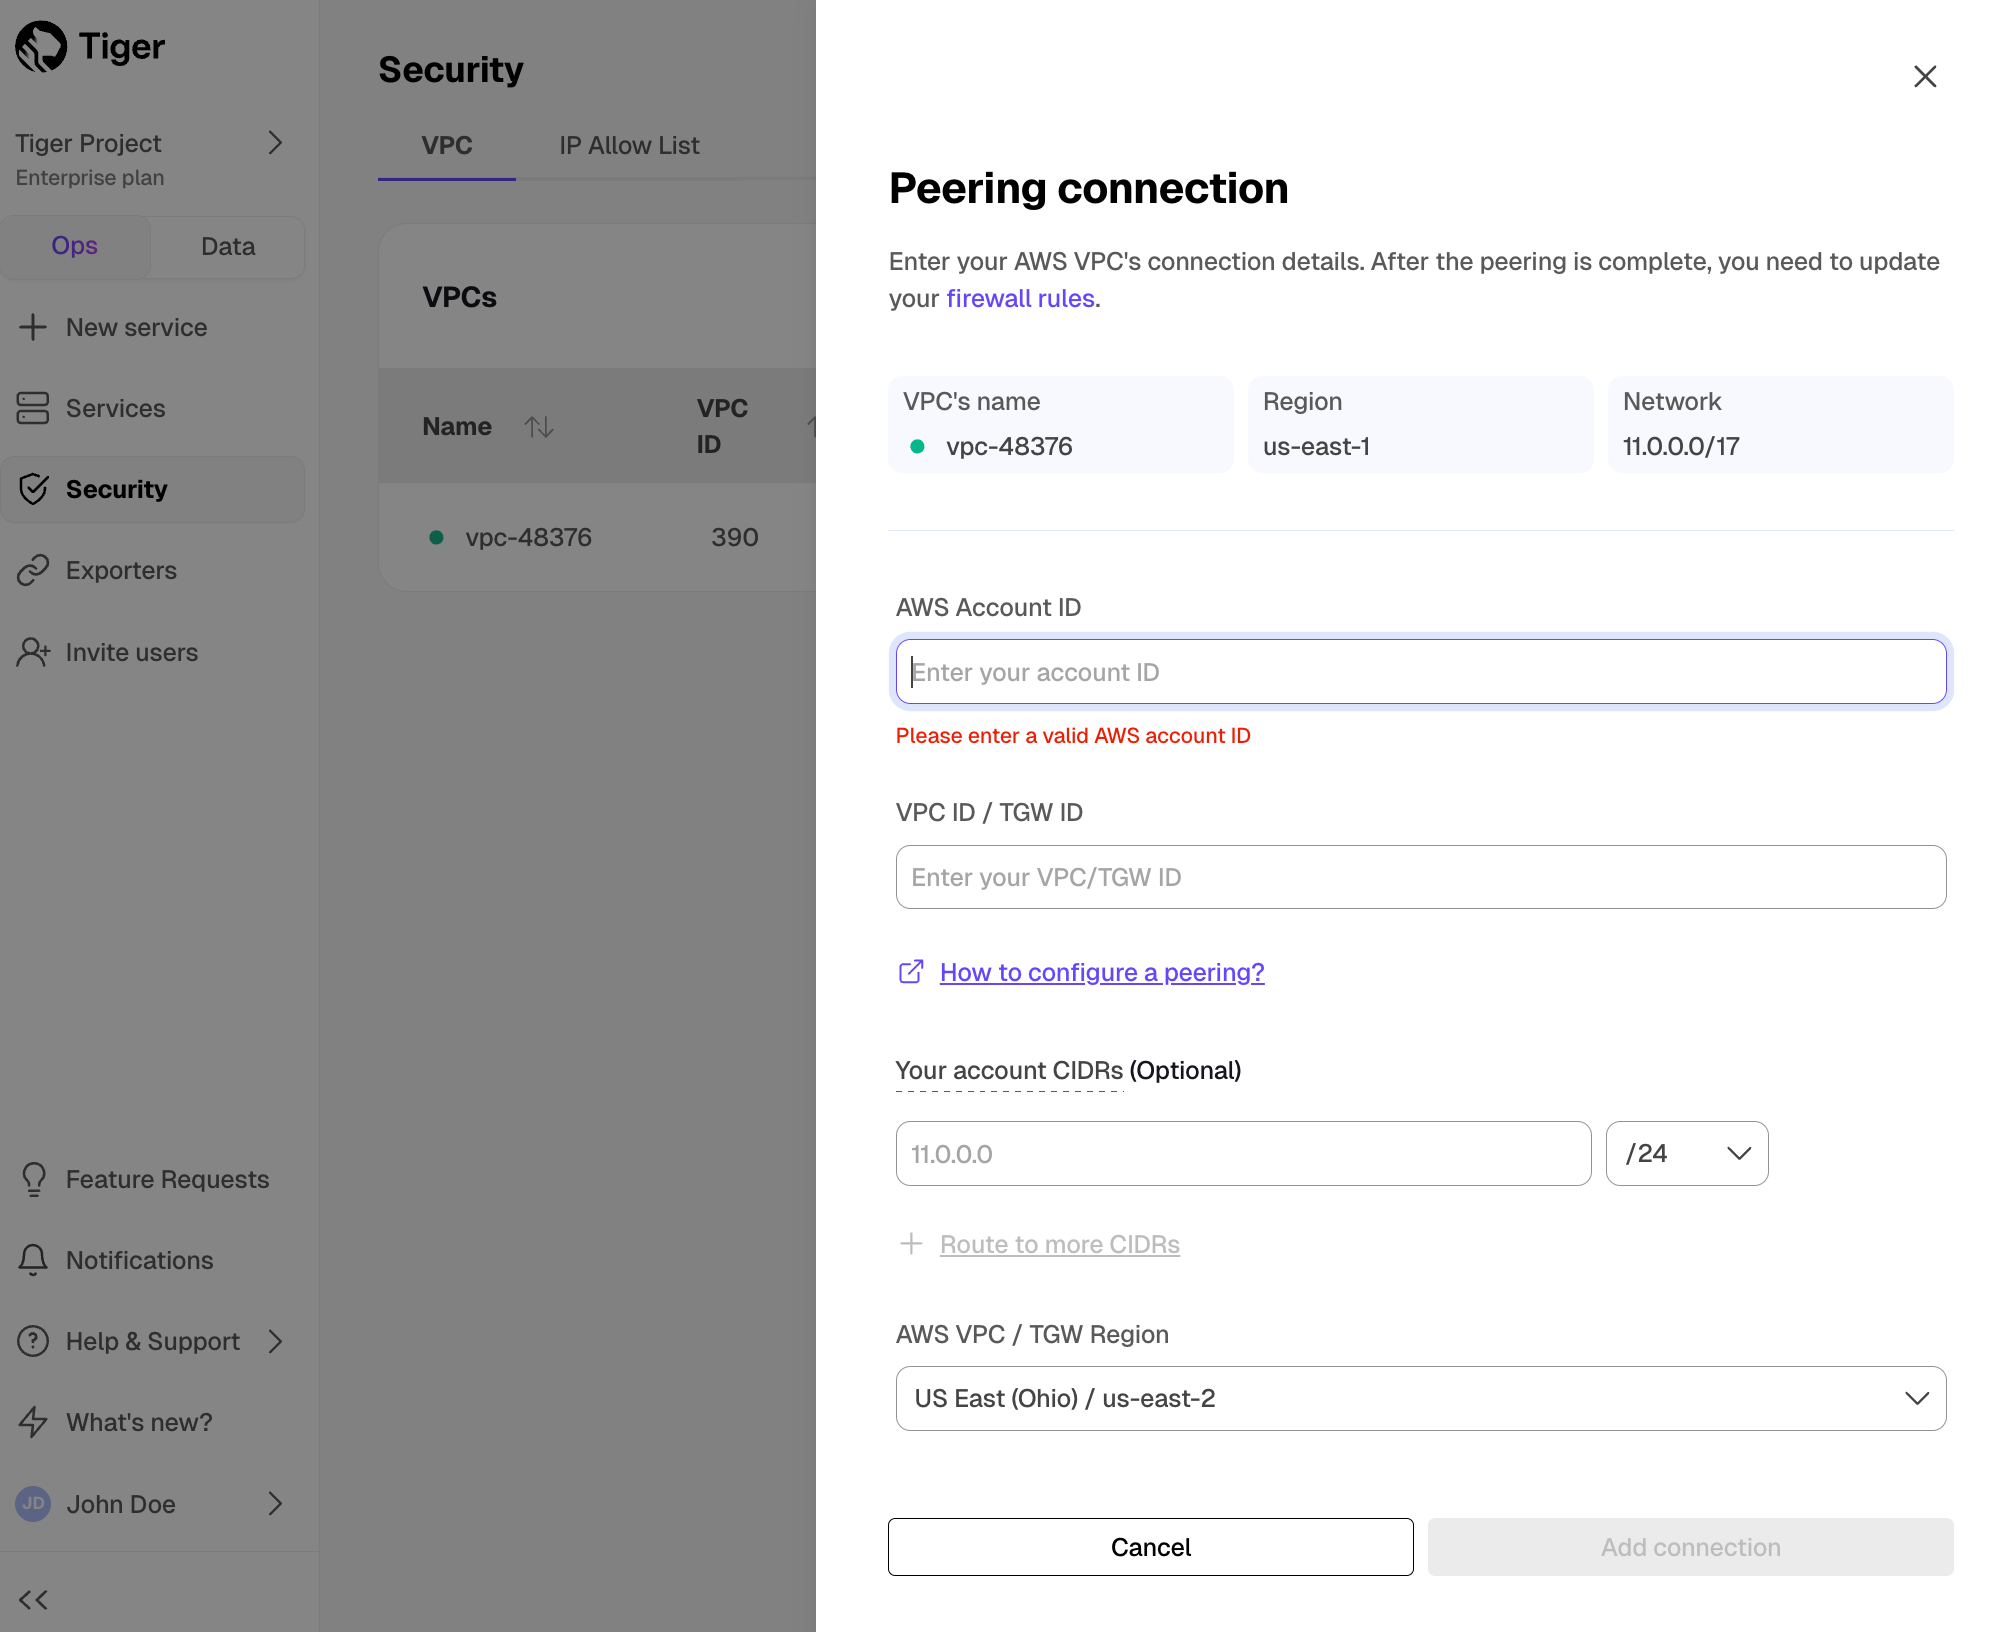
- Click
Add connection.
- In the
- In
Accept and configure peering connection in your AWS account
Accept the peering request coming from Tiger Cloud. The request can take up to 5 min to arrive. Within 5 more minutes after accepting, the peering should appear as
Connectedin Tiger Cloud Console.Configure at least the following in your AWS account networking:
- Your subnet route table to route traffic to your Transit Gateway for the Peering VPC CIDRs.
- Your Transit Gateway route table to route traffic to the newly created Transit Gateway peering attachment for the Peering VPC CIDRs.
- Security groups to allow outbound TCP 5432.
Attach a Tiger Cloud service to the Peering VPC In Tiger Cloud Console
- Select the service you want to connect to the Peering VPC.
- Click
Operations>Security>VPC. - Select the VPC, then click
Attach VPC.
- Create a target Tiger Cloud service with the Real-time analytics capability.
Download the
real_time_stock_data.zipfile. The file contains two.csvfiles; one with company information, and one with real-time stock trades for the past month. Download:In a new terminal window, run this command to unzip the
.csvfiles:unzip real_time_stock_data.zipAt the
psqlprompt, use theCOPYcommand to transfer data into your Tiger Cloud service. If the.csvfiles aren't in your current directory, specify the file paths in these commands:\COPY stocks_real_time from './tutorial_sample_tick.csv' DELIMITER ',' CSV HEADER;\COPY company from './tutorial_sample_company.csv' DELIMITER ',' CSV HEADER;Because there are millions of rows of data, the
COPYprocess could take a few minutes depending on your internet connection and local client resources.- Connect to your Tiger Cloud service
- Enable columnstore on a hypertable
Use
CREATE TABLEfor a hypertableCREATE TABLE crypto_ticks ( "time" TIMESTAMPTZ, symbol TEXT, price DOUBLE PRECISION, day_volume NUMERIC ) WITH ( tsdb.hypertable, tsdb.partition_column='time', tsdb.segmentby='symbol', tsdb.orderby='time DESC' );If you are self-hosting TimescaleDB v2.19.3 and below, create a Postgres relational table, then convert it using create_hypertable. You then enable hypercore with a call to ALTER TABLE.
Use
ALTER MATERIALIZED VIEWfor a continuous aggregateALTER MATERIALIZED VIEW assets_candlestick_daily set ( timescaledb.enable_columnstore = true, timescaledb.segmentby = 'symbol' );Before you say
huh, a continuous aggregate is a specialized hypertable.- Add a policy to convert chunks to the columnstore at a specific time interval
Check the columnstore policy
- View your data space saving:
When you convert data to the columnstore, as well as being optimized for analytics, it is compressed by more than 90%. This helps you save on storage costs and keeps your queries operating at lightning speed. To see the amount of space saved:
SELECT pg_size_pretty(before_compression_total_bytes) as before, pg_size_pretty(after_compression_total_bytes) as after FROM hypertable_columnstore_stats('crypto_ticks');You see something like:
| before | after | |---------|--------| | 194 MB | 24 MB |
View the policies that you set or the policies that already exist:
SELECT * FROM timescaledb_information.jobs WHERE proc_name='policy_compression';
Pause a columnstore policy
SELECT * FROM timescaledb_information.jobs where proc_name = 'policy_compression' AND relname = 'crypto_ticks' -- Select the JOB_ID from the results SELECT alter_job(JOB_ID, scheduled => false);Restart a columnstore policy
SELECT alter_job(JOB_ID, scheduled => true);Remove a columnstore policy
CALL remove_columnstore_policy('crypto_ticks');- Disable columnstore
- Dump the roles from your source database
- Remove roles with superuser access
- In the Tiger Cloud Console, click
Create service. Click
Download the cheatsheetto download an SQL file that contains the login details for your new service. You can also copy the details directly from this page. When you have copied your password, clickI stored my password, go to service overviewat the bottom of the page.When your service is ready to use, is shows a green
Runninglabel in theService Overview. You also receive an email confirming that your service is ready to use.On your local system, at the command prompt, connect to the service using the
Service URLfrom the SQL file that you downloaded. When you are prompted, enter the password:psql -x "<SERVICE_URL>" Password for user tsdbadmin:If your connection is successful, you'll see a message like this, followed by the
psqlprompt:psql (13.3, server 12.8 (Ubuntu 12.8-1.pgdg21.04+1)) SSL connection (protocol: TLSv1.3, cipher: TLS_AES_256_GCM_SHA384, bits: 256, compression: off) Type "help" for help. tsdb=>- Create a target Tiger Cloud service with the Real-time analytics capability.
- Log in to Grafana
Add your service as a data source
- Open
Connections>Data sources, then clickAdd new data source. - Select
PostgreSQLfrom the list. Configure the connection:
Host URL,Database name,Username, andPassword
Configure using your connection details.
Host URLis in the format<host>:<port>.TLS/SSL Mode: selectrequire.PostgreSQL options: enableTimescaleDB.- Leave the default setting for all other fields.
Click
Save & test.
Grafana checks that your details are set correctly.
- Open
- Create a Tiger Data account.
The following works:
CREATE MATERIALIZED VIEW candles_start_end WITH (timescaledb.continuous) AS SELECT time_bucket('1 hour', "time"), COUNT(DISTINCT symbol), first(time, time) as first_candle, last(time, time) as last_candle FROM candle GROUP BY 1;This does not:
CREATE MATERIALIZED VIEW candles_start_end WITH (timescaledb.continuous) AS SELECT DISTINCT ON (symbol) symbol,symbol_id, first(time, time) as first_candle, last(time, time) as last_candle FROM candle GROUP BY symbol_id;Install the latest version of
libpqxx:sudo port install libpqxx[](#)View the files that were installed by
libpqxx:port contents libpqxx- Install TimescaleDB.
- Create a TimescaleDB repository in your
yumrepo.ddirectory. Set up the repository:
curl -s https://packagecloud.io/install/repositories/timescale/timescaledb/script.deb.sh | sudo bashUpdate your local repository list:
yum updateInstall TimescaleDB Toolkit:
yum install timescaledb-toolkit-postgresql-17Connect to the database where you want to use Toolkit.
Create the Toolkit extension in the database:
CREATE EXTENSION timescaledb_toolkit;Update your local repository list:
yum updateInstall the latest version of TimescaleDB Toolkit:
yum install timescaledb-toolkit-postgresql-17Connect to the database where you want to use the new version of Toolkit.
Update the Toolkit extension in the database:
ALTER EXTENSION timescaledb_toolkit UPDATE;For some Toolkit versions, you might need to disconnect and reconnect active sessions.
--section=post-datais used to dump post-data items include definitions of indexes, triggers, rules, and constraints other than validated check constraints.--snapshotis used to specified the synchronized snapshot when making a dump of the database.--no-tablespacesis required because Tiger Cloud does not support tablespaces other than the default. This is a known limitation.--no-owneris required because Tiger Cloud'stsdbadminuser is not a superuser and cannot assign ownership in all cases. This flag means that everything is owned by the user used to connect to the target, regardless of ownership in the source. This is a known limitation.--no-privilegesis required because thetsdbadminuser for your Tiger Cloud service is not a superuser and cannot assign privileges in all cases. This flag means that privileges assigned to other users must be reassigned in the target database as a manual clean-up task. This is a known limitation.- Row-based storage for recent data: the most recent chunk (and possibly more) is always stored in the rowstore, ensuring fast inserts, updates, and low-latency single record queries. Additionally, row-based storage is used as a writethrough for inserts and updates to columnar storage.
- Columnar storage for analytical performance: chunks are automatically compressed into the columnstore, optimizing storage efficiency and accelerating analytical queries.
Connect to your service
In Tiger Cloud Console, click
Data, then select a service.Create a Postgres table
Copy the following into your query, then click
Run:CREATE TABLE stocks_real_time ( time TIMESTAMPTZ NOT NULL, symbol TEXT NOT NULL, price DOUBLE PRECISION NULL, day_volume INT NULL ) WITH ( tsdb.hypertable, tsdb.partition_column='time' );--section=pre-datais used to dump only the definition of tables, sequences, check constraints and inheritance hierarchy. It excludes indexes, foreign key constraints, triggers and rules.--snapshotis used to specified the synchronized snapshot when making a dump of the database.--no-tablespacesis required because Tiger Cloud does not support tablespaces other than the default. This is a known limitation.--no-owneris required because Tiger Cloud'stsdbadminuser is not a superuser and cannot assign ownership in all cases. This flag means that everything is owned by the user used to connect to the target, regardless of ownership in the source. This is a known limitation.--no-privilegesis required because thetsdbadminuser for your Tiger Cloud service is not a superuser and cannot assign privileges in all cases. This flag means that privileges assigned to other users must be reassigned in the target database as a manual clean-up task. This is a known limitation.- Install Tiger CLI
Set up API credentials
Log Tiger CLI into your Tiger Data account:
tiger auth login
Tiger CLI opens Console in your browser. Log in, then click
Authorize.You can have a maximum of 10 active client credentials. If you get an error, open credentials and delete an unused credential.
Select a Tiger Cloud project:
Auth URL is: https://console.cloud.timescale.com/oauth/authorize?client_id=lotsOfURLstuff Opening browser for authentication... Select a project: > 1. Tiger Project (tgrproject) 2. YourCompany (Company wide project) (cpnproject) 3. YourCompany Department (dptproject) Use ↑/↓ arrows or number keys to navigate, enter to select, q to quit
If only one project is associated with your account, this step is not shown.
Where possible, Tiger CLI stores your authentication information in the system keychain/credential manager. If that fails, the credentials are stored in
~/.config/tiger/credentialswith restricted file permissions (600). By default, Tiger CLI stores your configuration in~/.config/tiger/config.yaml.Test your authenticated connection to Tiger Cloud by listing services
tiger service list- Ensure you have Grafana installed, and you are using the TimescaleDB database that contains the Twelve Data dataset set up as a data source.
- In Grafana, from the
Dashboardsmenu, clickNew Dashboard. In theNew Dashboardpage, clickAdd a new panel. - In the
Visualizationsmenu in the top right corner, selectCandlestickfrom the list. Ensure you have set the Twelve Data dataset as your data source. - Click
Edit SQLand paste in the query you used to get the OHLCV values. - In the
Format assection, selectTable. Adjust elements of the table as required, and click
Applyto save your graph to the dashboard.<img class="main-content__illustration"
width={1375} height={944} src="https://assets.timescale.com/docs/images/Grafana_candlestick_1day.webp" alt="Creating a candlestick graph in Grafana using 1-day OHLCV tick data"/>
Create a hypertable to store the taxi trip data
CREATE TABLE "rides"( vendor_id TEXT, pickup_datetime TIMESTAMP WITHOUT TIME ZONE NOT NULL, dropoff_datetime TIMESTAMP WITHOUT TIME ZONE NOT NULL, passenger_count NUMERIC, trip_distance NUMERIC, pickup_longitude NUMERIC, pickup_latitude NUMERIC, rate_code INTEGER, dropoff_longitude NUMERIC, dropoff_latitude NUMERIC, payment_type INTEGER, fare_amount NUMERIC, extra NUMERIC, mta_tax NUMERIC, tip_amount NUMERIC, tolls_amount NUMERIC, improvement_surcharge NUMERIC, total_amount NUMERIC ) WITH ( tsdb.hypertable, tsdb.partition_column='pickup_datetime', tsdb.create_default_indexes=false );If you are self-hosting TimescaleDB v2.19.3 and below, create a Postgres relational table, then convert it using create_hypertable. You then enable hypercore with a call to ALTER TABLE.
Add another dimension to partition your hypertable more efficiently
SELECT add_dimension('rides', by_hash('payment_type', 2));Create an index to support efficient queries
Index by vendor, rate code, and passenger count:
CREATE INDEX ON rides (vendor_id, pickup_datetime DESC); CREATE INDEX ON rides (rate_code, pickup_datetime DESC); CREATE INDEX ON rides (passenger_count, pickup_datetime DESC);Add a relational table to store the payment types data
CREATE TABLE IF NOT EXISTS "payment_types"( payment_type INTEGER, description TEXT ); INSERT INTO payment_types(payment_type, description) VALUES (1, 'credit card'), (2, 'cash'), (3, 'no charge'), (4, 'dispute'), (5, 'unknown'), (6, 'voided trip');Add a relational table to store the rates data
CREATE TABLE IF NOT EXISTS "rates"( rate_code INTEGER, description TEXT ); INSERT INTO rates(rate_code, description) VALUES (1, 'standard rate'), (2, 'JFK'), (3, 'Newark'), (4, 'Nassau or Westchester'), (5, 'negotiated fare'), (6, 'group ride');- Run Zookeeper in Docker
- Run Kafka in Docker
- Run Kafka Connect in Docker
- Register the Debezium Postgres source connector
Verify
timescaledb-source-connectoris included in the connector listCheck the tasks associated with
timescaledb-connector:curl -i -X GET -H "Accept:application/json" localhost:8083/connectors/timescaledb-connectorYou see something like:
{"name":"timescaledb-connector","config": { "connector.class":"io.debezium.connector.postgresql.PostgresConnector", "transforms.timescaledb.database.hostname":"timescaledb", "transforms.timescaledb.database.password":"debeziumpassword","database.user":"debezium", "database.dbname":"postgres","transforms.timescaledb.database.dbname":"postgres", "transforms.timescaledb.database.user":"debezium", "transforms.timescaledb.type":"io.debezium.connector.postgresql.transforms.timescaledb.TimescaleDb", "transforms.timescaledb.database.port":"5432","transforms":"timescaledb", "schema.include.list":"public,_timescaledb_internal","database.port":"5432","plugin.name":"pgoutput", "topic.prefix":"accounts","database.hostname":"timescaledb","database.password":"debeziumpassword", "name":"timescaledb-connector"},"tasks":[{"connector":"timescaledb-connector","task":0}],"type":"source"}
Verify
timescaledb-connectoris runningOpen the Terminal window running Kafka Connect. When the connector is active, you see something like the following:
2025-04-30 10:40:15,168 INFO Postgres|accounts|streaming REPLICA IDENTITY for '_timescaledb_internal._hyper_1_1_chunk' is 'DEFAULT'; UPDATE and DELETE events will contain previous values only for PK columns [io.debezium.connector.postgresql.PostgresSchema] 2025-04-30 10:40:15,168 INFO Postgres|accounts|streaming REPLICA IDENTITY for '_timescaledb_internal.bgw_job_stat' is 'DEFAULT'; UPDATE and DELETE events will contain previous values only for PK columns [io.debezium.connector.postgresql.PostgresSchema] 2025-04-30 10:40:15,175 INFO Postgres|accounts|streaming SignalProcessor started. Scheduling it every 5000ms [io.debezium.pipeline.signal.SignalProcessor] 2025-04-30 10:40:15,175 INFO Postgres|accounts|streaming Creating thread debezium-postgresconnector-accounts-SignalProcessor [io.debezium.util.Threads] 2025-04-30 10:40:15,175 INFO Postgres|accounts|streaming Starting streaming [io.debezium.pipeline.ChangeEventSourceCoordinator] 2025-04-30 10:40:15,176 INFO Postgres|accounts|streaming Retrieved latest position from stored offset 'LSN{0/1FCE570}' [io.debezium.connector.postgresql.PostgresStreamingChangeEventSource] 2025-04-30 10:40:15,176 INFO Postgres|accounts|streaming Looking for WAL restart position for last commit LSN 'null' and last change LSN 'LSN{0/1FCE570}' [io.debezium.connector.postgresql.connection.WalPositionLocator] 2025-04-30 10:40:15,176 INFO Postgres|accounts|streaming Initializing PgOutput logical decoder publication [io.debezium.connector.postgresql.connection.PostgresReplicationConnection] 2025-04-30 10:40:15,189 INFO Postgres|accounts|streaming Obtained valid replication slot ReplicationSlot [active=false, latestFlushedLsn=LSN{0/1FCCFF0}, catalogXmin=884] [io.debezium.connector.postgresql.connection.PostgresConnection] 2025-04-30 10:40:15,189 INFO Postgres|accounts|streaming Connection gracefully closed [io.debezium.jdbc.JdbcConnection] 2025-04-30 10:40:15,204 INFO Postgres|accounts|streaming Requested thread factory for component PostgresConnector, id = accounts named = keep-alive [io.debezium.util.Threads] 2025-04-30 10:40:15,204 INFO Postgres|accounts|streaming Creating thread debezium-postgresconnector-accounts-keep-alive [io.debezium.util.Threads] 2025-04-30 10:40:15,216 INFO Postgres|accounts|streaming REPLICA IDENTITY for '_timescaledb_internal.bgw_policy_chunk_stats' is 'DEFAULT'; UPDATE and DELETE events will contain previous values only for PK columns [io.debezium.connector.postgresql.PostgresSchema] 2025-04-30 10:40:15,216 INFO Postgres|accounts|streaming REPLICA IDENTITY for 'public.accounts' is 'DEFAULT'; UPDATE and DELETE events will contain previous values only for PK columns [io.debezium.connector.postgresql.PostgresSchema] 2025-04-30 10:40:15,217 INFO Postgres|accounts|streaming REPLICA IDENTITY for '_timescaledb_internal.bgw_job_stat_history' is 'DEFAULT'; UPDATE and DELETE events will contain previous values only for PK columns [io.debezium.connector.postgresql.PostgresSchema] 2025-04-30 10:40:15,217 INFO Postgres|accounts|streaming REPLICA IDENTITY for '_timescaledb_internal._hyper_1_1_chunk' is 'DEFAULT'; UPDATE and DELETE events will contain previous values only for PK columns [io.debezium.connector.postgresql.PostgresSchema] 2025-04-30 10:40:15,217 INFO Postgres|accounts|streaming REPLICA IDENTITY for '_timescaledb_internal.bgw_job_stat' is 'DEFAULT'; UPDATE and DELETE events will contain previous values only for PK columns [io.debezium.connector.postgresql.PostgresSchema] 2025-04-30 10:40:15,219 INFO Postgres|accounts|streaming Processing messages [io.debezium.connector.postgresql.PostgresStreamingChangeEventSource]Watch the events in the accounts topic on your self-hosted TimescaleDB instance.
In another Terminal instance, run the following command:
docker run -it --rm --name watcher --link zookeeper:zookeeper --link kafka:kafka quay.io/debezium/kafka:3.0 watch-topic -a -k accountsYou see the topics being streamed. For example:
status-task-timescaledb-connector-0 {"state":"RUNNING","trace":null,"worker_id":"172.17.0.5:8083","generation":31} status-topic-timescaledb.public.accounts:connector-timescaledb-connector {"topic":{"name":"timescaledb.public.accounts","connector":"timescaledb-connector","task":0,"discoverTimestamp":1746009337985}} status-topic-accounts._timescaledb_internal.bgw_job_stat:connector-timescaledb-connector {"topic":{"name":"accounts._timescaledb_internal.bgw_job_stat","connector":"timescaledb-connector","task":0,"discoverTimestamp":1746009338118}} status-topic-accounts._timescaledb_internal.bgw_job_stat:connector-timescaledb-connector {"topic":{"name":"accounts._timescaledb_internal.bgw_job_stat","connector":"timescaledb-connector","task":0,"discoverTimestamp":1746009338120}} status-topic-accounts._timescaledb_internal.bgw_job_stat_history:connector-timescaledb-connector {"topic":{"name":"accounts._timescaledb_internal.bgw_job_stat_history","connector":"timescaledb-connector","task":0,"discoverTimestamp":1746009338243}} status-topic-accounts._timescaledb_internal.bgw_job_stat_history:connector-timescaledb-connector {"topic":{"name":"accounts._timescaledb_internal.bgw_job_stat_history","connector":"timescaledb-connector","task":0,"discoverTimestamp":1746009338245}} status-topic-accounts.public.accounts:connector-timescaledb-connector {"topic":{"name":"accounts.public.accounts","connector":"timescaledb-connector","task":0,"discoverTimestamp":1746009338250}} status-topic-accounts.public.accounts:connector-timescaledb-connector {"topic":{"name":"accounts.public.accounts","connector":"timescaledb-connector","task":0,"discoverTimestamp":1746009338251}} status-topic-accounts.public.accounts:connector-timescaledb-connector {"topic":{"name":"accounts.public.accounts","connector":"timescaledb-connector","task":0,"discoverTimestamp":1746009338251}} status-topic-accounts.public.accounts:connector-timescaledb-connector {"topic":{"name":"accounts.public.accounts","connector":"timescaledb-connector","task":0,"discoverTimestamp":1746009338251}} status-topic-accounts.public.accounts:connector-timescaledb-connector {"topic":{"name":"accounts.public.accounts","connector":"timescaledb-connector","task":0,"discoverTimestamp":1746009338251}} ["timescaledb-connector",{"server":"accounts"}] {"last_snapshot_record":true,"lsn":33351024,"txId":893,"ts_usec":1746009337290783,"snapshot":"INITIAL","snapshot_completed":true} status-connector-timescaledb-connector {"state":"UNASSIGNED","trace":null,"worker_id":"172.17.0.5:8083","generation":31} status-task-timescaledb-connector-0 {"state":"UNASSIGNED","trace":null,"worker_id":"172.17.0.5:8083","generation":31} status-connector-timescaledb-connector {"state":"RUNNING","trace":null,"worker_id":"172.17.0.5:8083","generation":33} status-task-timescaledb-connector-0 {"state":"RUNNING","trace":null,"worker_id":"172.17.0.5:8083","generation":33}- Connect to your Tiger Cloud service
Enable logical replication for your Tiger Cloud service
Run the following command to enable logical replication:
ALTER SYSTEM SET wal_level = logical; SELECT pg_reload_conf();Restart your service.
Create a table
- High cardinality use cases do not produce good batches and lead to degreaded query performance.
- The columnstore is optimized to store 1000 records per batch, which is the optimal format for ingestion per segment by.
- WAL records are written for the compressed batches rather than the individual tuples.
- Currently only
COPYis support,INSERTwill eventually follow. - Best results are achieved for batch ingestion with 1000 records or more, upper boundary is 10.000 records.
- Continous Aggregates are not supported at the moment.
--no-tablespacesis required because Tiger Cloud does not support tablespaces other than the default. This is a known limitation.--no-owneris required because Tiger Cloud'stsdbadminuser is not a superuser and cannot assign ownership in all cases. This flag means that everything is owned by the user used to connect to the target, regardless of ownership in the source. This is a known limitation.--no-privilegesis required because thetsdbadminuser for your Tiger Cloud service is not a superuser and cannot assign privileges in all cases. This flag means that privileges assigned to other users must be reassigned in the target database as a manual clean-up task. This is a known limitation.Tune the Write Ahead Log (WAL) on the RDS/Aurora Postgres source database
In https://console.aws.amazon.com/rds/home#databases:, select the RDS instance to migrate.
Click
Configuration, scroll down and note theDB instance parameter group, then clickParameter Groups
- Click
Create parameter group, fill in the form with the following values, then clickCreate.- Parameter group name - whatever suits your fancy.
- Description - knock yourself out with this one.
- Engine type -
PostgreSQL - Parameter group family - the same as
DB instance parameter groupin yourConfiguration.
- In
Parameter groups, select the parameter group you created, then clickEdit. Update the following parameters, then click
Save changes.rds.logical_replicationset to1: record the information needed for logical decoding.wal_sender_timeoutset to0: disable the timeout for the sender process.
In RDS, navigate back to your databases, select the RDS instance to migrate, and click
Modify.Scroll down to
Database options, select your new parameter group, and clickContinue.Click
Apply immediatelyor choose a maintenance window, then clickModify DB instance.
Changing parameters will cause an outage. Wait for the database instance to reboot before continuing.
- Verify that the settings are live in your database.
Create a user for the source Postgres connector and assign permissions
Create
<pg connector username>:psql source -c "CREATE USER <pg connector username> PASSWORD '<password>'"
You can use an existing user. However, you must ensure that the user has the following permissions.
Grant permissions to create a replication slot:
psql source -c "GRANT rds_replication TO <pg connector username>"Grant permissions to create a publication:
psql source -c "GRANT CREATE ON DATABASE <database name> TO <pg connector username>"Assign the user permissions on the source database:
psql source <<EOF GRANT USAGE ON SCHEMA "public" TO <pg connector username>; GRANT SELECT ON ALL TABLES IN SCHEMA "public" TO <pg connector username>; ALTER DEFAULT PRIVILEGES IN SCHEMA "public" GRANT SELECT ON TABLES TO <pg connector username>; EOF
If the tables you are syncing are not in the
publicschema, grant the user permissions for each schema you are syncing:psql source <<EOF GRANT USAGE ON SCHEMA <schema> TO <pg connector username>; GRANT SELECT ON ALL TABLES IN SCHEMA <schema> TO <pg connector username>; ALTER DEFAULT PRIVILEGES IN SCHEMA <schema> GRANT SELECT ON TABLES TO <pg connector username>; EOFOn each table you want to sync, make
<pg connector username>the owner:psql source -c 'ALTER TABLE OWNER TO <pg connector username>;'
You can skip this step if the replicating user is already the owner of the tables.
Enable replication
DELETEandUPDATEoperations- A primary key: data replication defaults to the primary key of the table being replicated. Nothing to do.
- A viable unique index: each table has a unique, non-partial, non-deferrable index that includes only columns
marked as
NOT NULL. If a UNIQUE index does not exist, create one to assist the migration. You can delete if after migration. - No primary key or viable unique index: use brute force.
- Create a target Tiger Cloud service with the Real-time analytics capability.
At the command prompt, initialize a new Node.js app:
npm init -yThis creates a
package.jsonfile in your directory, which contains all of the dependencies for your project. It looks something like this:{ "name": "node-sample", "version": "1.0.0", "description": "", "main": "index.js", "scripts": { "test": "echo \"Error: no test specified\" && exit 1" }, "keywords": [], "author": "", "license": "ISC" }Install Express.js:
npm install expressCreate a simple web page to check the connection. Create a new file called
index.js, with this content:const express = require('express') const app = express() const port = 3000; app.use(express.json()); app.get('/', (req, res) => res.send('Hello World!')) app.listen(port, () => console.log(`Example app listening at http://localhost:${port}`))Test your connection by starting the application:
node index.jsAdd Sequelize to your project:
npm install sequelize sequelize-cli pg pg-hstoreLocate your TimescaleDB credentials and use them to compose a connection string for Sequelize.
You'll need:
- password
- username
- host URL
- port
- database name
Compose your connection string variable, using this format:
'postgres://<user>:<password>@<host>:<port>/<dbname>'Open the
index.jsfile you created. Require Sequelize in the application, and declare the connection string:const Sequelize = require('sequelize') const sequelize = new Sequelize('postgres://<user>:<password>@<host>:<port>/<dbname>', { dialect: 'postgres', protocol: 'postgres', dialectOptions: { ssl: { require: true, rejectUnauthorized: false } } })Make sure you add the SSL settings in the
dialectOptionssections. You can't connect to TimescaleDB using SSL without them.You can test the connection by adding these lines to
index.jsafter theapp.getstatement:sequelize.authenticate().then(() => { console.log('Connection has been established successfully.'); }).catch(err => { console.error('Unable to connect to the database:', err); });Start the application on the command line:
node index.jsIf the connection is successful, you'll get output like this:
Example app listening at http://localhost:3000 Executing (default): SELECT 1+1 AS result Connection has been established successfully.Use the Sequelize command line tool to create a table and model called
page_loads:npx sequelize model:generate --name page_loads \ --attributes userAgent:string,time:dateThe output looks similar to this:
Sequelize CLI [Node: 12.16.2, CLI: 5.5.1, ORM: 5.21.11] New model was created at <PATH>. New migration was created at <PATH>.Edit the migration file so that it sets up a migration key:
'use strict'; module.exports = { up: async (queryInterface, Sequelize) => { await queryInterface.createTable('page_loads', { userAgent: { primaryKey: true, type: Sequelize.STRING }, time: { primaryKey: true, type: Sequelize.DATE } }); }, down: async (queryInterface, Sequelize) => { await queryInterface.dropTable('page_loads'); } };Migrate the change and make sure that it is reflected in the database:
npx sequelize db:migrateThe output looks similar to this:
Sequelize CLI [Node: 12.16.2, CLI: 5.5.1, ORM: 5.21.11] Loaded configuration file "config/config.json". Using environment "development". == 20200528195725-create-page-loads: migrating ======= == 20200528195725-create-page-loads: migrated (0.443s)Create the
PageLoadsmodel in your code. In theindex.jsfile, above theapp.usestatement, add these lines:let PageLoads = sequelize.define('page_loads', { userAgent: {type: Sequelize.STRING, primaryKey: true }, time: {type: Sequelize.DATE, primaryKey: true } }, { timestamps: false });Instantiate a
PageLoadsobject and save it to the database.Create a migration to modify the
page_loadsrelational table, and change it to a hypertable by first running the following command:npx sequelize migration:generate --name add_hypertableThe output looks similar to this:
Sequelize CLI [Node: 12.16.2, CLI: 5.5.1, ORM: 5.21.11] migrations folder at <PATH> already exists. New migration was created at <PATH>/20200601202912-add_hypertable.js .In the
migrationsfolder, there is now a new file. Open the file, and add this content:'use strict'; module.exports = { up: (queryInterface, Sequelize) => { return queryInterface.sequelize.query("SELECT create_hypertable('page_loads', by_range('time'));"); }, down: (queryInterface, Sequelize) => { } };The
by_rangedimension builder is an addition to TimescaleDB 2.13.At the command prompt, run the migration command:
npx sequelize db:migrateThe output looks similar to this:
Sequelize CLI [Node: 12.16.2, CLI: 5.5.1, ORM: 5.21.11] Loaded configuration file "config/config.json". Using environment "development". == 20200601202912-add_hypertable: migrating ======= == 20200601202912-add_hypertable: migrated (0.426s)In the
index.jsfile, modify the/route to get theuser-agentfrom the request object (req) and the current timestamp. Then, call thecreatemethod onPageLoadsmodel, supplying the user agent and timestamp parameters. Thecreatecall executes anINSERTon the database:app.get('/', async (req, res) => { // get the user agent and current time const userAgent = req.get('user-agent'); const time = new Date().getTime(); try { // insert the record await PageLoads.create({ userAgent, time }); // send response res.send('Inserted!'); } catch (e) { console.log('Error inserting data', e) } })Modify the
/route in theindex.jsfile to call the SequelizefindAllfunction and retrieve all data from thepage_loadstable using thePageLoadsmodel:app.get('/', async (req, res) => { // get the user agent and current time const userAgent = req.get('user-agent'); const time = new Date().getTime(); try { // insert the record await PageLoads.create({ userAgent, time }); // now display everything in the table const messages = await PageLoads.findAll(); res.send(messages); } catch (e) { console.log('Error inserting data', e) } })Ensure that the Tiger Cloud service is running the Postgres extensions used in your source database.
Check the extensions on the source database:
psql source -c "SELECT * FROM pg_extension;"For each extension, enable it on your target Tiger Cloud service:
psql target -c "CREATE EXTENSION IF NOT EXISTS <extension name> CASCADE;"
At the command prompt, install
timescaledb-parallel-copy:go get github.com/timescale/timescaledb-parallel-copy/cmd/timescaledb-parallel-copyUse
timescaledb-parallel-copyto import data into your Tiger Cloud service. Set<NUM_WORKERS>to twice the number of CPUs in your database. For example, if you have 4 CPUs,<NUM_WORKERS>should be8.timescaledb-parallel-copy \ --connection "host=<HOST> \ user=tsdbadmin password=<PASSWORD> \ port=<PORT> \ dbname=tsdb \ sslmode=require " \ --table \ --file <FILE_NAME>.csv \ --workers <NUM_WORKERS> \ --reporting-period 30sRepeat for each table and hypertable you want to migrate.
Install the latest Postgres and TimescaleDB packages
sudo pacman -Syu timescaledb timescaledb-tune postgresql-libsInitalize your Postgres instance
sudo -u postgres initdb --locale=en_US.UTF-8 --encoding=UTF8 -D /var/lib/postgres/data --data-checksumsTune your Postgres instance for TimescaleDB
sudo timescaledb-tuneThis script is included with the
timescaledb-toolspackage when you install TimescaleDB. For more information, see configuration.Enable and start Postgres
sudo systemctl enable postgresql.service sudo systemctl start postgresql.serviceLog in to Postgres as
postgressudo -u postgres psqlYou are in the psql shell.
Set the password for
postgres\password postgresWhen you have set the password, type
\qto exit psql.- Dump the roles from your source database
- Remove roles with superuser access
- Dump the source database schema and data
- Monitoring computer systems: virtual machines, servers, container metrics, CPU, free memory, net/disk IOPs, service and application metrics such as request rates, and request latency.
- Financial trading systems: securities, cryptocurrencies, payments, and transaction events.
- Internet of things: data from sensors on industrial machines and equipment, wearable devices, vehicles, physical containers, pallets, and consumer devices for smart homes.
- Eventing applications: user or customer interaction data such as clickstreams, pageviews, logins, and signups.
- Business intelligence: Tracking key metrics and the overall health of the business.
- Environmental monitoring: temperature, humidity, pressure, pH, pollen count, air flow, carbon monoxide, nitrogen dioxide, or particulate matter.
Ensure that the source and target databases are running the same version of TimescaleDB.
Check the version of TimescaleDB running on your Tiger Cloud service:
psql target -c "SELECT extversion FROM pg_extension WHERE extname = 'timescaledb';"Update the TimescaleDB extension in your source database to match the target service:
If the TimescaleDB extension is the same version on the source database and target service, you do not need to do this.
psql source -c "ALTER EXTENSION timescaledb UPDATE TO '<version here>';"For more information and guidance, see Upgrade TimescaleDB.
Ensure that the Tiger Cloud service is running the Postgres extensions used in your source database.
Check the extensions on the source database:
psql source -c "SELECT * FROM pg_extension;"For each extension, enable it on your target Tiger Cloud service:
psql target -c "CREATE EXTENSION IF NOT EXISTS <extension name> CASCADE;"
- Install the
wal2jsonextension on your source database Prevent Postgres from treating the data in a snapshot as outdated
psql -X -d source -c 'alter system set old_snapshot_threshold=-1'Set the write-Ahead Log (WAL) to record the information needed for logical decoding
psql -X -d source -c 'alter system set wal_level=logical'Restart the source database
- Enable live-migration to replicate
DELETEandUPDATEoperations - A primary key: data replication defaults to the primary key of the table being replicated. Nothing to do.
- A viable unique index: each table has a unique, non-partial, non-deferrable index that includes only columns
marked as
NOT NULL. If a UNIQUE index does not exist, create one to assist the migration. You can delete if after migration. - No primary key or viable unique index: use brute force.
- Create a target self-hosted TimescaleDB instance.
- Validate the migrated data
- Stop app downtime
- Cleanup resources associated with live-migration from your migration machine
- Row-based storage for recent data: the most recent chunk (and possibly more) is always stored in the rowstore, ensuring fast inserts, updates, and low-latency single record queries. Additionally, row-based storage is used as a writethrough for inserts and updates to columnar storage.
- Columnar storage for analytical performance: chunks are automatically compressed into the columnstore, optimizing storage efficiency and accelerating analytical queries.
- Connect to your Tiger Cloud service
- Create a hypertable to store the real-time cryptocurrency data
Add a table to store the asset symbol and name in a relational table
CREATE TABLE crypto_assets ( symbol TEXT UNIQUE, "name" TEXT );- Sign up for a 30-day free trial
Confirm your email address
In the confirmation email, click the link supplied.
Select the pricing plan
- Open AWS Marketplace and search for
Tiger Cloud Select the pricing option that suits you and click
View purchase optionsReview and configure the purchase details, then click
SubscribeClick
Set up your accountat the top of the page- Sign up for a 30-day free trial
- Select the pricing plan
In
Confirm AWS Marketplace connection, clickConnectYour Tiger Cloud and AWS accounts are now connected.
- Check your service is running correctly
- Connect to your service
In Tiger Cloud Console, toggle
Data.Select your service in the connection drop-down in the top right.
Run a test query:
SELECT CURRENT_DATE;This query gives you the current date, you have successfully connected to your service.
In Tiger Cloud Console, select your service.
Click
SQL editor.Run a test query:
SELECT CURRENT_DATE;This query gives you the current date, you have successfully connected to your service.
Install psql.
Run the following command in the terminal using the service URL from the config file you have saved during service creation:
psql "<your-service-url>"Run a test query:
SELECT CURRENT_DATE;This query returns the current date. You have successfully connected to your service.
- Manage your services in the ops mode in Tiger Cloud Console: add read replicas and enable high availability, compress data into the columnstore, change parameters, and so on.
- Analyze your data in the data mode in Tiger Cloud Console: write queries with autocomplete, save them in folders, share them, create charts/dashboards, and much more.
- Store configuration and security information in your config file.
At the command prompt, dump the schema post-data from your source database into a
dump_post_data.dumpfile, using your source database connection details. Exclude Timescale-specific schemas. If you are prompted for a password, use your source database credentials:pg_dump -U <SOURCE_DB_USERNAME> -W \ -h <SOURCE_DB_HOST> -p <SOURCE_DB_PORT> -Fc -v \ --section=post-data --exclude-schema="_timescaledb*" \ -f dump_post_data.dump <DATABASE_NAME>Restore the dumped schema post-data from the
dump_post_data.dumpfile into your Tiger Cloud service, using your connection details. To avoid permissions errors, include the--no-ownerflag:pg_restore -U tsdbadmin -W \ -h <HOST> -p <PORT> --no-owner -Fc \ -v -d tsdb dump_post_data.dumpConnect to your source database:
psql "postgres://<SOURCE_DB_USERNAME>:<SOURCE_DB_PASSWORD>@<SOURCE_DB_HOST>:<SOURCE_DB_PORT>/<SOURCE_DB_NAME>?sslmode=require"Get a list of your existing continuous aggregate definitions:
SELECT view_name, view_definition FROM timescaledb_information.continuous_aggregates;This query returns the names and definitions for all your continuous aggregates. For example:
view_name | view_definition ----------------+-------------------------------------------------------------------------------------------------------- avg_fill_levels | SELECT round(avg(fill_measurements.fill_level), 2) AS avg_fill_level, + | time_bucket('01:00:00'::interval, fill_measurements."time") AS bucket, + | fill_measurements.sensor_id + | FROM fill_measurements + | GROUP BY (time_bucket('01:00:00'::interval, fill_measurements."time")), fill_measurements.sensor_id; (1 row)Connect to your Tiger Cloud service:
psql "postgres://tsdbadmin:<PASSWORD>@<HOST>:<PORT>/tsdb?sslmode=require"Recreate each continuous aggregate definition:
CREATE MATERIALIZED VIEW <VIEW_NAME> WITH (timescaledb.continuous) AS <VIEW_DEFINITION>Connect to your source database:
psql "postgres://<SOURCE_DB_USERNAME>:<SOURCE_DB_PASSWORD>@<SOURCE_DB_HOST>:<SOURCE_DB_PORT>/<SOURCE_DB_NAME>?sslmode=require"Get a list of your existing policies. This query returns a list of all your policies, including continuous aggregate refresh policies, retention policies, compression policies, and reorder policies:
SELECT application_name, schedule_interval, retry_period, config, hypertable_name FROM timescaledb_information.jobs WHERE owner = '<SOURCE_DB_USERNAME>';Connect to your Tiger Cloud service:
psql "postgres://tsdbadmin:<PASSWORD>@<HOST>:<PORT>/tsdb?sslmode=require"Recreate each policy. For more information about recreating policies, see the sections on continuous-aggregate refresh policies, retention policies, Hypercore policies, and reorder policies.
- Take the applications that connect to the RDS instance offline
- Connect to your intermediary EC2 instance
- Set your connection strings
Ensure that the Tiger Cloud service is running the Postgres extensions used in your source database.
Check the extensions on the source database:
psql source -c "SELECT * FROM pg_extension;"For each extension, enable it on your target Tiger Cloud service:
psql target -c "CREATE EXTENSION IF NOT EXISTS <extension name> CASCADE;"
- Dump the roles from your RDS instance
- Remove roles with superuser access
Upload the roles to your Tiger Cloud service
psql -X -d "target" \ -v ON_ERROR_STOP=1 \ --echo-errors \ -f roles.sqlManually assign passwords to the roles
- Dump the data from your RDS instance to your intermediary EC2 instance
Upload your data to your Tiger Cloud service
psql -d target -v ON_ERROR_STOP=1 --echo-errors \ -f dump.sqlUpdate the table statistics.
psql target -c "ANALYZE;"Verify the data in the target Tiger Cloud service.
- Enable any Tiger Cloud features you want to use.
- Reconfigure your app to use the target database, then restart it.
- Ensure data security with high availability and read replicas
- Save money with columnstore compression and tiered storage
- Enable Postgres extensions to add extra functionality
- Increase security using VPCs
- Perform day-to-day administration
- Write queries with autocomplete
- Visualize data with charts and dashboards
- Schedule queries and dashboards for alerts or recurring reports
- Share queries and dashboards
- Interact with your data on auto-pilot with SQL assistant
- Create a target Tiger Cloud service.
To ensure that maintenance does not run while migration is in progress, best practice is to adjust the maintenance window.
Ensure that the source Postgres instance and the target Tiger Cloud service have the same extensions installed.
- Install Docker on your sync machine.
- Install the Postgres client tools on your sync machine.
The schema is not migrated by the source Postgres connector, you use
pg_dump/pg_restoreto migrate it.This works for Postgres databases only as source. TimescaleDB is not yet supported.
The source must be running Postgres 13 or later.
Schema changes must be co-ordinated.
- Ensure that the source Postgres instance and the target Tiger Cloud service have the same extensions installed.
There is WAL volume growth on the source Postgres instance during large table copy.
Continuous aggregate invalidation
- Missing data in continuous aggregates for the migration period.
- Stale aggregate data.
- Queries returning incomplete results.
Update the DB instance parameter group for your source database
In https://console.aws.amazon.com/rds/home#databases:, select the RDS instance to migrate.
Click
Configuration, scroll down and note theDB instance parameter group, then clickParameter groups
- Click
Create parameter group, fill in the form with the following values, then clickCreate.- Parameter group name - whatever suits your fancy.
- Description - knock yourself out with this one.
- Engine type -
PostgreSQL - Parameter group family - the same as
DB instance parameter groupin yourConfiguration.
- In
Parameter groups, select the parameter group you created, then clickEdit. Update the following parameters, then click
Save changes.rds.logical_replicationset to1: record the information needed for logical decoding.wal_sender_timeoutset to0: disable the timeout for the sender process.
In RDS, navigate back to your databases, select the RDS instance to migrate, and click
Modify.Scroll down to
Database options, select your new parameter group, and clickContinue.Click
Apply immediatelyor choose a maintenance window, then clickModify DB instance.
Changing parameters will cause an outage. Wait for the database instance to reboot before continuing.
- Verify that the settings are live in your database.
Enable replication
DELETEandUPDATEoperations- A primary key: data replication defaults to the primary key of the table being replicated. Nothing to do.
- A viable unique index: each table has a unique, non-partial, non-deferrable index that includes only columns
marked as
NOT NULL. If a UNIQUE index does not exist, create one to assist the migration. You can delete if after migration. - No primary key or viable unique index: use brute force.
Tune the Write Ahead Log (WAL) on the Postgres source database
psql source <<EOF ALTER SYSTEM SET wal_level='logical'; ALTER SYSTEM SET max_wal_senders=10; ALTER SYSTEM SET wal_sender_timeout=0; EOFCreate a user for the connector and assign permissions
Create
<pg connector username>:psql source -c "CREATE USER <pg connector username> PASSWORD '<password>'"
You can use an existing user. However, you must ensure that the user has the following permissions.
Grant permissions to create a replication slot:
psql source -c "ALTER ROLE <pg connector username> REPLICATION"Grant permissions to create a publication:
psql source -c "GRANT CREATE ON DATABASE <database name> TO <pg connector username>"Assign the user permissions on the source database:
psql source <<EOF GRANT USAGE ON SCHEMA "public" TO <pg connector username>; GRANT SELECT ON ALL TABLES IN SCHEMA "public" TO <pg connector username>; ALTER DEFAULT PRIVILEGES IN SCHEMA "public" GRANT SELECT ON TABLES TO <pg connector username>; EOF
If the tables you are syncing are not in the
publicschema, grant the user permissions for each schema you are syncing:psql source <<EOF GRANT USAGE ON SCHEMA <schema> TO <pg connector username>; GRANT SELECT ON ALL TABLES IN SCHEMA <schema> TO <pg connector username>; ALTER DEFAULT PRIVILEGES IN SCHEMA <schema> GRANT SELECT ON TABLES TO <pg connector username>; EOFOn each table you want to sync, make
<pg connector username>the owner:psql source -c 'ALTER TABLE OWNER TO <pg connector username>;'
You can skip this step if the replicating user is already the owner of the tables.
Enable replication
DELETEandUPDATEoperations- A primary key: data replication defaults to the primary key of the table being replicated. Nothing to do.
- A viable unique index: each table has a unique, non-partial, non-deferrable index that includes only columns
marked as
NOT NULL. If a UNIQUE index does not exist, create one to assist the migration. You can delete if after migration. - No primary key or viable unique index: use brute force.
Download the schema from the source database
pg_dump source \ --no-privileges \ --no-owner \ --no-publications \ --no-subscriptions \ --no-table-access-method \ --no-tablespaces \ --schema-only \ --file=schema.sqlApply the schema on the target service
psql target -f schema.sql- Convert tables to hypertables
- Convert Postgres partitions to hypertables
- Create a publication that specifies the table to synchronize
Publish the Postgres declarative partitioned table
ALTER PUBLICATION <publication_name> SET(publish_via_partition_root=true);Stop syncing a table in the
PUBLICATION, useDROP TABLEALTER PUBLICATION <publication_name> DROP TABLE ;- Start the source Postgres connector
- Capture logs
- View the progress of tables being synchronized
- Add or remove tables from the publication
- Update table statistics
Stop the source Postgres connector
docker stop live-sync(Optional) Reset sequence nextval on the target Tiger Cloud service
- Clean up
- Take the applications that connect to the source database offline
- Set your connection strings
Ensure that the source and target databases are running the same version of TimescaleDB.
Check the version of TimescaleDB running on your Tiger Cloud service:
psql target -c "SELECT extversion FROM pg_extension WHERE extname = 'timescaledb';"Update the TimescaleDB extension in your source database to match the target service:
If the TimescaleDB extension is the same version on the source database and target service, you do not need to do this.
psql source -c "ALTER EXTENSION timescaledb UPDATE TO '<version here>';"For more information and guidance, see Upgrade TimescaleDB.
Ensure that the Tiger Cloud service is running the Postgres extensions used in your source database.
Check the extensions on the source database:
psql source -c "SELECT * FROM pg_extension;"For each extension, enable it on your target Tiger Cloud service:
psql target -c "CREATE EXTENSION IF NOT EXISTS <extension name> CASCADE;"
- Dump the roles from your source database
- Remove roles with superuser access
- Dump the source database schema and data
Upload your data
psql target -v ON_ERROR_STOP=1 --echo-errors \ -f roles.sql \ -c "SELECT timescaledb_pre_restore();" \ -f dump.sql \ -c "SELECT timescaledb_post_restore();"Manually assign passwords to the roles
Verify Kafka Connect is running
In yet another another Terminal window, run the following command:
curl http://localhost:8083You see something like:
{"version":"3.9.0","commit":"a60e31147e6b01ee","kafka_cluster_id":"J-iy4IGXTbmiALHwPZEZ-A"}Connect to your Tiger Cloud service
Create a hypertable to ingest Kafka events
CREATE TABLE accounts ( created_at TIMESTAMPTZ DEFAULT NOW(), name TEXT, city TEXT ) WITH ( tsdb.hypertable, tsdb.partition_column='created_at' );Create the connection configuration
In the terminal running Kafka Connect, stop the process by pressing
Ctrl+C.Write the following configuration to
<KAFKA_HOME>/config/timescale-standalone-sink.properties, then update the<properties>with your connection details.name=timescale-standalone-sink connector.class=org.apache.camel.kafkaconnector.postgresqlsink.CamelPostgresqlsinkSinkConnector errors.tolerance=all errors.deadletterqueue.topic.name=deadletter tasks.max=10 value.converter=org.apache.kafka.connect.storage.StringConverter key.converter=org.apache.kafka.connect.storage.StringConverter topics=accounts camel.kamelet.postgresql-sink.databaseName=<dbname> camel.kamelet.postgresql-sink.username=<user> camel.kamelet.postgresql-sink.password=<password> camel.kamelet.postgresql-sink.serverName=<host> camel.kamelet.postgresql-sink.serverPort=<port> camel.kamelet.postgresql-sink.query=INSERT INTO accounts (name,city) VALUES (:#name,:#city)Restart Kafka Connect with the new configuration:
export CLASSPATH=`pwd`/plugins/camel-postgresql-sink-kafka-connector/* ./bin/connect-standalone.sh config/connect-standalone.properties config/timescale-standalone-sink.properties
Test the connection
In the terminal running
kafka-console-producer.shenter the following json strings{"name":"Lola","city":"Copacabana"} {"name":"Holly","city":"Miami"} {"name":"Jolene","city":"Tennessee"} {"name":"Barbara Ann ","city":"California"}Query your Tiger Cloud service for all rows in the
accountstableSELECT * FROM accounts;- Create a target Tiger Cloud service with the Real-time analytics capability.
- Install Python3 and pip3
- Install Apache Airflow
Enable Postgres connections between Airflow and Tiger Cloud
pip install psycopg2-binaryEnable Postgres connection types in the Airflow UI
pip install apache-airflow-providers-postgresRun Airflow
On your development machine, run the following command:
airflow standaloneThe username and password for Airflow UI are displayed in the
standalone | Login with usernameline in the output.Add a connection from Airflow to your Tiger Cloud service
- In your browser, navigate to
localhost:8080, then selectAdmin>Connections. - Click
+(Add a new record), then use your connection info to fill in the form. TheConnection TypeisPostgres.
- In your browser, navigate to
- Create and execute a DAG
In
$AIRFLOW_HOME/dags/timescale_dag.py, add the following code:from airflow import DAG from airflow.operators.python_operator import PythonOperator from airflow.hooks.postgres_hook import PostgresHook from datetime import datetime def insert_data_to_timescale(): hook = PostgresHook(postgres_conn_id='the ID of the connenction you created') conn = hook.get_conn() cursor = conn.cursor() """ This could be any query. This example inserts data into the table you create in: https://docs.tigerdata.com/getting-started/latest/try-key-features-timescale-products/#optimize-time-series-data-in-hypertables """ cursor.execute("INSERT INTO crypto_assets (symbol, name) VALUES (%s, %s)", ('NEW/Asset','New Asset Name')) conn.commit() cursor.close() conn.close() default_args = { 'owner': 'airflow', 'start_date': datetime(2023, 1, 1), 'retries': 1, } dag = DAG('timescale_dag', default_args=default_args, schedule_interval='@daily') insert_task = PythonOperator( task_id='insert_data', python_callable=insert_data_to_timescale, dag=dag, )This DAG uses the
companytable created in Create regular Postgres tables for relational data.In your browser, refresh the Airflow UI.
In
Search DAGS, typetimescale_dagand press ENTER.Press the play icon and trigger the DAG:
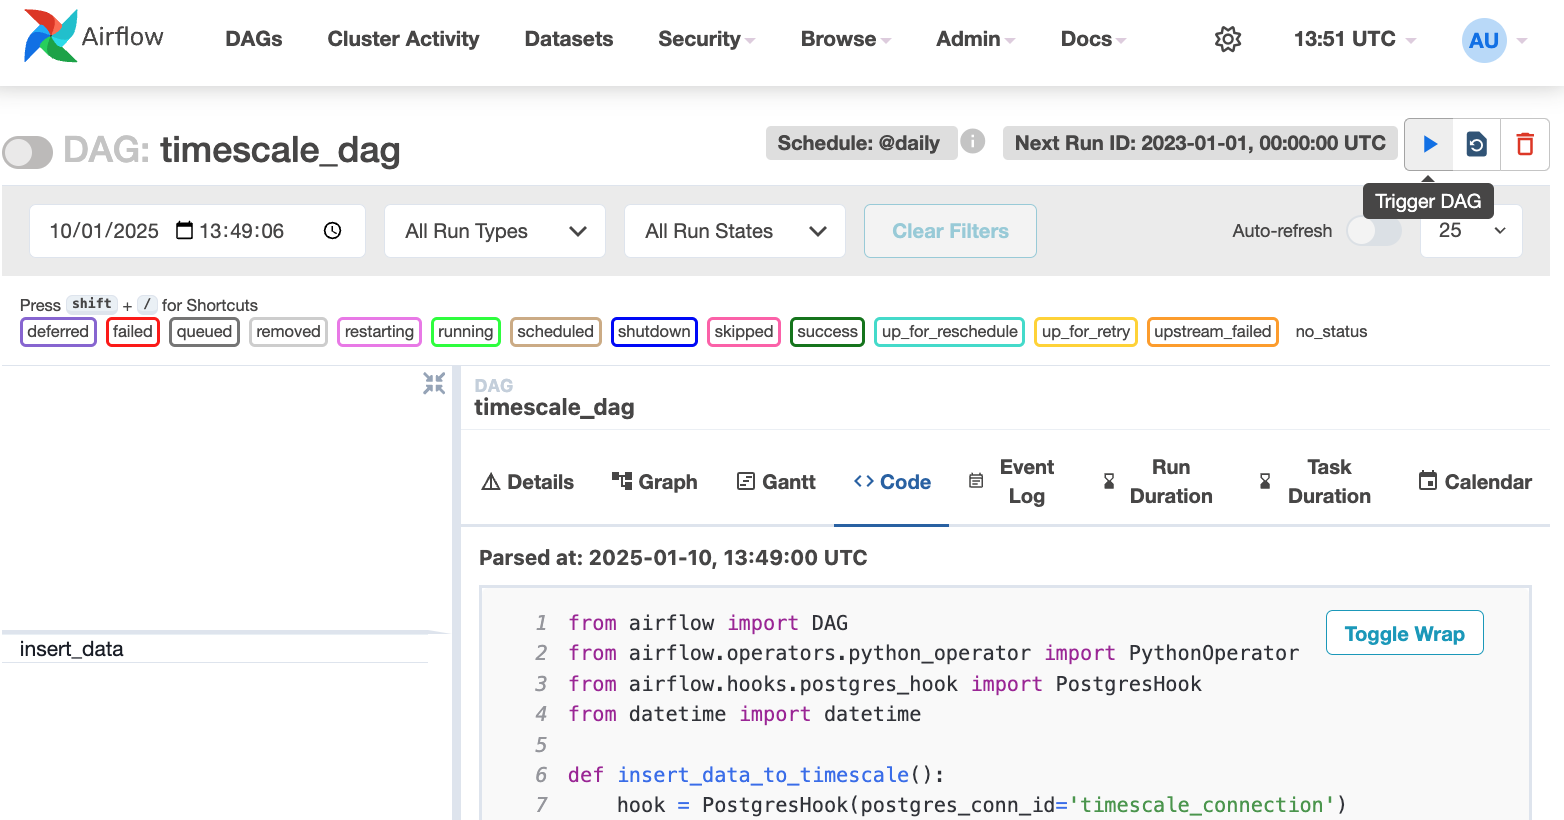
Verify that the data appears in Tiger Cloud
- In Tiger Cloud Console, navigate to your service and click
SQL editor. - Run a query to view your data. For example:
SELECT symbol, name FROM company;.
You see the new rows inserted in the table.
- In Tiger Cloud Console, navigate to your service and click
- Create a target Tiger Cloud service with the Real-time analytics capability.
- Set up an AWS Account
- Connect to your Tiger Cloud service
- For better performance and easier real-time analytics, create a hypertable
Create a SageMaker Notebook instance
- In Amazon SageMaker > Notebooks and Git repos, click
Create Notebook instance. - Follow the wizard to create a default Notebook instance.
- In Amazon SageMaker > Notebooks and Git repos, click
Write a Notebook script that inserts data into your Tiger Cloud service
- When your Notebook instance is
inService,clickOpen JupyterLaband clickconda_python3. Update the following script with your connection details, then paste it in the Notebook.
import psycopg2 from datetime import datetime def insert_prediction(model_name, prediction, host, port, user, password, dbname): conn = psycopg2.connect( host=host, port=port, user=user, password=password, dbname=dbname ) cursor = conn.cursor() query = """ INSERT INTO model_predictions (time, model_name, prediction) VALUES (%s, %s, %s); """ values = (datetime.utcnow(), model_name, prediction) cursor.execute(query, values) conn.commit() cursor.close() conn.close() insert_prediction( model_name="example_model", prediction=0.95, host="<host>", port="<port>", user="<user>", password="<password>", dbname="<dbname>" )
- When your Notebook instance is
Test your SageMaker script
- Run the script in your SageMaker notebook.
- Verify that the data is in your service
Open an SQL editor and check the
sensor_datatable:SELECT * FROM model_predictions;You see something like:
|time | model_name | prediction | | -- | -- | -- | |2025-02-06 16:56:34.370316+00| timescale-cloud-model| 0.95|
- Create a target Tiger Cloud service with the Real-time analytics capability.
- Set up AWS Transit Gateway.
Create a Peering VPC in Tiger Cloud Console
- In
Security>VPC, clickCreate a VPC:
- Choose your region and IP range, name your VPC, then click
Create VPC:
Your service and Peering VPC must be in the same AWS region. The number of Peering VPCs you can create in your project depends on your pricing plan. If you need another Peering VPC, either contact support@tigerdata.com or change your plan in Tiger Cloud Console.
Add a peering connection:
- In the
VPC Peeringcolumn, clickAdd. - Provide your AWS account ID, Transit Gateway ID, CIDR ranges, and AWS region. Tiger Cloud creates a new isolated connection for every unique Transit Gateway ID.
- Click
Add connection.
- In the
- In
Accept and configure peering connection in your AWS account
Accept the peering request coming from Tiger Cloud. The request can take up to 5 min to arrive. Within 5 more minutes after accepting, the peering should appear as
Connectedin Tiger Cloud Console.Configure at least the following in your AWS account networking:
- Your subnet route table to route traffic to your Transit Gateway for the Peering VPC CIDRs.
- Your Transit Gateway route table to route traffic to the newly created Transit Gateway peering attachment for the Peering VPC CIDRs.
- Security groups to allow outbound TCP 5432.
Attach a Tiger Cloud service to the Peering VPC In Tiger Cloud Console
- Select the service you want to connect to the Peering VPC.
- Click
Operations>Security>VPC. - Select the VPC, then click
Attach VPC.
- Create a target Tiger Cloud service with the Real-time analytics capability.
- Install self-managed Grafana or sign up for Grafana Cloud.
- Log in to Grafana
Add your service as a data source
- Open
Connections>Data sources, then clickAdd new data source. - Select
PostgreSQLfrom the list. Configure the connection:
Host URL,Database name,Username, andPassword
Configure using your connection details.
Host URLis in the format<host>:<port>.TLS/SSL Mode: selectrequire.PostgreSQL options: enableTimescaleDB.- Leave the default setting for all other fields.
Click
Save & test.
Grafana checks that your details are set correctly.
- Open
On the
Dashboardspage, clickNewand selectNew dashboardClick
Add visualizationSelect the data source
- Configure your panel
- Run your queries
- Click
Save dashboard - Call
_timefilter()to link the user interface construct in a Grafana panel with the query Group your visualizations and order the results by time buckets
In this case, the
GROUP BYandORDER BYstatements referencetime.For example:
SELECT --1-- time_bucket('1 day', pickup_datetime) AS time, --2-- COUNT(*) FROM rides WHERE _timeFilter(pickup_datetime) GROUP BY time ORDER BY timeWhen you visualize this query in Grafana, you see this:
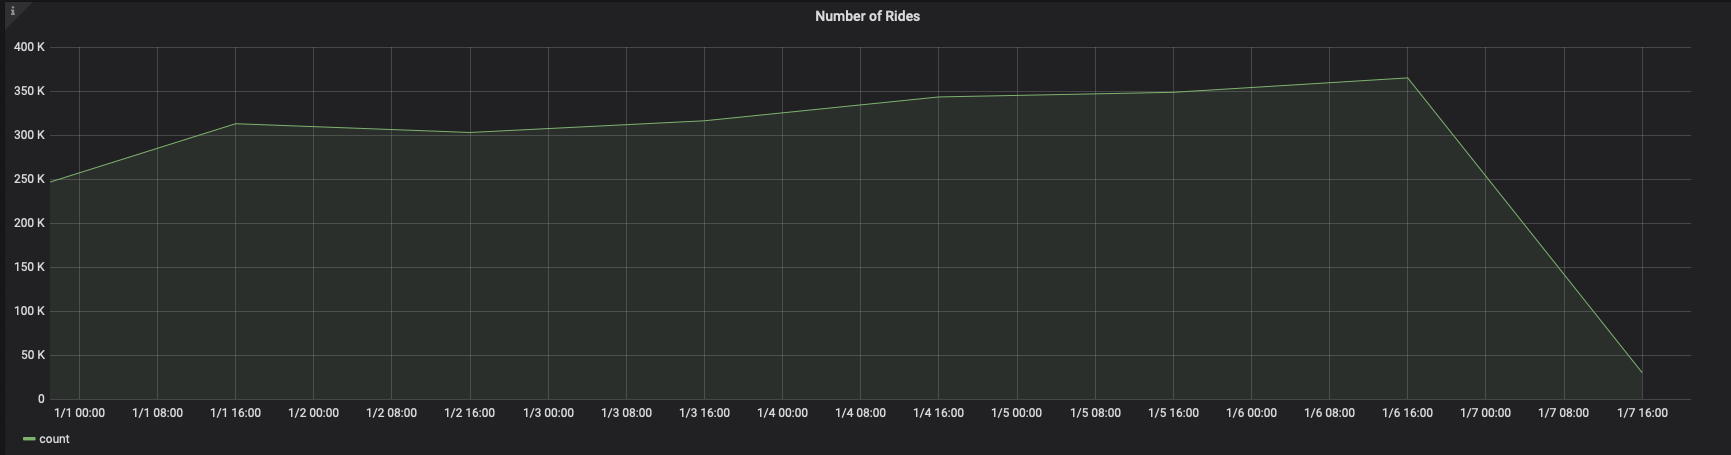
You can adjust the
time_bucketfunction and compare the graphs:SELECT --1-- time_bucket('5m', pickup_datetime) AS time, --2-- COUNT(*) FROM rides WHERE _timeFilter(pickup_datetime) GROUP BY time ORDER BY timeWhen you visualize this query, it looks like this:
Add a geospatial visualization
In your Grafana dashboard, click
Add>Visualization.Select
Geomapin the visualization type drop-down at the top right.
Configure the data format
In the
Queriestab below, select your data source.In the
Formatdrop-down, selectTable.In the mode switcher, toggle
Codeand enter the query, then clickRun.
For example:
SELECT time_bucket('5m', rides.pickup_datetime) AS time, rides.trip_distance AS value, rides.pickup_latitude AS latitude, rides.pickup_longitude AS longitude FROM rides WHERE rides.trip_distance > 5 GROUP BY time, rides.trip_distance, rides.pickup_latitude, rides.pickup_longitude ORDER BY time LIMIT 500;Customize the Geomap settings
With default settings, the visualization uses green circles of the fixed size. Configure at least the following for a more representative view:
Map layers>Styles>Size>value.
This changes the size of the circle depending on the value, with bigger circles representing bigger values.
Map layers>Styles>Color>value.Thresholds> Addthreshold.
Add thresholds for 7 and 10, to mark rides over 7 and 10 miles in different colors, respectively.
You now have a visualization that looks like this:
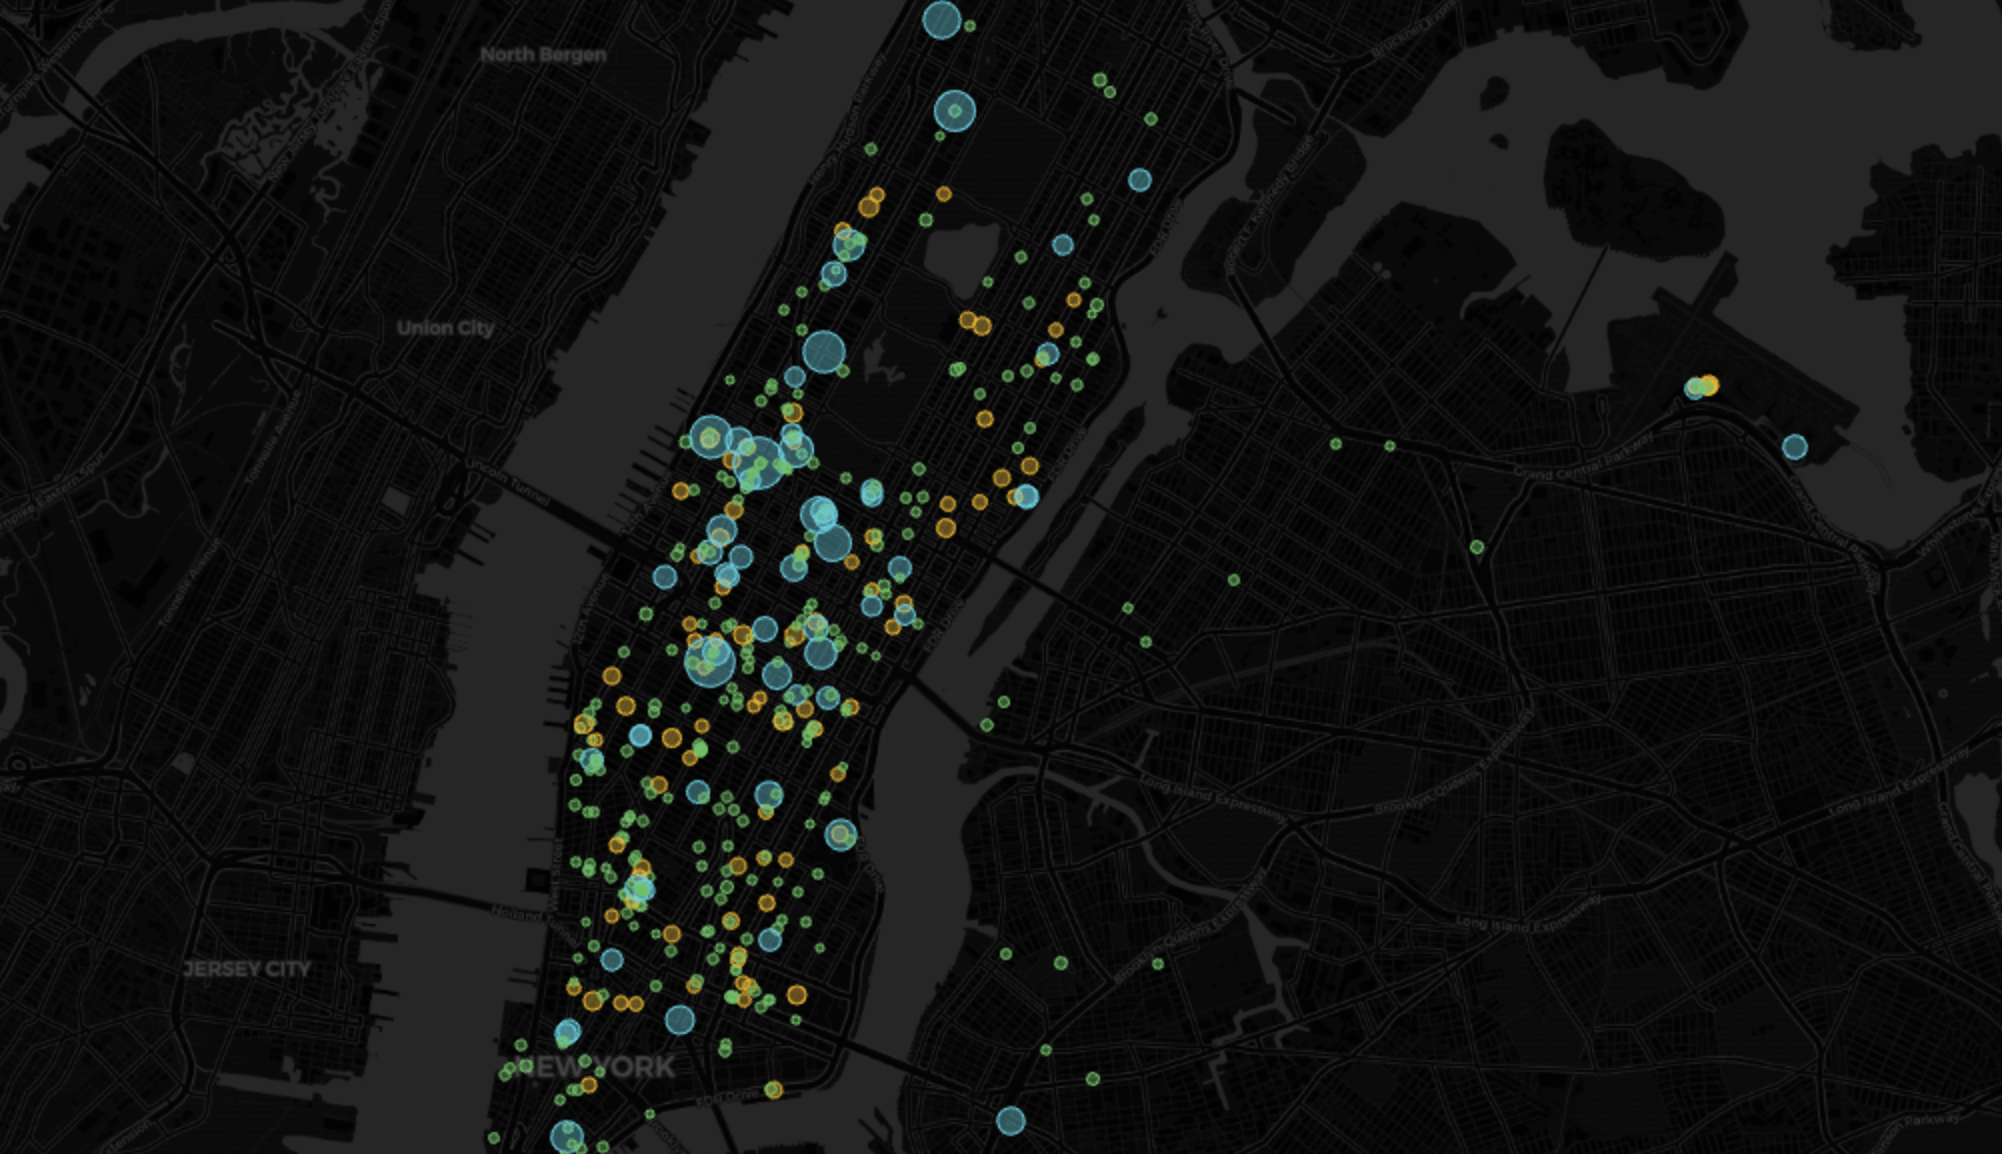
- Create a target Tiger Cloud service with the Real-time analytics capability.
- Download and install DBeaver.
- Start
DBeaver - In the toolbar, click the plug+ icon
- In
Connect to a databasesearch forTimescaleDB - Select
TimescaleDB, then clickNext Configure the connection
Use your connection details to add your connection settings.
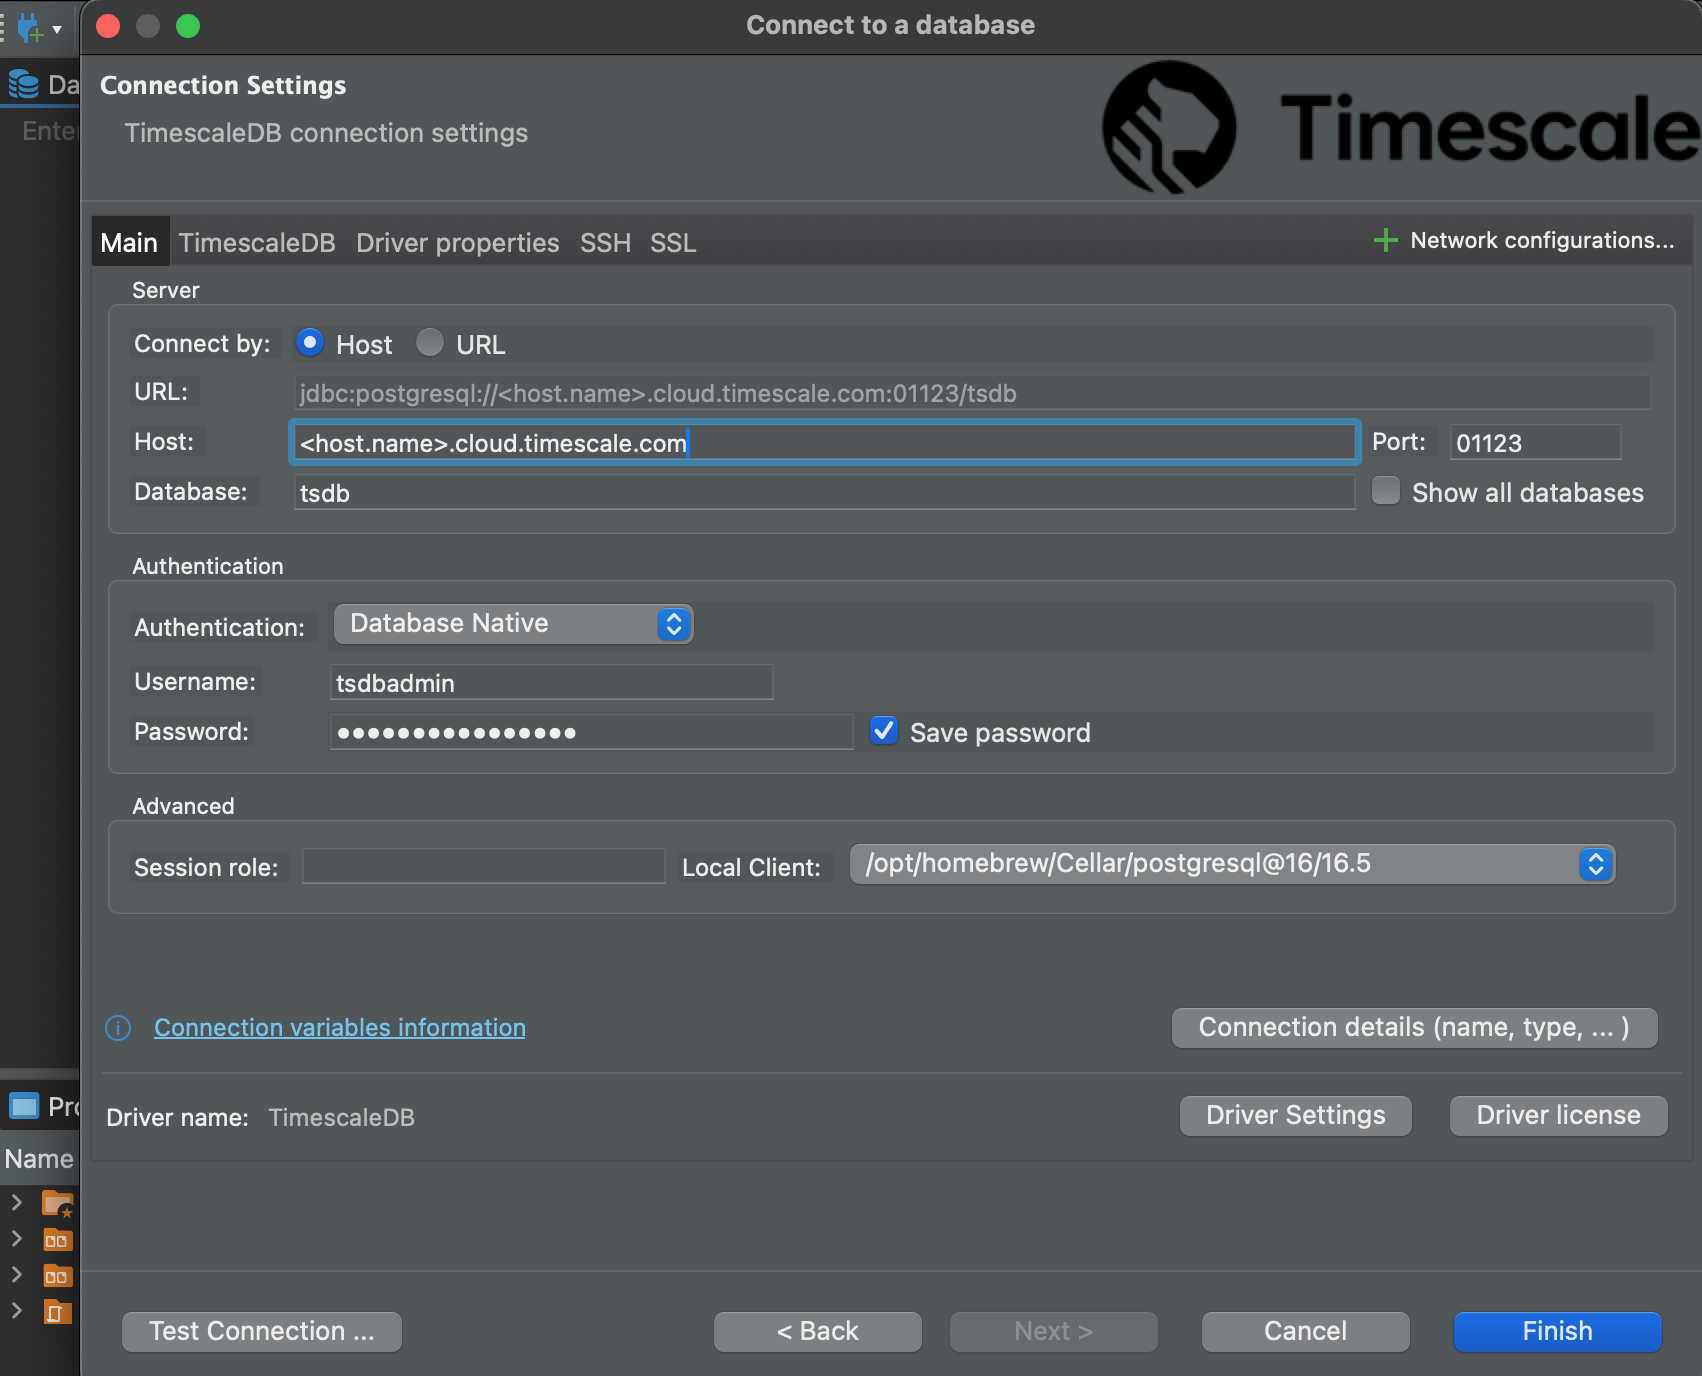
If you configured your service to connect using a stricter SSL mode, in the
SSLtab checkUse SSLand setSSL modeto the configured mode. Then, in theCA Certificatefield type the location of the SSL root CA certificate.Click
Test Connection. When the connection is successful, clickFinishYour connection is listed in the
Database Navigator.- Create a target Tiger Cloud service with the Real-time analytics capability.
- Download and install qStudio.
- Start qStudio
- Click
Server>Add Server Configure the connection
- For
Server Type, selectPostgres. - For
Connect By, selectHost. - For
Host,Port,Database,Username, andPassword, use your connection details.
- For
Click
TestqStudio indicates whether the connection works.
Click
AddThe server is listed in the
Server Tree.- Create a target Tiger Cloud service with the Real-time analytics capability.
- Set up AWS Transit Gateway.
- Connect your infrastructure to AWS Transit Gateway
Create a Peering VPC in Tiger Cloud Console
- In
Security>VPC, clickCreate a VPC:
- Choose your region and IP range, name your VPC, then click
Create VPC:
Your service and Peering VPC must be in the same AWS region. The number of Peering VPCs you can create in your project depends on your pricing plan. If you need another Peering VPC, either contact support@tigerdata.com or change your plan in Tiger Cloud Console.
Add a peering connection:
- In the
VPC Peeringcolumn, clickAdd. - Provide your AWS account ID, Transit Gateway ID, CIDR ranges, and AWS region. Tiger Cloud creates a new isolated connection for every unique Transit Gateway ID.
- Click
Add connection.
- In the
- In
Accept and configure peering connection in your AWS account
Accept the peering request coming from Tiger Cloud. The request can take up to 5 min to arrive. Within 5 more minutes after accepting, the peering should appear as
Connectedin Tiger Cloud Console.Configure at least the following in your AWS account networking:
- Your subnet route table to route traffic to your Transit Gateway for the Peering VPC CIDRs.
- Your Transit Gateway route table to route traffic to the newly created Transit Gateway peering attachment for the Peering VPC CIDRs.
- Security groups to allow outbound TCP 5432.
Attach a Tiger Cloud service to the Peering VPC In Tiger Cloud Console
- Select the service you want to connect to the Peering VPC.
- Click
Operations>Security>VPC. - Select the VPC, then click
Attach VPC.
- Sync or stream directly, so data from another source is continuously updated in your service.
- Import individual files using Tiger Cloud Console or the command line.
- Migrate data from other databases.
- The bulk of the (on-disk) data is in time-series tables.
- Writes by the application do not reference historical time-series data.
- Writes to time-series data are append-only.
- No
UPDATEorDELETEqueries will be run on time-series data in the source database during the migration process (or if they are, it happens in a controlled manner, such that it's possible to either ignore, or re-backfill). - Either the relational (non-time-series) data is small enough to be copied from source to target in an acceptable amount of time for this to be done with downtime, or the relational data can be copied asynchronously while the application continues to run (that is, changes relatively infrequently).
- Create a target Tiger Cloud service.
- To ensure that maintenance does not run while migration is in progress, best practice is to adjust the maintenance window.
- Create and connect to a Tiger Cloud service: choose the capabilities that match your business and engineering needs on Tiger Data's cloud-based Postgres platform.
- Try the main features in Tiger Data products: rapidly implement the features in Tiger Cloud that enable you to ingest and query data faster while keeping the costs low.
- Start coding with Tiger Data: quickly integrate Tiger Cloud and TimescaleDB into your apps using your favorite programming language.
- Run queries from Tiger Cloud Console: securely interact with your data in the Tiger Cloud Console UI.
- Access organizational knowledge from Slack, GitHub, Linear, and other data sources
- Understand context using advanced vector search and embeddings across large datasets
- Execute tasks, generate reports, and interact with your Tiger Cloud services through natural language
- Scale reliably with enterprise-grade performance for concurrent conversations
- Get instant access to company knowledge from Slack, GitHub, and Linear
- Process data in real-time as conversations and updates happen
- Store data efficiently with time-series partitioning and compression
- Deploy quickly with Docker and an interactive setup wizard
- Durable event handling with Postgres-backed processing
- Horizontal scalability across multiple Tiger Agent instances
- Flexibility to choose AI models and customize prompts
- Integration with specialized data sources through MCP servers
- Complete observability and monitoring with Logfire
- Work with Claude Code, Cursor, VS Code, and other editors
- Manage services and optimize queries through natural language
- Access comprehensive Tiger Data documentation during development
- Use secure authentication and access control
Semantic search: transcend the limitations of traditional keyword-driven search methods by creating systems that understand the intent and contextual meaning of a query, thereby returning more relevant results. Semantic search doesn't just seek exact word matches; it grasps the deeper intent behind a user's query. The result? Even if search terms differ in phrasing, relevant results are surfaced. Taking advantage of hybrid search, which marries lexical and semantic search methodologies, offers users a search experience that's both rich and accurate. It's not just about finding direct matches anymore; it's about tapping into contextually and conceptually similar content to meet user needs.
Recommendation systems: imagine a user who has shown interest in several articles on a singular topic. With embeddings, the recommendation engine can delve deep into the semantic essence of those articles, surfacing other database items that resonate with the same theme. Recommendations, thus, move beyond just the superficial layers like tags or categories and dive into the very heart of the content.
Retrieval augmented generation (RAG): supercharge generative AI by providing additional context to Large Language Models (LLMs) like OpenAI's GPT-4, Anthropic's Claude 2, and open source modes like Llama 2. When a user poses a query, relevant database content is fetched and used to supplement the query as additional information for the LLM. This helps reduce LLM hallucinations, as it ensures the model's output is more grounded in specific and relevant information, even if it wasn't part of the model's original training data.
Clustering: embeddings also offer a robust solution for clustering data. Transforming data into these vectorized forms allows for nuanced comparisons between data points in a high-dimensional space. Through algorithms like K-means or hierarchical clustering, data can be categorized into semantic categories, offering insights that surface-level attributes might miss. This surfaces inherent data patterns, enriching both exploration and decision-making processes.
- First, embeddings are created for data and inserted into the database. This can take place either in an application or in the database itself.
- Second, when a user has a search query (for example, a question in chat), that query is then transformed into an embedding.
- Third, the database takes the query embedding and searches for the closest matching (most similar) embeddings it has stored.
- OpenAI embedding models: text-embedding-ada-002 is OpenAI's recommended embedding generation model.
- Cohere representation models: Cohere offers many models that can be used to generate embeddings from text in English or multiple languages.
- OpenAI CLIP: Useful for applications involving text and images.
- VGG
- Vision Transformer (ViT)
- Signed up for a free Tiger Data account.
- Downloaded the file that contains your Tiger Cloud service credentials such as
<HOST>,<PORT>, and<PASSWORD>. Alternatively, you can find these details in theConnection Infosection for your service. - Installed Python 3
- Signed up for Twelve Data. The free tier is perfect for this tutorial.
- Made a note of your Twelve Data API key.
Create and activate a Python virtual environment:
virtualenv env source env/bin/activateInstall the Twelve Data Python wrapper library with websocket support. This library allows you to make requests to the API and maintain a stable websocket connection.
pip install twelvedata websocket-clientInstall Psycopg2 so that you can connect the TimescaleDB from your Python script:
pip install psycopg2-binaryon_eventThis argument needs to be a function that is invoked whenever there's a new data record is received from the websocket:
def on_event(event): print(event) # prints out the data record (dictionary)This is where you want to implement the ingestion logic so whenever there's new data available you insert it into the database.
symbolsThis argument needs to be a list of stock ticker symbols (for example,
MSFT) or crypto trading pairs (for example,BTC/USD). When using a websocket connection you always need to subscribe to the events you want to receive. You can do this by using thesymbolsargument or if your connection is already created you can also use thesubscribe()function to get data for additional symbols.Create a new Python file called
websocket_test.pyand connect to the Twelve Data servers using the<YOUR_API_KEY>:import time from twelvedata import TDClient messages_history = [] def on_event(event): print(event) # prints out the data record (dictionary) messages_history.append(event) td = TDClient(apikey="<YOUR_API_KEY>") ws = td.websocket(symbols=["BTC/USD", "ETH/USD"], on_event=on_event) ws.subscribe(['ETH/BTC', 'AAPL']) ws.connect() while True: print('messages received: ', len(messages_history)) ws.heartbeat() time.sleep(10)Run the Python script:
python websocket_test.pyWhen you run the script, you receive a response from the server about the status of your connection:
{'event': 'subscribe-status', 'status': 'ok', 'success': [ {'symbol': 'BTC/USD', 'exchange': 'Coinbase Pro', 'mic_code': 'Coinbase Pro', 'country': '', 'type': 'Digital Currency'}, {'symbol': 'ETH/USD', 'exchange': 'Huobi', 'mic_code': 'Huobi', 'country': '', 'type': 'Digital Currency'} ], 'fails': None }When you have established a connection to the websocket server, wait a few seconds, and you can see data records, like this:
{'event': 'price', 'symbol': 'BTC/USD', 'currency_base': 'Bitcoin', 'currency_quote': 'US Dollar', 'exchange': 'Coinbase Pro', 'type': 'Digital Currency', 'timestamp': 1652438893, 'price': 30361.2, 'bid': 30361.2, 'ask': 30361.2, 'day_volume': 49153} {'event': 'price', 'symbol': 'BTC/USD', 'currency_base': 'Bitcoin', 'currency_quote': 'US Dollar', 'exchange': 'Coinbase Pro', 'type': 'Digital Currency', 'timestamp': 1652438896, 'price': 30380.6, 'bid': 30380.6, 'ask': 30380.6, 'day_volume': 49157} {'event': 'heartbeat', 'status': 'ok'} {'event': 'price', 'symbol': 'ETH/USD', 'currency_base': 'Ethereum', 'currency_quote': 'US Dollar', 'exchange': 'Huobi', 'type': 'Digital Currency', 'timestamp': 1652438899, 'price': 2089.07, 'bid': 2089.02, 'ask': 2089.03, 'day_volume': 193818} {'event': 'price', 'symbol': 'BTC/USD', 'currency_base': 'Bitcoin', 'currency_quote': 'US Dollar', 'exchange': 'Coinbase Pro', 'type': 'Digital Currency', 'timestamp': 1652438900, 'price': 30346.0, 'bid': 30346.0, 'ask': 30346.0, 'day_volume': 49167}Each price event gives you multiple data points about the given trading pair such as the name of the exchange, and the current price. You can also occasionally see
heartbeatevents in the response; these events signal the health of the connection over time. At this point the websocket connection is working successfully to pass data.- Row-based storage for recent data: the most recent chunk (and possibly more) is always stored in the rowstore, ensuring fast inserts, updates, and low-latency single record queries. Additionally, row-based storage is used as a writethrough for inserts and updates to columnar storage.
- Columnar storage for analytical performance: chunks are automatically compressed into the columnstore, optimizing storage efficiency and accelerating analytical queries.
- Connect to your Tiger Cloud service
Create a hypertable to store the real-time stock data
CREATE TABLE stocks_real_time ( time TIMESTAMPTZ NOT NULL, symbol TEXT NOT NULL, price DOUBLE PRECISION NULL, day_volume INT NULL ) WITH ( tsdb.hypertable, tsdb.partition_column='time' );Create an index to support efficient queries
Index on the
symbolandtimecolumns:CREATE INDEX ix_symbol_time ON stocks_real_time (symbol, time DESC);Add a table to store the company data
CREATE TABLE company ( symbol TEXT NOT NULL, name TEXT NOT NULL );- Check if the item is a data item, and not websocket metadata.
- Adjust the data so that it fits the database schema, including the data types, and order of columns.
- Add it to the in-memory batch, which is a list in Python.
- If the batch reaches a certain size, insert the data, and reset or empty the list.
Update the Python script that prints out the current batch size, so you can follow when data gets ingested from memory into your database. Use the
<HOST>,<PASSWORD>, and<PORT>details for the Tiger Cloud service where you want to ingest the data and your API key from Twelve Data:import time import psycopg2 from twelvedata import TDClient from psycopg2.extras import execute_values from datetime import datetime class WebsocketPipeline(): DB_TABLE = "stocks_real_time" DB_COLUMNS=["time", "symbol", "price", "day_volume"] MAX_BATCH_SIZE=100 def __init__(self, conn): """Connect to the Twelve Data web socket server and stream data into the database. Args: conn: psycopg2 connection object """ self.conn = conn self.current_batch = [] self.insert_counter = 0 def _insert_values(self, data): if self.conn is not None: cursor = self.conn.cursor() sql = f""" INSERT INTO {self.DB_TABLE} ({','.join(self.DB_COLUMNS)}) VALUES %s;""" execute_values(cursor, sql, data) self.conn.commit() def _on_event(self, event): """This function gets called whenever there's a new data record coming back from the server. Args: event (dict): data record """ if event["event"] == "price": timestamp = datetime.utcfromtimestamp(event["timestamp"]) data = (timestamp, event["symbol"], event["price"], event.get("day_volume")) self.current_batch.append(data) print(f"Current batch size: {len(self.current_batch)}") if len(self.current_batch) == self.MAX_BATCH_SIZE: self._insert_values(self.current_batch) self.insert_counter += 1 print(f"Batch insert #{self.insert_counter}") self.current_batch = [] def start(self, symbols): """Connect to the web socket server and start streaming real-time data into the database. Args: symbols (list of symbols): List of stock/crypto symbols """ td = TDClient(apikey="<YOUR_API_KEY") ws = td.websocket(on_event=self._on_event) ws.subscribe(symbols) ws.connect() while True: ws.heartbeat() time.sleep(10) onn = psycopg2.connect(database="tsdb", host="<HOST>", user="tsdbadmin", password="<PASSWORD>", port="<PORT>") symbols = ["BTC/USD", "ETH/USD", "MSFT", "AAPL"] websocket = WebsocketPipeline(conn) websocket.start(symbols=symbols) ``` 1. Run the script:bash python websocket_test.py
You can even create separate Python scripts to start multiple websocket connections for different types of symbols, for example, one for stock, and another one for cryptocurrency prices. ### Troubleshooting If you see an error message similar to this:bash
- If your migration path dictates it, upgrade Postgres
If your migration path dictates it, upgrade TimescaleDB again
psql -X -d source -c "ALTER EXTENSION timescaledb UPDATE TO '<version number>';"Check that you have upgraded to the correct version of TimescaleDB
psql -X -d source -c "\dx timescaledb;"Find the mount type used by your Docker container:
docker inspect timescaledb --format='{{range .Mounts }}{{.Type}}{{end}}'This returns either
volumeorbind.Note the volume or bind used by your container:
docker inspect timescaledb --format='{{range .Mounts }}{{.Name}}{{end}}'Docker returns the
<volume ID>. You see something like this:069ba64815f0c26783b81a5f0ca813227fde8491f429cf77ed9a5ae3536c0b2cdocker inspect timescaledb --format='{{range .Mounts }}{{.Source}}{{end}}'Docker returns the
<bind path>. You see something like this:/path/to/dataYou use this value when you perform the upgrade.
Pull the latest TimescaleDB image
This command pulls the latest version of TimescaleDB running on Postgres 17:
docker pull timescale/timescaledb-ha:pg17If you're using another version of Postgres, look for the relevant tag in the TimescaleDB HA repository on Docker Hub.
Stop the old container, and remove it
docker stop timescaledb docker rm timescaledbLaunch a new container with the upgraded Docker image
Connect to the upgraded instance using
psqlwith the-Xflagdocker exec -it timescaledb psql -U postgres -XAt the psql prompt, use the
ALTERcommand to upgrade the extensionALTER EXTENSION timescaledb UPDATE; CREATE EXTENSION IF NOT EXISTS timescaledb_toolkit; ALTER EXTENSION timescaledb_toolkit UPDATE;Pull the latest TimescaleDB image
This command pulls the latest version of TimescaleDB running on Postgres 17.
docker pull timescale/timescaledb:latest-pg17If you're using another version of Postgres, look for the relevant tag in the TimescaleDB light repository on Docker Hub.
Stop the old container, and remove it
docker stop timescaledb docker rm timescaledbLaunch a new container with the upgraded Docker image
Connect to the upgraded instance using
psqlwith the-Xflagdocker exec -it timescaledb psql -U postgres -XAt the psql prompt, use the
ALTERcommand to upgrade the extensionALTER EXTENSION timescaledb UPDATE;- Install the Postgres client tools on your migration machine. This includes
psql, andpg_dump. - Read the release notes for the version of TimescaleDB that you are upgrading to.
- Perform a backup of your database. While TimescaleDB upgrades are performed in-place, upgrading is an intrusive operation. Always make sure you have a backup on hand, and that the backup is readable in the case of disaster.
- Set your connection string
Retrieve the version of Postgres that you are running
psql -X -d source -c "SELECT version();"Postgres returns something like:
----------------------------------------------------------------------------------------------------------------------------------------- PostgreSQL 17.2 (Ubuntu 17.2-1.pgdg22.04+1) on aarch64-unknown-linux-gnu, compiled by gcc (Ubuntu 11.4.0-1ubuntu1~22.04) 11.4.0, 64-bit (1 row)Retrieve the version of TimescaleDB that you are running
psql -X -d source -c "\dx timescaledb;"Postgres returns something like:
Name | Version | Schema | Description -------------+---------+------------+--------------------------------------------------------------------- timescaledb | 2.17.2 | public | Enables scalable inserts and complex queries for time-series data (1 row)- Upgrade TimescaleDB to 2.10
- Upgrade Postgres to 15
- Upgrade TimescaleDB to 2.17.2.
- Set your connection string
Connect to your Postgres deployment
psql -d sourceSave your policy statistics settings to a
.csvfileCOPY (SELECT * FROM timescaledb_information.policy_stats) TO policy_stats.csv csv headerSave your continuous aggregates settings to a
.csvfileCOPY (SELECT * FROM timescaledb_information.continuous_aggregate_stats) TO continuous_aggregate_stats.csv csv headerSave your drop chunk policies to a
.csvfileCOPY (SELECT * FROM timescaledb_information.drop_chunks_policies) TO drop_chunk_policies.csv csv headerSave your reorder policies to a
.csvfileCOPY (SELECT * FROM timescaledb_information.reorder_policies) TO reorder_policies.csv csv headerExit your psql session
\q;Upgrade TimescaleDB
psql -X -d source -c "ALTER EXTENSION timescaledb UPDATE TO '<version number>';"If your migration path dictates it, upgrade Postgres
If your migration path dictates it, upgrade TimescaleDB again
psql -X -d source -c "ALTER EXTENSION timescaledb UPDATE TO '<version number>';"Check that you have upgraded to the correct version of TimescaleDB
psql -X -d source -c "\dx timescaledb;"Verify the continuous aggregate policy jobs
SELECT * FROM timescaledb_information.jobs WHERE application_name LIKE 'Refresh Continuous%';Postgres returns something like:
-[ RECORD 1 ]-----+-------------------------------------------------- job_id | 1001 application_name | Refresh Continuous Aggregate Policy [1001] schedule_interval | 01:00:00 max_runtime | 00:00:00 max_retries | -1 retry_period | 01:00:00 proc_schema | _timescaledb_internal proc_name | policy_refresh_continuous_aggregate owner | postgres scheduled | t config | {"start_offset": "20 days", "end_offset": "10 days", "mat_hypertable_id": 2} next_start | 2020-10-02 12:38:07.014042-04 hypertable_schema | _timescaledb_internal hypertable_name | _materialized_hypertable_2Verify the information for each policy type that you exported before you upgraded.
Verify that all jobs are scheduled and running as expected
SELECT * FROM timescaledb_information.job_stats WHERE job_id = 1001;Postgres returns something like:
-[ RECORD 1 ]----------+------------------------------ hypertable_schema | _timescaledb_internal hypertable_name | _materialized_hypertable_2 job_id | 1001 last_run_started_at | 2020-10-02 09:38:06.871953-04 last_successful_finish | 2020-10-02 09:38:06.932675-04 last_run_status | Success job_status | Scheduled last_run_duration | 00:00:00.060722 next_scheduled_run | 2020-10-02 10:38:06.932675-04 total_runs | 1 total_successes | 1 total_failures | 0- A Postgres instance to act as an access node (AN)
- One or more Postgres instances to act as data nodes (DN)
- TimescaleDB installed and set up on all nodes
- Access to a superuser role, such as
postgres, on all nodes On the access node (AN), run this command and provide the hostname of the first data node (DN1) you want to add:
SELECT add_data_node('dn1', 'dn1.example.com')Repeat for all other data nodes:
SELECT add_data_node('dn2', 'dn2.example.com') SELECT add_data_node('dn3', 'dn3.example.com')On the access node, create the distributed hypertable with your chosen partitioning. In this example, the distributed hypertable is called
example, and it is partitioned ontimeandlocation:SELECT create_distributed_hypertable('example', 'time', 'location');Insert some data into the hypertable. For example:
INSERT INTO example VALUES ('2020-12-14 13:45', 1, '1.2.3.4');- Trust authentication. This is the simplest approach, but also the least secure. This is a good way to start if you are trying out multi-node, but is not recommended for production clusters.
- Pasword authentication. Every user role requires an internal password for establishing connections between the access node and the data nodes. This method is easier to set up than certificate authentication, but provides only a basic level of protection.
- Certificate authentication. Every user role requires a certificate from a certificate authority to establish connections between the access node and the data nodes. This method is more complex to set up than password authentication, but more secure and easier to automate.
Connect to the access node with
psql, and locate thepg_hba.conffile:SHOW hba_file;Open the
pg_hba.conffile in your preferred text editor, and add this line. In this example, the access node is located at IP192.0.2.20with a mask length of32. You can add one of these two lines:host all all 192.0.2.20/32 trust host all all 192.0.2.20 255.255.255.255 trust 1. At the command prompt, reload the server configuration:bash pg_ctl reload
On some operating systems, you might need to use the `pg_ctlcluster` command instead. 1. If you have not already done so, add the data nodes to the access node. For instructions, see the [multi-node setup][multi-node-setup] section. 1. On the access node, create the trust role. In this example, we call the role `testrole`:sql CREATE ROLE testrole;
**OPTIONAL**: If external clients need to connect to the access node as `testrole`, add the `LOGIN` option when you create the role. You can also add the `PASSWORD` option if you want to require external clients to enter a password. 1. Allow the trust role to access the foreign server objects for the data nodes. Make sure you include all the data node names:sql GRANT USAGE ON FOREIGN SERVER , , ... TO testrole;
1. On the access node, use the [`distributed_exec`][distributed_exec] command to add the role to all the data nodes:sql CALL distributed_exec($$ CREATE ROLE testrole LOGIN $$);
Make sure you create the role with the `LOGIN` privilege on the data nodes, even if you don't use this privilege on the access node. For all other privileges, ensure they are same on the access node and the data nodes. ## Password authentication Password authentication requires every user role to know a password before it can establish a connection between the access node and the data nodes. This internal password is only used by the access node and it does not need to be the same password as the client uses to connect to the access node. External users do not need to share the internal password at all, it can be set up and administered by the database administrator. The access node stores the internal password so that it can verify the correct password has been provided by a data node. We recommend that you store the password on the access node in a local password file, and this section shows you how to set this up. However, if it works better in your environment, you can use [user mappings][user-mapping] to store your passwords instead. This is slightly less secure than a local pasword file, because it requires one mapping for each data node in your cluster. This section sets up your password authentication using SCRAM SHA-256 password authentication. For other password authentication methods, see the [Postgres authentication documentation][auth-password]. Before you start, check that you can use the `postgres` username to log in to your access node. ### Setting up password authentication 1. On the access node, open the `postgresql.conf` configuration file, and add or edit this line:txt password_encryption = 'scram-sha-256' # md5 or scram-sha-256
1. Repeat for each of the data nodes. 1. On each of the data nodes, at the `psql` prompt, locate the `pg_hba.conf` configuration file:sql SHOW hba_file
1. On each of the data nodes, open the `pg_hba.conf` configuration file, and add or edit this line to enable encrypted authentication to the access node:txt host all all 192.0.2.20 scram-sha-256 #where '192.0.2.20' is the access node IP
1. On the access node, open or create the password file at `data/passfile`. This file stores the passwords for each role that the access node connects to on the data nodes. If you need to change the location of the password file, adjust the `timescaledb.passfile` setting in the `postgresql.conf` configuration file. 1. On the access node, open the `passfile` file, and add a line like this for each user, starting with the `postgres` user:bash ::*:postgres:xyzzy #assuming 'xyzzy' is the password for the 'postgres' user
1. On the access node, at the command prompt, change the permissions of the `passfile` file:bash chmod 0600 passfile
1. On the access node, and on each of the data nodes, reload the server configuration to pick up the changes:bash pg_ctl reload
1. If you have not already done so, add the data nodes to the access node. For instructions, see the [multi-node setup][multi-node-setup] section. 1. On the access node, at the `psql` prompt, create additional roles, and grant them access to foreign server objects for the data nodes:sql CREATE ROLE testrole PASSWORD 'clientpass' LOGIN; GRANT USAGE ON FOREIGN SERVER , , ... TO testrole;
The `clientpass` password is used by external clients to connect to the access node as user `testrole`. If the access node is configured to accept other authentication methods, or the role is not a login role, then you might not need to do this step. 1. On the access node, add the new role to each of the data nodes with [`distributed_exec`][distributed_exec]. Make sure you add the `PASSWORD` parameter to specify a different password to use when connecting to the data nodes with role `testrole`:sql CALL distributed_exec($$ CREATE ROLE testrole PASSWORD 'internalpass' LOGIN $$);
1. On the access node, add the new role to the `passfile` you created earlier, by adding this line:bash ::*:testrole:internalpass #assuming 'internalpass' is the password used to connect to data nodes
Any user passwords that you created before you set up password authentication need to be re-created so that they use the new encryption method. ## Certificate authentication This method is a bit more complex to set up than password authentication, but it is more secure, easier to automate, and can be customized to your security environment. To use certificates, the access node and each data node need three files: * The root CA certificate, called `root.crt`. This certificate serves as the root of trust in the system. It is used to verify the other certificates. * A node certificate, called `server.crt`. This certificate provides the node with a trusted identity in the system. * A node certificate key, called `server.key`. This provides proof of ownership of the node certificate. Make sure you keep this file private on the node where it is generated. You can purchase certificates from a commercial certificate authority (CA), or generate your own self-signed CA. This section shows you how to use your access node certificate to create and sign new user certificates for the data nodes. Keys and certificates serve different purposes on the data nodes and access node. For the access node, a signed certificate is used to verify user certificates for access. For the data nodes, a signed certificate authenticates the node to the access node. ### Generating a self-signed root certificate for the access node 1. On the access node, at the command prompt, generate a private key called `auth.key`:bash openssl genpkey -algorithm rsa -out auth.key
1. Generate a self-signed root certificate for the certificate authority (CA), called `root.cert`:bash openssl req -new -key auth.key -days 3650 -out root.crt -x509
1. Complete the questions asked by the script to create your root certificate. Type your responses in, press `enter` to accept the default value shown in brackets, or type `.` to leave the field blank. For example:txt Country Name (2 letter code) [AU]:US State or Province Name (full name) [Some-State]:New York Locality Name (eg, city) []:New York Organization Name (eg, company) [Internet Widgets Pty Ltd]:Example Company Pty Ltd Organizational Unit Name (eg, section) []: Common Name (e.g. server FQDN or YOUR name) []:http://cert.example.com/ Email Address []:
When you have created the root certificate on the access node, you can generate certificates and keys for each of the data nodes. To do this, you need to create a certificate signing request (CSR) for each data node. The default names for the key is `server.key`, and for the certificate is `server.crt`. They are stored in together, in the `data` directory on the data node instance. The default name for the CSR is `server.csr` and you need to sign it using the root certificate you created on the access node. ### Generating keys and certificates for data nodes 1. On the access node, generate a certificate signing request (CSR) called `server.csr`, and create a new key called `server.key`:bash openssl req -out server.csr -new -newkey rsa:2048 -nodes \ -keyout server.key
1. Sign the CSR using the root certificate CA you created earlier, called `auth.key`:bash openssl ca -extensions v3_intermediate_ca -days 3650 -notext \ -md sha256 -in server.csr -out server.crt
1. Move the `server.crt` and `server.key` files from the access node, on to each data node, in the `data` directory. Depending on your network setup, you might need to use portable media. 1. Copy the root certificate file `root.crt` from the access node, on to each data node, in the `data` directory. Depending on your network setup, you might need to use portable media. When you have created the certificates and keys, and moved all the files into the right places on the data nodes, you can configure the data nodes to use SSL authentication. ### Configuring data nodes to use SSL authentication 1. On each data node, open the `postgresql.conf` configuration file and add or edit the SSL settings to enable certificate authentication:txt ssl = on ssl_ca_file = 'root.crt' ssl_cert_file = 'server.crt' ssl_key_file = 'server.key'
1. [](#)If you want the access node to use certificate authentication for login, make these changes on the access node as well. 1. On each data node, open the `pg_hba.conf` configuration file, and add or edit this line to allow any SSL user log in with client certificate authentication:txt hostssl all all all cert clientcert=1
If you are using the default names for your certificate and key, you do not need to explicitly set them. The configuration looks for `server.crt` and `server.key` by default. If you use different names for your certificate and key, make sure you specify the correct names in the `postgresql.conf` configuration file. When your data nodes are configured to use SSL certificate authentication, you need to create a signed certificate and key for your access node. This allows the access node to log in to the data nodes. ### Creating certificates and keys for the access node 1. On the access node, as the `postgres` user, compute a base name for the certificate files using [md5sum][], generate a subject identifier, and create names for the key and certificate files:bash pguser=postgres base=
echo -n $pguser | md5sum | cut -c1-32subj="/C=US/ST=New York/L=New York/O=Timescale/OU=Engineering/CN=$pguser" key_file="timescaledb/certs/$base.key" crt_file="timescaledb/certs/$base.crt"1. Generate a new random user key:bash openssl genpkey -algorithm RSA -out "$key_file"
1. Generate a certificate signing request (CSR). This file is temporary, stored in the `data` directory, and is deleted later on:bash openssl req -new -sha256 -key $key_file -out "$base.csr" -subj "$subj"
1. Sign the CSR with the access node key:bash openssl ca -batch -keyfile server.key -extensions v3_intermediate_ca \ -days 3650 -notext -md sha256 -in "$base.csr" -out "$crt_file" rm $base.csr
1. Append the node certificate to the user certificate. This completes the certificate verification chain and makes sure that all certificates are available on the data node, up to the trusted certificate stored in `root.crt`:bash cat >>$crt_file <server.crt
By default, the user key files and certificates are stored on the access node in the `data` directory, under `timescaledb/certs`. You can change this location using the `timescaledb.ssl_dir` configuration variable. Your data nodes are now set up to accept certificate authentication, the data and access nodes have keys, and the `postgres` user has a certificate. If you have not already done so, add the data nodes to the access node. For instructions, see the [multi-node setup][multi-node-setup] section. The final step is add additional user roles. ### Setting up additional user roles 1. On the access node, at the `psql` prompt, create the new user and grant permissions:sql CREATE ROLE testrole; GRANT USAGE ON FOREIGN SERVER , , ... TO testrole;
If you need external clients to connect to the access node as `testrole`, make sure you also add the `LOGIN` option. You can also enable password authentication by adding the `PASSWORD` option. 1. On the access node, use the [`distributed_exec`][distributed_exec] command to add the role to all the data nodes:sql CALL distributed_exec($$ CREATE ROLE testrole LOGIN $$);
===== PAGE: https://docs.tigerdata.com/self-hosted/multinode-timescaledb/multinode-grow-shrink/ ===== # Grow and shrink multi-node [Multi-node support is sunsetted][multi-node-deprecation]. TimescaleDB v2.13 is the last release that includes multi-node support for Postgres versions 13, 14, and 15. When you are working within a multi-node environment, you might discover that you need more or fewer data nodes in your cluster over time. You can choose how many of the available nodes to use when creating a distributed hypertable. You can also add and remove data nodes from your cluster, and move data between chunks on data nodes as required to free up storage. ## See which data nodes are in use You can check which data nodes are in use by a distributed hypertable, using this query. In this example, our distributed hypertable is called `conditions`:sql
SELECT hypertable_name, data_nodes FROM timescaledb_information.hypertables WHERE hypertable_name = 'conditions';
The result of this query looks like this:sql hypertable_name | data_nodes -----------------+--------------------------------------- conditions | {data_node_1,data_node_2,data_node_3}
## Choose how many nodes to use for a distributed hypertable By default, when you create a distributed hypertable, it uses all available data nodes. To restrict it to specific nodes, pass the `data_nodes` argument to [`create_distributed_hypertable`][create_distributed_hypertable]. ## Attach a new data node When you add additional data nodes to a database, you need to add them to the distributed hypertable so that your database can use them. ### Attaching a new data node to a distributed hypertable 1. On the access node, at the `psql` prompt, add the data node: ```sql SELECT add_data_node('node3', host => 'dn3.example.com'); ``` 1. Attach the new data node to the distributed hypertable: ```sql SELECT attach_data_node('node3', hypertable => 'hypertable_name'); ``` When you attach a new data node, the partitioning configuration of the distributed hypertable is updated to account for the additional data node, and the number of hash partitions are automatically increased to match. You can prevent this happening by setting the function parameter `repartition` to `FALSE`. ## Move data between chunks Experimental When you attach a new data node to a distributed hypertable, you can move existing data in your hypertable to the new node to free up storage on the existing nodes and make better use of the added capacity. The ability to move chunks between data nodes is an experimental feature that is under active development. We recommend that you do not use this feature in a production environment. Move data using this query:sql CALL timescaledb_experimental.move_chunk('_timescaledb_internal._dist_hyper_1_1_chunk', 'data_node_3', 'data_node_2');
The move operation uses a number of transactions, which means that you cannot roll the transaction back automatically if something goes wrong. If a move operation fails, the failure is logged with an operation ID that you can use to clean up any state left on the involved nodes. Clean up after a failed move using this query. In this example, the operation ID of the failed move is `ts_copy_1_31`:sql CALL timescaledb_experimental.cleanup_copy_chunk_operation('ts_copy_1_31');
## Remove a data node You can also remove data nodes from an existing distributed hypertable. You cannot remove a data node that still contains data for the distributed hypertable. Before you remove the data node, check that is has had all of its data deleted or moved, or that you have replicated the data on to other data nodes. Remove a data node using this query. In this example, our distributed hypertable is called `conditions`:sql SELECT detach_data_node('node1', hypertable => 'conditions');
===== PAGE: https://docs.tigerdata.com/self-hosted/multinode-timescaledb/multinode-administration/ ===== # Multi-node administration [Multi-node support is sunsetted][multi-node-deprecation]. TimescaleDB v2.13 is the last release that includes multi-node support for Postgres versions 13, 14, and 15. Multi-node TimescaleDB allows you to administer your cluster directly from the access node. When your environment is set up, you do not need to log directly into the data nodes to administer your database. When you perform an administrative task, such as adding a new column, changing privileges, or adding an index on a distributed hypertable, you can perform the task from the access node and it is applied to all the data nodes. If a command is executed on a regular table, however, the effects of that command are only applied locally on the access node. Similarly, if a command is executed directly on a data node, the result is only visible on that data node. Commands that create or modify schemas, roles, tablespaces, and settings in a distributed database are not automatically distributed either. That is because these objects and settings sometimes need to be different on the access node compared to the data nodes, or even vary among data nodes. For example, the data nodes could have unique CPU, memory, and disk configurations. The node differences make it impossible to assume that a single configuration works for all nodes. Further, some settings need to be different on the publicly accessible access node compared to data nodes, such as having different connection limits. A role might not have the `LOGIN` privilege on the access node, but it needs this privilege on data nodes so that the access node can connect. Roles and tablespaces are also shared across multiple databases on the same instance. Some of these databases might be distributed and some might not be, or be configured with a different set of data nodes. Therefore, it is not possible to know for sure when a role or tablespace should be distributed to a data node given that these commands can be executed from within different databases, that need not be distributed. To administer a multi-node cluster from the access node, you can use the [`distributed_exec`][distributed_exec] function. This function allows full control over creating and configuring, database settings, schemas, roles, and tablespaces across all data nodes. The rest of this section describes in more detail how specific administrative tasks are handled in a multi-node environment. ## Distributed role management In a multi-node environment, you need to manage roles on each Postgres instance independently, because roles are instance-level objects that are shared across both distributed and non-distributed databases that each can be configured with a different set of data nodes or none at all. Therefore, an access node does not automatically distribute roles or role management commands across its data nodes. When a data node is added to a cluster, it is assumed that it already has the proper roles necessary to be consistent with the rest of the nodes. If this is not the case, you might encounter unexpected errors when you try to create or alter objects that depend on a role that is missing or set incorrectly. To help manage roles from the access node, you can use the [`distributed_exec`][distributed_exec] function. This is useful for creating and configuring roles across all data nodes in the current database. ### Creating a distributed role When you create a distributed role, it is important to consider that the same role might require different configuration on the access node compared to the data nodes. For example, a user might require a password to connect to the access node, while certificate authentication is used between nodes within the cluster. You might also want a connection limit for external connections, but allow unlimited internal connections to data nodes. For example, the following user can use a password to make 10 connections to the access node but has no limits connecting to the data nodes:sql CREATE ROLE alice WITH LOGIN PASSWORD 'mypassword' CONNECTION LIMIT 10; CALL distributed_exec($$ CREATE ROLE alice WITH LOGIN CONNECTION LIMIT -1; $$);
For more information about setting up authentication, see the [multi-node authentication section][multi-node-authentication]. Some roles can also be configured without the `LOGIN` attribute on the access node. This allows you to switch to the role locally, but not connect with the user from a remote location. However, to be able to connect from the access node to a data node as that user, the data nodes need to have the role configured with the `LOGIN` attribute enabled. To create a non-login role for a multi-node setup, use these commands:sql CREATE ROLE alice WITHOUT LOGIN; CALL distributed_exec($$ CREATE ROLE alice WITH LOGIN; $$);
To allow a new role to create distributed hypertables it also needs to be granted usage on data nodes, for example:sql GRANT USAGE ON FOREIGN SERVER dn1,dn2,dn3 TO alice;
By granting usage on some data nodes, but not others, you can restrict usage to a subset of data nodes based on the role. ### Alter a distributed role When you alter a distributed role, use the same process as creating roles. The role needs to be altered on the access node and on the data nodes in two separate steps. For example, add the `CREATEROLE` attribute to a role as follows:sql ALTER ROLE alice CREATEROLE; CALL distributed_exec($$ ALTER ROLE alice CREATEROLE; $$);
## Manage distributed databases A distributed database can contain both distributed and non-distributed objects. In general, when a command is issued to alter a distributed object, it applies to all nodes that have that object (or a part of it). However, in some cases settings *should* be different depending on node, because nodes might be provisioned differently (having, for example, varying levels of CPU, memory, and disk capabilities) and the role of the access node is different from a data node's. This section describes how and when commands on distributed objects are applied across all data nodes when executed from within a distributed database. ### Alter a distributed database The [`ALTER DATABASE`][alter-database] command is only applied locally on the access node. This is because database-level configuration often needs to be different across nodes. For example, this is a setting that might differ depending on the CPU capabilities of the node:sql ALTER DATABASE mydatabase SET max_parallel_workers TO 12;
The database names can also differ between nodes, even if the databases are part of the same distributed database. When you rename a data node's database, also make sure to update the configuration of the data node on the access node so that it references the new database name. ### Drop a distributed database When you drop a distributed database on the access node, it does not automatically drop the corresponding databases on the data nodes. In this case, you need to connect directly to each data node and drop the databases locally. A distributed database is not automatically dropped across all nodes, because the information about data nodes lives within the distributed database on the access node, but it is not possible to read it when executing the drop command since it cannot be issued when connected to the database. Additionally, if a data node has permanently failed, you need to be able to drop a database even if one or more data nodes are not responding. It is also good practice to leave the data intact on a data node if possible. For example, you might want to back up a data node even after a database was dropped on the access node. Alternatively, you can delete the data nodes with the `drop_database` option prior to dropping the database on the access node:sql SELECT * FROM delete_data_node('dn1', drop_database => true);
## Create, alter, and drop schemas When you create, alter, or drop schemas, the commands are not automatically applied across all data nodes. A missing schema is, however, created when a distributed hypertable is created, and the schema it belongs to does not exist on a data node. To manually create a schema across all data nodes, use this command:sql CREATE SCHEMA newschema; CALL distributed_exec($$ CREATE SCHEMA newschema $$);
If a schema is created with a particular authorization, then the authorized role must also exist on the data nodes prior to issuing the command. The same things applies to altering the owner of an existing schema. ### Prepare for role removal with DROP OWNED The [`DROP OWNED`][drop-owned] command is used to drop all objects owned by a role and prepare the role for removal. Execute the following commands to prepare a role for removal across all data nodes in a distributed database:sql DROP OWNED BY alice CASCADE; CALL distributed_exec($$ DROP OWNED BY alice CASCADE $$);
Note, however, that the role might still own objects in other databases after these commands have been executed. ### Manage privileges Privileges configured using [`GRANT`][grant] or [`REVOKE`][revoke] statements are applied to all data nodes when they are run on a distributed hypertable. When granting privileges on other objects, the command needs to be manually distributed with [`distributed_exec`][distributed_exec]. #### Set default privileges Default privileges need to be manually modified using [`distributed_exec`][distributed_exec], if they are to apply across all data nodes. The roles and schemas that the default privileges reference need to exist on the data nodes prior to executing the command. New data nodes are assumed to already have any altered default privileges. The default privileges are not automatically applied retrospectively to new data nodes. ## Manage tablespaces Nodes might be configured with different disks, and therefore tablespaces need to be configured manually on each node. In particular, an access node might not have the same storage configuration as data nodes, since it typically does not store a lot of data. Therefore, it is not possible to assume that the same tablespace configuration exists across all nodes in a multi-node cluster. ===== PAGE: https://docs.tigerdata.com/self-hosted/multinode-timescaledb/about-multinode/ ===== # About multi-node [Multi-node support is sunsetted][multi-node-deprecation]. TimescaleDB v2.13 is the last release that includes multi-node support for Postgres versions 13, 14, and 15. If you have a larger petabyte-scale workload, you might need more than one TimescaleDB instance. TimescaleDB multi-node allows you to run and manage a cluster of databases, which can give you faster data ingest, and more responsive and efficient queries for large workloads. In some cases, your queries could be slower in a multi-node cluster due to the extra network communication between the various nodes. Queries perform the best when the query processing is distributed among the nodes and the result set is small relative to the queried dataset. It is important that you understand multi-node architecture before you begin, and plan your database according to your specific requirements. ## Multi-node architecture Multi-node TimescaleDB allows you to tie several databases together into a logical distributed database to combine the processing power of many physical Postgres instances. One of the databases exists on an access node and stores metadata about the other databases. The other databases are located on data nodes and hold the actual data. In theory, a Postgres instance can serve as both an access node and a data node at the same time in different databases. However, it is recommended not to have mixed setups, because it can be complicated, and server instances are often provisioned differently depending on the role they serve. For self-hosted installations, create a server that can act as an access node, then use that access node to create data nodes on other servers. When you have configured multi-node TimescaleDB, the access node coordinates the placement and access of data chunks on the data nodes. In most cases, it is recommend that you use multidimensional partitioning to distribute data across chunks in both time and space dimensions. The figure in this section shows how an access node (AN) partitions data in the same time interval across multiple data nodes (DN1, DN2, and DN3). <img class="main-content__illustration" width={1375} height={944} src="https://assets.timescale.com/docs/images/multi-node-arch.webp" alt="Diagram showing how multi-node access and data nodes interact"/> A database user connects to the access node to issue commands and execute queries, similar to how one connects to a regular single node TimescaleDB instance. In most cases, connecting directly to the data nodes is not necessary. Because TimescaleDB exists as an extension within a specific database, it is possible to have both distributed and non-distributed databases on the same access node. It is also possible to have several distributed databases that use different sets of physical instances as data nodes. In this section, however, it is assumed that you have a single distributed database with a consistent set of data nodes. ## Distributed hypertables If you use a regular table or hypertable on a distributed database, they are not automatically distributed. Regular tables and hypertables continue to work as usual, even when the underlying database is distributed. To enable multi-node capabilities, you need to explicitly create a distributed hypertable on the access node to make use of the data nodes. A distributed hypertable is similar to a regular [hypertable][hypertables], but with the difference that chunks are distributed across data nodes instead of on local storage. By distributing the chunks, the processing power of the data nodes is combined to achieve higher ingest throughput and faster queries. However, the ability to achieve good performance is highly dependent on how the data is partitioned across the data nodes. To achieve good ingest performance, write the data in batches, with each batch containing data that can be distributed across many data nodes. To achieve good query performance, spread the query across many nodes and have a result set that is small relative to the amount of processed data. To achieve this, it is important to consider an appropriate partitioning method. ### Partitioning methods Data that is ingested into a distributed hypertable is spread across the data nodes according to the partitioning method you have chosen. Queries that can be sent from the access node to multiple data nodes and processed simultaneously generally run faster than queries that run on a single data node, so it is important to think about what kind of data you have, and the type of queries you want to run. TimescaleDB multi-node currently supports capabilities that make it best suited for large-volume time-series workloads that are partitioned on `time`, and a space dimension such as `location`. If you usually run wide queries that aggregate data across many locations and devices, choose this partitioning method. For example, a query like this is faster on a database partitioned on `time,location`, because it spreads the work across all the data nodes in parallel:sql SELECT time_bucket('1 hour', time) AS hour, location, avg(temperature) FROM conditions GROUP BY hour, location ORDER BY hour, location LIMIT 100;
Partitioning on `time` and a space dimension such as `location`, is also best if you need faster insert performance. If you partition only on time, and your inserts are generally occuring in time order, then you are always writing to one data node at a time. Partitioning on `time` and `location` means your time-ordered inserts are spread across multiple data nodes, which can lead to better performance. If you mostly run deep time queries on a single location, you might see better performance by partitioning solely on the `time` dimension, or on a space dimension other than `location`. For example, a query like this is faster on a database partitioned on `time` only, because the data for a single location is spread across all the data nodes, rather than being on a single one:sql SELECT time_bucket('1 hour', time) AS hour, avg(temperature) FROM conditions WHERE location = 'office_1' GROUP BY hour ORDER BY hour LIMIT 100;
### Transactions and consistency model Transactions that occur on distributed hypertables are atomic, just like those on regular hypertables. This means that a distributed transaction that involves multiple data nodes is guaranteed to either succeed on all nodes or on none of them. This guarantee is provided by the [two-phase commit protocol][2pc], which is used to implement distributed transactions in TimescaleDB. However, the read consistency of a distributed hypertable is different to a regular hypertable. Because a distributed transaction is a set of individual transactions across multiple nodes, each node can commit its local transaction at a slightly different time due to network transmission delays or other small fluctuations. As a consequence, the access node cannot guarantee a fully consistent snapshot of the data across all data nodes. For example, a distributed read transaction might start when another concurrent write transaction is in its commit phase and has committed on some data nodes but not others. The read transaction can therefore use a snapshot on one node that includes the other transaction's modifications, while the snapshot on another data node might not include them. If you need stronger read consistency in a distributed transaction, then you can use consistent snapshots across all data nodes. However, this requires a lot of coordination and management, which can negatively effect performance, and it is therefore not implemented by default for distributed hypertables. ## Using continuous aggregates in a multi-node environment If you are using self-hosted TimescaleDB in a multi-node environment, there are some additional considerations for continuous aggregates. When you create a continuous aggregate within a multi-node environment, the continuous aggregate should be created on the access node. While it is possible to create a continuous aggregate on data nodes, it interferes with the continuous aggregates on the access node and can cause problems. When you refresh a continuous aggregate on an access node, it computes a single window to update the time buckets. This could slow down your query if the actual number of rows that were updated is small, but widely spread apart. This is aggravated if the network latency is high if, for example, you have remote data nodes. Invalidation logs are on kept on the data nodes, which is designed to limit the amount of data that needs to be transferred. However, some statements send invalidations directly to the log, for example, when dropping a chunk or truncate a hypertable. This action could slow down performance, in comparison to a local update. Additionally, if you have infrequent refreshes but a lot of changes to the hypertable, the invalidation logs could get very large, which could cause performance issues. Make sure you are maintaining your invalidation log size to avoid this, for example, by refreshing the continuous aggregate frequently. For more information about setting up multi-node, see the [multi-node section][multi-node] ===== PAGE: https://docs.tigerdata.com/self-hosted/multinode-timescaledb/multinode-config/ ===== # Multi-node configuration [Multi-node support is sunsetted][multi-node-deprecation]. TimescaleDB v2.13 is the last release that includes multi-node support for Postgres versions 13, 14, and 15. In addition to the [regular TimescaleDB configuration][timescaledb-configuration], it is recommended that you also configure additional settings specific to multi-node operation. ## Update settings Each of these settings can be configured in the `postgresql.conf` file on the individual node. The `postgresql.conf` file is usually in the `data` directory, but you can locate the correct path by connecting to the node with `psql` and giving this command:sql SHOW config_file;
After you have modified the `postgresql.conf` file, reload the configuration to see your changes:bash pg_ctl reload
<!--these need a better structure --LKB 2021-10-20--> ### `max_prepared_transactions` If not already set, ensure that `max_prepared_transactions` is a non-zero value on all data nodes is set to `150` as a starting point. ### `enable_partitionwise_aggregate` On the access node, set the `enable_partitionwise_aggregate` parameter to `on`. This ensures that queries are pushed down to the data nodes, and improves query performance. ### `jit` On the access node, set `jit` to `off`. Currently, JIT does not work well with distributed queries. However, you can enable JIT on the data nodes successfully. ### `statement_timeout` On the data nodes, disable `statement_timeout`. If you need to enable this, enable and configure it on the access node only. This setting is disabled by default in Postgres, but can be useful if your specific environment is suited. ### `wal_level` On the data nodes, set the `wal_level` to `logical` or higher to [move][move_chunk] or [copy][copy_chunk] chunks between data nodes. If you are moving many chunks in parallel, consider increasing `max_wal_senders` and `max_replication_slots` as well. ### Transaction isolation level For consistency, if the transaction isolation level is set to `READ COMMITTED` it is automatically upgraded to `REPEATABLE READ` whenever a distributed operation occurs. If the isolation level is `SERIALIZABLE`, it is not changed. ===== PAGE: https://docs.tigerdata.com/self-hosted/multinode-timescaledb/multinode-maintenance/ ===== # Multi-node maintenance tasks [Multi-node support is sunsetted][multi-node-deprecation]. TimescaleDB v2.13 is the last release that includes multi-node support for Postgres versions 13, 14, and 15. Various maintenance activities need to be carried out for effective upkeep of the distributed multi-node setup. You can use `cron` or another scheduling system outside the database to run these below maintenance jobs on a regular schedule if you prefer. Also make sure that the jobs are scheduled separately for each database that contains distributed hypertables. ## Maintaining distributed transactions A distributed transaction runs across multiple data nodes, and can remain in a non-completed state if a data node reboots or experiences temporary issues. The access node keeps a log of distributed transactions so that nodes that haven't completed their part of the distributed transaction can complete it later when they become available. This transaction log requires regular cleanup to remove transactions that have completed, and complete those that haven't. We highly recommended that you configure the access node to run a maintenance job that regularly cleans up any unfinished distributed transactions. For example: = 2.12">sql CREATE OR REPLACE PROCEDURE data_node_maintenance(job_id int, config jsonb) LANGUAGE SQL AS $$
SELECT _timescaledb_functions.remote_txn_heal_data_node(fs.oid) FROM pg_foreign_server fs, pg_foreign_data_wrapper fdw WHERE fs.srvfdw = fdw.oid AND fdw.fdwname = 'timescaledb_fdw';$$;
SELECT add_job('data_node_maintenance', '5m');
sql CREATE OR REPLACE PROCEDURE data_node_maintenance(job_id int, config jsonb) LANGUAGE SQL AS $$
SELECT _timescaledb_internal.remote_txn_heal_data_node(fs.oid) FROM pg_foreign_server fs, pg_foreign_data_wrapper fdw WHERE fs.srvfdw = fdw.oid AND fdw.fdwname = 'timescaledb_fdw';$$;
SELECT add_job('data_node_maintenance', '5m');
## Statistics for distributed hypertables On distributed hypertables, the table statistics need to be kept updated. This allows you to efficiently plan your queries. Because of the nature of distributed hypertables, you can't use the `auto-vacuum` tool to gather statistics. Instead, you can explicitly ANALYZE the distributed hypertable periodically using a maintenance job, like this:sql CREATE OR REPLACE PROCEDURE distributed_hypertables_analyze(job_id int, config jsonb) LANGUAGE plpgsql AS $$ DECLARE r record; BEGIN FOR r IN SELECT hypertable_schema, hypertable_name
FROM timescaledb_information.hypertables WHERE is_distributed ORDER BY 1, 2LOOP EXECUTE format('ANALYZE %I.%I', r.hypertable_schema, r.hypertable_name); END LOOP; END $$;
SELECT add_job('distributed_hypertables_analyze', '12h');
You can merge the jobs in this example into a single maintenance job if you prefer. However, analyzing distributed hypertables should be done less frequently than remote transaction healing activity. This is because the former could analyze a large number of remote chunks everytime and can be expensive if called too frequently. ===== PAGE: https://docs.tigerdata.com/self-hosted/migration/migrate-influxdb/ ===== # Migrate data to TimescaleDB from InfluxDB You can migrate data to TimescaleDB from InfluxDB using the Outflux tool. [Outflux][outflux] is an open source tool built by Tiger Data for fast, seamless migrations. It pipes exported data directly to self-hosted TimescaleDB, and manages schema discovery, validation, and creation. Outflux works with earlier versions of InfluxDB. It does not work with InfluxDB version 2 and later. ## Prerequisites Before you start, make sure you have: * A running instance of InfluxDB and a means to connect to it. * An [self-hosted TimescaleDB instance][install] and a means to connect to it. * Data in your InfluxDB instance. ## Procedures To import data from Outflux, follow these procedures: 1. [Install Outflux][install-outflux] 1. [Discover, validate, and transfer schema][discover-validate-and-transfer-schema] to self-hosted TimescaleDB (optional) 1. [Migrate data to Timescale][migrate-data-to-timescale] ## Install Outflux Install Outflux from the GitHub repository. There are builds for Linux, Windows, and MacOS. 1. Go to the [releases section][outflux-releases] of the Outflux repository. 1. Download the latest compressed tarball for your platform. 1. Extract it to a preferred location. If you prefer to build Outflux from source, see the [Outflux README][outflux-readme] for instructions. To get help with Outflux, run `./outflux --help` from the directory where you installed it. ## Discover, validate, and transfer schema Outflux can: * Discover the schema of an InfluxDB measurement * Validate whether a table exists that can hold the transferred data * Create a new table to satisfy the schema requirements if no valid table exists Outflux's `migrate` command does schema transfer and data migration in one step. For more information, see the [migrate][migrate-data-to-timescale] section. Use this section if you want to validate and transfer your schema independently of data migration. To transfer your schema from InfluxDB to Timescale, run `outflux schema-transfer`:bash outflux schema-transfer \ --input-server=http://localhost:8086 \ --output-conn="dbname=tsdb user=tsdbadmin"
To transfer all measurements from the database, leave out the measurement name argument. This example uses the `postgres` user and database to connect to the self-hosted TimescaleDB instance. For other connection options and configuration, see the [Outflux Github repo][outflux-gitbuh]. ### Schema transfer options Outflux's `schema-transfer` can use 1 of 4 schema strategies: * `ValidateOnly`: checks that self-hosted TimescaleDB is installed and that the specified database has a properly partitioned hypertable with the correct columns, but doesn't perform modifications * `CreateIfMissing`: runs the same checks as `ValidateOnly`, and creates and properly partitions any missing hypertables * `DropAndCreate`: drops any existing table with the same name as the measurement, and creates a new hypertable and partitions it properly * `DropCascadeAndCreate`: performs the same action as `DropAndCreate`, and also executes a cascade table drop if there is an existing table with the same name as the measurement You can specify your schema strategy by passing a value to the `--schema-strategy` option in the `schema-transfer` command. The default strategy is `CreateIfMissing`. By default, each tag and field in InfluxDB is treated as a separate column in your TimescaleDB tables. To transfer tags and fields as a single JSONB column, use the flag `--tags-as-json`. ## Migrate data to TimescaleDB Transfer your schema and migrate your data all at once with the `migrate` command. For example, run:bash outflux migrate \ --input-server=http://localhost:8086 \ --output-conn="dbname=tsdb user=tsdbadmin"
The schema strategy and connection options are the same as for `schema-transfer`. For more information, see [Discover, validate, and transfer schema][discover-validate-and-transfer-schema]. In addition, `outflux migrate` also takes the following flags: * `--limit`: Pass a number, `N`, to `--limit` to export only the first `N` rows, ordered by time. * `--from` and `to`: Pass a timestamp to `--from` or `--to` to specify a time window of data to migrate. * `chunk-size`: Changes the size of data chunks transferred. Data is pulled from the InfluxDB server in chunks of default size 15 000. * `batch-size`: Changes the number of rows in an insertion batch. Data is inserted into a self-hosted TimescaleDB database in batches that are 8000 rows by default. For more flags, see the [Github documentation for `outflux migrate`][outflux-migrate]. Alternatively, see the command line help:bash outflux migrate --help
===== PAGE: https://docs.tigerdata.com/self-hosted/migration/entire-database/ ===== # Migrate the entire database at once Migrate smaller databases by dumping and restoring the entire database at once. This method works best on databases smaller than 100 GB. For larger databases, consider [migrating your schema and data separately][migrate-separately]. Depending on your database size and network speed, migration can take a very long time. You can continue reading from your source database during this time, though performance could be slower. To avoid this problem, fork your database and migrate your data from the fork. If you write to tables in your source database during the migration, the new writes might not be transferred to Timescale. To avoid this problem, see [Live migration][live-migration]. ## Prerequisites Before you begin, check that you have: * Installed the Postgres [`pg_dump`][pg_dump] and [`pg_restore`][pg_restore] utilities. * Installed a client for connecting to Postgres. These instructions use [`psql`][psql], but any client works. * Created a new empty database in your self-hosted TimescaleDB instance. For more information, see [Install TimescaleDB][install-selfhosted-timescale]. Provision your database with enough space for all your data. * Checked that any other Postgres extensions you use are compatible with Timescale. For more information, see the [list of compatible extensions][extensions]. Install your other Postgres extensions. * Checked that you're running the same major version of Postgres on both your target and source databases. For information about upgrading Postgres on your source database, see the [upgrade instructions for self-hosted TimescaleDB][upgrading-postgresql-self-hosted]. * Checked that you're running the same major version of TimescaleDB on both your target and source databases. For more information, see [upgrade self-hosted TimescaleDB][upgrading-timescaledb]. To speed up migration, compress your data into the columnstore. You can compress any chunks where data is not currently inserted, updated, or deleted. When you finish the migration, you can decompress chunks back to the rowstore as needed for normal operation. For more information about the rowstore and columnstore compression, see [hypercore][compression]. ### Migrating the entire database at once 1. Dump all the data from your source database into a `dump.bak` file, using your source database connection details. If you are prompted for a password, use your source database credentials: ```bash pg_dump -U <SOURCE_DB_USERNAME> -W \ -h <SOURCE_DB_HOST> -p <SOURCE_DB_PORT> -Fc -v \ -f dump.bak <SOURCE_DB_NAME> ``` 1. Connect to your self-hosted TimescaleDB instance using your connection details: ```bash psql “postgres://<USERNAME>:<PASSWORD>@<HOST>:<PORT>/<DATABASE>?sslmode=require” ``` 1. Prepare your self-hosted TimescaleDB instance for data restoration by using [`timescaledb_pre_restore`][timescaledb_pre_restore] to stop background workers: ```sql SELECT timescaledb_pre_restore(); ``` 1. At the command prompt, restore the dumped data from the `dump.bak` file into your self-hosted TimescaleDB instance, using your connection details. To avoid permissions errors, include the `--no-owner` flag: ```bash pg_restore -U tsdbadmin -W \ -h <CLOUD_HOST> -p <CLOUD_PORT> --no-owner \ -Fc -v -d tsdb dump.bak ``` 1. At the `psql` prompt, return your self-hosted TimescaleDB instance to normal operations by using the [`timescaledb_post_restore`][timescaledb_post_restore] command: ```sql SELECT timescaledb_post_restore(); ``` 1. Update your table statistics by running [`ANALYZE`][analyze] on your entire dataset: ```sql ANALYZE; ``` ===== PAGE: https://docs.tigerdata.com/self-hosted/migration/schema-then-data/ ===== # Migrate schema and data separately Migrate larger databases by migrating your schema first, then migrating the data. This method copies each table or chunk separately, which allows you to restart midway if one copy operation fails. For smaller databases, it may be more convenient to migrate your entire database at once. For more information, see the section on [choosing a migration method][migration]. This method does not retain continuous aggregates calculated using already-deleted data. For example, if you delete raw data after a month but retain downsampled data in a continuous aggregate for a year, the continuous aggregate loses any data older than a month upon migration. If you must keep continuous aggregates calculated using deleted data, migrate your entire database at once. For more information, see the section on [choosing a migration method][migration]. The procedure to migrate your database requires these steps: * [Migrate schema pre-data](#migrate-schema-pre-data) * [Restore hypertables in Timescale](#restore-hypertables-in-timescale) * [Copy data from the source database](#copy-data-from-the-source-database) * [Restore data into Timescale](#restore-data-into-timescale) * [Migrate schema post-data](#migrate-schema-post-data) * [Recreate continuous aggregates](#recreate-continuous-aggregates) (optional) * [Recreate policies](#recreate-policies) (optional) * [Update table statistics](#update-table-statistics) Depending on your database size and network speed, steps that involve copying data can take a very long time. You can continue reading from your source database during this time, though performance could be slower. To avoid this problem, fork your database and migrate your data from the fork. If you write to the tables in your source database during the migration, the new writes might not be transferred to Timescale. To avoid this problem, see the section on [migrating an active database][migration]. ## Prerequisites Before you begin, check that you have: * Installed the Postgres [`pg_dump`][pg_dump] and [`pg_restore`][pg_restore] utilities. * Installed a client for connecting to Postgres. These instructions use [`psql`][psql], but any client works. * Created a new empty database in a self-hosted TimescaleDB instance. For more information, see the [Install TimescaleDB][install-selfhosted]. Provision your database with enough space for all your data. * Checked that any other Postgres extensions you use are compatible with TimescaleDB. For more information, see the [list of compatible extensions][extensions]. Install your other Postgres extensions. * Checked that you're running the same major version of Postgres on both your self-hosted TimescaleDB instance and your source database. For information about upgrading Postgres on your source database, see the [upgrade instructions for self-hosted TimescaleDB][upgrading-postgresql-self-hosted] and [Managed Service for TimescaleDB][upgrading-postgresql]. * Checked that you're running the same major version of TimescaleDB on both your target and source database. For more information, see [upgrading TimescaleDB][upgrading-timescaledb]. ## Migrate schema pre-data Migrate your pre-data from your source database to self-hosted TimescaleDB. This includes table and schema definitions, as well as information on sequences, owners, and settings. This doesn't include Timescale-specific schemas. ### Migrating schema pre-data 1. Dump the schema pre-data from your source database into a `dump_pre_data.bak` file, using your source database connection details. Exclude Timescale-specific schemas. If you are prompted for a password, use your source database credentials: ```bash pg_dump -U <SOURCE_DB_USERNAME> -W \ -h <SOURCE_DB_HOST> -p <SOURCE_DB_PORT> -Fc -v \ --section=pre-data --exclude-schema="_timescaledb*" \ -f dump_pre_data.bak <DATABASE_NAME> ``` 1. Restore the dumped data from the `dump_pre_data.bak` file into your self-hosted TimescaleDB instance, using your self-hosted TimescaleDB connection details. To avoid permissions errors, include the `--no-owner` flag: ```bash pg_restore -U tsdbadmin -W \ -h <HOST> -p <PORT> --no-owner -Fc \ -v -d tsdb dump_pre_data.bak ``` ## Restore hypertables in your self-hosted TimescaleDB instance After pre-data migration, your hypertables from your source database become regular Postgres tables in Timescale. Recreate your hypertables in your self-hosted TimescaleDB instance to restore them. ### Restoring hypertables in your self-hosted TimescaleDB instance 1. Connect to your self-hosted TimescaleDB instance: ```sql psql "postgres://<USERNAME>:<PASSWORD>@<HOST>:<PORT>/<DATABSE>?sslmode=require" ``` 1. Restore the hypertable: ```sql SELECT create_hypertable( '', by_range('<COLUMN_NAME>', INTERVAL '<CHUNK_INTERVAL>') ); ``` The `by_range` dimension builder is an addition to TimescaleDB 2.13. ## Copy data from the source database After restoring your hypertables, return to your source database to copy your data, table by table. ### Copying data from your source database 1. Connect to your source database: ```bash psql "postgres://<SOURCE_DB_USERNAME>:<SOURCE_DB_PASSWORD>@<SOURCE_DB_HOST>:<SOURCE_DB_PORT>/<SOURCE_DB_NAME>?sslmode=require" ``` 1. Dump the data from the first table into a `.csv` file: ```sql \COPY (SELECT * FROM ) TO .csv CSV ``` Repeat for each table and hypertable you want to migrate. If your tables are very large, you can migrate each table in multiple pieces. Split each table by time range, and copy each range individually. For example:sql \COPY (SELECT * FROM WHERE time > '2021-11-01' AND time < '2011-11-02') TO .csv CSV
## Restore data into Timescale When you have copied your data into `.csv` files, you can restore it to self-hosted TimescaleDB by copying from the `.csv` files. There are two methods: using regular Postgres [`COPY`][copy], or using the TimescaleDB [`timescaledb-parallel-copy`][timescaledb-parallel-copy] function. In tests, `timescaledb-parallel-copy` is 16% faster. The `timescaledb-parallel-copy` tool is not included by default. You must install the function. Because `COPY` decompresses data, any compressed data in your source database is now stored uncompressed in your `.csv` files. If you provisioned your self-hosted TimescaleDB storage for your compressed data, the uncompressed data may take too much storage. To avoid this problem, periodically recompress your data as you copy it in. For more information on compression, see the [compression section](https://docs.tigerdata.com/use-timescale/latest/compression/). ### Restoring data into a Tiger Cloud service with timescaledb-parallel-copy 1. At the command prompt, install `timescaledb-parallel-copy`: ```bash go get github.com/timescale/timescaledb-parallel-copy/cmd/timescaledb-parallel-copy ``` 1. Use `timescaledb-parallel-copy` to import data into your Tiger Cloud service. Set `<NUM_WORKERS>` to twice the number of CPUs in your database. For example, if you have 4 CPUs, `<NUM_WORKERS>` should be `8`. ```bash timescaledb-parallel-copy \ --connection "host=<HOST> \ user=tsdbadmin password=<PASSWORD> \ port=<PORT> \ dbname=tsdb \ sslmode=require " \ --table \ --file <FILE_NAME>.csv \ --workers <NUM_WORKERS> \ --reporting-period 30s ``` Repeat for each table and hypertable you want to migrate. ### Restoring data into a Tiger Cloud service with COPY 1. Connect to your Tiger Cloud service: ```sql psql "postgres://tsdbadmin:<PASSWORD>@<HOST>:<PORT>/tsdb?sslmode=require" ``` 1. Restore the data to your Tiger Cloud service: ```sql \copy FROM '.csv' WITH (FORMAT CSV); ``` Repeat for each table and hypertable you want to migrate. ## Migrate schema post-data When you have migrated your table and hypertable data, migrate your Postgres schema post-data. This includes information about constraints. ### Migrating schema post-data 1. At the command prompt, dump the schema post-data from your source database into a `dump_post_data.dump` file, using your source database connection details. Exclude Timescale-specific schemas. If you are prompted for a password, use your source database credentials: ```bash pg_dump -U <SOURCE_DB_USERNAME> -W \ -h <SOURCE_DB_HOST> -p <SOURCE_DB_PORT> -Fc -v \ --section=post-data --exclude-schema="_timescaledb*" \ -f dump_post_data.dump <DATABASE_NAME> ``` 1. Restore the dumped schema post-data from the `dump_post_data.dump` file into your Tiger Cloud service, using your connection details. To avoid permissions errors, include the `--no-owner` flag: ```bash pg_restore -U tsdbadmin -W \ -h <HOST> -p <PORT> --no-owner -Fc \ -v -d tsdb dump_post_data.dump ``` ### Troubleshooting If you see these errors during the migration process, you can safely ignore them. The migration still occurs successfully.pg_restore: error: could not execute query: ERROR: relation "" already exists
pg_restore: error: could not execute query: ERROR: trigger "ts_insert_blocker" for relation "" already exists
## Recreate continuous aggregates Continuous aggregates aren't migrated by default when you transfer your schema and data separately. You can restore them by recreating the continuous aggregate definitions and recomputing the results on your Tiger Cloud service. The recomputed continuous aggregates only aggregate existing data in your Tiger Cloud service. They don't include deleted raw data. ### Recreating continuous aggregates 1. Connect to your source database: ```bash psql "postgres://<SOURCE_DB_USERNAME>:<SOURCE_DB_PASSWORD>@<SOURCE_DB_HOST>:<SOURCE_DB_PORT>/<SOURCE_DB_NAME>?sslmode=require" ``` 1. Get a list of your existing continuous aggregate definitions: ```sql SELECT view_name, view_definition FROM timescaledb_information.continuous_aggregates; ``` This query returns the names and definitions for all your continuous aggregates. For example: ```sql view_name | view_definition ----------------+-------------------------------------------------------------------------------------------------------- avg_fill_levels | SELECT round(avg(fill_measurements.fill_level), 2) AS avg_fill_level, + | time_bucket('01:00:00'::interval, fill_measurements."time") AS bucket, + | fill_measurements.sensor_id + | FROM fill_measurements + | GROUP BY (time_bucket('01:00:00'::interval, fill_measurements."time")), fill_measurements.sensor_id; (1 row) ``` 1. Connect to your Tiger Cloud service: ```bash psql "postgres://tsdbadmin:<PASSWORD>@<HOST>:<PORT>/tsdb?sslmode=require" ``` 1. Recreate each continuous aggregate definition: ```sql CREATE MATERIALIZED VIEW <VIEW_NAME> WITH (timescaledb.continuous) AS <VIEW_DEFINITION> ``` ## Recreate policies By default, policies aren't migrated when you transfer your schema and data separately. Recreate them on your Tiger Cloud service. ### Recreating policies 1. Connect to your source database: ```bash psql "postgres://<SOURCE_DB_USERNAME>:<SOURCE_DB_PASSWORD>@<SOURCE_DB_HOST>:<SOURCE_DB_PORT>/<SOURCE_DB_NAME>?sslmode=require" ``` 1. Get a list of your existing policies. This query returns a list of all your policies, including continuous aggregate refresh policies, retention policies, compression policies, and reorder policies: ```sql SELECT application_name, schedule_interval, retry_period, config, hypertable_name FROM timescaledb_information.jobs WHERE owner = '<SOURCE_DB_USERNAME>'; ``` 1. Connect to your Tiger Cloud service: ```sql psql "postgres://tsdbadmin:<PASSWORD>@<HOST>:<PORT>/tsdb?sslmode=require" ``` 1. Recreate each policy. For more information about recreating policies, see the sections on [continuous-aggregate refresh policies][cagg-policy], [retention policies][retention-policy], [Hypercore policies][setup-hypercore], and [reorder policies][reorder-policy]. ## Update table statistics Update your table statistics by running [`ANALYZE`][analyze] on your entire dataset. Note that this might take some time depending on the size of your database:sql ANALYZE;
### Troubleshooting If you see errors of the following form when you run `ANALYZE`, you can safely ignore them:WARNING: skipping "" --- only superuser can analyze it
The skipped tables and indexes correspond to system catalogs that can't be accessed. Skipping them does not affect statistics on your data. ===== PAGE: https://docs.tigerdata.com/self-hosted/migration/same-db/ ===== # Migrate data to self-hosted TimescaleDB from the same Postgres instance You can migrate data into a TimescaleDB hypertable from a regular Postgres table. This method assumes that you have TimescaleDB set up in the same database instance as your existing table. ## Prerequisites Before beginning, make sure you have [installed and set up][install] TimescaleDB. You also need a table with existing data. In this example, the source table is named `old_table`. Replace the table name with your actual table name. The example also names the destination table `new_table`, but you might want to use a more descriptive name. ## Migrate data Migrate your data into TimescaleDB from within the same database. ## Migrating data 1. Call [CREATE TABLE][hypertable-create-table] to make a new table based on your existing table. You can create your indexes at the same time, so you don't have to recreate them manually. Or you can create the table without indexes, which makes data migration faster. <Terminal> ```sql CREATE TABLE new_table ( LIKE old_table INCLUDING DEFAULTS INCLUDING CONSTRAINTS INCLUDING INDEXES ) WITH ( tsdb.hypertable, tsdb.partition_column='<the name of the time column>' ); ``` ```sql CREATE TABLE new_table ( LIKE old_table INCLUDING DEFAULTS INCLUDING CONSTRAINTS EXCLUDING INDEXES ) WITH ( tsdb.hypertable, tsdb.partition_column='<the name of the time column>' ); ``` </Terminal> If you are self-hosting TimescaleDB v2.19.3 and below, create a [Postgres relational table][pg-create-table], then convert it using [create_hypertable][create_hypertable]. You then enable hypercore with a call to [ALTER TABLE][alter_table_hypercore]. 1. Insert data from the old table to the new table. ```sql INSERT INTO new_table SELECT * FROM old_table; ``` 1. If you created your new table without indexes, recreate your indexes now. ===== PAGE: https://docs.tigerdata.com/_troubleshooting/mst/corrupt-index-duplicate/ ===== # Corrupted unique index has duplicated rows <!--- * Use this format for writing troubleshooting sections: - Cause: What causes the problem? - Consequence: What does the user see when they hit this problem? - Fix/Workaround: What can the user do to fix or work around the problem? Provide a "Resolving" Procedure if required. - Result: When the user applies the fix, what is the result when the same action is applied? * Copy this comment at the top of every troubleshooting page --> When you try to rebuild index with `REINDEX` it fails because of conflicting duplicated rows. To identify conflicting duplicate rows, you need to run a query that counts the number of rows for each combination of columns included in the index definition. For example, this `route` table has a `unique_route_index` index defining unique rows based on the combination of the `source` and `destination` columns:sql CREATE TABLE route(
source TEXT, destination TEXT, description TEXT );CREATE UNIQUE INDEX unique_route_index
ON route (source, destination);If the `unique_route_index` is corrupt, you can find duplicated rows in the `route` table using this query:sql SELECT
source, destination, countFROM
(SELECT source, destination, COUNT(*) AS count FROM route GROUP BY source, destination) AS fooWHERE count > 1;
The query groups the data by the same `source` and `destination` fields defined in the index, and filters any entries with more than one occurrence. Resolve the problematic entries in the rows by manually deleting or merging the entries until no duplicates exist. After all duplicate entries are removed, you can use the `REINDEX` command to rebuild the index. ===== PAGE: https://docs.tigerdata.com/_troubleshooting/mst/changing-owner-permission-denied/ ===== # Permission denied when changing ownership of tables and hypertables <!--- * Use this format for writing troubleshooting sections: - Cause: What causes the problem? - Consequence: What does the user see when they hit this problem? - Fix/Workaround: What can the user do to fix or work around the problem? Provide a "Resolving" Procedure if required. - Result: When the user applies the fix, what is the result when the same action is applied? * Copy this comment at the top of every troubleshooting page --> You might see this error when using the `ALTER TABLE` command to change the ownership of tables or hypertables. This use of `ALTER TABLE` is blocked because the `tsdbadmin` user is not a superuser. To change table ownership, use the [`REASSIGN`][sql-reassign] command instead:sql REASSIGN OWNED BY TO
===== PAGE: https://docs.tigerdata.com/_troubleshooting/mst/transaction-wraparound/ ===== # Postgres transaction ID wraparound The transaction control mechanism in Postgres assigns a transaction ID to every row that is modified in the database; these IDs control the visibility of that row to other concurrent transactions. The transaction ID is a 32-bit number where two billion IDs are always in the visible past and the remaining IDs are reserved for future transactions and are not visible to the running transaction. To avoid a transaction wraparound of old rows, Postgres requires occasional cleanup and freezing of old rows. This ensures that existing rows are visible when more transactions are created. You can manually freeze the old rows by executing `VACUUM FREEZE`. It can also be done automatically using the `autovacuum` daemon when a configured number of transactions has been created since the last freeze point. In Managed Service for TimescaleDB, the transaction limit is set according to the size of the database, up to 1.5 billion transactions. This ensures 500 million transaction IDs are available before a forced freeze and avoids churning stable data in existing tables. To check your transaction freeze limits, you can execute `show autovacuum_freeze_max_age` in your Postgres instance. When the limit is reached, `autovacuum` starts freezing the old rows. Some applications do not automatically adjust the configuration when the Postgres settings change, which can result in unnecessary warnings. For example, PGHero's default settings alert when 500 million transactions have been created instead of alerting after 1.5 billion transactions. To avoid this, change the value of the `transaction_id_danger` setting from 1,500,000,000 to 500,000,000, to receive warnings when the transaction limit reaches 1.5 billion. ===== PAGE: https://docs.tigerdata.com/_troubleshooting/mst/low-disk-memory-cpu/ ===== # Service is running low on disk, memory, or CPU <!--- * Use this format for writing troubleshooting sections: - Cause: What causes the problem? - Consequence: What does the user see when they hit this problem? - Fix/Workaround: What can the user do to fix or work around the problem? Provide a "Resolving" Procedure if required. - Result: When the user applies the fix, what is the result when the same action is applied? * Copy this comment at the top of every troubleshooting page --> When your database reaches 90% of your allocated disk, memory, or CPU resources, an automated message with the text above is sent to your email address. You can resolve this by logging in to your Managed Service for TimescaleDB account and increasing your available resources. From the Managed Service for TimescaleDB Dashboard, select the service that you want to increase resources for. In the `Overview` tab, locate the `Service Plan` section, and click `Upgrade Plan`. Select the plan that suits your requirements, and click `Upgrade` to enable the additional resources. If you run out of resources regularly, you might need to consider using your resources more efficiently. Consider enabling [Hypercore][setup-hypercore], using [continuous aggregates][howto-caggs], or [configuring data retention][howto-dataretention] to reduce the amount of resources your database uses. ===== PAGE: https://docs.tigerdata.com/_troubleshooting/mst/forgotten-password/ ===== # Reset password It happens to us all, you want to login to MST Console, and the password is somewhere next to your keys, wherever they are. To reset your password: 1. Open [MST Portal][mst-login]. 2. Click `Forgot password`. 3. Enter your email address, then click `Reset password`. A secure reset password link is sent to the email associated with this account. Click the link and update your password. ===== PAGE: https://docs.tigerdata.com/_troubleshooting/mst/resolving-dns/ ===== # Problem resolving DNS <!--- * Use this format for writing troubleshooting sections: - Cause: What causes the problem? - Consequence: What does the user see when they hit this problem? - Fix/Workaround: What can the user do to fix or work around the problem? Provide a "Resolving" Procedure if required. - Result: When the user applies the fix, what is the result when the same action is applied? * Copy this comment at the top of every troubleshooting page --> services require a DNS record. When you launch a new service the DNS record is created, and it can take some time for the new name to propagate to DNS servers around the world. If you move an existing service to a new Cloud provider or region, the service is rebuilt in the new region in the background. When the service has been rebuilt in the new region, the DNS records are updated. This could cause a short interruption to your service while the DNS changes are propagated. If you are unable to resolve DNS, wait a few minutes and try again. ===== PAGE: https://docs.tigerdata.com/_troubleshooting/self-hosted/upgrade-no-update-path/ ===== # TimescaleDB upgrade fails with no update path <!--- * Use this format for writing troubleshooting sections: - Cause: What causes the problem? - Consequence: What does the user see when they hit this problem? - Fix/Workaround: What can the user do to fix or work around the problem? Provide a "Resolving" Procedure if required. - Result: When the user applies the fix, what is the result when the same action is applied? * Copy this comment at the top of every troubleshooting page --> In some cases, when you use the `ALTER EXTENSION timescaledb UPDATE` command to upgrade, it might fail with the above error. This occurs if the list of available extensions does not include the version you are trying to upgrade to, and it can occur if the package was not installed correctly in the first place. To correct the problem, install the upgrade package, restart Postgres, verify the version, and then attempt the upgrade again. ===== PAGE: https://docs.tigerdata.com/_troubleshooting/self-hosted/pg_dump-version-mismatch/ ===== # Versions are mismatched when dumping and restoring a database <!--- * Use this format for writing troubleshooting sections: - Cause: What causes the problem? - Consequence: What does the user see when they hit this problem? - Fix/Workaround: What can the user do to fix or work around the problem? Provide a "Resolving" Procedure if required. - Result: When the user applies the fix, what is the result when the same action is applied? * Copy this comment at the top of every troubleshooting page --> The Postgres `pg_dump` command does not allow you to specify which version of the extension to use when backing up. This can create problems if you have a more recent version installed. For example, if you create the backup using an older version of TimescaleDB, and when you restore it uses the current version, without giving you an opportunity to upgrade first. You can work around this problem when you are restoring from backup by making sure the new Postgres instance has the same extension version as the original database before you perform the restore. After the data is restored, you can upgrade the version of TimescaleDB. ===== PAGE: https://docs.tigerdata.com/_troubleshooting/self-hosted/upgrade-fails-already-loaded/ ===== # Upgrading fails with an error saying "old version has already been loaded" <!--- * Use this format for writing troubleshooting sections: - Cause: What causes the problem? - Consequence: What does the user see when they hit this problem? - Fix/Workaround: What can the user do to fix or work around the problem? Provide a "Resolving" Procedure if required. - Result: When the user applies the fix, what is the result when the same action is applied? * Copy this comment at the top of every troubleshooting page --> When you use the `ALTER EXTENSION timescaledb UPDATE` command to upgrade, this error might appear. This occurs if you don't run `ALTER EXTENSION timescaledb UPDATE` command as the first command after starting a new session using psql or if you use tab completion when running the command. Tab completion triggers metadata queries in the background which prevents the alter extension from being the first command. To correct the problem, execute the ALTER EXTENSION command like this:sql psql -X -c 'ALTER EXTENSION timescaledb UPDATE;'
===== PAGE: https://docs.tigerdata.com/_troubleshooting/self-hosted/migration-errors-perms/ ===== # Errors encountered during a pg_dump migration <!--- * Use this format for writing troubleshooting sections: - Cause: What causes the problem? - Consequence: What does the user see when they hit this problem? - Fix/Workaround: What can the user do to fix or work around the problem? Provide a "Resolving" Procedure if required. - Result: When the user applies the fix, what is the result when the same action is applied? * Copy this comment at the top of every troubleshooting page --> The `pg_restore` function tries to apply the TimescaleDB extension when it copies your schema. This can cause a permissions error. If you already have the TimescaleDB extension installed, you can safely ignore this. ===== PAGE: https://docs.tigerdata.com/_troubleshooting/self-hosted/pg_restore-errors/ ===== # Errors occur after restoring from file dump <!--- * Use this format for writing troubleshooting sections: - Cause: What causes the problem? - Consequence: What does the user see when they hit this problem? - Fix/Workaround: What can the user do to fix or work around the problem? Provide a "Resolving" Procedure if required. - Result: When the user applies the fix, what is the result when the same action is applied? * Copy this comment at the top of every troubleshooting page --> You might see the errors above when running `pg_restore`. When loading from a logical dump make sure that you set `timescaledb.restoring` to true before loading the dump. ===== PAGE: https://docs.tigerdata.com/_troubleshooting/self-hosted/install-timescaledb-could-not-access-file/ ===== # Can't access file "timescaledb" after installation <!--- * Use this format for writing troubleshooting sections: - Cause: What causes the problem? - Consequence: What does the user see when they hit this problem? - Fix/Workaround: What can the user do to fix or work around the problem? Provide a "Resolving" Procedure if required. - Result: When the user applies the fix, what is the result when the same action is applied? * Copy this comment at the top of every troubleshooting page --> If your Postgres logs have this error preventing it from starting up, you should double check that the TimescaleDB files have been installed to the correct location. Our installation methods use `pg_config` to get Postgres's location. However if you have multiple versions of Postgres installed on the same machine, the location `pg_config` points to may not be for the version you expect. To check which version TimescaleDB used:bash $ pg_config --version PostgreSQL 12.3
If that is the correct version, double check that the installation path is the one you'd expect. For example, for Postgres 11.0 installed via Homebrew on macOS it should be `/usr/local/Cellar/postgresql/11.0/bin`:bash $ pg_config --bindir /usr/local/Cellar/postgresql/11.0/bin
If either of those steps is not the version you are expecting, you need to either (a) uninstall the incorrect version of Postgres if you can or (b) update your `PATH` environmental variable to have the correct path of `pg_config` listed first, that is, by prepending the full path:bash export PATH = /usr/local/Cellar/postgresql/11.0/bin:$PATH
Then, reinstall TimescaleDB and it should find the correct installation path. ===== PAGE: https://docs.tigerdata.com/_troubleshooting/self-hosted/update-error-third-party-tool/ ===== # Error updating TimescaleDB when using a third-party Postgres admin tool <!--- * Use this format for writing troubleshooting sections: - Cause: What causes the problem? - Consequence: What does the user see when they hit this problem? - Fix/Workaround: What can the user do to fix or work around the problem? Provide a "Resolving" Procedure if required. - Result: When the user applies the fix, what is the result when the same action is applied? * Copy this comment at the top of every troubleshooting page --> The update command `ALTER EXTENSION timescaledb UPDATE` must be the first command executed upon connection to a database. Some admin tools execute commands before this, which can disrupt the process. Try manually updating the database with `psql`. For instructions, see the [updating guide][update]. ===== PAGE: https://docs.tigerdata.com/_troubleshooting/self-hosted/windows-install-library-not-loaded/ ===== # Error loading the timescaledb extension If you see a message saying that Postgres cannot load the TimescaleDB library `timescaledb-<version>.dll`, start a new psql session to your self-hosted instance and create the `timescaledb` extension as the first command:bash psql -X -d "postgres://:@:/" -c "CREATE EXTENSION IF NOT EXISTS timescaledb;"
===== PAGE: https://docs.tigerdata.com/_troubleshooting/self-hosted/pg_dump-errors/ ===== # Errors occur when running `pg_dump` <!--- * Use this format for writing troubleshooting sections: - Cause: What causes the problem? - Consequence: What does the user see when they hit this problem? - Fix/Workaround: What can the user do to fix or work around the problem? Provide a "Resolving" Procedure if required. - Result: When the user applies the fix, what is the result when the same action is applied? * Copy this comment at the top of every troubleshooting page --> You might see the errors above when running `pg_dump`. You can safely ignore these. Your hypertable data is still accurately copied. ===== PAGE: https://docs.tigerdata.com/_troubleshooting/self-hosted/background-worker-failed-start/ ===== # Failed to start a background worker <!--- * Use this format for writing troubleshooting sections: - Cause: What causes the problem? - Consequence: What does the user see when they hit this problem? - Fix/Workaround: What can the user do to fix or work around the problem? Provide a "Resolving" Procedure if required. - Result: When the user applies the fix, what is the result when the same action is applied? * Copy this comment at the top of every troubleshooting page --> You might see this error message in the logs if background workers aren't properly configured. To fix this error, make sure that `max_worker_processes`, `max_parallel_workers`, and `timescaledb.max_background_workers` are properly set. `timescaledb.max_background_workers` should equal the number of databases plus the number of concurrent background workers. `max_worker_processes` should equal the sum of `timescaledb.max_background_workers` and `max_parallel_workers`. For more information, see the [worker configuration docs][worker-config]. ===== PAGE: https://docs.tigerdata.com/_troubleshooting/self-hosted/toolkit-cannot-create-upgrade-extension/ ===== # Install or upgrade of TimescaleDB Toolkit fails <!--- * Use this format for writing troubleshooting sections: - Cause: What causes the problem? - Consequence: What does the user see when they hit this problem? - Fix/Workaround: What can the user do to fix or work around the problem? Provide a "Resolving" Procedure if required. - Result: When the user applies the fix, what is the result when the same action is applied? * Copy this comment at the top of every troubleshooting page --> In some cases, when you create the TimescaleDB Toolkit extension, or upgrade it with the `ALTER EXTENSION timescaledb_toolkit UPDATE` command, it might fail with the above error. This occurs if the list of available extensions does not include the version you are trying to upgrade to, and it can occur if the package was not installed correctly in the first place. To correct the problem, install the upgrade package, restart Postgres, verify the version, and then attempt the update again. ### Troubleshooting TimescaleDB Toolkit setup 1. If you're installing Toolkit from a package, check your package manager's local repository list. Make sure the TimescaleDB repository is available and contains Toolkit. For instructions on adding the TimescaleDB repository, see the installation guides: * [Linux installation guide][linux-install] 1. Update your local repository list with `apt update` or `yum update`. 1. Restart your Postgres service. 1. Check that the right version of Toolkit is among your available extensions: ```sql SELECT * FROM pg_available_extensions WHERE name = 'timescaledb_toolkit'; ``` The result should look like this: ```bash -[ RECORD 1 ]-----+-------------------------------------------------------------------------------------- name | timescaledb_toolkit default_version | 1.6.0 installed_version | 1.6.0 comment | Library of analytical hyperfunctions, time-series pipelining, and other SQL utilities ``` 1. Retry `CREATE EXTENSION` or `ALTER EXTENSION`. ===== PAGE: https://docs.tigerdata.com/_troubleshooting/self-hosted/pg_dump-permission-denied/ ===== # Permission denied for table `job_errors` when running `pg_dump` <!--- * Use this format for writing troubleshooting sections: - Cause: What causes the problem? - Consequence: What does the user see when they hit this problem? - Fix/Workaround: What can the user do to fix or work around the problem? Provide a "Resolving" Procedure if required. - Result: When the user applies the fix, what is the result when the same action is applied? * Copy this comment at the top of every troubleshooting page --> When the `pg_dump` tool tries to acquire a lock on the `job_errors` table, if the user doesn't have the required SELECT permission, it results in this error. To resolve this issue, use a superuser account to grant the necessary permissions to the user requiring the `pg_dump` tool. Use this command to grant permissions to `<TEST_USER>`:sql GRANT SELECT ON TABLE _timescaledb_internal.job_errors TO ;
===== PAGE: https://docs.tigerdata.com/_troubleshooting/self-hosted/update-timescaledb-could-not-access-file/ ===== # Can't access file "timescaledb-VERSION" after update <!--- * Use this format for writing troubleshooting sections: - Cause: What causes the problem? - Consequence: What does the user see when they hit this problem? - Fix/Workaround: What can the user do to fix or work around the problem? Provide a "Resolving" Procedure if required. - Result: When the user applies the fix, what is the result when the same action is applied? * Copy this comment at the top of every troubleshooting page --> If the error occurs immediately after updating your version of TimescaleDB and the file mentioned is from the previous version, it is probably due to an incomplete update process. Within the greater Postgres server instance, each database that has TimescaleDB installed needs to be updated with the SQL command `ALTER EXTENSION timescaledb UPDATE;` while connected to that database. Otherwise, the database looks for the previous version of the TimescaleDB files. See [our update docs][update-db] for more info. ===== PAGE: https://docs.tigerdata.com/_troubleshooting/self-hosted/migration-errors/ ===== # Errors encountered during a pg_dump migration <!--- * Use this format for writing troubleshooting sections: - Cause: What causes the problem? - Consequence: What does the user see when they hit this problem? - Fix/Workaround: What can the user do to fix or work around the problem? Provide a "Resolving" Procedure if required. - Result: When the user applies the fix, what is the result when the same action is applied? * Copy this comment at the top of every troubleshooting page --> If you see these errors during the migration process, you can safely ignore them. The migration still occurs successfully. ===== PAGE: https://docs.tigerdata.com/tutorials/financial-tick-data/financial-tick-dataset/ ===== # Analyze financial tick data - Set up the dataset This tutorial uses a dataset that contains second-by-second trade data for the most-traded crypto-assets. You optimize this time-series data in a a hypertable called `assets_real_time`. You also create a separate table of asset symbols in a regular Postgres table named `assets`. The dataset is updated on a nightly basis and contains data from the last four weeks, typically around 8 million rows of data. Trades are recorded in real-time from 180+ cryptocurrency exchanges. ## Prerequisites To follow the steps on this page: * Create a target [Tiger Cloud service][create-service] with the Real-time analytics capability. You need [your connection details][connection-info]. This procedure also works for [self-hosted TimescaleDB][enable-timescaledb]. ## Optimize time-series data in a hypertable Hypertables are Postgres tables in TimescaleDB that automatically partition your time-series data by time. Time-series data represents the way a system, process, or behavior changes over time. Hypertables enable TimescaleDB to work efficiently with time-series data. Each hypertable is made up of child tables called chunks. Each chunk is assigned a range of time, and only contains data from that range. When you run a query, TimescaleDB identifies the correct chunk and runs the query on it, instead of going through the entire table. [Hypercore][hypercore] is the hybrid row-columnar storage engine in TimescaleDB used by hypertables. Traditional databases force a trade-off between fast inserts (row-based storage) and efficient analytics (columnar storage). Hypercore eliminates this trade-off, allowing real-time analytics without sacrificing transactional capabilities. Hypercore dynamically stores data in the most efficient format for its lifecycle: * **Row-based storage for recent data**: the most recent chunk (and possibly more) is always stored in the rowstore, ensuring fast inserts, updates, and low-latency single record queries. Additionally, row-based storage is used as a writethrough for inserts and updates to columnar storage. * **Columnar storage for analytical performance**: chunks are automatically compressed into the columnstore, optimizing storage efficiency and accelerating analytical queries. Unlike traditional columnar databases, hypercore allows data to be inserted or modified at any stage, making it a flexible solution for both high-ingest transactional workloads and real-time analytics—within a single database. Because TimescaleDB is 100% Postgres, you can use all the standard Postgres tables, indexes, stored procedures, and other objects alongside your hypertables. This makes creating and working with hypertables similar to standard Postgres. 1. **Connect to your Tiger Cloud service** In [Tiger Cloud Console][services-portal] open an [SQL editor][in-console-editors]. You can also connect to your service using [psql][connect-using-psql]. 1. **Create a hypertable to store the real-time cryptocurrency data** Create a [hypertable][hypertables-section] for your time-series data using [CREATE TABLE][hypertable-create-table]. For [efficient queries][secondary-indexes] on data in the columnstore, remember to `segmentby` the column you will use most often to filter your data: ```sql CREATE TABLE crypto_ticks ( "time" TIMESTAMPTZ, symbol TEXT, price DOUBLE PRECISION, day_volume NUMERIC ) WITH ( tsdb.hypertable, tsdb.partition_column='time', tsdb.segmentby='symbol', tsdb.orderby='time DESC' ); ``` If you are self-hosting TimescaleDB v2.19.3 and below, create a [Postgres relational table][pg-create-table], then convert it using [create_hypertable][create_hypertable]. You then enable hypercore with a call to [ALTER TABLE][alter_table_hypercore]. ## Create a standard Postgres table for relational data When you have relational data that enhances your time-series data, store that data in standard Postgres relational tables. 1. **Add a table to store the asset symbol and name in a relational table** ```sql CREATE TABLE crypto_assets ( symbol TEXT UNIQUE, "name" TEXT ); ``` You now have two tables within your Tiger Cloud service. A hypertable named `crypto_ticks`, and a normal Postgres table named `crypto_assets`. ## Load financial data This tutorial uses real-time cryptocurrency data, also known as tick data, from [Twelve Data][twelve-data]. To ingest data into the tables that you created, you need to download the dataset, then upload the data to your Tiger Cloud service. 1. Unzip [crypto_sample.zip](https://assets.timescale.com/docs/downloads/candlestick/crypto_sample.zip) to a `<local folder>`. This test dataset contains second-by-second trade data for the most-traded crypto-assets and a regular table of asset symbols and company names. To import up to 100GB of data directly from your current Postgres-based database, [migrate with downtime][migrate-with-downtime] using native Postgres tooling. To seamlessly import 100GB-10TB+ of data, use the [live migration][migrate-live] tooling supplied by Tiger Data. To add data from non-Postgres data sources, see [Import and ingest data][data-ingest]. 1. In Terminal, navigate to `<local folder>` and connect to your service.bash psql -d "postgres://:@:/"
The connection information for a service is available in the file you downloaded when you created it. 1. At the `psql` prompt, use the `COPY` command to transfer data into your Tiger Cloud service. If the `.csv` files aren't in your current directory, specify the file paths in these commands: ```sql \COPY crypto_ticks FROM 'tutorial_sample_tick.csv' CSV HEADER; ``` ```sql \COPY crypto_assets FROM 'tutorial_sample_assets.csv' CSV HEADER; ``` Because there are millions of rows of data, the `COPY` process could take a few minutes depending on your internet connection and local client resources. ## Connect Grafana to Tiger Cloud To visualize the results of your queries, enable Grafana to read the data in your service: 1. **Log in to Grafana** In your browser, log in to either: - Self-hosted Grafana: at `http://localhost:3000/`. The default credentials are `admin`, `admin`. - Grafana Cloud: use the URL and credentials you set when you created your account. 1. **Add your service as a data source** 1. Open `Connections` > `Data sources`, then click `Add new data source`. 1. Select `PostgreSQL` from the list. 1. Configure the connection: - `Host URL`, `Database name`, `Username`, and `Password` Configure using your [connection details][connection-info]. `Host URL` is in the format `<host>:<port>`. - `TLS/SSL Mode`: select `require`. - `PostgreSQL options`: enable `TimescaleDB`. - Leave the default setting for all other fields. 1. Click `Save & test`. Grafana checks that your details are set correctly. ===== PAGE: https://docs.tigerdata.com/tutorials/financial-tick-data/financial-tick-compress/ ===== # Compress your data using hypercore Over time you end up with a lot of data. Since this data is mostly immutable, you can compress it to save space and avoid incurring additional cost. TimescaleDB is built for handling event-oriented data such as time-series and fast analytical queries, it comes with support of [hypercore][hypercore] featuring the columnstore. [Hypercore][hypercore] enables you to store the data in a vastly more efficient format allowing up to 90x compression ratio compared to a normal Postgres table. However, this is highly dependent on the data and configuration. [Hypercore][hypercore] is implemented natively in Postgres and does not require special storage formats. When you convert your data from the rowstore to the columnstore, TimescaleDB uses Postgres features to transform the data into columnar format. The use of a columnar format allows a better compression ratio since similar data is stored adjacently. For more details on the columnar format, see [hypercore][hypercore]. A beneficial side effect of compressing data is that certain queries are significantly faster, since less data has to be read into memory. ## Optimize your data in the columnstore To compress the data in the `crypto_ticks` table, do the following: 1. Connect to your Tiger Cloud service In [Tiger Cloud Console][services-portal] open an [SQL editor][in-console-editors]. The in-Console editors display the query speed. You can also connect to your service using [psql][connect-using-psql]. 1. Convert data to the columnstore: You can do this either automatically or manually: - [Automatically convert chunks][add_columnstore_policy] in the hypertable to the columnstore at a specific time interval: ```sql CALL add_columnstore_policy('crypto_ticks', after => INTERVAL '1d'); ``` - [Manually convert all chunks][convert_to_columnstore] in the hypertable to the columnstore: ```sql CALL convert_to_columnstore(c) from show_chunks('crypto_ticks') c; ``` 1. Now that you have converted the chunks in your hypertable to the columnstore, compare the size of the dataset before and after compression: ```sql SELECT pg_size_pretty(before_compression_total_bytes) as before, pg_size_pretty(after_compression_total_bytes) as after FROM hypertable_columnstore_stats('crypto_ticks'); ``` This shows a significant improvement in data usage: ```sql before | after --------+------- 694 MB | 75 MB (1 row) ``` ## Take advantage of query speedups Previously, data in the columnstore was segmented by the `block_id` column value. This means fetching data by filtering or grouping on that column is more efficient. Ordering is set to time descending. This means that when you run queries which try to order data in the same way, you see performance benefits. 1. Connect to your Tiger Cloud service In [Tiger Cloud Console][services-portal] open an [SQL editor][in-console-editors]. The in-Console editors display the query speed. 1. Run the following query:sql SELECT
time_bucket('1 day', time) AS bucket, symbol, FIRST(price, time) AS "open", MAX(price) AS high, MIN(price) AS low, LAST(price, time) AS "close", LAST(day_volume, time) AS day_volumeFROM crypto_ticks GROUP BY bucket, symbol;
Performance speedup is of two orders of magnitude, around 15 ms when compressed in the columnstore and 1 second when decompressed in the rowstore. ===== PAGE: https://docs.tigerdata.com/tutorials/financial-tick-data/financial-tick-query/ ===== # Analyze financial tick data - Query the data Turning raw, real-time tick data into aggregated candlestick views is a common task for users who work with financial data. TimescaleDB includes [hyperfunctions][hyperfunctions] that you can use to store and query your financial data more easily. Hyperfunctions are SQL functions within TimescaleDB that make it easier to manipulate and analyze time-series data in Postgres with fewer lines of code. There are three hyperfunctions that are essential for calculating candlestick values: [`time_bucket()`][time-bucket], [`FIRST()`][first], and [`LAST()`][last]. The `time_bucket()` hyperfunction helps you aggregate records into buckets of arbitrary time intervals based on the timestamp value. `FIRST()` and `LAST()` help you calculate the opening and closing prices. To calculate highest and lowest prices, you can use the standard Postgres aggregate functions `MIN` and `MAX`. In TimescaleDB, the most efficient way to create candlestick views is to use [continuous aggregates][caggs]. In this tutorial, you create a continuous aggregate for a candlestick time bucket, and then query the aggregate with different refresh policies. Finally, you can use Grafana to visualize your data as a candlestick chart. ## Create a continuous aggregate To look at OHLCV values, the most effective way is to create a continuous aggregate. In this tutorial, you create a continuous aggregate to aggregate data for each day. You then set the aggregate to refresh every day, and to aggregate the last two days' worth of data. ### Creating a continuous aggregate 1. Connect to the Tiger Cloud service that contains the Twelve Data cryptocurrency dataset. 1. At the psql prompt, create the continuous aggregate to aggregate data every minute: ```sql CREATE MATERIALIZED VIEW one_day_candle WITH (timescaledb.continuous) AS SELECT time_bucket('1 day', time) AS bucket, symbol, FIRST(price, time) AS "open", MAX(price) AS high, MIN(price) AS low, LAST(price, time) AS "close", LAST(day_volume, time) AS day_volume FROM crypto_ticks GROUP BY bucket, symbol; ``` When you create the continuous aggregate, it refreshes by default. 1. Set a refresh policy to update the continuous aggregate every day, if there is new data available in the hypertable for the last two days: ```sql SELECT add_continuous_aggregate_policy('one_day_candle', start_offset => INTERVAL '3 days', end_offset => INTERVAL '1 day', schedule_interval => INTERVAL '1 day'); ``` ## Query the continuous aggregate When you have your continuous aggregate set up, you can query it to get the OHLCV values. ### Querying the continuous aggregate 1. Connect to the Tiger Cloud service that contains the Twelve Data cryptocurrency dataset. 1. At the psql prompt, use this query to select all Bitcoin OHLCV data for the past 14 days, by time bucket: ```sql SELECT * FROM one_day_candle WHERE symbol = 'BTC/USD' AND bucket >= NOW() - INTERVAL '14 days' ORDER BY bucket; ``` The result of the query looks like this: ```sql bucket | symbol | open | high | low | close | day_volume ------------------------+---------+---------+---------+---------+---------+------------ 2022-11-24 00:00:00+00 | BTC/USD | 16587 | 16781.2 | 16463.4 | 16597.4 | 21803 2022-11-25 00:00:00+00 | BTC/USD | 16597.4 | 16610.1 | 16344.4 | 16503.1 | 20788 2022-11-26 00:00:00+00 | BTC/USD | 16507.9 | 16685.5 | 16384.5 | 16450.6 | 12300 ``` ## Graph OHLCV data When you have extracted the raw OHLCV data, you can use it to graph the result in a candlestick chart, using Grafana. To do this, you need to have Grafana set up to connect to your self-hosted TimescaleDB instance. ### Graphing OHLCV data 1. Ensure you have Grafana installed, and you are using the TimescaleDB database that contains the Twelve Data dataset set up as a data source. 1. In Grafana, from the `Dashboards` menu, click `New Dashboard`. In the `New Dashboard` page, click `Add a new panel`. 1. In the `Visualizations` menu in the top right corner, select `Candlestick` from the list. Ensure you have set the Twelve Data dataset as your data source. 1. Click `Edit SQL` and paste in the query you used to get the OHLCV values. 1. In the `Format as` section, select `Table`. 1. Adjust elements of the table as required, and click `Apply` to save your graph to the dashboard. <img class="main-content__illustration" width={1375} height={944} src="https://assets.timescale.com/docs/images/Grafana_candlestick_1day.webp" alt="Creating a candlestick graph in Grafana using 1-day OHLCV tick data" /> ===== PAGE: https://docs.tigerdata.com/tutorials/blockchain-analyze/blockchain-dataset/ ===== # Analyze the Bitcoin blockchain - set up dataset # Ingest data into a Tiger Cloud service This tutorial uses a dataset that contains Bitcoin blockchain data for the past five days, in a hypertable named `transactions`. ## Prerequisites To follow the steps on this page: * Create a target [Tiger Cloud service][create-service] with the Real-time analytics capability. You need [your connection details][connection-info]. This procedure also works for [self-hosted TimescaleDB][enable-timescaledb]. ## Optimize time-series data using hypertables Hypertables are Postgres tables in TimescaleDB that automatically partition your time-series data by time. Time-series data represents the way a system, process, or behavior changes over time. Hypertables enable TimescaleDB to work efficiently with time-series data. Each hypertable is made up of child tables called chunks. Each chunk is assigned a range of time, and only contains data from that range. When you run a query, TimescaleDB identifies the correct chunk and runs the query on it, instead of going through the entire table. [Hypercore][hypercore] is the hybrid row-columnar storage engine in TimescaleDB used by hypertables. Traditional databases force a trade-off between fast inserts (row-based storage) and efficient analytics (columnar storage). Hypercore eliminates this trade-off, allowing real-time analytics without sacrificing transactional capabilities. Hypercore dynamically stores data in the most efficient format for its lifecycle: * **Row-based storage for recent data**: the most recent chunk (and possibly more) is always stored in the rowstore, ensuring fast inserts, updates, and low-latency single record queries. Additionally, row-based storage is used as a writethrough for inserts and updates to columnar storage. * **Columnar storage for analytical performance**: chunks are automatically compressed into the columnstore, optimizing storage efficiency and accelerating analytical queries. Unlike traditional columnar databases, hypercore allows data to be inserted or modified at any stage, making it a flexible solution for both high-ingest transactional workloads and real-time analytics—within a single database. Because TimescaleDB is 100% Postgres, you can use all the standard Postgres tables, indexes, stored procedures, and other objects alongside your hypertables. This makes creating and working with hypertables similar to standard Postgres. 1. Connect to your Tiger Cloud service In [Tiger Cloud Console][services-portal] open an [SQL editor][in-console-editors]. The in-Console editors display the query speed. You can also connect to your service using [psql][connect-using-psql]. 1. Create a [hypertable][hypertables-section] for your time-series data using [CREATE TABLE][hypertable-create-table]. For [efficient queries][secondary-indexes] on data in the columnstore, remember to `segmentby` the column you will use most often to filter your data: ```sql CREATE TABLE transactions ( time TIMESTAMPTZ NOT NULL, block_id INT, hash TEXT, size INT, weight INT, is_coinbase BOOLEAN, output_total BIGINT, output_total_usd DOUBLE PRECISION, fee BIGINT, fee_usd DOUBLE PRECISION, details JSONB ) WITH ( tsdb.hypertable, tsdb.partition_column='time', tsdb.segmentby='block_id', tsdb.orderby='time DESC' ); ``` If you are self-hosting TimescaleDB v2.19.3 and below, create a [Postgres relational table][pg-create-table], then convert it using [create_hypertable][create_hypertable]. You then enable hypercore with a call to [ALTER TABLE][alter_table_hypercore]. 1. Create an index on the `hash` column to make queries for individual transactions faster: ```sql CREATE INDEX hash_idx ON public.transactions USING HASH (hash); ``` 1. Create an index on the `block_id` column to make block-level queries faster: When you create a hypertable, it is partitioned on the time column. TimescaleDB automatically creates an index on the time column. However, you'll often filter your time-series data on other columns as well. You use [indexes][indexing] to improve query performance. ```sql CREATE INDEX block_idx ON public.transactions (block_id); ``` 1. Create a unique index on the `time` and `hash` columns to make sure you don't accidentally insert duplicate records: ```sql CREATE UNIQUE INDEX time_hash_idx ON public.transactions (time, hash); ``` ## Load financial data The dataset contains around 1.5 million Bitcoin transactions, the trades for five days. It includes information about each transaction, along with the value in [satoshi][satoshi-def]. It also states if a trade is a [coinbase][coinbase-def] transaction, and the reward a coin miner receives for mining the coin. To ingest data into the tables that you created, you need to download the dataset and copy the data to your database. 1. Download the `bitcoin_sample.zip` file. The file contains a `.csv` file that contains Bitcoin transactions for the past five days. Download: [bitcoin_sample.zip](https://assets.timescale.com/docs/downloads/bitcoin-blockchain/bitcoin_sample.zip) 1. In a new terminal window, run this command to unzip the `.csv` files: ```bash unzip bitcoin_sample.zip ``` 1. In Terminal, navigate to the folder where you unzipped the Bitcoin transactions, then connect to your service using [psql][connect-using-psql]. 1. At the `psql` prompt, use the `COPY` command to transfer data into your Tiger Cloud service. If the `.csv` files aren't in your current directory, specify the file paths in these commands: ```sql \COPY transactions FROM 'tutorial_bitcoin_sample.csv' CSV HEADER; ``` Because there is over a million rows of data, the `COPY` process could take a few minutes depending on your internet connection and local client resources. ## Connect Grafana to Tiger Cloud To visualize the results of your queries, enable Grafana to read the data in your service: 1. **Log in to Grafana** In your browser, log in to either: - Self-hosted Grafana: at `http://localhost:3000/`. The default credentials are `admin`, `admin`. - Grafana Cloud: use the URL and credentials you set when you created your account. 1. **Add your service as a data source** 1. Open `Connections` > `Data sources`, then click `Add new data source`. 1. Select `PostgreSQL` from the list. 1. Configure the connection: - `Host URL`, `Database name`, `Username`, and `Password` Configure using your [connection details][connection-info]. `Host URL` is in the format `<host>:<port>`. - `TLS/SSL Mode`: select `require`. - `PostgreSQL options`: enable `TimescaleDB`. - Leave the default setting for all other fields. 1. Click `Save & test`. Grafana checks that your details are set correctly. ===== PAGE: https://docs.tigerdata.com/tutorials/blockchain-analyze/analyze-blockchain-query/ ===== # Analyze the Bitcoin blockchain - query the data When you have your dataset loaded, you can create some continuous aggregates, and start constructing queries to discover what your data tells you. This tutorial uses [TimescaleDB hyperfunctions][about-hyperfunctions] to construct queries that are not possible in standard Postgres. In this section, you learn how to write queries that answer these questions: * [Is there any connection between the number of transactions and the transaction fees?](#is-there-any-connection-between-the-number-of-transactions-and-the-transaction-fees) * [Does the transaction volume affect the BTC-USD rate?](#does-the-transaction-volume-affect-the-btc-usd-rate) * [Do more transactions in a block mean the block is more expensive to mine?](#do-more-transactions-in-a-block-mean-the-block-is-more-expensive-to-mine) * [What percentage of the average miner's revenue comes from fees compared to block rewards?](#what-percentage-of-the-average-miners-revenue-comes-from-fees-compared-to-block-rewards) * [How does block weight affect miner fees?](#how-does-block-weight-affect-miner-fees) * [What's the average miner revenue per block?](#whats-the-average-miner-revenue-per-block) ## Create continuous aggregates You can use [continuous aggregates][docs-cagg] to simplify and speed up your queries. For this tutorial, you need three continuous aggregates, focusing on three aspects of the dataset: Bitcoin transactions, blocks, and coinbase transactions. In each continuous aggregate definition, the `time_bucket()` function controls how large the time buckets are. The examples all use 1-hour time buckets. ### Continuous aggregate: transactions 1. Connect to the Tiger Cloud service that contains the Bitcoin dataset. 1. At the psql prompt, create a continuous aggregate called `one_hour_transactions`. This view holds aggregated data about each hour of transactions: ```sql CREATE MATERIALIZED VIEW one_hour_transactions WITH (timescaledb.continuous) AS SELECT time_bucket('1 hour', time) AS bucket, count(*) AS tx_count, sum(fee) AS total_fee_sat, sum(fee_usd) AS total_fee_usd, stats_agg(fee) AS stats_fee_sat, avg(size) AS avg_tx_size, avg(weight) AS avg_tx_weight, count( CASE WHEN (fee > output_total) THEN hash ELSE NULL END) AS high_fee_count FROM transactions WHERE (is_coinbase IS NOT TRUE) GROUP BY bucket; ``` 1. Add a refresh policy to keep the continuous aggregate up-to-date: ```sql SELECT add_continuous_aggregate_policy('one_hour_transactions', start_offset => INTERVAL '3 hours', end_offset => INTERVAL '1 hour', schedule_interval => INTERVAL '1 hour'); ``` 1. Create a continuous aggregate called `one_hour_blocks`. This view holds aggregated data about all the blocks that were mined each hour: ```sql CREATE MATERIALIZED VIEW one_hour_blocks WITH (timescaledb.continuous) AS SELECT time_bucket('1 hour', time) AS bucket, block_id, count(*) AS tx_count, sum(fee) AS block_fee_sat, sum(fee_usd) AS block_fee_usd, stats_agg(fee) AS stats_tx_fee_sat, avg(size) AS avg_tx_size, avg(weight) AS avg_tx_weight, sum(size) AS block_size, sum(weight) AS block_weight, max(size) AS max_tx_size, max(weight) AS max_tx_weight, min(size) AS min_tx_size, min(weight) AS min_tx_weight FROM transactions WHERE is_coinbase IS NOT TRUE GROUP BY bucket, block_id; ``` 1. Add a refresh policy to keep the continuous aggregate up-to-date: ```sql SELECT add_continuous_aggregate_policy('one_hour_blocks', start_offset => INTERVAL '3 hours', end_offset => INTERVAL '1 hour', schedule_interval => INTERVAL '1 hour'); ``` 1. Create a continuous aggregate called `one_hour_coinbase`. This view holds aggregated data about all the transactions that miners received as rewards each hour: ```sql CREATE MATERIALIZED VIEW one_hour_coinbase WITH (timescaledb.continuous) AS SELECT time_bucket('1 hour', time) AS bucket, count(*) AS tx_count, stats_agg(output_total, output_total_usd) AS stats_miner_revenue, min(output_total) AS min_miner_revenue, max(output_total) AS max_miner_revenue FROM transactions WHERE is_coinbase IS TRUE GROUP BY bucket; ``` 1. Add a refresh policy to keep the continuous aggregate up-to-date: ```sql SELECT add_continuous_aggregate_policy('one_hour_coinbase', start_offset => INTERVAL '3 hours', end_offset => INTERVAL '1 hour', schedule_interval => INTERVAL '1 hour'); ``` ## Is there any connection between the number of transactions and the transaction fees? Transaction fees are a major concern for blockchain users. If a blockchain is too expensive, you might not want to use it. This query shows you whether there's any correlation between the number of Bitcoin transactions and the fees. The time range for this analysis is the last 2 days. If you choose to visualize the query in Grafana, you can see the average transaction volume and the average fee per transaction, over time. These trends might help you decide whether to submit a transaction now or wait a few days for fees to decrease. ### Finding a connection between the number of transactions and the transaction fees 1. Connect to the Tiger Cloud service that contains the Bitcoin dataset. 1. At the psql prompt, use this query to average transaction volume and the fees from the `one_hour_transactions` continuous aggregate: ```sql SELECT bucket AS "time", tx_count as "tx volume", average(stats_fee_sat) as fees FROM one_hour_transactions WHERE bucket > date_add('2023-11-22 00:00:00+00', INTERVAL '-2 days') ORDER BY 1; ``` 1. The data you get back looks a bit like this: ```sql time | tx volume | fees ------------------------+-----------+-------------------- 2023-11-20 01:00:00+00 | 2602 | 105963.45810914681 2023-11-20 02:00:00+00 | 33037 | 26686.814117504615 2023-11-20 03:00:00+00 | 42077 | 22875.286546094067 2023-11-20 04:00:00+00 | 46021 | 20280.843180287262 2023-11-20 05:00:00+00 | 20828 | 24694.472969080085 ... ``` 1. [](#)To visualize this in Grafana, create a new panel, select the Bitcoin dataset as your data source, and type the query from the previous step. In the `Format as` section, select `Time series`. <img class="main-content__illustration" src="https://assets.timescale.com/docs/images/grafana-transactions-fees.webp" width={1375} height={944} alt="Visualizing number of transactions and fees" /> ## Does the transaction volume affect the BTC-USD rate? In cryptocurrency trading, there's a lot of speculation. You can adopt a data-based trading strategy by looking at correlations between blockchain metrics, such as transaction volume and the current exchange rate between Bitcoin and US Dollars. If you choose to visualize the query in Grafana, you can see the average transaction volume, along with the BTC to US Dollar conversion rate. ### Finding the transaction volume and the BTC-USD rate 1. Connect to the Tiger Cloud service that contains the Bitcoin dataset. 1. At the psql prompt, use this query to return the trading volume and the BTC to US Dollar exchange rate: ```sql SELECT bucket AS "time", tx_count as "tx volume", total_fee_usd / (total_fee_sat*0.00000001) AS "btc-usd rate" FROM one_hour_transactions WHERE bucket > date_add('2023-11-22 00:00:00+00', INTERVAL '-2 days') ORDER BY 1; ``` 1. The data you get back looks a bit like this: ```sql time | tx volume | btc-usd rate ------------------------+-----------+-------------------- 2023-06-13 08:00:00+00 | 20063 | 25975.888587931426 2023-06-13 09:00:00+00 | 16984 | 25976.00446352126 2023-06-13 10:00:00+00 | 15856 | 25975.988587014584 2023-06-13 11:00:00+00 | 24967 | 25975.89166787936 2023-06-13 12:00:00+00 | 8575 | 25976.004209699528 ... ``` 1. [](#)To visualize this in Grafana, create a new panel, select the Bitcoin dataset as your data source, and type the query from the previous step. In the `Format as` section, select `Time series`. 1. [](#)To make this visualization more useful, add an override to put the fees on a different Y-axis. In the options panel, add an override for the `btc-usd rate` field for `Axis > Placement` and choose `Right`. <img class="main-content__illustration" src="https://assets.timescale.com/docs/images/grafana-volume-rate.webp" width={1375} height={944} alt="Visualizing transaction volume and BTC-USD conversion rate" /> ## Do more transactions in a block mean the block is more expensive to mine? The number of transactions in a block can influence the overall block mining fee. For this analysis, a larger time frame is required, so increase the analyzed time range to 5 days. If you choose to visualize the query in Grafana, you can see that the more transactions in a block, the higher the mining fee becomes. ## Finding if more transactions in a block mean the block is more expensive to mine 1. Connect to the Tiger Cloud service that contains the Bitcoin dataset. 1. At the psql prompt, use this query to return the number of transactions in a block, compared to the mining fee: ```sql SELECT bucket as "time", avg(tx_count) AS transactions, avg(block_fee_sat)*0.00000001 AS "mining fee" FROM one_hour_blocks WHERE bucket > date_add('2023-11-22 00:00:00+00', INTERVAL '-5 days') GROUP BY bucket ORDER BY 1; ``` 1. The data you get back looks a bit like this: ```sql time | transactions | mining fee ------------------------+-----------------------+------------------------ 2023-06-10 08:00:00+00 | 2322.2500000000000000 | 0.29221418750000000000 2023-06-10 09:00:00+00 | 3305.0000000000000000 | 0.50512649666666666667 2023-06-10 10:00:00+00 | 3011.7500000000000000 | 0.44783255750000000000 2023-06-10 11:00:00+00 | 2874.7500000000000000 | 0.39303009500000000000 2023-06-10 12:00:00+00 | 2339.5714285714285714 | 0.25590717142857142857 ... ``` 1. [](#)To visualize this in Grafana, create a new panel, select the Bitcoin dataset as your data source, and type the query from the previous step. In the `Format as` section, select `Time series`. 1. [](#)To make this visualization more useful, add an override to put the fees on a different Y-axis. In the options panel, add an override for the `mining fee` field for `Axis > Placement` and choose `Right`. <img class="main-content__illustration" src="https://assets.timescale.com/docs/images/grafana-transactions-miningfee.webp" width={1375} height={944} alt="Visualizing transactions in a block and the mining fee" /> You can extend this analysis to find if there is the same correlation between block weight and mining fee. More transactions should increase the block weight, and boost the miner fee as well. If you choose to visualize the query in Grafana, you can see the same kind of high correlation between block weight and mining fee. The relationship weakens when the block weight gets close to its maximum value, which is 4 million weight units, in which case it's impossible for a block to include more transactions. ### Finding if higher block weight means the block is more expensive to mine 1. Connect to the Tiger Cloud service that contains the Bitcoin dataset. 1. At the psql prompt, use this query to return the block weight, compared to the mining fee: ```sql SELECT bucket as "time", avg(block_weight) as "block weight", avg(block_fee_sat*0.00000001) as "mining fee" FROM one_hour_blocks WHERE bucket > date_add('2023-11-22 00:00:00+00', INTERVAL '-5 days') group by bucket ORDER BY 1; ``` 1. The data you get back looks a bit like this: ```sql time | block weight | mining fee ------------------------+----------------------+------------------------ 2023-06-10 08:00:00+00 | 3992809.250000000000 | 0.29221418750000000000 2023-06-10 09:00:00+00 | 3991766.333333333333 | 0.50512649666666666667 2023-06-10 10:00:00+00 | 3992918.250000000000 | 0.44783255750000000000 2023-06-10 11:00:00+00 | 3991873.000000000000 | 0.39303009500000000000 2023-06-10 12:00:00+00 | 3992934.000000000000 | 0.25590717142857142857 ... ``` 1. [](#)To visualize this in Grafana, create a new panel, select the Bitcoin dataset as your data source, and type the query from the previous step. In the `Format as` section, select `Time series`. 1. [](#)To make this visualization more useful, add an override to put the fees on a different Y-axis. In the options panel, add an override for the `mining fee` field for `Axis > Placement` and choose `Right`. <img class="main-content__illustration" src="https://assets.timescale.com/docs/images/grafana-blockweight-miningfee.webp" width={1375} height={944} alt="Visualizing blockweight and the mining fee" /> ## What percentage of the average miner's revenue comes from fees compared to block rewards? In the previous queries, you saw that mining fees are higher when block weights and transaction volumes are higher. This query analyzes the data from a different perspective. Miner revenue is not only made up of miner fees, it also includes block rewards for mining a new block. This reward is currently 6.25 BTC, and it gets halved every four years. This query looks at how much of a miner's revenue comes from fees, compares to block rewards. If you choose to visualize the query in Grafana, you can see that most miner revenue actually comes from block rewards. Fees never account for more than a few percentage points of overall revenue. ### Finding what percentage of the average miner's revenue comes from fees compared to block rewards 1. Connect to the Tiger Cloud service that contains the Bitcoin dataset. 1. At the psql prompt, use this query to return coinbase transactions, along with the block fees and rewards: ```sql WITH coinbase AS ( SELECT block_id, output_total AS coinbase_tx FROM transactions WHERE is_coinbase IS TRUE and time > date_add('2023-11-22 00:00:00+00', INTERVAL '-5 days') ) SELECT bucket as "time", avg(block_fee_sat)*0.00000001 AS "fees", FIRST((c.coinbase_tx - block_fee_sat), bucket)*0.00000001 AS "reward" FROM one_hour_blocks b INNER JOIN coinbase c ON c.block_id = b.block_id GROUP BY bucket ORDER BY 1; ``` 1. The data you get back looks a bit like this: ```sql time | fees | reward ------------------------+------------------------+------------ 2023-06-10 08:00:00+00 | 0.28247062857142857143 | 6.25000000 2023-06-10 09:00:00+00 | 0.50512649666666666667 | 6.25000000 2023-06-10 10:00:00+00 | 0.44783255750000000000 | 6.25000000 2023-06-10 11:00:00+00 | 0.39303009500000000000 | 6.25000000 2023-06-10 12:00:00+00 | 0.25590717142857142857 | 6.25000000 ... ``` 1. [](#)To visualize this in Grafana, create a new panel, select the Bitcoin dataset as your data source, and type the query from the previous step. In the `Format as` section, select `Time series`. 1. [](#)To make this visualization more useful, stack the series to 100%. In the options panel, in the `Graph styles` section, for `Stack series` select `100%`. <img class="main-content__illustration" src="https://assets.timescale.com/docs/images/grafana-coinbase-revenue.webp" width={1375} height={944} alt="Visualizing coinbase revenue sources" /> ## How does block weight affect miner fees? You've already found that more transactions in a block mean it's more expensive to mine. In this query, you ask if the same is true for block weights? The more transactions a block has, the larger its weight, so the block weight and mining fee should be tightly correlated. This query uses a 12-hour moving average to calculate the block weight and block mining fee over time. If you choose to visualize the query in Grafana, you can see that the block weight and block mining fee are tightly connected. In practice, you can also see the four million weight units size limit. This means that there's still room to grow for individual blocks, and they could include even more transactions. ### Finding how block weight affects miner fees 1. Connect to the Tiger Cloud service that contains the Bitcoin dataset. 1. At the psql prompt, use this query to return block weight, along with the block fees and rewards: ```sql WITH stats AS ( SELECT bucket, stats_agg(block_weight, block_fee_sat) AS block_stats FROM one_hour_blocks WHERE bucket > date_add('2023-11-22 00:00:00+00', INTERVAL '-5 days') GROUP BY bucket ) SELECT bucket as "time", average_y(rolling(block_stats) OVER (ORDER BY bucket RANGE '12 hours' PRECEDING)) AS "block weight", average_x(rolling(block_stats) OVER (ORDER BY bucket RANGE '12 hours' PRECEDING))*0.00000001 AS "mining fee" FROM stats ORDER BY 1; ``` 1. The data you get back looks a bit like this: ```sql time | block weight | mining fee ------------------------+--------------------+--------------------- 2023-06-10 09:00:00+00 | 3991766.3333333335 | 0.5051264966666666 2023-06-10 10:00:00+00 | 3992424.5714285714 | 0.47238710285714286 2023-06-10 11:00:00+00 | 3992224 | 0.44353000909090906 2023-06-10 12:00:00+00 | 3992500.111111111 | 0.37056557222222225 2023-06-10 13:00:00+00 | 3992446.65 | 0.39728022799999996 ... ``` 1. [](#)To visualize this in Grafana, create a new panel, select the Bitcoin dataset as your data source, and type the query from the previous step. In the `Format as` section, select `Time series`. 1. [](#)To make this visualization more useful, add an override to put the fees on a different Y-axis. In the options panel, add an override for the `mining fee` field for `Axis > Placement` and choose `Right`. <img class="main-content__illustration" src="https://assets.timescale.com/docs/images/grafana-blockweight-rewards.webp" width={1375} height={944} alt="Visualizing block weight and mining fees" /> ## What's the average miner revenue per block? In this final query, you analyze how much revenue miners actually generate by mining a new block on the blockchain, including fees and block rewards. To make the analysis more interesting, add the Bitcoin to US Dollar exchange rate, and increase the time range. ### Finding the average miner revenue per block 1. Connect to the Tiger Cloud service that contains the Bitcoin dataset. 1. At the psql prompt, use this query to return the average miner revenue per block, with a 12-hour moving average: ```sql SELECT bucket as "time", average_y(rolling(stats_miner_revenue) OVER (ORDER BY bucket RANGE '12 hours' PRECEDING))*0.00000001 AS "revenue in BTC", average_x(rolling(stats_miner_revenue) OVER (ORDER BY bucket RANGE '12 hours' PRECEDING)) AS "revenue in USD" FROM one_hour_coinbase WHERE bucket > date_add('2023-11-22 00:00:00+00', INTERVAL '-5 days') ORDER BY 1; ``` 1. The data you get back looks a bit like this: ```sql time | revenue in BTC | revenue in USD ------------------------+--------------------+-------------------- 2023-06-09 14:00:00+00 | 6.6732841925 | 176922.1133 2023-06-09 15:00:00+00 | 6.785046736363636 | 179885.1576818182 2023-06-09 16:00:00+00 | 6.7252952905 | 178301.02735000002 2023-06-09 17:00:00+00 | 6.716377454814815 | 178064.5978074074 2023-06-09 18:00:00+00 | 6.7784206471875 | 179709.487309375 ... ``` 1. [](#)To visualize this in Grafana, create a new panel, select the Bitcoin dataset as your data source, and type the query from the previous step. In the `Format as` section, select `Time series`. 1. [](#)To make this visualization more useful, add an override to put the US Dollars on a different Y-axis. In the options panel, add an override for the `mining fee` field for `Axis > Placement` and choose `Right`. <img class="main-content__illustration" src="https://assets.timescale.com/docs/images/grafana-blockweight-revenue.webp" width={1375} height={944} alt="Visualizing block revenue over time" /> ===== PAGE: https://docs.tigerdata.com/tutorials/nyc-taxi-cab/dataset-nyc/ ===== # Query time-series data tutorial - set up dataset This tutorial uses a dataset that contains historical data from the New York City Taxi and Limousine Commission [NYC TLC][nyc-tlc], in a hypertable named `rides`. It also includes a separate tables of payment types and rates, in a regular Postgres table named `payment_types`, and `rates`. ## Prerequisites To follow the steps on this page: * Create a target [Tiger Cloud service][create-service] with the Real-time analytics capability. You need [your connection details][connection-info]. This procedure also works for [self-hosted TimescaleDB][enable-timescaledb]. ## Optimize time-series data in hypertables Time-series data represents how a system, process, or behavior changes over time. [Hypertables][hypertables-section] are Postgres tables that help you improve insert and query performance by automatically partitioning your data by time. Each hypertable is made up of child tables called chunks. Each chunk is assigned a range of time, and only contains data from that range. Hypertables exist alongside regular Postgres tables. You interact with hypertables and regular Postgres tables in the same way. You use regular Postgres tables for relational data. 1. **Create a hypertable to store the taxi trip data** ```sql CREATE TABLE "rides"( vendor_id TEXT, pickup_datetime TIMESTAMP WITHOUT TIME ZONE NOT NULL, dropoff_datetime TIMESTAMP WITHOUT TIME ZONE NOT NULL, passenger_count NUMERIC, trip_distance NUMERIC, pickup_longitude NUMERIC, pickup_latitude NUMERIC, rate_code INTEGER, dropoff_longitude NUMERIC, dropoff_latitude NUMERIC, payment_type INTEGER, fare_amount NUMERIC, extra NUMERIC, mta_tax NUMERIC, tip_amount NUMERIC, tolls_amount NUMERIC, improvement_surcharge NUMERIC, total_amount NUMERIC ) WITH ( tsdb.hypertable, tsdb.partition_column='pickup_datetime', tsdb.create_default_indexes=false ); ``` If you are self-hosting TimescaleDB v2.19.3 and below, create a [Postgres relational table][pg-create-table], then convert it using [create_hypertable][create_hypertable]. You then enable hypercore with a call to [ALTER TABLE][alter_table_hypercore]. 1. **Add another dimension to partition your hypertable more efficiently** ```sql SELECT add_dimension('rides', by_hash('payment_type', 2)); ``` 1. **Create an index to support efficient queries** Index by vendor, rate code, and passenger count: ```sql CREATE INDEX ON rides (vendor_id, pickup_datetime DESC); CREATE INDEX ON rides (rate_code, pickup_datetime DESC); CREATE INDEX ON rides (passenger_count, pickup_datetime DESC); ``` ## Create standard Postgres tables for relational data When you have other relational data that enhances your time-series data, you can create standard Postgres tables just as you would normally. For this dataset, there are two other tables of data, called `payment_types` and `rates`. 1. **Add a relational table to store the payment types data** ```sql CREATE TABLE IF NOT EXISTS "payment_types"( payment_type INTEGER, description TEXT ); INSERT INTO payment_types(payment_type, description) VALUES (1, 'credit card'), (2, 'cash'), (3, 'no charge'), (4, 'dispute'), (5, 'unknown'), (6, 'voided trip'); ``` 1. **Add a relational table to store the rates data** ```sql CREATE TABLE IF NOT EXISTS "rates"( rate_code INTEGER, description TEXT ); INSERT INTO rates(rate_code, description) VALUES (1, 'standard rate'), (2, 'JFK'), (3, 'Newark'), (4, 'Nassau or Westchester'), (5, 'negotiated fare'), (6, 'group ride'); ``` You can confirm that the scripts were successful by running the `\dt` command in the `psql` command line. You should see this:sql
List of relationsSchema | Name | Type | Owner --------+---------------+-------+---------- public | payment_types | table | tsdbadmin public | rates | table | tsdbadmin public | rides | table | tsdbadmin (3 rows)
## Load trip data When you have your database set up, you can load the taxi trip data into the `rides` hypertable. This is a large dataset, so it might take a long time, depending on your network connection. 1. Download the dataset: [nyc_data.tar.gz](https://assets.timescale.com/docs/downloads/nyc_data.tar.gz) 1. Use your file manager to decompress the downloaded dataset, and take a note of the path to the `nyc_data_rides.csv` file. 1. At the psql prompt, copy the data from the `nyc_data_rides.csv` file into your hypertable. Make sure you point to the correct path, if it is not in your current working directory: ```sql \COPY rides FROM nyc_data_rides.csv CSV; ``` You can check that the data has been copied successfully with this command:sql SELECT * FROM rides LIMIT 5;
You should get five records that look like this:sql -[ RECORD 1 ]---------+-------------------- vendor_id | 1 pickup_datetime | 2016-01-01 00:00:01 dropoff_datetime | 2016-01-01 00:11:55 passenger_count | 1 trip_distance | 1.20 pickup_longitude | -73.979423522949219 pickup_latitude | 40.744613647460938 rate_code | 1 dropoff_longitude | -73.992034912109375 dropoff_latitude | 40.753944396972656 payment_type | 2 fare_amount | 9 extra | 0.5 mta_tax | 0.5 tip_amount | 0 tolls_amount | 0 improvement_surcharge | 0.3 total_amount | 10.3
===== PAGE: https://docs.tigerdata.com/tutorials/nyc-taxi-cab/index/ ===== # Query time-series data tutorial New York City is home to about 9 million people. This tutorial uses historical data from New York's yellow taxi network, provided by the New York City Taxi and Limousine Commission [NYC TLC][nyc-tlc]. The NYC TLC tracks over 200,000 vehicles making about 1 million trips each day. Because nearly all of this data is time-series data, proper analysis requires a purpose-built time-series database, like Timescale. ## Prerequisites Before you begin, make sure you have: * Signed up for a [free Tiger Data account][cloud-install]. ## Steps in this tutorial This tutorial covers: 1. [Setting up your dataset][dataset-nyc]: Set up and connect to a Timescale service, and load data into your database using `psql`. 1. [Querying your dataset][query-nyc]: Analyze a dataset containing NYC taxi trip data using Tiger Cloud and Postgres. 1. [Bonus: Store data efficiently][compress-nyc]: Learn how to store and query your NYC taxi trip data more efficiently using compression feature of Timescale. ## About querying data with Timescale This tutorial uses the [NYC taxi data][nyc-tlc] to show you how to construct queries for time-series data. The analysis you do in this tutorial is similar to the kind of analysis data science organizations use to do things like plan upgrades, set budgets, and allocate resources. It starts by teaching you how to set up and connect to a Tiger Cloud service, create tables, and load data into the tables using `psql`. You then learn how to conduct analysis and monitoring on your dataset. It walks you through using Postgres queries to obtain information, including how to use JOINs to combine your time-series data with relational or business data. If you have been provided with a pre-loaded dataset on your Tiger Cloud service, go directly to the [queries section](https://docs.tigerdata.com/tutorials/latest/nyc-taxi-geospatial/plot-nyc/). ===== PAGE: https://docs.tigerdata.com/tutorials/nyc-taxi-cab/query-nyc/ ===== # Query time-series data tutorial - query the data When you have your dataset loaded, you can start constructing some queries to discover what your data tells you. In this section, you learn how to write queries that answer these questions: * [How many rides take place each day?](#how-many-rides-take-place-every-day) * [What is the average fare amount?](#what-is-the-average-fare-amount) * [How many rides of each rate type were taken?](#how-many-rides-of-each-rate-type-were-taken) * [What kind of trips are going to and from airports?](#what-kind-of-trips-are-going-to-and-from-airports) * [How many rides took place on New Year's Day 2016](#how-many-rides-took-place-on-new-years-day-2016)? ## How many rides take place every day? This dataset contains ride data for January 2016. To find out how many rides took place each day, you can use a `SELECT` statement. In this case, you want to count the total number of rides each day, and show them in a list by date. ### Finding how many rides take place every day 1. Connect to the Tiger Cloud service that contains the NYC taxi dataset. 1. At the psql prompt, use this query to select all rides taken in the first week of January 2016, and return a count of rides for each day: ```sql SELECT date_trunc('day', pickup_datetime) as day, COUNT(*) FROM rides WHERE pickup_datetime < '2016-01-08' GROUP BY day ORDER BY day; ``` The result of the query looks like this: ```sql day | count ---------------------+-------- 2016-01-01 00:00:00 | 345037 2016-01-02 00:00:00 | 312831 2016-01-03 00:00:00 | 302878 2016-01-04 00:00:00 | 316171 2016-01-05 00:00:00 | 343251 2016-01-06 00:00:00 | 348516 2016-01-07 00:00:00 | 364894 ``` ## What is the average fare amount? You can include a function in your `SELECT` query to determine the average fare paid by each passenger. ### Finding the average fare amount 1. Connect to the Tiger Cloud service that contains the NYC taxi dataset. 2. At the psql prompt, use this query to select all rides taken in the first week of January 2016, and return the average fare paid on each day: ```sql SELECT date_trunc('day', pickup_datetime) AS day, avg(fare_amount) FROM rides WHERE pickup_datetime < '2016-01-08' GROUP BY day ORDER BY day; ``` The result of the query looks like this: ```sql day | avg ---------------------+--------------------- 2016-01-01 00:00:00 | 12.8569325028909943 2016-01-02 00:00:00 | 12.4344713599355563 2016-01-03 00:00:00 | 13.0615900461571986 2016-01-04 00:00:00 | 12.2072927308323660 2016-01-05 00:00:00 | 12.0018670885154013 2016-01-06 00:00:00 | 12.0002329017893009 2016-01-07 00:00:00 | 12.1234180337303436 ``` ## How many rides of each rate type were taken? Taxis in New York City use a range of different rate types for different kinds of trips. For example, trips to the airport are charged at a flat rate from any location within the city. This section shows you how to construct a query that shows you the nuber of trips taken for each different fare type. It also uses a `JOIN` statement to present the data in a more informative way. ### Finding the number of rides for each fare type 1. Connect to the Tiger Cloud service that contains the NYC taxi dataset. 2. At the psql prompt, use this query to select all rides taken in the first week of January 2016, and return the total number of trips taken for each rate code: ```sql SELECT rate_code, COUNT(vendor_id) AS num_trips FROM rides WHERE pickup_datetime < '2016-01-08' GROUP BY rate_code ORDER BY rate_code; ``` The result of the query looks like this: ```sql rate_code | num_trips -----------+----------- 1 | 2266401 2 | 54832 3 | 4126 4 | 967 5 | 7193 6 | 17 99 | 42 ``` This output is correct, but it's not very easy to read, because you probably don't know what the different rate codes mean. However, the `rates` table in the dataset contains a human-readable description of each code. You can use a `JOIN` statement in your query to connect the `rides` and `rates` tables, and present information from both in your results. ### Displaying the number of rides for each fare type 1. Connect to the Tiger Cloud service that contains the NYC taxi dataset. 2. At the psql prompt, copy this query to select all rides taken in the first week of January 2016, join the `rides` and `rates` tables, and return the total number of trips taken for each rate code, with a description of the rate code: ```sql SELECT rates.description, COUNT(vendor_id) AS num_trips FROM rides JOIN rates ON rides.rate_code = rates.rate_code WHERE pickup_datetime < '2016-01-08' GROUP BY rates.description ORDER BY LOWER(rates.description); ``` The result of the query looks like this: ```sql description | num_trips -----------------------+----------- group ride | 17 JFK | 54832 Nassau or Westchester | 967 negotiated fare | 7193 Newark | 4126 standard rate | 2266401 ``` ## What kind of trips are going to and from airports There are two primary airports in the dataset: John F. Kennedy airport, or JFK, is represented by rate code 2; Newark airport, or EWR, is represented by rate code 3. Information about the trips that are going to and from the two airports is useful for city planning, as well as for organizations like the NYC Tourism Bureau. This section shows you how to construct a query that returns trip information for trips going only to the new main airports. ### Finding what kind of trips are going to and from airports 1. Connect to the Tiger Cloud service that contains the NYC taxi dataset. 1. At the psql prompt, use this query to select all rides taken to and from JFK and Newark airports, in the first week of January 2016, and return the number of trips to that airport, the average trip duration, average trip cost, and average number of passengers: ```sql SELECT rates.description, COUNT(vendor_id) AS num_trips, AVG(dropoff_datetime - pickup_datetime) AS avg_trip_duration, AVG(total_amount) AS avg_total, AVG(passenger_count) AS avg_passengers FROM rides JOIN rates ON rides.rate_code = rates.rate_code WHERE rides.rate_code IN (2,3) AND pickup_datetime < '2016-01-08' GROUP BY rates.description ORDER BY rates.description; ``` The result of the query looks like this: ```sql description | num_trips | avg_trip_duration | avg_total | avg_passengers -------------+-----------+-------------------+---------------------+-------------------- JFK | 54832 | 00:46:44.614222 | 63.7791311642836300 | 1.8062080536912752 Newark | 4126 | 00:34:45.575618 | 84.3841783809985458 | 1.8979641299079011 ``` ## How many rides took place on New Year's Day 2016? New York City is famous for the Ball Drop New Year's Eve celebration in Times Square. Thousands of people gather to bring in the New Year and then head out into the city: to their favorite bar, to gather with friends for a meal, or back home. This section shows you how to construct a query that returns the number of taxi trips taken on 1 January, 2016, in 30 minute intervals. In Postgres, it's not particularly easy to segment the data by 30 minute time intervals. To do this, you would need to use a `TRUNC` function to calculate the quotient of the minute that a ride began in divided by 30, then truncate the result to take the floor of that quotient. When you had that result, you could multiply the truncated quotient by 30. In your Tiger Cloud service, you can use the `time_bucket` function to segment the data into time intervals instead. ### Finding how many rides took place on New Year's Day 2016 1. Connect to the Tiger Cloud service that contains the NYC taxi dataset. 1. At the psql prompt, use this query to select all rides taken on the first day of January 2016, and return a count of rides for each 30 minute interval: ```sql SELECT time_bucket('30 minute', pickup_datetime) AS thirty_min, count(*) FROM rides WHERE pickup_datetime < '2016-01-02 00:00' GROUP BY thirty_min ORDER BY thirty_min; ``` The result of the query starts like this: ```sql thirty_min | count ---------------------+------- 2016-01-01 00:00:00 | 10920 2016-01-01 00:30:00 | 14350 2016-01-01 01:00:00 | 14660 2016-01-01 01:30:00 | 13851 2016-01-01 02:00:00 | 13260 2016-01-01 02:30:00 | 12230 2016-01-01 03:00:00 | 11362 ``` ===== PAGE: https://docs.tigerdata.com/tutorials/nyc-taxi-cab/compress-nyc/ ===== # Query time-series data tutorial - set up compression You have now seen how to create a hypertable for your NYC taxi trip data and query it. When ingesting a dataset like this is seldom necessary to update old data and over time the amount of data in the tables grows. Over time you end up with a lot of data and since this is mostly immutable you can compress it to save space and avoid incurring additional cost. It is possible to use disk-oriented compression like the support offered by ZFS and Btrfs but since TimescaleDB is build for handling event-oriented data (such as time-series) it comes with support for compressing data in hypertables. TimescaleDB compression allows you to store the data in a vastly more efficient format allowing up to 20x compression ratio compared to a normal Postgres table, but this is of course highly dependent on the data and configuration. TimescaleDB compression is implemented natively in Postgres and does not require special storage formats. Instead it relies on features of Postgres to transform the data into columnar format before compression. The use of a columnar format allows better compression ratio since similar data is stored adjacently. For more details on how the compression format looks, you can look at the [compression design][compression-design] section. A beneficial side-effect of compressing data is that certain queries are significantly faster since less data has to be read into memory. ## Compression setup 1. Connect to the Tiger Cloud service that contains the dataset using, for example `psql`. 1. Enable compression on the table and pick suitable segment-by and order-by column using the `ALTER TABLE` command: ```sql ALTER TABLE rides SET ( timescaledb.compress, timescaledb.compress_segmentby='vendor_id', timescaledb.compress_orderby='pickup_datetime DESC' ); ``` Depending on the choice if segment-by and order-by column you can get very different performance and compression ratio. To learn more about how to pick the correct columns, see [here][segment-by-columns]. 1. You can manually compress all the chunks of the hypertable using `compress_chunk` in this manner: ```sql SELECT compress_chunk(c) from show_chunks('rides') c; ``` You can also [automate compression][automatic-compression] by adding a [compression policy][add_compression_policy] which will be covered below. 1. Now that you have compressed the table you can compare the size of the dataset before and after compression: ```sql SELECT pg_size_pretty(before_compression_total_bytes) as before, pg_size_pretty(after_compression_total_bytes) as after FROM hypertable_compression_stats('rides'); ``` This shows a significant improvement in data usage: ```sql before | after ---------+-------- 1741 MB | 603 MB ``` ## Add a compression policy To avoid running the compression step each time you have some data to compress you can set up a compression policy. The compression policy allows you to compress data that is older than a particular age, for example, to compress all chunks that are older than 8 days:sql SELECT add_compression_policy('rides', INTERVAL '8 days');
Compression policies run on a regular schedule, by default once every day, which means that you might have up to 9 days of uncompressed data with the setting above. You can find more information on compression policies in the [add_compression_policy][add_compression_policy] section. ## Taking advantage of query speedups Previously, compression was set up to be segmented by `vendor_id` column value. This means fetching data by filtering or grouping on that column will be more efficient. Ordering is also set to time descending so if you run queries which try to order data with that ordering, you should see performance benefits. For instance, if you run the query example from previous section:sql SELECT rate_code, COUNT(vendor_id) AS num_trips FROM rides WHERE pickup_datetime < '2016-01-08' GROUP BY rate_code ORDER BY rate_code;
You should see a decent performance difference when the dataset is compressed and when is decompressed. Try it yourself by running the previous query, decompressing the dataset and running it again while timing the execution time. You can enable timing query times in psql by running:sql
\timingTo decompress the whole dataset, run:sql
SELECT decompress_chunk(c) from show_chunks('rides') c;On an example setup, speedup performance observed was pretty significant, 700 ms when compressed vs 1,2 sec when decompressed. Try it yourself and see what you get! ===== PAGE: https://docs.tigerdata.com/tutorials/blockchain-query/blockchain-compress/ ===== # Compress your data using hypercore Over time you end up with a lot of data. Since this data is mostly immutable, you can compress it to save space and avoid incurring additional cost. TimescaleDB is built for handling event-oriented data such as time-series and fast analytical queries, it comes with support of [hypercore][hypercore] featuring the columnstore. [Hypercore][hypercore] enables you to store the data in a vastly more efficient format allowing up to 90x compression ratio compared to a normal Postgres table. However, this is highly dependent on the data and configuration. [Hypercore][hypercore] is implemented natively in Postgres and does not require special storage formats. When you convert your data from the rowstore to the columnstore, TimescaleDB uses Postgres features to transform the data into columnar format. The use of a columnar format allows a better compression ratio since similar data is stored adjacently. For more details on the columnar format, see [hypercore][hypercore]. A beneficial side effect of compressing data is that certain queries are significantly faster, since less data has to be read into memory. ## Optimize your data in the columnstore To compress the data in the `transactions` table, do the following: 1. Connect to your Tiger Cloud service In [Tiger Cloud Console][services-portal] open an [SQL editor][in-console-editors]. The in-Console editors display the query speed. You can also connect to your service using [psql][connect-using-psql]. 1. Convert data to the columnstore: You can do this either automatically or manually: - [Automatically convert chunks][add_columnstore_policy] in the hypertable to the columnstore at a specific time interval: ```sql CALL add_columnstore_policy('transactions', after => INTERVAL '1d'); ``` - [Manually convert all chunks][convert_to_columnstore] in the hypertable to the columnstore: ```sql DO $$ DECLARE chunk_name TEXT; BEGIN FOR chunk_name IN (SELECT c FROM show_chunks('transactions') c) LOOP RAISE NOTICE 'Converting chunk: %', chunk_name; -- Optional: To see progress CALL convert_to_columnstore(chunk_name); END LOOP; RAISE NOTICE 'Conversion to columnar storage complete for all chunks.'; -- Optional: Completion message END$$; ``` ## Take advantage of query speedups Previously, data in the columnstore was segmented by the `block_id` column value. This means fetching data by filtering or grouping on that column is more efficient. Ordering is set to time descending. This means that when you run queries which try to order data in the same way, you see performance benefits. 1. Connect to your Tiger Cloud service In [Tiger Cloud Console][services-portal] open an [SQL editor][in-console-editors]. The in-Console editors display the query speed. 1. Run the following query:sql WITH recent_blocks AS (
SELECT block_id FROM transactions WHERE is_coinbase IS TRUE ORDER BY time DESC LIMIT 5) SELECT
t.block_id, count(*) AS transaction_count, SUM(weight) AS block_weight, SUM(output_total_usd) AS block_value_usdFROM transactions t INNER JOIN recent_blocks b ON b.block_id = t.block_id WHERE is_coinbase IS NOT TRUE GROUP BY t.block_id;
Performance speedup is of two orders of magnitude, around 15 ms when compressed in the columnstore and 1 second when decompressed in the rowstore. ===== PAGE: https://docs.tigerdata.com/tutorials/blockchain-query/blockchain-dataset/ ===== # Query the Bitcoin blockchain - set up dataset # Ingest data into a Tiger Cloud service This tutorial uses a dataset that contains Bitcoin blockchain data for the past five days, in a hypertable named `transactions`. ## Prerequisites To follow the steps on this page: * Create a target [Tiger Cloud service][create-service] with the Real-time analytics capability. You need [your connection details][connection-info]. This procedure also works for [self-hosted TimescaleDB][enable-timescaledb]. ## Optimize time-series data using hypertables Hypertables are Postgres tables in TimescaleDB that automatically partition your time-series data by time. Time-series data represents the way a system, process, or behavior changes over time. Hypertables enable TimescaleDB to work efficiently with time-series data. Each hypertable is made up of child tables called chunks. Each chunk is assigned a range of time, and only contains data from that range. When you run a query, TimescaleDB identifies the correct chunk and runs the query on it, instead of going through the entire table. [Hypercore][hypercore] is the hybrid row-columnar storage engine in TimescaleDB used by hypertables. Traditional databases force a trade-off between fast inserts (row-based storage) and efficient analytics (columnar storage). Hypercore eliminates this trade-off, allowing real-time analytics without sacrificing transactional capabilities. Hypercore dynamically stores data in the most efficient format for its lifecycle: * **Row-based storage for recent data**: the most recent chunk (and possibly more) is always stored in the rowstore, ensuring fast inserts, updates, and low-latency single record queries. Additionally, row-based storage is used as a writethrough for inserts and updates to columnar storage. * **Columnar storage for analytical performance**: chunks are automatically compressed into the columnstore, optimizing storage efficiency and accelerating analytical queries. Unlike traditional columnar databases, hypercore allows data to be inserted or modified at any stage, making it a flexible solution for both high-ingest transactional workloads and real-time analytics—within a single database. Because TimescaleDB is 100% Postgres, you can use all the standard Postgres tables, indexes, stored procedures, and other objects alongside your hypertables. This makes creating and working with hypertables similar to standard Postgres. 1. Connect to your Tiger Cloud service In [Tiger Cloud Console][services-portal] open an [SQL editor][in-console-editors]. The in-Console editors display the query speed. You can also connect to your service using [psql][connect-using-psql]. 1. Create a [hypertable][hypertables-section] for your time-series data using [CREATE TABLE][hypertable-create-table]. For [efficient queries][secondary-indexes] on data in the columnstore, remember to `segmentby` the column you will use most often to filter your data: ```sql CREATE TABLE transactions ( time TIMESTAMPTZ NOT NULL, block_id INT, hash TEXT, size INT, weight INT, is_coinbase BOOLEAN, output_total BIGINT, output_total_usd DOUBLE PRECISION, fee BIGINT, fee_usd DOUBLE PRECISION, details JSONB ) WITH ( tsdb.hypertable, tsdb.partition_column='time', tsdb.segmentby='block_id', tsdb.orderby='time DESC' ); ``` If you are self-hosting TimescaleDB v2.19.3 and below, create a [Postgres relational table][pg-create-table], then convert it using [create_hypertable][create_hypertable]. You then enable hypercore with a call to [ALTER TABLE][alter_table_hypercore]. 1. Create an index on the `hash` column to make queries for individual transactions faster: ```sql CREATE INDEX hash_idx ON public.transactions USING HASH (hash); ``` 1. Create an index on the `block_id` column to make block-level queries faster: When you create a hypertable, it is partitioned on the time column. TimescaleDB automatically creates an index on the time column. However, you'll often filter your time-series data on other columns as well. You use [indexes][indexing] to improve query performance. ```sql CREATE INDEX block_idx ON public.transactions (block_id); ``` 1. Create a unique index on the `time` and `hash` columns to make sure you don't accidentally insert duplicate records: ```sql CREATE UNIQUE INDEX time_hash_idx ON public.transactions (time, hash); ``` ## Load financial data The dataset contains around 1.5 million Bitcoin transactions, the trades for five days. It includes information about each transaction, along with the value in [satoshi][satoshi-def]. It also states if a trade is a [coinbase][coinbase-def] transaction, and the reward a coin miner receives for mining the coin. To ingest data into the tables that you created, you need to download the dataset and copy the data to your database. 1. Download the `bitcoin_sample.zip` file. The file contains a `.csv` file that contains Bitcoin transactions for the past five days. Download: [bitcoin_sample.zip](https://assets.timescale.com/docs/downloads/bitcoin-blockchain/bitcoin_sample.zip) 1. In a new terminal window, run this command to unzip the `.csv` files: ```bash unzip bitcoin_sample.zip ``` 1. In Terminal, navigate to the folder where you unzipped the Bitcoin transactions, then connect to your service using [psql][connect-using-psql]. 1. At the `psql` prompt, use the `COPY` command to transfer data into your Tiger Cloud service. If the `.csv` files aren't in your current directory, specify the file paths in these commands: ```sql \COPY transactions FROM 'tutorial_bitcoin_sample.csv' CSV HEADER; ``` Because there is over a million rows of data, the `COPY` process could take a few minutes depending on your internet connection and local client resources. ===== PAGE: https://docs.tigerdata.com/tutorials/blockchain-query/beginner-blockchain-query/ ===== # Query the Bitcoin blockchain - query data When you have your dataset loaded, you can start constructing some queries to discover what your data tells you. In this section, you learn how to write queries that answer these questions: * [What are the five most recent coinbase transactions?](#what-are-the-five-most-recent-coinbase-transactions) * [What are the five most recent transactions?](#what-are-the-five-most-recent-transactions) * [What are the five most recent blocks?](#what-are-the-five-most-recent-blocks?) ## What are the five most recent coinbase transactions? In the last procedure, you excluded coinbase transactions from the results. [Coinbase][coinbase-def] transactions are the first transaction in a block, and they include the reward a coin miner receives for mining the coin. To find out the most recent coinbase transactions, you can use a similar `SELECT` statement, but search for transactions that are coinbase instead. If you include the transaction value in US Dollars again, you'll notice that the value is $0 for each. This is because the coin has not transferred ownership in coinbase transactions. ### Finding the five most recent coinbase transactions 1. Connect to the Tiger Cloud service that contains the Bitcoin dataset. 1. At the psql prompt, use this query to select the five most recent coinbase transactions: ```sql SELECT time, hash, block_id, fee_usd FROM transactions WHERE is_coinbase IS TRUE ORDER BY time DESC LIMIT 5; ``` 1. The data you get back looks a bit like this: ```sql time | hash | block_id | fee_usd ------------------------+------------------------------------------------------------------+----------+--------- 2023-06-12 23:54:18+00 | 22e4610bc12d482bc49b7a1c5b27ad18df1a6f34256c16ee7e499b511e02d71e | 794111 | 0 2023-06-12 23:53:08+00 | dde958bb96a302fd956ced32d7b98dd9860ff82d569163968ecfe29de457fedb | 794110 | 0 2023-06-12 23:44:50+00 | 75ac1fa7febe1233ee57ca11180124c5ceb61b230cdbcbcba99aecc6a3e2a868 | 794109 | 0 2023-06-12 23:44:14+00 | 1e941d66b92bf0384514ecb83231854246a94c86ff26270fbdd9bc396dbcdb7b | 794108 | 0 2023-06-12 23:41:08+00 | 60ae50447254d5f4561e1c297ee8171bb999b6310d519a0d228786b36c9ffacf | 794107 | 0 (5 rows) ``` ## What are the five most recent transactions? This dataset contains Bitcoin transactions for the last five days. To find out the most recent transactions in the dataset, you can use a `SELECT` statement. In this case, you want to find transactions that are not coinbase transactions, sort them by time in descending order, and take the top five results. You also want to see the block ID, and the value of the transaction in US Dollars. ### Finding the five most recent transactions 1. Connect to the Tiger Cloud service that contains the Bitcoin dataset. 1. At the psql prompt, use this query to select the five most recent non-coinbase transactions: ```sql SELECT time, hash, block_id, fee_usd FROM transactions WHERE is_coinbase IS NOT TRUE ORDER BY time DESC LIMIT 5; ``` 1. The data you get back looks a bit like this: ```sql time | hash | block_id | fee_usd ------------------------+------------------------------------------------------------------+----------+--------- 2023-06-12 23:54:18+00 | 6f709d52e9aa7b2569a7f8c40e7686026ede6190d0532220a73fdac09deff973 | 794111 | 7.614 2023-06-12 23:54:18+00 | ece5429f4a76b1603aecbee31bf3d05f74142a260e4023316250849fe49115ae | 794111 | 9.306 2023-06-12 23:54:18+00 | 54a196398880a7e2e38312d4285fa66b9c7129f7d14dc68c715d783322544942 | 794111 | 13.1928 2023-06-12 23:54:18+00 | 3e83e68735af556d9385427183e8160516fafe2f30f30405711c4d64bf0778a6 | 794111 | 3.5416 2023-06-12 23:54:18+00 | ca20d073b1082d7700b3706fe2c20bc488d2fc4a9bb006eb4449efe3c3fc6b2b | 794111 | 8.6842 (5 rows) ``` ## What are the five most recent blocks? In this procedure, you use a more complicated query to return the five most recent blocks, and show some additional information about each, including the block weight, number of transactions in each block, and the total block value in US Dollars. ### Finding the five most recent blocks 1. Connect to the Tiger Cloud service that contains the Bitcoin dataset. 1. At the psql prompt, use this query to select the five most recent coinbase transactions: ```sql WITH recent_blocks AS ( SELECT block_id FROM transactions WHERE is_coinbase IS TRUE ORDER BY time DESC LIMIT 5 ) SELECT t.block_id, count(*) AS transaction_count, SUM(weight) AS block_weight, SUM(output_total_usd) AS block_value_usd FROM transactions t INNER JOIN recent_blocks b ON b.block_id = t.block_id WHERE is_coinbase IS NOT TRUE GROUP BY t.block_id; ``` 1. The data you get back looks a bit like this: ```sql block_id | transaction_count | block_weight | block_value_usd ----------+-------------------+--------------+-------------------- 794108 | 5625 | 3991408 | 65222453.36381342 794111 | 5039 | 3991748 | 5966031.481099684 794109 | 6325 | 3991923 | 5406755.801599815 794110 | 2525 | 3995553 | 177249139.6457974 794107 | 4464 | 3991838 | 107348519.36559173 (5 rows) ``` ===== PAGE: https://docs.tigerdata.com/tutorials/OLD-financial-candlestick-tick-data/create-candlestick-aggregates/ ===== # Create candlestick aggregates Turning raw, real-time tick data into aggregated candlestick views is a common task for users who work with financial data. If your data is not tick data, for example if you receive it in an already aggregated form such as 1-min buckets, you can still use these functions to help you create additional aggregates of your data into larger buckets, such as 1-hour or 1-day buckets. If you want to work with pre-aggregated stock and crypto data, see the [Analyzing Intraday Stock Data][intraday-tutorial] tutorial for more examples. TimescaleDB includes [hyperfunctions][hyperfunctions] that you can use to store and query your financial data more easily. Hyperfunctions are SQL functions within TimescaleDB that make it easier to manipulate and analyze time-series data in Postgres with fewer lines of code. There are three hyperfunctions that are essential for calculating candlestick values: [`time_bucket()`][time-bucket], [`FIRST()`][first], and [`LAST()`][last]. The `time_bucket()` hyperfunction helps you aggregate records into buckets of arbitrary time intervals based on the timestamp value. `FIRST()` and `LAST()` help you calculate the opening and closing prices. To calculate highest and lowest prices, you can use the standard Postgres aggregate functions `MIN` and `MAX`. In this first SQL example, use the hyperfunctions to query the tick data, and turn it into 1-min candlestick values in the candlestick format:sql -- Create the candlestick format SELECT
time_bucket('1 min', time) AS bucket, symbol, FIRST(price, time) AS "open", MAX(price) AS high, MIN(price) AS low, LAST(price, time) AS "close", LAST(day_volume, time) AS day_volumeFROM crypto_ticks GROUP BY bucket, symbol
Hyperfunctions in this query: * `time_bucket('1 min', time)`: creates 1-minute buckets * `FIRST(price, time)`: selects the first `price` value in the bucket, ordered by `time`, which is the opening price of the candlestick. * `LAST(price, time)` selects the last `price` value in the bucket, ordered by `time`, which is the closing price of the candlestick Besides the hyperfunctions, you can see other common SQL aggregate functions like `MIN` and `MAX`, which calculate the lowest and highest prices in the candlestick. This tutorial uses the `LAST()` hyperfunction to calculate the volume within a bucket, because the sample tick data already provides an incremental `day_volume` field which contains the total volume for the given day with each trade. Depending on the raw data you receive and whether you want to calculate volume in terms of trade count or the total value of the trades, you might need to use `COUNT(*)`, `SUM(price)`, or subtraction between the last and first values in the bucket to get the correct result. ## Create continuous aggregates for candlestick data In TimescaleDB, the most efficient way to create candlestick views is to use [continuous aggregates][caggs]. Continuous aggregates are very similar to Postgres materialized views but with three major advantages. First, materialized views recreate all of the data any time the view is refreshed, which causes history to be lost. Continuous aggregates only refresh the buckets of aggregated data where the source, raw data has been changed or added. Second, continuous aggregates can be automatically refreshed using built-in, user-configured policies. No special triggers or stored procedures are needed to refresh the data over time. Finally, continuous aggregates are real-time by default. Any new raw tick data that is inserted between refreshes is automatically appended to the materialized data. This keeps your candlestick data up-to-date without having to write special SQL to UNION data from multiple views and tables. Continuous aggregates are often used to power dashboards and other user-facing applications, like price charts, where query performance and timeliness of your data matter. Let's see how to create different candlestick time buckets - 1 minute, 1 hour, and 1 day - using continuous aggregates with different refresh policies. ### 1-minute candlestick To create a continuous aggregate of 1-minute candlestick data, use the same query that you previously used to get the 1-minute OHLCV values. But this time, put the query in a continuous aggregate definition:sql /* 1-min candlestick view*/ CREATE MATERIALIZED VIEW one_min_candle WITH (timescaledb.continuous) AS
SELECT time_bucket('1 min', time) AS bucket, symbol, FIRST(price, time) AS "open", MAX(price) AS high, MIN(price) AS low, LAST(price, time) AS "close", LAST(day_volume, time) AS day_volume FROM crypto_ticks GROUP BY bucket, symbolWhen you run this query, TimescaleDB queries 1-minute aggregate values of all your tick data, creating the continuous aggregate and materializing the results. But your candlestick data has only been materialized up to the last data point. If you want the continuous aggregate to stay up to date as new data comes in over time, you also need to add a continuous aggregate refresh policy. For example, to refresh the continuous aggregate every two minutes:sql /* Refresh the continuous aggregate every two minutes */ SELECT add_continuous_aggregate_policy('one_min_candle',
start_offset => INTERVAL '2 hour', end_offset => INTERVAL '10 sec', schedule_interval => INTERVAL '2 min');The continuous aggregate refreshes every hour, so every hour new candlesticks are materialized, **if there's new raw tick data in the hypertable**. When this job runs, it only refreshes the time period between `start_offset` and `end_offset`, and ignores modifications outside of this window. In most cases, set `end_offset` to be the same or bigger as the time bucket in the continuous aggregate definition. This makes sure that only full buckets get materialized during the refresh process. ### 1-hour candlestick To create a 1-hour candlestick view, follow the same process as in the previous step, except this time set the time bucket value to be one hour in the continuous aggregate definition:sql /* 1-hour candlestick view */ CREATE MATERIALIZED VIEW one_hour_candle WITH (timescaledb.continuous) AS
SELECT time_bucket('1 hour', time) AS bucket, symbol, FIRST(price, time) AS "open", MAX(price) AS high, MIN(price) AS low, LAST(price, time) AS "close", LAST(day_volume, time) AS day_volume FROM crypto_ticks GROUP BY bucket, symbolAdd a refresh policy to refresh the continuous aggregate every hour:sql /* Refresh the continuous aggregate every hour */ SELECT add_continuous_aggregate_policy('one_hour_candle',
start_offset => INTERVAL '1 day', end_offset => INTERVAL '1 min', schedule_interval => INTERVAL '1 hour');Notice how this example uses a different refresh policy with different parameter values to accommodate the 1-hour time bucket in the continuous aggregate definition. The continuous aggregate will refresh every hour, so every hour there will be new candlestick data materialized, if there's new raw tick data in the hypertable. ### 1-day candlestick Create the final view in this tutorial for 1-day candlesticks using the same process as above, using a 1-day time bucket size:sql /* 1-day candlestick */ CREATE MATERIALIZED VIEW one_day_candle WITH (timescaledb.continuous) AS
SELECT time_bucket('1 day', time) AS bucket, symbol, FIRST(price, time) AS "open", MAX(price) AS high, MIN(price) AS low, LAST(price, time) AS "close", LAST(day_volume, time) AS day_volume FROM crypto_ticks GROUP BY bucket, symbolAdd a refresh policy to refresh the continuous aggregate once a day:sql /* Refresh the continuous aggregate every day */ SELECT add_continuous_aggregate_policy('one_day_candle',
start_offset => INTERVAL '3 day', end_offset => INTERVAL '1 day', schedule_interval => INTERVAL '1 day');The refresh job runs every day, and materializes two days' worth of candlesticks. ## Optional: add price change (delta) column in the candlestick view As an optional step, you can add an additional column in the continuous aggregate to calculate the price difference between the opening and closing price within the bucket. In general, you can calculate the price difference with the formula:text (CLOSE PRICE - OPEN PRICE) / OPEN PRICE = delta
Calculate delta in SQL:sql SELECT time_bucket('1 day', time) AS bucket, symbol, (LAST(price, time)-FIRST(price, time))/FIRST(price, time) AS change_pct FROM crypto_ticks WHERE price != 0 GROUP BY bucket, symbol
The full continuous aggregate definition for a 1-day candlestick with a price-change column:sql /* 1-day candlestick with price change column*/ CREATE MATERIALIZED VIEW one_day_candle_delta WITH (timescaledb.continuous) AS
SELECT time_bucket('1 day', time) AS bucket, symbol, FIRST(price, time) AS "open", MAX(price) AS high, MIN(price) AS low, LAST(price, time) AS "close", LAST(day_volume, time) AS day_volume, (LAST(price, time)-FIRST(price, time))/FIRST(price, time) AS change_pct FROM crypto_ticks WHERE price != 0 GROUP BY bucket, symbol## Using multiple continuous aggregates You cannot currently create a continuous aggregate on top of another continuous aggregate. However, this is not necessary in most cases. You can get a similar result and performance by creating multiple continuous aggregates for the same hypertable. Due to the efficient materialization mechanism of continuous aggregates, both refresh and query performance should work well. ===== PAGE: https://docs.tigerdata.com/tutorials/OLD-financial-candlestick-tick-data/query-candlestick-views/ ===== # Query candlestick views So far in this tutorial, you have created the schema to store tick data, and set up multiple candlestick views. In this section, use some example candlestick queries and see how they can be represented in data visualizations. The queries in this section are example queries. The [sample data](https://assets.timescale.com/docs/downloads/crypto_sample.zip) provided with this tutorial is updated on a regular basis to have near-time data, typically no more than a few days old. Our sample queries reflect time filters that might be longer than you would normally use, so feel free to modify the time filter in the `WHERE` clause as the data ages, or as you begin to insert updated tick readings. ## 1-min BTC/USD candlestick chart Start with a `one_min_candle` continuous aggregate, which contains 1-min candlesticks:sql SELECT * FROM one_min_candle WHERE symbol = 'BTC/USD' AND bucket >= NOW() - INTERVAL '24 hour' ORDER BY bucket
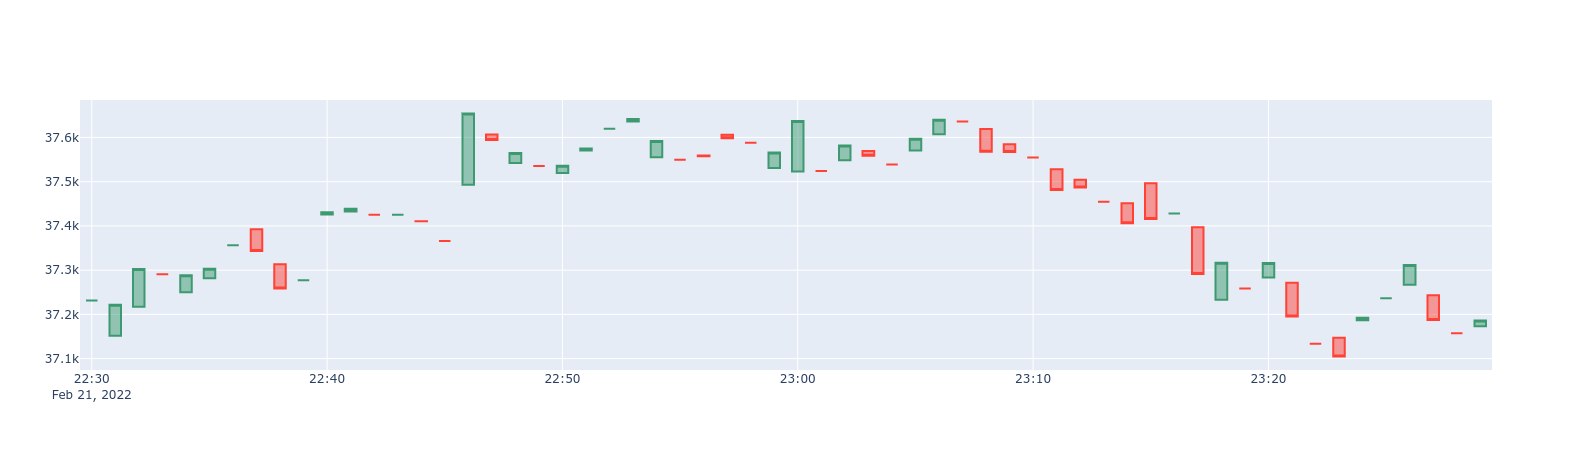 ## 1-hour BTC/USD candlestick chart If you find that 1-min candlesticks are too granular, you can query the `one_hour_candle` continuous aggregate containing 1-hour candlesticks:sql SELECT * FROM one_hour_candle WHERE symbol = 'BTC/USD' AND bucket >= NOW() - INTERVAL '2 day' ORDER BY bucket
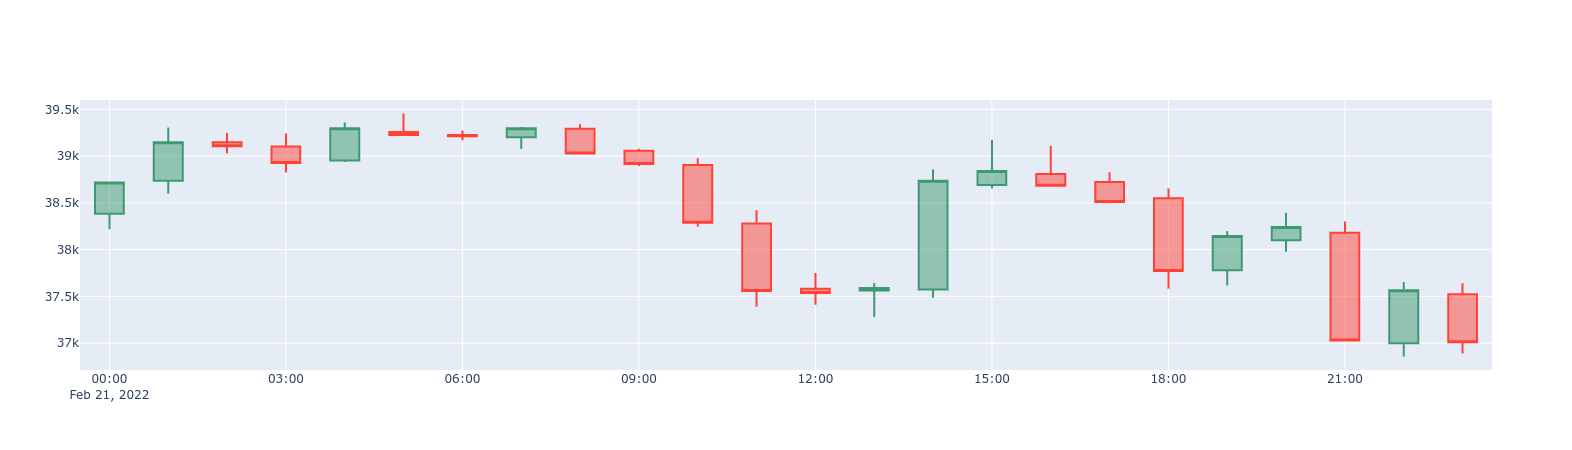 ## 1-day BTC/USD candlestick chart To zoom out even more, query the `one_day_candle` continuous aggregate, which has one-day candlesticks:sql SELECT * FROM one_day_candle WHERE symbol = 'BTC/USD' AND bucket >= NOW() - INTERVAL '14 days' ORDER BY bucket
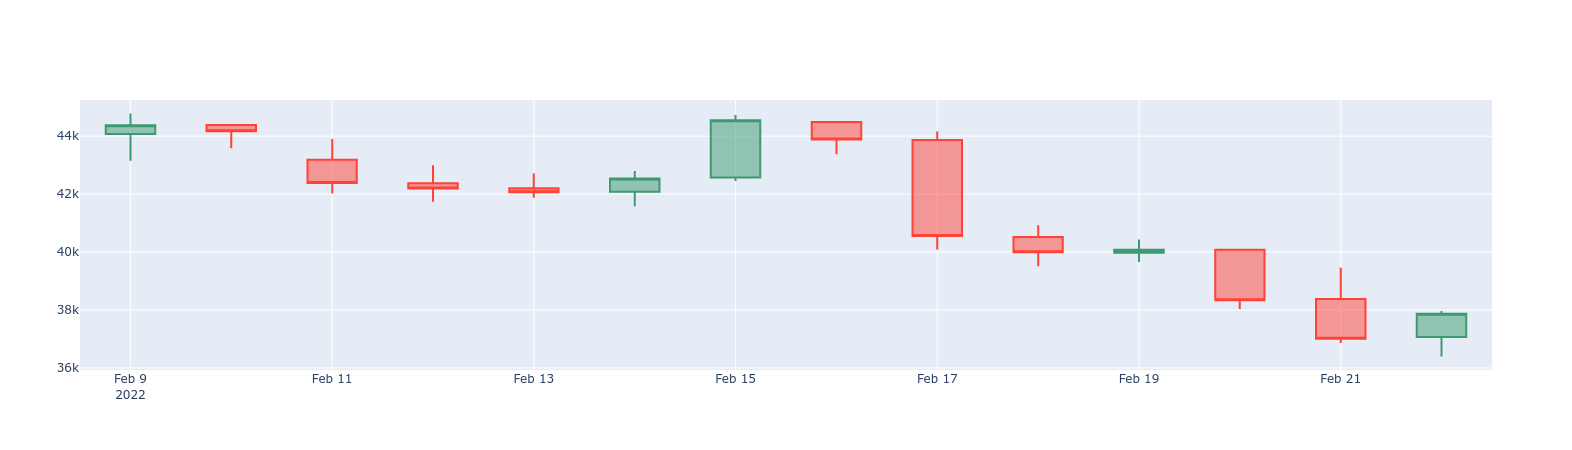 ## BTC vs. ETH 1-day price changes delta line chart You can calculate and visualize the price change differences between two symbols. In a previous example, you saw how to do this by comparing the opening and closing prices. But what if you want to compare today's closing price with yesterday's closing price? Here's an example how you can achieve this by using the [`LAG()`][lag] window function on an already existing candlestick view:sql SELECT *, ("close" - LAG("close", 1) OVER (PARTITION BY symbol ORDER BY bucket)) / "close" AS change_pct FROM one_day_candle WHERE symbol IN ('BTC/USD', 'ETH/USD') AND bucket >= NOW() - INTERVAL '14 days' ORDER BY bucket
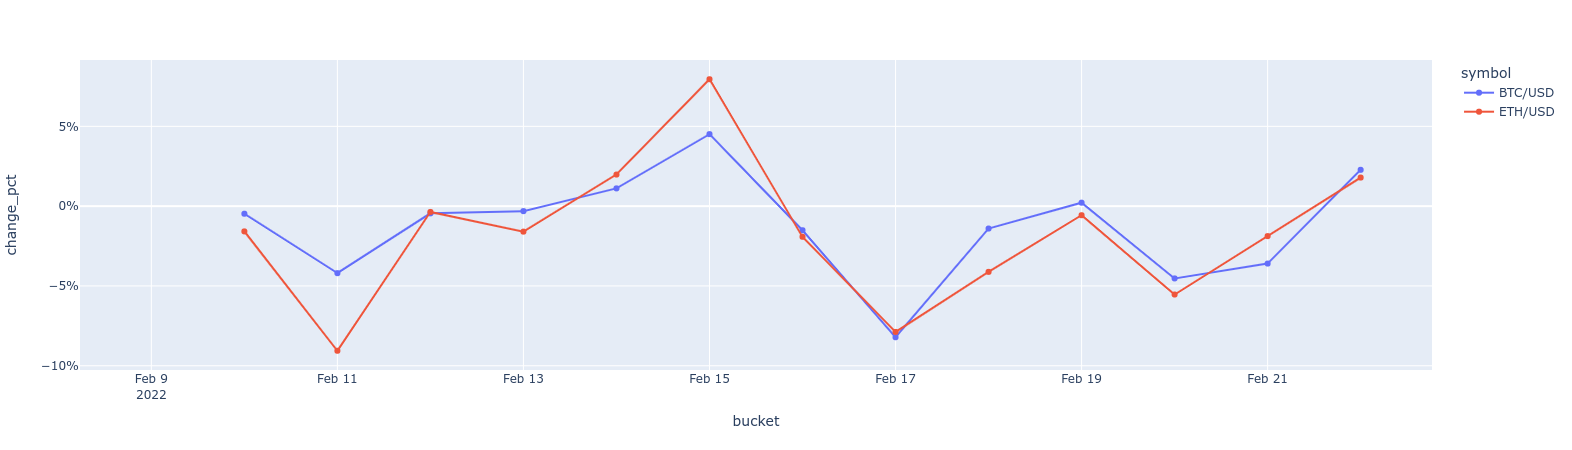 ===== PAGE: https://docs.tigerdata.com/tutorials/OLD-financial-candlestick-tick-data/design-tick-schema/ ===== # Design schema and ingest tick data This tutorial shows you how to store real-time cryptocurrency or stock tick data in TimescaleDB. The initial schema provides the foundation to store tick data only. Once you begin to store individual transactions, you can calculate the candlestick values using TimescaleDB continuous aggregates based on the raw tick data. This means that our initial schema doesn't need to specifically store candlestick data. ## Schema This schema uses two tables: * **crypto_assets**: a relational table that stores the symbols to monitor. You can also include additional information about each symbol, such as social links. * **crypto_ticks**: a time-series table that stores the real-time tick data. **crypto_assets:** |Field|Description| |-|-| |symbol|The symbol of the crypto currency pair, such as BTC/USD| |name|The name of the pair, such as Bitcoin USD| **crypto_ticks:** |Field|Description| |-|-| |time|Timestamp, in UTC time zone| |symbol|Crypto pair symbol from the `crypto_assets` table| |price|The price registered on the exchange at that time| |day_volume|Total volume for the given day (incremental)| Create the tables:sql CREATE TABLE crypto_assets (
symbol TEXT UNIQUE, "name" TEXT);
CREATE TABLE crypto_ticks (
"time" TIMESTAMPTZ, symbol TEXT, price DOUBLE PRECISION, day_volume NUMERIC);
You also need to turn the time-series table into a [hypertable][hypertable]:sql -- convert the regular 'crypto_ticks' table into a TimescaleDB hypertable with 7-day chunks SELECT create_hypertable('crypto_ticks', 'time');
This is an important step in order to efficiently store your time-series data in TimescaleDB. ### Using TIMESTAMP data types It is best practice to store time values using the `TIMESTAMP WITH TIME ZONE` (`TIMESTAMPTZ`) data type. This makes it easier to query your data using different time zones. TimescaleDB stores `TIMESTAMPTZ` values in UTC internally and makes the necessary conversions for your queries. ## Insert tick data With the hypertable and relational table created, download the sample files containing crypto assets and tick data from the last three weeks. Insert the data into your TimescaleDB instance. ### Inserting sample data 1. Download the sample `.csv` files (provided by [Twelve Data][twelve-data]): [crypto_sample.csv](https://assets.timescale.com/docs/downloads/candlestick/crypto_sample.zip) ```bash wget https://assets.timescale.com/docs/downloads/candlestick/crypto_sample.zip ``` 1. Unzip the file and change the directory if you need to: ```bash unzip crypto_sample.zip cd crypto_sample ``` 1. At the `psql` prompt, insert the content of the `.csv` files into the database. ```bash psql -x "postgres://tsdbadmin:{YOUR_PASSWORD_HERE}@{YOUR_HOSTNAME_HERE}:{YOUR_PORT_HERE}/tsdb?sslmode=require" \COPY crypto_assets FROM 'crypto_assets.csv' CSV HEADER; \COPY crypto_ticks FROM 'crypto_ticks.csv' CSV HEADER; ``` If you want to ingest real-time market data, instead of sample data, check out our complementing tutorial Ingest real-time financial websocket data to ingest data directly from the [Twelve Data][twelve-data] financial API. ===== PAGE: https://docs.tigerdata.com/tutorials/OLD-financial-candlestick-tick-data/index/ ===== # Store financial tick data in TimescaleDB using the OHLCV (candlestick) format <!-- markdown-link-check-disable --> [Candlestick charts][charts] are the standard way to analyze the price changes of financial assets. They can be used to examine trends in stock prices, cryptocurrency prices, or even NFT prices. To generate candlestick charts, you need candlestick data in the OHLCV format. That is, you need the Open, High, Low, Close, and Volume data for some financial assets. This tutorial shows you how to efficiently store raw financial tick data, create different candlestick views, and query aggregated data in TimescaleDB using the OHLCV format. It also shows you how to download sample data containing real-world crypto tick transactions for cryptocurrencies like BTC, ETH, and other popular assets. ## Prerequisites Before you begin, make sure you have: * A TimescaleDB instance running locally or on the cloud. For more information, see [the Getting Started guide](https://docs.tigerdata.com/getting-started/latest/) * [`psql`][psql], DBeaver, or any other Postgres client ## What's candlestick data and OHLCV? Candlestick charts are used in the financial sector to visualize the price change of an asset. Each candlestick represents a time frame (for example, 1 minute, 5 minutes, 1 hour, or similar) and shows how the asset's price changed during that time.  Candlestick charts are generated from candlestick data, which is the collection of data points used in the chart. This is often abbreviated as OHLCV (open-high-low-close-volume): * Open: opening price * High: highest price * Low: lowest price * Close: closing price * Volume: volume of transactions These data points correspond to the bucket of time covered by the candlestick. For example, a 1-minute candlestick would need the open and close prices for that minute. Many Tiger Data community members use TimescaleDB to store and analyze candlestick data. Here are some examples: * [How Trading Strategy built a data stack for crypto quant trading][trading-strategy] * [How Messari uses data to open the cryptoeconomy to everyone][messari] * [How I power a (successful) crypto trading bot with TimescaleDB][bot] Follow this tutorial and see how to set up your TimescaleDB database to consume real-time tick or aggregated financial data and generate candlestick views efficiently. * [Design schema and ingest tick data][design] * [Create candlestick (open-high-low-close-volume) aggregates][create] * [Query candlestick views][query] * [Advanced data management][manage] ===== PAGE: https://docs.tigerdata.com/tutorials/OLD-financial-candlestick-tick-data/advanced-data-management/ ===== # Advanced data management The final part of this tutorial shows you some more advanced techniques to efficiently manage your tick and candlestick data long-term. TimescaleDB is equipped with multiple features that help you manage your data lifecycle and reduce your disk storage needs as your data grows. This section contains four examples of how you can set up automation policies on your tick data hypertable and your candlestick continuous aggregates. This can help you save on disk storage and improve the performance of long-range analytical queries by automatically: <!-- vale Google.LyHyphens = NO --> * [Deleting older tick data](#automatically-delete-older-tick-data) * [Deleting older candlestick data](#automatically-delete-older-candlestick-data) * [Compressing tick data](#automatically-compress-tick-data) * [Compressing candlestick data](#automatically-compress-candlestick-data) <!-- vale Google.LyHyphens = YES --> Before you implement any of these automation policies, it's important to have a high-level understanding of chunk time intervals in TimescaleDB hypertables and continuous aggregates. The chunk time interval you set for your tick data table directly affects how these automation policies work. For more information, see the [hypertables and chunks][chunks] section. ## Hypertable chunk time intervals and automation policies TimescaleDB uses hypertables to provide a high-level and familiar abstraction layer to interact with Postgres tables. You just need to access one hypertable to access all of your time-series data. Under the hood, TimescaleDB creates chunks based on the timestamp column. Each chunk size is determined by the [`chunk_time_interval`][interval] parameter. You can provide this parameter when creating the hypertable, or you can change it afterwards. If you don't provide this optional parameter, the chunk time interval defaults to 7 days. This means that each of the chunks in the hypertable contains 7 days' worth of data. Knowing your chunk time interval is important. All of the TimescaleDB automation policies described in this section depend on this information, and the chunk time interval fundamentally affects how these policies impact your data. In this section, learn about these automation policies and how they work in the context of financial tick data. ## Automatically delete older tick data Usually, the older your time-series data, the less relevant and useful it is. This is often the case with tick data as well. As time passes, you might not need the raw tick data any more, because you only want to query the candlestick aggregations. In this scenario, you can decide to remove tick data automatically from your hypertable after it gets older than a certain time interval. TimescaleDB has a built-in way to automatically remove raw data after a specific time. You can set up this automation using a [data retention policy][retention]:sql SELECT add_retention_policy('crypto_ticks', INTERVAL '7 days');
When you run this, it adds a data retention policy to the `crypto_ticks` hypertable that removes a chunk after all the data in the chunk becomes older than 7 days. All records in the chunk need to be older than 7 days before the chunk is dropped. Knowledge of your hypertable's chunk time interval is crucial here. If you were to set a data retention policy with `INTERVAL '3 days'`, the policy would not remove any data after three days, because your chunk time interval is seven days. Even after three days have passed, the most recent chunk still contains data that is newer than three days, and so cannot be removed by the data retention policy. If you want to change this behavior, and drop chunks more often and sooner, experiment with different chunk time intervals. For example, if you set the chunk time interval to be two days only, you could create a retention policy with a 2-day interval that would drop a chunk every other day (assuming you're ingesting data in the meantime). For more information, see the [data retention][retention] section. Make sure none of the continuous aggregate policies intersect with a data retention policy. It's possible to keep the candlestick data in the continuous aggregate and drop tick data from the underlying hypertable, but only if you materialize data in the continuous aggregate first, before the data is dropped from the underlying hypertable. ## Automatically delete older candlestick data Deleting older raw tick data from your hypertable while retaining aggregate views for longer periods is a common way of minimizing disk utilization. However, deleting older candlestick data from the continuous aggregates can provide another method for further control over long-term disk use. TimescaleDB allows you to create data retention policies on continuous aggregates as well. Continuous aggregates also have chunk time intervals because they use hypertables in the background. By default, the continuous aggregate's chunk time interval is 10 times what the original hypertable's chunk time interval is. For example, if the original hypertable's chunk time interval is 7 days, the continuous aggregates that are on top of it will have a 70 day chunk time interval. You can set up a data retention policy to remove old data from your `one_min_candle` continuous aggregate:sql SELECT add_retention_policy('one_min_candle', INTERVAL '70 days');
This data retention policy removes chunks from the continuous aggregate that are older than 70 days. In TimescaleDB, this is determined by the `range_end` property of a hypertable, or in the case of a continuous aggregate, the materialized hypertable. In practice, this means that if you were to define a data retention policy of 30 days for a continuous aggregate that has a `chunk_time_interval` of 70 days, data would not be removed from the continuous aggregates until the `range_end` of a chunk is at least 70 days older than the current time, due to the chunk time interval of the original hypertable. ## Automatically compress tick data TimescaleDB allows you to keep your tick data in the hypertable but still save on storage costs with TimescaleDB's native compression. You need to enable compression on the hypertable and set up a compression policy to automatically compress old data. Enable compression on `crypto_ticks` hypertable:sql ALTER TABLE crypto_ticks SET ( timescaledb.compress, timescaledb.compress_segmentby = 'symbol' );
Set up compression policy to compress data that's older than 7 days:sql SELECT add_compression_policy('crypto_ticks', INTERVAL '7 days');
Executing these two SQL scripts compresses chunks that are older than 7 days. For more information, see the [compression][compression] section. ## Automatically compress candlestick data Beginning with [TimescaleDB 2.6][release-blog], you can also set up a compression policy on your continuous aggregates. This is a useful feature if you store a lot of historical candlestick data that consumes significant disk space, but you still want to retain it for longer periods. Enable compression on the `one_min_candle` view:sql ALTER MATERIALIZED VIEW one_min_candle set (timescaledb.compress = true);
Add a compression policy to compress data after 70 days:sql SELECT add_compression_policy('one_min_candle', compress_after=> INTERVAL '70 days');
Before setting a compression policy on any of the candlestick views, set a refresh policy first. The compression policy interval should be set so that actively refreshed time intervals are not compressed. [Read more about compressing continuous aggregates.][caggs-compress] ===== PAGE: https://docs.tigerdata.com/tutorials/energy-data/dataset-energy/ ===== # Energy time-series data tutorial - set up dataset This tutorial uses the energy consumption data for over a year in a hypertable named `metrics`. ## Prerequisites To follow the steps on this page: * Create a target [Tiger Cloud service][create-service] with the Real-time analytics capability. You need [your connection details][connection-info]. This procedure also works for [self-hosted TimescaleDB][enable-timescaledb]. ## Optimize time-series data in hypertables Hypertables are Postgres tables in TimescaleDB that automatically partition your time-series data by time. Time-series data represents the way a system, process, or behavior changes over time. Hypertables enable TimescaleDB to work efficiently with time-series data. Each hypertable is made up of child tables called chunks. Each chunk is assigned a range of time, and only contains data from that range. When you run a query, TimescaleDB identifies the correct chunk and runs the query on it, instead of going through the entire table. [Hypercore][hypercore] is the hybrid row-columnar storage engine in TimescaleDB used by hypertables. Traditional databases force a trade-off between fast inserts (row-based storage) and efficient analytics (columnar storage). Hypercore eliminates this trade-off, allowing real-time analytics without sacrificing transactional capabilities. Hypercore dynamically stores data in the most efficient format for its lifecycle: * **Row-based storage for recent data**: the most recent chunk (and possibly more) is always stored in the rowstore, ensuring fast inserts, updates, and low-latency single record queries. Additionally, row-based storage is used as a writethrough for inserts and updates to columnar storage. * **Columnar storage for analytical performance**: chunks are automatically compressed into the columnstore, optimizing storage efficiency and accelerating analytical queries. Unlike traditional columnar databases, hypercore allows data to be inserted or modified at any stage, making it a flexible solution for both high-ingest transactional workloads and real-time analytics—within a single database. Because TimescaleDB is 100% Postgres, you can use all the standard Postgres tables, indexes, stored procedures, and other objects alongside your hypertables. This makes creating and working with hypertables similar to standard Postgres. 1. To create a hypertable to store the energy consumption data, call [CREATE TABLE][hypertable-create-table]. ```sql CREATE TABLE "metrics"( created timestamp with time zone default now() not null, type_id integer not null, value double precision not null ) WITH ( tsdb.hypertable, tsdb.partition_column='time' ); ``` If you are self-hosting TimescaleDB v2.19.3 and below, create a [Postgres relational table][pg-create-table], then convert it using [create_hypertable][create_hypertable]. You then enable hypercore with a call to [ALTER TABLE][alter_table_hypercore]. ## Load energy consumption data When you have your database set up, you can load the energy consumption data into the `metrics` hypertable. This is a large dataset, so it might take a long time, depending on your network connection. 1. Download the dataset: [metrics.csv.gz](https://assets.timescale.com/docs/downloads/metrics.csv.gz) 1. Use your file manager to decompress the downloaded dataset, and take a note of the path to the `metrics.csv` file. 1. At the psql prompt, copy the data from the `metrics.csv` file into your hypertable. Make sure you point to the correct path, if it is not in your current working directory: ```sql \COPY metrics FROM metrics.csv CSV; ``` 1. You can check that the data has been copied successfully with this command:sql SELECT * FROM metrics LIMIT 5;
You should get five records that look like this:sql
created | type_id | value-------------------------------+---------+-------
2023-05-31 23:59:59.043264+00 | 13 | 1.78 2023-05-31 23:59:59.042673+00 | 2 | 126 2023-05-31 23:59:59.042667+00 | 11 | 1.79 2023-05-31 23:59:59.042623+00 | 23 | 0.408 2023-05-31 23:59:59.042603+00 | 12 | 0.96## Create continuous aggregates In modern applications, data usually grows very quickly. This means that aggregating it into useful summaries can become very slow. If you are collecting data very frequently, you might want to aggregate your data into minutes or hours instead. For example, if an IoT device takes temperature readings every second, you might want to find the average temperature for each hour. Every time you run this query, the database needs to scan the entire table and recalculate the average. TimescaleDB makes aggregating data lightning fast, accurate, and easy with continuous aggregates.  Continuous aggregates in TimescaleDB are a kind of hypertable that is refreshed automatically in the background as new data is added, or old data is modified. Changes to your dataset are tracked, and the hypertable behind the continuous aggregate is automatically updated in the background. Continuous aggregates have a much lower maintenance burden than regular Postgres materialized views, because the whole view is not created from scratch on each refresh. This means that you can get on with working your data instead of maintaining your database. Because continuous aggregates are based on hypertables, you can query them in exactly the same way as your other tables. This includes continuous aggregates in the rowstore, compressed into the [columnstore][hypercore], or [tiered to object storage][data-tiering]. You can even create [continuous aggregates on top of your continuous aggregates][hierarchical-caggs], for an even more fine-tuned aggregation. [Real-time aggregation][real-time-aggregation] enables you to combine pre-aggregated data from the materialized view with the most recent raw data. This gives you up-to-date results on every query. In TimescaleDB v2.13 and later, real-time aggregates are **DISABLED** by default. In earlier versions, real-time aggregates are **ENABLED** by default; when you create a continuous aggregate, queries to that view include the results from the most recent raw data. 1. **Monitor energy consumption on a day-to-day basis** 1. Create a continuous aggregate `kwh_day_by_day` for energy consumption: ```sql CREATE MATERIALIZED VIEW kwh_day_by_day(time, value) with (timescaledb.continuous) as SELECT time_bucket('1 day', created, 'Europe/Berlin') AS "time", round((last(value, created) - first(value, created)) * 100.) / 100. AS value FROM metrics WHERE type_id = 5 GROUP BY 1; ``` 1. Add a refresh policy to keep `kwh_day_by_day` up-to-date: ```sql SELECT add_continuous_aggregate_policy('kwh_day_by_day', start_offset => NULL, end_offset => INTERVAL '1 hour', schedule_interval => INTERVAL '1 hour'); ``` 1. **Monitor energy consumption on an hourly basis** 1. Create a continuous aggregate `kwh_hour_by_hour` for energy consumption: ```sql CREATE MATERIALIZED VIEW kwh_hour_by_hour(time, value) with (timescaledb.continuous) as SELECT time_bucket('01:00:00', metrics.created, 'Europe/Berlin') AS "time", round((last(value, created) - first(value, created)) * 100.) / 100. AS value FROM metrics WHERE type_id = 5 GROUP BY 1; ``` 1. Add a refresh policy to keep the continuous aggregate up-to-date: ```sql SELECT add_continuous_aggregate_policy('kwh_hour_by_hour', start_offset => NULL, end_offset => INTERVAL '1 hour', schedule_interval => INTERVAL '1 hour'); ``` 1. **Analyze your data** Now you have made continuous aggregates, it could be a good idea to use them to perform analytics on your data. For example, to see how average energy consumption changes during weekdays over the last year, run the following query: ```sql WITH per_day AS ( SELECT time, value FROM kwh_day_by_day WHERE "time" at time zone 'Europe/Berlin' > date_trunc('month', time) - interval '1 year' ORDER BY 1 ), daily AS ( SELECT to_char(time, 'Dy') as day, value FROM per_day ), percentile AS ( SELECT day, approx_percentile(0.50, percentile_agg(value)) as value FROM daily GROUP BY 1 ORDER BY 1 ) SELECT d.day, d.ordinal, pd.value FROM unnest(array['Sun', 'Mon', 'Tue', 'Wed', 'Thu', 'Fri', 'Sat']) WITH ORDINALITY AS d(day, ordinal) LEFT JOIN percentile pd ON lower(pd.day) = lower(d.day); ``` You see something like: | day | ordinal | value | | --- | ------- | ----- | | Mon | 2 | 23.08078714975423 | | Sun | 1 | 19.511430831944395 | | Tue | 3 | 25.003118897837307 | | Wed | 4 | 8.09300571759772 | ## Connect Grafana to Tiger Cloud To visualize the results of your queries, enable Grafana to read the data in your service: 1. **Log in to Grafana** In your browser, log in to either: - Self-hosted Grafana: at `http://localhost:3000/`. The default credentials are `admin`, `admin`. - Grafana Cloud: use the URL and credentials you set when you created your account. 1. **Add your service as a data source** 1. Open `Connections` > `Data sources`, then click `Add new data source`. 1. Select `PostgreSQL` from the list. 1. Configure the connection: - `Host URL`, `Database name`, `Username`, and `Password` Configure using your [connection details][connection-info]. `Host URL` is in the format `<host>:<port>`. - `TLS/SSL Mode`: select `require`. - `PostgreSQL options`: enable `TimescaleDB`. - Leave the default setting for all other fields. 1. Click `Save & test`. Grafana checks that your details are set correctly. ===== PAGE: https://docs.tigerdata.com/tutorials/energy-data/query-energy/ ===== # Energy consumption data tutorial - query the data When you have your dataset loaded, you can start constructing some queries to discover what your data tells you. This tutorial uses [TimescaleDB hyperfunctions][about-hyperfunctions] to construct queries that are not possible in standard Postgres. In this section, you learn how to construct queries, to answer these questions: * [Energy consumption by hour of day](#what-is-the-energy-consumption-by-the-hour-of-the-day) * [Energy consumption by weekday](#what-is-the-energy-consumption-by-the-day-of-the-week). * [Energy consumption by month](#what-is-the-energy-consumption-on-a-monthly-basis). ## What is the energy consumption by the hour of the day? When you have your database set up for energy consumption data, you can construct a query to find the median and the maximum consumption of energy on an hourly basis in a typical day. ### Finding how many kilowatts of energy is consumed on an hourly basis 1. Connect to the Tiger Cloud service that contains the energy consumption dataset. 1. At the psql prompt, use the TimescaleDB Toolkit functionality to get calculate the fiftieth percentile or the median. Then calculate the maximum energy consumed using the standard Postgres max function: ```sql WITH per_hour AS ( SELECT time, value FROM kwh_hour_by_hour WHERE "time" at time zone 'Europe/Berlin' > date_trunc('month', time) - interval '1 year' ORDER BY 1 ), hourly AS ( SELECT extract(HOUR FROM time) * interval '1 hour' as hour, value FROM per_hour ) SELECT hour, approx_percentile(0.50, percentile_agg(value)) as median, max(value) as maximum FROM hourly GROUP BY 1 ORDER BY 1; ``` 1. The data you get back looks a bit like this: ```sql hour | median | maximum ----------+--------------------+--------- 00:00:00 | 0.5998949812512439 | 0.6 01:00:00 | 0.5998949812512439 | 0.6 02:00:00 | 0.5998949812512439 | 0.6 03:00:00 | 1.6015944383271534 | 1.9 04:00:00 | 2.5986701108275327 | 2.7 05:00:00 | 1.4007385207185301 | 3.4 06:00:00 | 0.5998949812512439 | 2.7 07:00:00 | 0.6997720645753496 | 0.8 08:00:00 | 0.6997720645753496 | 0.8 09:00:00 | 0.6997720645753496 | 0.8 10:00:00 | 0.9003240409125329 | 1.1 11:00:00 | 0.8001143897618259 | 0.9 ``` ## What is the energy consumption by the day of the week? You can also check how energy consumption varies between weekends and weekdays. ### Finding energy consumption during the weekdays 1. Connect to the Tiger Cloud service that contains the energy consumption dataset. 1. At the psql prompt, use this query to find difference in consumption during the weekdays and the weekends: ```sql WITH per_day AS ( SELECT time, value FROM kwh_day_by_day WHERE "time" at time zone 'Europe/Berlin' > date_trunc('month', time) - interval '1 year' ORDER BY 1 ), daily AS ( SELECT to_char(time, 'Dy') as day, value FROM per_day ), percentile AS ( SELECT day, approx_percentile(0.50, percentile_agg(value)) as value FROM daily GROUP BY 1 ORDER BY 1 ) SELECT d.day, d.ordinal, pd.value FROM unnest(array['Sun', 'Mon', 'Tue', 'Wed', 'Thu', 'Fri', 'Sat']) WITH ORDINALITY AS d(day, ordinal) LEFT JOIN percentile pd ON lower(pd.day) = lower(d.day); ``` 1. The data you get back looks a bit like this: ```sql day | ordinal | value -----+---------+-------------------- Mon | 2 | 23.08078714975423 Sun | 1 | 19.511430831944395 Tue | 3 | 25.003118897837307 Wed | 4 | 8.09300571759772 Sat | 7 | Fri | 6 | Thu | 5 | ``` ## What is the energy consumption on a monthly basis? You may also want to check the energy consumption that occurs on a monthly basis. ### Finding energy consumption for each month of the year 1. Connect to the Tiger Cloud service that contains the energy consumption dataset. 1. At the psql prompt, use this query to find consumption for each month of the year: ```sql WITH per_day AS ( SELECT time, value FROM kwh_day_by_day WHERE "time" > now() - interval '1 year' ORDER BY 1 ), per_month AS ( SELECT to_char(time, 'Mon') as month, sum(value) as value FROM per_day GROUP BY 1 ) SELECT m.month, m.ordinal, pd.value FROM unnest(array['Jan', 'Feb', 'Mar', 'Apr', 'May', 'Jun', 'Jul', 'Aug', 'Sep', 'Oct', 'Nov', 'Dec']) WITH ORDINALITY AS m(month, ordinal) LEFT JOIN per_month pd ON lower(pd.month) = lower(m.month) ORDER BY ordinal; ``` 1. The data you get back looks a bit like this: ```sql month | ordinal | value -------+---------+------------------- Jan | 1 | Feb | 2 | Mar | 3 | Apr | 4 | May | 5 | 75.69999999999999 Jun | 6 | Jul | 7 | Aug | 8 | Sep | 9 | Oct | 10 | Nov | 11 | Dec | 12 | ``` 1. [](#) To visualize this in Grafana, create a new panel, and select the `Bar Chart` visualization. Select the energy consumption dataset as your data source, and type the query from the previous step. In the `Format as` section, select `Table`. 1. [](#) Select a color scheme so that different consumptions are shown in different colors. In the options panel, under `Standard options`, change the `Color scheme` to a useful `by value` range. <img class="main-content__illustration" src="https://assets.timescale.com/docs/images/grafana-energy.webp" width={1375} height={944} alt="Visualizing energy consumptions in Grafana" /> ===== PAGE: https://docs.tigerdata.com/tutorials/energy-data/index/ ===== # Energy consumption data tutorial When you are planning to switch to a rooftop solar system, it isn't easy, even with a specialist at hand. You need details of your power consumption, typical usage hours, distribution over a year, and other information. Collecting consumption data at the granularity of a few seconds and then getting insights on it is key - and this is what TimescaleDB is best at. This tutorial uses energy consumption data from a typical household for over a year. You construct queries that look at how many watts were consumed, and when. Additionally, you can visualize the energy consumption data in Grafana. ## Prerequisites Before you begin, make sure you have: * Signed up for a [free Tiger Data account][cloud-install]. * [](#) [Signed up for a Grafana account][grafana-setup] to graph queries. ## Steps in this tutorial This tutorial covers: 1. [Setting up your dataset][dataset-energy]: Set up and connect to a Tiger Cloud service, and load data into the database using `psql`. 1. [Querying your dataset][query-energy]: Analyze a dataset containing energy consumption data using Tiger Cloud and Postgres, and visualize the results in Grafana. 1. [Bonus: Store data efficiently][compress-energy]: Learn how to store and query your energy consumption data more efficiently using compression feature of Timescale. ## About querying data with Timescale This tutorial uses sample energy consumption data to show you how to construct queries for time-series data. The analysis you do in this tutorial is similar to the kind of analysis households might use to do things like plan their solar installation, or optimize their energy use over time. It starts by teaching you how to set up and connect to a Tiger Cloud service, create tables, and load data into the tables using `psql`. You then learn how to conduct analysis and monitoring on your dataset. It also walks you through the steps to visualize the results in Grafana. ===== PAGE: https://docs.tigerdata.com/tutorials/energy-data/compress-energy/ ===== # Energy consumption data tutorial - set up compression You have now seen how to create a hypertable for your energy consumption dataset and query it. When ingesting a dataset like this is seldom necessary to update old data and over time the amount of data in the tables grows. Over time you end up with a lot of data and since this is mostly immutable you can compress it to save space and avoid incurring additional cost. It is possible to use disk-oriented compression like the support offered by ZFS and Btrfs but since TimescaleDB is build for handling event-oriented data (such as time-series) it comes with support for compressing data in hypertables. TimescaleDB compression allows you to store the data in a vastly more efficient format allowing up to 20x compression ratio compared to a normal Postgres table, but this is of course highly dependent on the data and configuration. TimescaleDB compression is implemented natively in Postgres and does not require special storage formats. Instead it relies on features of Postgres to transform the data into columnar format before compression. The use of a columnar format allows better compression ratio since similar data is stored adjacently. For more details on how the compression format looks, you can look at the [compression design][compression-design] section. A beneficial side-effect of compressing data is that certain queries are significantly faster since less data has to be read into memory. ## Compression setup 1. Connect to the Tiger Cloud service that contains the energy dataset using, for example `psql`. 1. Enable compression on the table and pick suitable segment-by and order-by column using the `ALTER TABLE` command: ```sql ALTER TABLE metrics SET ( timescaledb.compress, timescaledb.compress_segmentby='type_id', timescaledb.compress_orderby='created DESC' ); ``` Depending on the choice if segment-by and order-by column you can get very different performance and compression ratio. To learn more about how to pick the correct columns, see [here][segment-by-columns]. 1. You can manually compress all the chunks of the hypertable using `compress_chunk` in this manner: ```sql SELECT compress_chunk(c) from show_chunks('metrics') c; ``` You can also [automate compression][automatic-compression] by adding a [compression policy][add_compression_policy] which will be covered below. 1. Now that you have compressed the table you can compare the size of the dataset before and after compression: ```sql SELECT pg_size_pretty(before_compression_total_bytes) as before, pg_size_pretty(after_compression_total_bytes) as after FROM hypertable_compression_stats('metrics'); ``` This shows a significant improvement in data usage: ```sql before | after --------+------- 180 MB | 16 MB (1 row) ``` ## Add a compression policy To avoid running the compression step each time you have some data to compress you can set up a compression policy. The compression policy allows you to compress data that is older than a particular age, for example, to compress all chunks that are older than 8 days:sql SELECT add_compression_policy('metrics', INTERVAL '8 days');
Compression policies run on a regular schedule, by default once every day, which means that you might have up to 9 days of uncompressed data with the setting above. You can find more information on compression policies in the [add_compression_policy][add_compression_policy] section. ## Taking advantage of query speedups Previously, compression was set up to be segmented by `type_id` column value. This means fetching data by filtering or grouping on that column will be more efficient. Ordering is also set to `created` descending so if you run queries which try to order data with that ordering, you should see performance benefits. For instance, if you run the query example from previous section:sql SELECT time_bucket('1 day', created, 'Europe/Berlin') AS "time",
round((last(value, created) - first(value, created)) *100.) / 100. AS value FROM metrics WHERE type_id = 5 GROUP BY 1;
You should see a decent performance difference when the dataset is compressed and when is decompressed. Try it yourself by running the previous query, decompressing the dataset and running it again while timing the execution time. You can enable timing query times in psql by running:sql
\timingTo decompress the whole dataset, run:sql
SELECT decompress_chunk(c) from show_chunks('metrics') c;On an example setup, speedup performance observed was an order of magnitude, 30 ms when compressed vs 360 ms when decompressed. Try it yourself and see what you get! ===== PAGE: https://docs.tigerdata.com/tutorials/financial-ingest-real-time/financial-ingest-dataset/ ===== # Ingest real-time financial websocket data - Set up the dataset This tutorial uses a dataset that contains second-by-second stock-trade data for the top 100 most-traded symbols, in a hypertable named `stocks_real_time`. It also includes a separate table of company symbols and company names, in a regular Postgres table named `company`. ## Prerequisites To follow the steps on this page: * Create a target [Tiger Cloud service][create-service] with the Real-time analytics capability. You need [your connection details][connection-info]. This procedure also works for [self-hosted TimescaleDB][enable-timescaledb]. ## Connect to the websocket server When you connect to the Twelve Data API through a websocket, you create a persistent connection between your computer and the websocket server. You set up a Python environment, and pass two arguments to create a websocket object and establish the connection. ### Set up a new Python environment Create a new Python virtual environment for this project and activate it. All the packages you need to complete for this tutorial are installed in this environment. 1. Create and activate a Python virtual environment: ```bash virtualenv env source env/bin/activate ``` 1. Install the Twelve Data Python [wrapper library][twelve-wrapper] with websocket support. This library allows you to make requests to the API and maintain a stable websocket connection. ```bash pip install twelvedata websocket-client ``` 1. Install [Psycopg2][psycopg2] so that you can connect the TimescaleDB from your Python script: ```bash pip install psycopg2-binary ``` ### Create the websocket connection A persistent connection between your computer and the websocket server is used to receive data for as long as the connection is maintained. You need to pass two arguments to create a websocket object and establish connection. #### Websocket arguments * `on_event` This argument needs to be a function that is invoked whenever there's a new data record is received from the websocket: ```python def on_event(event): print(event) # prints out the data record (dictionary) ``` This is where you want to implement the ingestion logic so whenever there's new data available you insert it into the database. * `symbols` This argument needs to be a list of stock ticker symbols (for example, `MSFT`) or crypto trading pairs (for example, `BTC/USD`). When using a websocket connection you always need to subscribe to the events you want to receive. You can do this by using the `symbols` argument or if your connection is already created you can also use the `subscribe()` function to get data for additional symbols. ### Connect to the websocket server 1. Create a new Python file called `websocket_test.py` and connect to the Twelve Data servers using the `<YOUR_API_KEY>`: ```python import time from twelvedata import TDClient messages_history = [] def on_event(event): print(event) # prints out the data record (dictionary) messages_history.append(event) td = TDClient(apikey="<YOUR_API_KEY>") ws = td.websocket(symbols=["BTC/USD", "ETH/USD"], on_event=on_event) ws.subscribe(['ETH/BTC', 'AAPL']) ws.connect() while True: print('messages received: ', len(messages_history)) ws.heartbeat() time.sleep(10) ``` 1. Run the Python script: ```bash python websocket_test.py ``` 1. When you run the script, you receive a response from the server about the status of your connection: ```bash {'event': 'subscribe-status', 'status': 'ok', 'success': [ {'symbol': 'BTC/USD', 'exchange': 'Coinbase Pro', 'mic_code': 'Coinbase Pro', 'country': '', 'type': 'Digital Currency'}, {'symbol': 'ETH/USD', 'exchange': 'Huobi', 'mic_code': 'Huobi', 'country': '', 'type': 'Digital Currency'} ], 'fails': None } ``` When you have established a connection to the websocket server, wait a few seconds, and you can see data records, like this: ```bash {'event': 'price', 'symbol': 'BTC/USD', 'currency_base': 'Bitcoin', 'currency_quote': 'US Dollar', 'exchange': 'Coinbase Pro', 'type': 'Digital Currency', 'timestamp': 1652438893, 'price': 30361.2, 'bid': 30361.2, 'ask': 30361.2, 'day_volume': 49153} {'event': 'price', 'symbol': 'BTC/USD', 'currency_base': 'Bitcoin', 'currency_quote': 'US Dollar', 'exchange': 'Coinbase Pro', 'type': 'Digital Currency', 'timestamp': 1652438896, 'price': 30380.6, 'bid': 30380.6, 'ask': 30380.6, 'day_volume': 49157} {'event': 'heartbeat', 'status': 'ok'} {'event': 'price', 'symbol': 'ETH/USD', 'currency_base': 'Ethereum', 'currency_quote': 'US Dollar', 'exchange': 'Huobi', 'type': 'Digital Currency', 'timestamp': 1652438899, 'price': 2089.07, 'bid': 2089.02, 'ask': 2089.03, 'day_volume': 193818} {'event': 'price', 'symbol': 'BTC/USD', 'currency_base': 'Bitcoin', 'currency_quote': 'US Dollar', 'exchange': 'Coinbase Pro', 'type': 'Digital Currency', 'timestamp': 1652438900, 'price': 30346.0, 'bid': 30346.0, 'ask': 30346.0, 'day_volume': 49167} ``` Each price event gives you multiple data points about the given trading pair such as the name of the exchange, and the current price. You can also occasionally see `heartbeat` events in the response; these events signal the health of the connection over time. At this point the websocket connection is working successfully to pass data. ## Optimize time-series data in a hypertable Hypertables are Postgres tables in TimescaleDB that automatically partition your time-series data by time. Time-series data represents the way a system, process, or behavior changes over time. Hypertables enable TimescaleDB to work efficiently with time-series data. Each hypertable is made up of child tables called chunks. Each chunk is assigned a range of time, and only contains data from that range. When you run a query, TimescaleDB identifies the correct chunk and runs the query on it, instead of going through the entire table. [Hypercore][hypercore] is the hybrid row-columnar storage engine in TimescaleDB used by hypertables. Traditional databases force a trade-off between fast inserts (row-based storage) and efficient analytics (columnar storage). Hypercore eliminates this trade-off, allowing real-time analytics without sacrificing transactional capabilities. Hypercore dynamically stores data in the most efficient format for its lifecycle: * **Row-based storage for recent data**: the most recent chunk (and possibly more) is always stored in the rowstore, ensuring fast inserts, updates, and low-latency single record queries. Additionally, row-based storage is used as a writethrough for inserts and updates to columnar storage. * **Columnar storage for analytical performance**: chunks are automatically compressed into the columnstore, optimizing storage efficiency and accelerating analytical queries. Unlike traditional columnar databases, hypercore allows data to be inserted or modified at any stage, making it a flexible solution for both high-ingest transactional workloads and real-time analytics—within a single database. Because TimescaleDB is 100% Postgres, you can use all the standard Postgres tables, indexes, stored procedures, and other objects alongside your hypertables. This makes creating and working with hypertables similar to standard Postgres. 1. **Connect to your Tiger Cloud service** In [Tiger Cloud Console][services-portal] open an [SQL editor][in-console-editors]. You can also connect to your service using [psql][connect-using-psql]. 1. **Create a hypertable to store the real-time cryptocurrency data** Create a [hypertable][hypertables-section] for your time-series data using [CREATE TABLE][hypertable-create-table]. For [efficient queries][secondary-indexes] on data in the columnstore, remember to `segmentby` the column you will use most often to filter your data: ```sql CREATE TABLE crypto_ticks ( "time" TIMESTAMPTZ, symbol TEXT, price DOUBLE PRECISION, day_volume NUMERIC ) WITH ( tsdb.hypertable, tsdb.partition_column='time', tsdb.segmentby='symbol', tsdb.orderby='time DESC' ); ``` If you are self-hosting TimescaleDB v2.19.3 and below, create a [Postgres relational table][pg-create-table], then convert it using [create_hypertable][create_hypertable]. You then enable hypercore with a call to [ALTER TABLE][alter_table_hypercore]. ## Create a standard Postgres table for relational data When you have relational data that enhances your time-series data, store that data in standard Postgres relational tables. 1. **Add a table to store the asset symbol and name in a relational table** ```sql CREATE TABLE crypto_assets ( symbol TEXT UNIQUE, "name" TEXT ); ``` You now have two tables within your Tiger Cloud service. A hypertable named `crypto_ticks`, and a normal Postgres table named `crypto_assets`. When you ingest data into a transactional database like Timescale, it is more efficient to insert data in batches rather than inserting data row-by-row. Using one transaction to insert multiple rows can significantly increase the overall ingest capacity and speed of your Tiger Cloud service. ## Batching in memory A common practice to implement batching is to store new records in memory first, then after the batch reaches a certain size, insert all the records from memory into the database in one transaction. The perfect batch size isn't universal, but you can experiment with different batch sizes (for example, 100, 1000, 10000, and so on) and see which one fits your use case better. Using batching is a fairly common pattern when ingesting data into TimescaleDB from Kafka, Kinesis, or websocket connections. To ingest the data into your Tiger Cloud service, you need to implement the `on_event` function. After the websocket connection is set up, you can use the `on_event` function to ingest data into the database. This is a data pipeline that ingests real-time financial data into your Tiger Cloud service. You can implement a batching solution in Python with Psycopg2. You can implement the ingestion logic within the `on_event` function that you can then pass over to the websocket object. This function needs to: 1. Check if the item is a data item, and not websocket metadata. 1. Adjust the data so that it fits the database schema, including the data types, and order of columns. 1. Add it to the in-memory batch, which is a list in Python. 1. If the batch reaches a certain size, insert the data, and reset or empty the list. ## Ingest data in real-time 1. Update the Python script that prints out the current batch size, so you can follow when data gets ingested from memory into your database. Use the `<HOST>`, `<PASSWORD>`, and `<PORT>` details for the Tiger Cloud service where you want to ingest the data and your API key from Twelve Data: ```python import time import psycopg2 from twelvedata import TDClient from psycopg2.extras import execute_values from datetime import datetime class WebsocketPipeline(): DB_TABLE = "stocks_real_time" DB_COLUMNS=["time", "symbol", "price", "day_volume"] MAX_BATCH_SIZE=100 def __init__(self, conn): """Connect to the Twelve Data web socket server and stream data into the database. Args: conn: psycopg2 connection object """ self.conn = conn self.current_batch = [] self.insert_counter = 0 def _insert_values(self, data): if self.conn is not None: cursor = self.conn.cursor() sql = f""" INSERT INTO {self.DB_TABLE} ({','.join(self.DB_COLUMNS)}) VALUES %s;""" execute_values(cursor, sql, data) self.conn.commit() def _on_event(self, event): """This function gets called whenever there's a new data record coming back from the server. Args: event (dict): data record """ if event["event"] == "price": timestamp = datetime.utcfromtimestamp(event["timestamp"]) data = (timestamp, event["symbol"], event["price"], event.get("day_volume")) self.current_batch.append(data) print(f"Current batch size: {len(self.current_batch)}") if len(self.current_batch) == self.MAX_BATCH_SIZE: self._insert_values(self.current_batch) self.insert_counter += 1 print(f"Batch insert #{self.insert_counter}") self.current_batch = [] def start(self, symbols): """Connect to the web socket server and start streaming real-time data into the database. Args: symbols (list of symbols): List of stock/crypto symbols """ td = TDClient(apikey="<YOUR_API_KEY") ws = td.websocket(on_event=self._on_event) ws.subscribe(symbols) ws.connect() while True: ws.heartbeat() time.sleep(10) onn = psycopg2.connect(database="tsdb", host="<HOST>", user="tsdbadmin", password="<PASSWORD>", port="<PORT>") symbols = ["BTC/USD", "ETH/USD", "MSFT", "AAPL"] websocket = WebsocketPipeline(conn) websocket.start(symbols=symbols) ``` 1. Run the script: ```bash python websocket_test.py ``` You can even create separate Python scripts to start multiple websocket connections for different types of symbols, for example, one for stock, and another one for cryptocurrency prices. ### Troubleshooting If you see an error message similar to this:bash 2022-05-13 18:51:41,976 - ws-twelvedata - ERROR - TDWebSocket ERROR: Handshake status 200 OK
Then check that you use a proper API key received from Twelve Data. ## Connect Grafana to Tiger Cloud To visualize the results of your queries, enable Grafana to read the data in your service: 1. **Log in to Grafana** In your browser, log in to either: - Self-hosted Grafana: at `http://localhost:3000/`. The default credentials are `admin`, `admin`. - Grafana Cloud: use the URL and credentials you set when you created your account. 1. **Add your service as a data source** 1. Open `Connections` > `Data sources`, then click `Add new data source`. 1. Select `PostgreSQL` from the list. 1. Configure the connection: - `Host URL`, `Database name`, `Username`, and `Password` Configure using your [connection details][connection-info]. `Host URL` is in the format `<host>:<port>`. - `TLS/SSL Mode`: select `require`. - `PostgreSQL options`: enable `TimescaleDB`. - Leave the default setting for all other fields. 1. Click `Save & test`. Grafana checks that your details are set correctly. ===== PAGE: https://docs.tigerdata.com/tutorials/financial-ingest-real-time/financial-ingest-query/ ===== # Ingest real-time financial websocket data - Query the data To look at OHLCV values, the most effective way is to create a continuous aggregate. You can create a continuous aggregate to aggregate data for each hour, then set the aggregate to refresh every hour, and aggregate the last two hours' worth of data. ## Creating a continuous aggregate 1. Connect to the Tiger Cloud service `tsdb` that contains the Twelve Data stocks dataset. 1. At the psql prompt, create the continuous aggregate to aggregate data every minute: ```sql CREATE MATERIALIZED VIEW one_hour_candle WITH (timescaledb.continuous) AS SELECT time_bucket('1 hour', time) AS bucket, symbol, FIRST(price, time) AS "open", MAX(price) AS high, MIN(price) AS low, LAST(price, time) AS "close", LAST(day_volume, time) AS day_volume FROM crypto_ticks GROUP BY bucket, symbol; ``` When you create the continuous aggregate, it refreshes by default. 1. Set a refresh policy to update the continuous aggregate every hour, if there is new data available in the hypertable for the last two hours: ```sql SELECT add_continuous_aggregate_policy('one_hour_candle', start_offset => INTERVAL '3 hours', end_offset => INTERVAL '1 hour', schedule_interval => INTERVAL '1 hour'); ``` ## Query the continuous aggregate When you have your continuous aggregate set up, you can query it to get the OHLCV values. ### Querying the continuous aggregate 1. Connect to the Tiger Cloud service that contains the Twelve Data stocks dataset. 1. At the psql prompt, use this query to select all `AAPL` OHLCV data for the past 5 hours, by time bucket: ```sql SELECT * FROM one_hour_candle WHERE symbol = 'AAPL' AND bucket >= NOW() - INTERVAL '5 hours' ORDER BY bucket; ``` The result of the query looks like this: ```sql bucket | symbol | open | high | low | close | day_volume ------------------------+---------+---------+---------+---------+---------+------------ 2023-05-30 08:00:00+00 | AAPL | 176.31 | 176.31 | 176 | 176.01 | 2023-05-30 08:01:00+00 | AAPL | 176.27 | 176.27 | 176.02 | 176.2 | 2023-05-30 08:06:00+00 | AAPL | 176.03 | 176.04 | 175.95 | 176 | 2023-05-30 08:07:00+00 | AAPL | 175.95 | 176 | 175.82 | 175.91 | 2023-05-30 08:08:00+00 | AAPL | 175.92 | 176.02 | 175.8 | 176.02 | 2023-05-30 08:09:00+00 | AAPL | 176.02 | 176.02 | 175.9 | 175.98 | 2023-05-30 08:10:00+00 | AAPL | 175.98 | 175.98 | 175.94 | 175.94 | 2023-05-30 08:11:00+00 | AAPL | 175.94 | 175.94 | 175.91 | 175.91 | 2023-05-30 08:12:00+00 | AAPL | 175.9 | 175.94 | 175.9 | 175.94 | ``` ## Graph OHLCV data When you have extracted the raw OHLCV data, you can use it to graph the result in a candlestick chart, using Grafana. To do this, you need to have Grafana set up to connect to your self-hosted TimescaleDB instance. ### Graphing OHLCV data 1. Ensure you have Grafana installed, and you are using the TimescaleDB database that contains the Twelve Data dataset set up as a data source. 1. In Grafana, from the `Dashboards` menu, click `New Dashboard`. In the `New Dashboard` page, click `Add a new panel`. 1. In the `Visualizations` menu in the top right corner, select `Candlestick` from the list. Ensure you have set the Twelve Data dataset as your data source. 1. Click `Edit SQL` and paste in the query you used to get the OHLCV values. 1. In the `Format as` section, select `Table`. 1. Adjust elements of the table as required, and click `Apply` to save your graph to the dashboard. <img class="main-content__illustration" width={1375} height={944} src="https://assets.timescale.com/docs/images/Grafana_candlestick_1day.webp" alt="Creating a candlestick graph in Grafana using 1-day OHLCV tick data" /> ===== PAGE: https://docs.tigerdata.com/tutorials/nyc-taxi-geospatial/dataset-nyc/ ===== # Plot geospatial time-series data tutorial - set up dataset This tutorial uses a dataset that contains historical data from the New York City Taxi and Limousine Commission [NYC TLC][nyc-tlc], in a hypertable named `rides`. It also includes a separate tables of payment types and rates, in a regular Postgres table named `payment_types`, and `rates`. ## Prerequisites To follow the steps on this page: * Create a target [Tiger Cloud service][create-service] with the Real-time analytics capability. You need [your connection details][connection-info]. This procedure also works for [self-hosted TimescaleDB][enable-timescaledb]. ## Optimize time-series data in hypertables Time-series data represents how a system, process, or behavior changes over time. [Hypertables][hypertables-section] are Postgres tables that help you improve insert and query performance by automatically partitioning your data by time. Each hypertable is made up of child tables called chunks. Each chunk is assigned a range of time, and only contains data from that range. Hypertables exist alongside regular Postgres tables. You interact with hypertables and regular Postgres tables in the same way. You use regular Postgres tables for relational data. 1. **Create a hypertable to store the taxi trip data** ```sql CREATE TABLE "rides"( vendor_id TEXT, pickup_datetime TIMESTAMP WITHOUT TIME ZONE NOT NULL, dropoff_datetime TIMESTAMP WITHOUT TIME ZONE NOT NULL, passenger_count NUMERIC, trip_distance NUMERIC, pickup_longitude NUMERIC, pickup_latitude NUMERIC, rate_code INTEGER, dropoff_longitude NUMERIC, dropoff_latitude NUMERIC, payment_type INTEGER, fare_amount NUMERIC, extra NUMERIC, mta_tax NUMERIC, tip_amount NUMERIC, tolls_amount NUMERIC, improvement_surcharge NUMERIC, total_amount NUMERIC ) WITH ( tsdb.hypertable, tsdb.partition_column='pickup_datetime', tsdb.create_default_indexes=false ); ``` If you are self-hosting TimescaleDB v2.19.3 and below, create a [Postgres relational table][pg-create-table], then convert it using [create_hypertable][create_hypertable]. You then enable hypercore with a call to [ALTER TABLE][alter_table_hypercore]. 1. **Add another dimension to partition your hypertable more efficiently** ```sql SELECT add_dimension('rides', by_hash('payment_type', 2)); ``` 1. **Create an index to support efficient queries** Index by vendor, rate code, and passenger count: ```sql CREATE INDEX ON rides (vendor_id, pickup_datetime DESC); CREATE INDEX ON rides (rate_code, pickup_datetime DESC); CREATE INDEX ON rides (passenger_count, pickup_datetime DESC); ``` ## Create standard Postgres tables for relational data When you have other relational data that enhances your time-series data, you can create standard Postgres tables just as you would normally. For this dataset, there are two other tables of data, called `payment_types` and `rates`. 1. **Add a relational table to store the payment types data** ```sql CREATE TABLE IF NOT EXISTS "payment_types"( payment_type INTEGER, description TEXT ); INSERT INTO payment_types(payment_type, description) VALUES (1, 'credit card'), (2, 'cash'), (3, 'no charge'), (4, 'dispute'), (5, 'unknown'), (6, 'voided trip'); ``` 1. **Add a relational table to store the rates data** ```sql CREATE TABLE IF NOT EXISTS "rates"( rate_code INTEGER, description TEXT ); INSERT INTO rates(rate_code, description) VALUES (1, 'standard rate'), (2, 'JFK'), (3, 'Newark'), (4, 'Nassau or Westchester'), (5, 'negotiated fare'), (6, 'group ride'); ``` You can confirm that the scripts were successful by running the `\dt` command in the `psql` command line. You should see this:sql
List of relationsSchema | Name | Type | Owner --------+---------------+-------+---------- public | payment_types | table | tsdbadmin public | rates | table | tsdbadmin public | rides | table | tsdbadmin (3 rows)
## Load trip data When you have your database set up, you can load the taxi trip data into the `rides` hypertable. This is a large dataset, so it might take a long time, depending on your network connection. 1. Download the dataset: [nyc_data.tar.gz](https://assets.timescale.com/docs/downloads/nyc_data.tar.gz) 1. Use your file manager to decompress the downloaded dataset, and take a note of the path to the `nyc_data_rides.csv` file. 1. At the psql prompt, copy the data from the `nyc_data_rides.csv` file into your hypertable. Make sure you point to the correct path, if it is not in your current working directory: ```sql \COPY rides FROM nyc_data_rides.csv CSV; ``` You can check that the data has been copied successfully with this command:sql SELECT * FROM rides LIMIT 5;
You should get five records that look like this:sql -[ RECORD 1 ]---------+-------------------- vendor_id | 1 pickup_datetime | 2016-01-01 00:00:01 dropoff_datetime | 2016-01-01 00:11:55 passenger_count | 1 trip_distance | 1.20 pickup_longitude | -73.979423522949219 pickup_latitude | 40.744613647460938 rate_code | 1 dropoff_longitude | -73.992034912109375 dropoff_latitude | 40.753944396972656 payment_type | 2 fare_amount | 9 extra | 0.5 mta_tax | 0.5 tip_amount | 0 tolls_amount | 0 improvement_surcharge | 0.3 total_amount | 10.3
## Connect Grafana to Tiger Cloud To visualize the results of your queries, enable Grafana to read the data in your service: 1. **Log in to Grafana** In your browser, log in to either: - Self-hosted Grafana: at `http://localhost:3000/`. The default credentials are `admin`, `admin`. - Grafana Cloud: use the URL and credentials you set when you created your account. 1. **Add your service as a data source** 1. Open `Connections` > `Data sources`, then click `Add new data source`. 1. Select `PostgreSQL` from the list. 1. Configure the connection: - `Host URL`, `Database name`, `Username`, and `Password` Configure using your [connection details][connection-info]. `Host URL` is in the format `<host>:<port>`. - `TLS/SSL Mode`: select `require`. - `PostgreSQL options`: enable `TimescaleDB`. - Leave the default setting for all other fields. 1. Click `Save & test`. Grafana checks that your details are set correctly. ===== PAGE: https://docs.tigerdata.com/tutorials/nyc-taxi-geospatial/index/ ===== # Plot geospatial time-series data tutorial New York City is home to about 9 million people. This tutorial uses historical data from New York's yellow taxi network, provided by the New York City Taxi and Limousine Commission [NYC TLC][nyc-tlc]. The NYC TLC tracks over 200,000 vehicles making about 1 million trips each day. Because nearly all of this data is time-series data, proper analysis requires a purpose-built time-series database, like Timescale. In the [beginner NYC taxis tutorial][beginner-fleet], you looked at constructing queries that looked at how many rides were taken, and when. The NYC taxi cab dataset also contains information about where each ride was picked up. This is geospatial data, and you can use a Postgres extension called PostGIS to examine where rides are originating from. Additionally, you can visualize the data in Grafana, by overlaying it on a map. ## Prerequisites Before you begin, make sure you have: * Signed up for a [free Tiger Data account][cloud-install]. * [](#) If you want to graph your queries, signed up for a [Grafana account][grafana-setup]. ## Steps in this tutorial This tutorial covers: 1. [Setting up your dataset][dataset-nyc]: Set up and connect to a Timescale service, and load data into your database using `psql`. 1. [Querying your dataset][query-nyc]: Analyze a dataset containing NYC taxi trip data using Tiger Cloud and Postgres, and plot the results in Grafana. ## About querying data with Timescale This tutorial uses the [NYC taxi data][nyc-tlc] to show you how to construct queries for geospatial time-series data. The analysis you do in this tutorial is similar to the kind of analysis civic organizations do to plan new roads and public services. It starts by teaching you how to set up and connect to a Tiger Cloud service, create tables, and load data into the tables using `psql`. If you have already completed the [first NYC taxis tutorial][beginner-fleet], then you already have the dataset loaded, and you can skip [straight to the queries][plot-nyc]. You then learn how to conduct analysis and monitoring on your dataset. It walks you through using Postgres queries with the PostGIS extension to obtain information, and plotting the results in Grafana. ===== PAGE: https://docs.tigerdata.com/tutorials/nyc-taxi-geospatial/plot-nyc/ ===== # Plot geospatial time-series data tutorial - query the data When you have your dataset loaded, you can start constructing some queries to discover what your data tells you. In this section, you learn how to combine the data in the NYC taxi dataset with geospatial data from [PostGIS][postgis], to answer these questions: * [How many rides on New Year's Day 2016 originated from Times Square?](#how-many-rides-on-new-years-day-2016-originated-from-times-square) * [Which rides traveled more than 5 miles in Manhattan?](#which-rides-traveled-more-than-5-miles-in-manhattan). ## Set up your dataset for PostGIS To answer these geospatial questions, you need the ride count data from the NYC taxi dataset, but you also need some geospatial data to work out which trips originated where. TimescaleDB is compatible with all other Postgres extensions, so you can use the [PostGIS][postgis] extension to slice the data by time and location. With the extension loaded, you alter your hypertable so it's ready for geospatial queries. The `rides` table contains columns for pickup latitude and longitude, but it needs to be converted into geometry coordinates so that it works well with PostGIS. ### Setting up your dataset for PostGIS 1. Connect to the Tiger Cloud service that contains the NYC taxi dataset. 1. At the psql prompt, add the PostGIS extension: ```sql CREATE EXTENSION postgis; ``` You can check that PostGIS is installed properly by checking that it appears in the extension list when you run the `\dx` command. 1. Alter the hypertable to add geometry columns for ride pick up and drop off locations: ```sql ALTER TABLE rides ADD COLUMN pickup_geom geometry(POINT,2163); ALTER TABLE rides ADD COLUMN dropoff_geom geometry(POINT,2163); ``` 1. Convert the latitude and longitude points into geometry coordinates, so that they work well with PostGIS. This could take a while, as it needs to update all the data in both columns: ```sql UPDATE rides SET pickup_geom = ST_Transform(ST_SetSRID(ST_MakePoint(pickup_longitude,pickup_latitude),4326),2163), dropoff_geom = ST_Transform(ST_SetSRID(ST_MakePoint(dropoff_longitude,dropoff_latitude),4326),2163); ``` ## How many rides on New Year's Day 2016 originated from Times Square? When you have your database set up for PostGIS data, you can construct a query to return the number of rides on New Year's Day that originated in Times Square, in 30-minute buckets. ### Finding how many rides on New Year's Day 2016 originated from Times Square Times Square is located at (40.7589,-73.9851). 1. Connect to the Tiger Cloud service that contains the NYC taxi dataset. 1. At the psql prompt, use this query to select all rides taken in the first day of January 2016 that picked up within 400m of Times Square, and return a count of rides for each 30 minute interval: ```sql SELECT time_bucket('30 minutes', pickup_datetime) AS thirty_min, COUNT(*) AS near_times_sq FROM rides WHERE ST_Distance(pickup_geom, ST_Transform(ST_SetSRID(ST_MakePoint(-73.9851,40.7589),4326),2163)) < 400 AND pickup_datetime < '2016-01-01 14:00' GROUP BY thirty_min ORDER BY thirty_min; ``` 1. The data you get back looks a bit like this: ```sql thirty_min | near_times_sq ---------------------+--------------- 2016-01-01 00:00:00 | 74 2016-01-01 00:30:00 | 102 2016-01-01 01:00:00 | 120 2016-01-01 01:30:00 | 98 2016-01-01 02:00:00 | 112 ``` ## Which rides traveled more than 5 miles in Manhattan? This query is especially well suited to plot on a map. It looks at rides that were longer than 5 miles, within the city of Manhattan. In this query, you want to return rides longer than 5 miles, but also include the distance, so that you can visualize longer distances with different visual treatments. The query also includes a `WHERE` clause to apply a geospatial boundary, looking for trips within 2 km of Times Square. Finally, in the `GROUP BY` clause, supply the `trip_distance` and location variables so that Grafana can plot the data properly. ### Finding rides that traveled more than 5 miles in Manhattan 1. Connect to the Tiger Cloud service that contains the NYC taxi dataset. 1. At the psql prompt, use this query to find rides longer than 5 miles in Manhattan: ```sql SELECT time_bucket('5m', rides.pickup_datetime) AS time, rides.trip_distance AS value, rides.pickup_latitude AS latitude, rides.pickup_longitude AS longitude FROM rides WHERE rides.pickup_datetime BETWEEN '2016-01-01T01:41:55.986Z' AND '2016-01-01T07:41:55.986Z' AND ST_Distance(pickup_geom, ST_Transform(ST_SetSRID(ST_MakePoint(-73.9851,40.7589),4326),2163) ) < 2000 GROUP BY time, rides.trip_distance, rides.pickup_latitude, rides.pickup_longitude ORDER BY time LIMIT 500; ``` 1. The data you get back looks a bit like this: ```sql time | value | latitude | longitude ---------------------+-------+--------------------+--------------------- 2016-01-01 01:40:00 | 0.00 | 40.752281188964844 | -73.975021362304688 2016-01-01 01:40:00 | 0.09 | 40.755722045898437 | -73.967872619628906 2016-01-01 01:40:00 | 0.15 | 40.752742767333984 | -73.977737426757813 2016-01-01 01:40:00 | 0.15 | 40.756877899169922 | -73.969779968261719 2016-01-01 01:40:00 | 0.18 | 40.756717681884766 | -73.967330932617188 ... ``` 1. [](#) To visualize this in Grafana, create a new panel, and select the `Geomap` visualization. Select the NYC taxis dataset as your data source, and type the query from the previous step. In the `Format as` section, select `Table`. Your world map now shows a dot over New York, zoom in to see the visualization. 1. [](#) To make this visualization more useful, change the way that the rides are displayed. In the options panel, under `Data layer`, add a layer called `Distance traveled` and select the `markers` option. In the `Color` section, select `value`. You can also adjust the symbol and size here. 1. [](#) Select a color scheme so that different ride lengths are shown in different colors. In the options panel, under `Standard options`, change the `Color scheme` to a useful `by value` range. This example uses the `Blue-Yellow-Red (by value)` option. <img class="main-content__illustration" src="https://assets.timescale.com/docs/images/grafana-postgis.webp" width={1375} height={944} alt="Visualizing taxi journeys by distance in Grafana" /> ===== PAGE: https://docs.tigerdata.com/api/configuration/tiger-postgres/ ===== # TimescaleDB configuration and tuning Just as you can tune settings in Postgres, TimescaleDB provides a number of configuration settings that may be useful to your specific installation and performance needs. These can also be set within the `postgresql.conf` file or as command-line parameters when starting Postgres. ## Query Planning and Execution ### `timescaledb.enable_chunkwise_aggregation (bool)` If enabled, aggregations are converted into partial aggregations during query planning. The first part of the aggregation is executed on a per-chunk basis. Then, these partial results are combined and finalized. Splitting aggregations decreases the size of the created hash tables and increases data locality, which speeds up queries. ### `timescaledb.vectorized_aggregation (bool)` Enables or disables the vectorized optimizations in the query executor. For example, the `sum()` aggregation function on compressed chunks can be optimized in this way. ### `timescaledb.enable_merge_on_cagg_refresh (bool)` Set to `ON` to dramatically decrease the amount of data written on a continuous aggregate in the presence of a small number of changes, reduce the i/o cost of refreshing a [continuous aggregate][continuous-aggregates], and generate fewer Write-Ahead Logs (WAL). Only works for continuous aggregates that don't have compression enabled. Please refer to the [Grand Unified Configuration (GUC) parameters][gucs] for a complete list. ## Policies ### `timescaledb.max_background_workers (int)` Max background worker processes allocated to TimescaleDB. Set to at least 1 + the number of databases loaded with the TimescaleDB extension in a Postgres instance. Default value is 16. ## Tiger Cloud service tuning ### `timescaledb.disable_load (bool)` Disable the loading of the actual extension ## Administration ### `timescaledb.restoring (bool)` Set TimescaleDB in restoring mode. It is disabled by default. ### `timescaledb.license (string)` Change access to features based on the TimescaleDB license in use. For example, setting `timescaledb.license` to `apache` limits TimescaleDB to features that are implemented under the Apache 2 license. The default value is `timescale`, which allows access to all features. ### `timescaledb.telemetry_level (enum)` Telemetry settings level. Level used to determine which telemetry to send. Can be set to `off` or `basic`. Defaults to `basic`. ### `timescaledb.last_tuned (string)` Records last time `timescaledb-tune` ran. ### `timescaledb.last_tuned_version (string)` Version of `timescaledb-tune` used to tune when it runs. ===== PAGE: https://docs.tigerdata.com/api/configuration/gucs/ ===== # Grand Unified Configuration (GUC) parameters You use the following Grand Unified Configuration (GUC) parameters to optimize the behavior of your Tiger Cloud service. The namespace of each GUC is `timescaledb`. To set a GUC you specify `<namespace>.<GUC name>`. For example:sql SET timescaledb.enable_tiered_reads = true;
| Name | Type | Default | Description | | -- | -- | -- | -- | --------------------------------------------------------------------------------------------------------------------------------------------------------------------------------------------------------------------------| | `GUC_CAGG_HIGH_WORK_MEM_NAME` | `INTEGER` | `GUC_CAGG_HIGH_WORK_MEM_VALUE` | The high working memory limit for the continuous aggregate invalidation processing.<br />min: `64`, max: `MAX_KILOBYTES` | | `GUC_CAGG_LOW_WORK_MEM_NAME` | `INTEGER` | `GUC_CAGG_LOW_WORK_MEM_VALUE` | The low working memory limit for the continuous aggregate invalidation processing.<br />min: `64`, max: `MAX_KILOBYTES` | | `auto_sparse_indexes` | `BOOLEAN` | `true` | The hypertable columns that are used as index keys will have suitable sparse indexes when compressed. Must be set at the moment of chunk compression, e.g. when the `compress_chunk()` is called. | | `bgw_log_level` | `ENUM` | `WARNING` | Log level for the scheduler and workers of the background worker subsystem. Requires configuration reload to change. | | `cagg_processing_wal_batch_size` | `INTEGER` | `10000` | Number of entries processed from the WAL at a go. Larger values take more memory but might be more efficient.<br />min: `1000`, max: `10000000` | | `compress_truncate_behaviour` | `ENUM` | `COMPRESS_TRUNCATE_ONLY` | Defines how truncate behaves at the end of compression. 'truncate_only' forces truncation. 'truncate_disabled' deletes rows instead of truncate. 'truncate_or_delete' allows falling back to deletion. | | `compression_batch_size_limit` | `INTEGER` | `1000` | Setting this option to a number between 1 and 999 will force compression to limit the size of compressed batches to that amount of uncompressed tuples.Setting this to 0 defaults to the max batch size of 1000.<br />min: `1`, max: `1000` | | `compression_orderby_default_function` | `STRING` | `"_timescaledb_functions.get_orderby_defaults"` | Function to use for calculating default order_by setting for compression | | `compression_segmentby_default_function` | `STRING` | `"_timescaledb_functions.get_segmentby_defaults"` | Function to use for calculating default segment_by setting for compression | | `current_timestamp_mock` | `STRING` | `NULL` | this is for debugging purposes | | `debug_allow_cagg_with_deprecated_funcs` | `BOOLEAN` | `false` | this is for debugging/testing purposes | | `debug_bgw_scheduler_exit_status` | `INTEGER` | `0` | this is for debugging purposes<br />min: `0`, max: `255` | | `debug_compression_path_info` | `BOOLEAN` | `false` | this is for debugging/information purposes | | `debug_have_int128` | `BOOLEAN` | `#ifdef HAVE_INT128 true` | this is for debugging purposes | | `debug_require_batch_sorted_merge` | `ENUM` | `DRO_Allow` | this is for debugging purposes | | `debug_require_vector_agg` | `ENUM` | `DRO_Allow` | this is for debugging purposes | | `debug_require_vector_qual` | `ENUM` | `DRO_Allow` | this is for debugging purposes, to let us check if the vectorized quals are used or not. EXPLAIN differs after PG15 for custom nodes, and using the test templates is a pain | | `debug_skip_scan_info` | `BOOLEAN` | `false` | Print debug info about SkipScan distinct columns | | `debug_toast_tuple_target` | `INTEGER` | `/* bootValue = */ 128` | this is for debugging purposes<br />min: `/* minValue = */ 1`, max: `/* maxValue = */ 65535` | | `enable_bool_compression` | `BOOLEAN` | `true` | Enable bool compression | | `enable_bulk_decompression` | `BOOLEAN` | `true` | Increases throughput of decompression, but might increase query memory usage | | `enable_cagg_reorder_groupby` | `BOOLEAN` | `true` | Enable group by clause reordering for continuous aggregates | | `enable_cagg_sort_pushdown` | `BOOLEAN` | `true` | Enable pushdown of ORDER BY clause for continuous aggregates | | `enable_cagg_watermark_constify` | `BOOLEAN` | `true` | Enable constifying cagg watermark for real-time caggs | | `enable_cagg_window_functions` | `BOOLEAN` | `false` | Allow window functions in continuous aggregate views | | `enable_chunk_append` | `BOOLEAN` | `true` | Enable using chunk append node | | `enable_chunk_skipping` | `BOOLEAN` | `false` | Enable using chunk column stats to filter chunks based on column filters | | `enable_chunkwise_aggregation` | `BOOLEAN` | `true` | Enable the pushdown of aggregations to the chunk level | | `enable_columnarscan` | `BOOLEAN` | `true` | A columnar scan replaces sequence scans for columnar-oriented storage and enables storage-specific optimizations like vectorized filters. Disabling columnar scan will make PostgreSQL fall back to regular sequence scans. | | `enable_compressed_direct_batch_delete` | `BOOLEAN` | `true` | Enable direct batch deletion in compressed chunks | | `enable_compressed_skipscan` | `BOOLEAN` | `true` | Enable SkipScan for distinct inputs over compressed chunks | | `enable_compression_indexscan` | `BOOLEAN` | `false` | Enable indexscan during compression, if matching index is found | | `enable_compression_ratio_warnings` | `BOOLEAN` | `true` | Enable warnings for poor compression ratio | | `enable_compression_wal_markers` | `BOOLEAN` | `true` | Enable the generation of markers in the WAL stream which mark the start and end of compression operations | | `enable_compressor_batch_limit` | `BOOLEAN` | `false` | Enable compressor batch limit for compressors which can go over the allocation limit (1 GB). This feature willlimit those compressors by reducing the size of the batch and thus avoid hitting the limit. | | `enable_constraint_aware_append` | `BOOLEAN` | `true` | Enable constraint exclusion at execution time | | `enable_constraint_exclusion` | `BOOLEAN` | `true` | Enable planner constraint exclusion | | `enable_custom_hashagg` | `BOOLEAN` | `false` | Enable creating custom hash aggregation plans | | `enable_decompression_sorted_merge` | `BOOLEAN` | `true` | Enable the merge of compressed batches to preserve the compression order by | | `enable_delete_after_compression` | `BOOLEAN` | `false` | Delete all rows after compression instead of truncate | | `enable_deprecation_warnings` | `BOOLEAN` | `true` | Enable warnings when using deprecated functionality | | `enable_direct_compress_copy` | `BOOLEAN` | `false` | Enable experimental support for direct compression during COPY | | `enable_direct_compress_copy_client_sorted` | `BOOLEAN` | `false` | Correct handling of data sorting by the user is required for this option. | | `enable_direct_compress_copy_sort_batches` | `BOOLEAN` | `true` | Enable batch sorting during direct compress COPY | | `enable_dml_decompression` | `BOOLEAN` | `true` | Enable DML decompression when modifying compressed hypertable | | `enable_dml_decompression_tuple_filtering` | `BOOLEAN` | `true` | Recheck tuples during DML decompression to only decompress batches with matching tuples | | `enable_event_triggers` | `BOOLEAN` | `false` | Enable event triggers for chunks creation | | `enable_exclusive_locking_recompression` | `BOOLEAN` | `false` | Enable getting exclusive lock on chunk during segmentwise recompression | | `enable_foreign_key_propagation` | `BOOLEAN` | `true` | Adjust foreign key lookup queries to target whole hypertable | | `enable_job_execution_logging` | `BOOLEAN` | `false` | Retain job run status in logging table | | `enable_merge_on_cagg_refresh` | `BOOLEAN` | `false` | Enable MERGE statement on cagg refresh | | `enable_multikey_skipscan` | `BOOLEAN` | `true` | Enable SkipScan for multiple distinct inputs | | `enable_now_constify` | `BOOLEAN` | `true` | Enable constifying now() in query constraints | | `enable_null_compression` | `BOOLEAN` | `true` | Enable null compression | | `enable_optimizations` | `BOOLEAN` | `true` | Enable TimescaleDB query optimizations | | `enable_ordered_append` | `BOOLEAN` | `true` | Enable ordered append optimization for queries that are ordered by the time dimension | | `enable_parallel_chunk_append` | `BOOLEAN` | `true` | Enable using parallel aware chunk append node | | `enable_qual_propagation` | `BOOLEAN` | `true` | Enable propagation of qualifiers in JOINs | | `enable_rowlevel_compression_locking` | `BOOLEAN` | `false` | Use only if you know what you are doing | | `enable_runtime_exclusion` | `BOOLEAN` | `true` | Enable runtime chunk exclusion in ChunkAppend node | | `enable_segmentwise_recompression` | `BOOLEAN` | `true` | Enable segmentwise recompression | | `enable_skipscan` | `BOOLEAN` | `true` | Enable SkipScan for DISTINCT queries | | `enable_skipscan_for_distinct_aggregates` | `BOOLEAN` | `true` | Enable SkipScan for DISTINCT aggregates | | `enable_sparse_index_bloom` | `BOOLEAN` | `true` | This sparse index speeds up the equality queries on compressed columns, and can be disabled when not desired. | | `enable_tiered_reads` | `BOOLEAN` | `true` | Enable reading of tiered data by including a foreign table representing the data in the object storage into the query plan | | `enable_transparent_decompression` | `BOOLEAN` | `true` | Enable transparent decompression when querying hypertable | | `enable_tss_callbacks` | `BOOLEAN` | `true` | Enable ts_stat_statements callbacks | | `enable_uuid_compression` | `BOOLEAN` | `false` | Enable uuid compression | | `enable_vectorized_aggregation` | `BOOLEAN` | `true` | Enable vectorized aggregation for compressed data | | `last_tuned` | `STRING` | `NULL` | records last time timescaledb-tune ran | | `last_tuned_version` | `STRING` | `NULL` | version of timescaledb-tune used to tune | | `license` | `STRING` | `TS_LICENSE_DEFAULT` | Determines which features are enabled | | `materializations_per_refresh_window` | `INTEGER` | `10` | The maximal number of individual refreshes per cagg refresh. If more refreshes need to be performed, they are merged into a larger single refresh.<br />min: `0`, max: `INT_MAX` | | `max_cached_chunks_per_hypertable` | `INTEGER` | `1024` | Maximum number of chunks stored in the cache<br />min: `0`, max: `65536` | | `max_open_chunks_per_insert` | `INTEGER` | `1024` | Maximum number of open chunk tables per insert<br />min: `0`, max: `PG_INT16_MAX` | | `max_tuples_decompressed_per_dml_transaction` | `INTEGER` | `100000` | If the number of tuples exceeds this value, an error will be thrown and transaction rolled back. Setting this to 0 sets this value to unlimited number of tuples decompressed.<br />min: `0`, max: `2147483647` | | `restoring` | `BOOLEAN` | `false` | In restoring mode all timescaledb internal hooks are disabled. This mode is required for restoring logical dumps of databases with timescaledb. | | `shutdown_bgw_scheduler` | `BOOLEAN` | `false` | this is for debugging purposes | | `skip_scan_run_cost_multiplier` | `REAL` | `1.0` | Default is 1.0 i.e. regularly estimated SkipScan run cost, 0.0 will make SkipScan to have run cost = 0<br />min: `0.0`, max: `1.0` | | `telemetry_level` | `ENUM` | `TELEMETRY_DEFAULT` | Level used to determine which telemetry to send | Version: [2.22.1](https://github.com/timescale/timescaledb/releases/tag/2.22.1) ===== PAGE: https://docs.tigerdata.com/api/uuid-functions/uuid_timestamp/ ===== # uuid_timestamp() Extract a Postgres timestamp with time zone from a UUIDv7 object.  `uuid` contains a millisecond unix timestamp and an optional sub-millisecond fraction. This fraction is used to construct the Postgres timestamp. To include the sub-millisecond fraction in the returned timestamp, call [`uuid_timestamp_micros`][uuid_timestamp_micros]. ## Samplessql postgres=# SELECT uuid_timestamp('
019913ce-f124-7835-96c7-a2df691caa');Returns something like:terminaloutput
uuid_timestamp
2025-09-04 10:19:13.316+02
## Arguments | Name | Type | Default | Required | Description | |-|------------------|-|----------|-------------------------------------------------| |`uuid`|UUID| - | ✔ | The UUID object to extract the timestamp from | ===== PAGE: https://docs.tigerdata.com/api/uuid-functions/uuid_version/ ===== # uuid_version() Extract the version number from a UUID object:  ## Samplessql postgres=# SELECT uuid_version('
019913ce-f124-7835-96c7-a2df691caa');Returns something like:terminaloutput
uuid_version
7## Arguments | Name | Type | Default | Required | Description | |-|------------------|-|----------|----------------------------------------------------| |`uuid`|UUID| - | ✔ | The UUID object to extract the version number from | ===== PAGE: https://docs.tigerdata.com/api/uuid-functions/generate_uuidv7/ ===== # generate_uuidv7() Generate a UUIDv7 object based on the current time. The UUID contains a a UNIX timestamp split into millisecond and sub-millisecond parts, followed by random bits.  You can use this function to generate a time-ordered series of UUIDs suitable for use in a time-partitioned column in TimescaleDB. ## Samples - **Generate a UUIDv7 object based on the current time** ```sql postgres=# SELECT generate_uuidv7(); generate_uuidv7 -------------------------------------- 019913ce-f124-7835-96c7-a2df691caa98 ``` - **Insert a generated UUIDv7 object** ```sql INSERT INTO alerts VALUES (generate_uuidv7(), 'high CPU'); ``` ===== PAGE: https://docs.tigerdata.com/api/uuid-functions/to_uuidv7/ ===== # to_uuidv7() Create a UUIDv7 object from a Postgres timestamp and random bits. `ts` is converted to a UNIX timestamp split into millisecond and sub-millisecond parts.  ## Samplessql SELECT to_uuidv7(ts) FROM generate_series('2025-01-01:00:00:00'::timestamptz, '2025-01-01:00:00:03'::timestamptz, '1 microsecond'::interval) ts;
## Arguments | Name | Type | Default | Required | Description | |-|------------------|-|----------|--------------------------------------------------| |`ts`|TIMESTAMPTZ| - | ✔ | The timestamp used to return a UUIDv7 object | ===== PAGE: https://docs.tigerdata.com/api/uuid-functions/uuid_timestamp_micros/ ===== # uuid_timestamp_micros() Extract a [Postgres timestamp with time zone][pg-timestamp-timezone] from a UUIDv7 object. `uuid` contains a millisecond unix timestamp and an optional sub-millisecond fraction.  Unlike [`uuid_timestamp`][uuid_timestamp], the microsecond part of `uuid` is used to construct a Postgres timestamp with microsecond precision. Unless `uuid` is known to encode a valid sub-millisecond fraction, use [`uuid_timestamp`][uuid_timestamp]. ## Samplessql postgres=# SELECT uuid_timestamp_micros('
019913ce-f124-7835-96c7-a2df691caa');Returns something like:terminaloutput
uuid_timestamp_micros
2025-09-04 10:19:13.316512+02
## Arguments | Name | Type | Default | Required | Description | |-|------------------|-|----------|-------------------------------------------------| |`uuid`|UUID| - | ✔ | The UUID object to extract the timestamp from | ===== PAGE: https://docs.tigerdata.com/api/uuid-functions/to_uuidv7_boundary/ ===== # to_uuidv7_boundary() Create a UUIDv7 object from a Postgres timestamp for use in range queries. `ts` is converted to a UNIX timestamp split into millisecond and sub-millisecond parts.  The random bits of the UUID are set to zero in order to create a "lower" boundary UUID. For example, you can use the returned UUIDvs to find all rows with UUIDs where the timestamp is less than the boundary UUID's timestamp. ## Samples - **Create a boundary UUID from a timestamp**: ```sql postgres=# SELECT to_uuidv7_boundary('2025-09-04 11:01'); ``` Returns something like: ```terminaloutput to_uuidv7_boundary -------------------------------------- 019913f5-30e0-7000-8000-000000000000 ``` - **Use a boundary UUID to find all UUIDs with a timestamp below `'2025-09-04 10:00'`**: ```sql SELECT * FROM uuid_events WHERE event_id < to_uuidv7_boundary('2025-09-04 10:00'); ``` ## Arguments | Name | Type | Default | Required | Description | |-|------------------|-|----------|--------------------------------------------------| |`ts`|TIMESTAMPTZ| - | ✔ | The timestamp used to return a UUIDv7 object | ===== PAGE: https://docs.tigerdata.com/api/distributed-hypertables/cleanup_copy_chunk_operation_experimental/ ===== # cleanup_copy_chunk_operation() [Multi-node support is sunsetted][multi-node-deprecation]. TimescaleDB v2.13 is the last release that includes multi-node support for Postgres versions 13, 14, and 15. You can [copy][copy_chunk] or [move][move_chunk] a chunk to a new location within a multi-node environment. The operation happens over multiple transactions so, if it fails, it is manually cleaned up using this function. Without cleanup, the failed operation might hold a replication slot open, which in turn prevents storage from being reclaimed. The operation ID is logged in case of a failed copy or move operation and is required as input to the cleanup function. Experimental features could have bugs. They might not be backwards compatible, and could be removed in future releases. Use these features at your own risk, and do not use any experimental features in production. ## Required arguments |Name|Type|Description| |-|-|-| |`operation_id`|NAME|ID of the failed operation| ## Sample usage Clean up a failed operation:sql CALL timescaledb_experimental.cleanup_copy_chunk_operation('ts_copy_1_31');
Get a list of running copy or move operations:sql SELECT * FROM _timescaledb_catalog.chunk_copy_operation;
===== PAGE: https://docs.tigerdata.com/api/distributed-hypertables/create_distributed_restore_point/ ===== # create_distributed_restore_point() [Multi-node support is sunsetted][multi-node-deprecation]. TimescaleDB v2.13 is the last release that includes multi-node support for Postgres versions 13, 14, and 15. Creates a same-named marker record, for example `restore point`, in the write-ahead logs of all nodes in a multi-node TimescaleDB cluster. The restore point can be used as a recovery target on each node, ensuring the entire multi-node cluster can be restored to a consistent state. The function returns the write-ahead log locations for all nodes where the marker record was written. This function is similar to the Postgres function [`pg_create_restore_point`][pg-create-restore-point], but it has been modified to work with a distributed database. This function can only be run on the access node, and requires superuser privileges. ## Required arguments |Name|Description| |-|-| |`name`|The restore point name| ## Returns |Column|Type|Description| |-|-|-| |`node_name`|NAME|Node name, or `NULL` for access node| |`node_type`|TEXT|Node type name: `access_node` or `data_node`| |`restore_point`|[PG_LSN][pg-lsn]|Restore point log sequence number| ### Errors An error is given if: * The restore point `name` is more than 64 characters * A recovery is in progress * The current WAL level is not set to `replica` or `logical` * The current user is not a superuser * The current server is not the access node * TimescaleDB's 2PC transactions are not enabled ## Sample usage This example create a restore point called `pitr` across three data nodes and the access node:sql SELECT * FROM create_distributed_restore_point('pitr'); node_name | node_type | restore_point -----------+-------------+---------------
| access_node | 0/3694A30dn1 | data_node | 0/3694A98 dn2 | data_node | 0/3694B00 dn3 | data_node | 0/3694B68 (4 rows)
===== PAGE: https://docs.tigerdata.com/api/distributed-hypertables/copy_chunk_experimental/ ===== # copy_chunk() [Multi-node support is sunsetted][multi-node-deprecation]. TimescaleDB v2.13 is the last release that includes multi-node support for Postgres versions 13, 14, and 15. TimescaleDB allows you to copy existing chunks to a new location within a multi-node environment. This allows each data node to work both as a primary for some chunks and backup for others. If a data node fails, its chunks already exist on other nodes that can take over the responsibility of serving them. Experimental features could have bugs. They might not be backwards compatible, and could be removed in future releases. Use these features at your own risk, and do not use any experimental features in production. ## Required arguments |Name|Type|Description| |-|-|-| |`chunk`|REGCLASS|Name of chunk to be copied| |`source_node`|NAME|Data node where the chunk currently resides| |`destination_node`|NAME|Data node where the chunk is to be copied| ## Required settings When copying a chunk, the destination data node needs a way to authenticate with the data node that holds the source chunk. It is currently recommended to use a [password file][password-config] on the data node. The `wal_level` setting must also be set to `logical` or higher on data nodes from which chunks are copied. If you are copying or moving many chunks in parallel, you can increase `max_wal_senders` and `max_replication_slots`. ## Failures When a copy operation fails, it sometimes creates objects and metadata on the destination data node. It can also hold a replication slot open on the source data node. To clean up these objects and metadata, use [`cleanup_copy_chunk_operation`][cleanup_copy_chunk]. ## Sample usagesql CALL timescaledb_experimental.copy_chunk('_timescaledb_internal._dist_hyper_1_1_chunk', 'data_node_2', 'data_node_3');
===== PAGE: https://docs.tigerdata.com/api/distributed-hypertables/alter_data_node/ ===== # alter_data_node() [Multi-node support is sunsetted][multi-node-deprecation]. TimescaleDB v2.13 is the last release that includes multi-node support for Postgres versions 13, 14, and 15. Change the configuration of a data node that was originally set up with [`add_data_node`][add_data_node] on the access node. Only users with certain privileges can alter data nodes. When you alter the connection details for a data node, make sure that the altered configuration is reachable and can be authenticated by the access node. ## Required arguments |Name|Description| |-|-| |`node_name`|Name for the data node| ## Optional arguments |Name|Description| |-|-| |`host`|Host name for the remote data node| |`database`|Database name where remote hypertables are created. The default is the database name that was provided in `add_data_node`| |`port`|Port to use on the remote data node. The default is the Postgres port that was provided in `add_data_node`| |`available`|Configure availability of the remote data node. The default is `true` meaning that the data node is available for read/write queries| ## Returns |Column|Description| |-|-| |`node_name`|Local name to use for the data node| |`host`|Host name for the remote data node| |`port`|Port for the remote data node| |`database`|Database name used on the remote data node| |`available`|Availability of the remote data node for read/write queries| ### Errors An error is given if: * A remote data node with the provided `node_name` argument does not exist. ### Privileges To alter a data node, you must have the correct permissions, or be the owner of the remote server. Additionally, you must have the `USAGE` privilege on the `timescaledb_fdw` foreign data wrapper. ## Sample usage To change the port number and host information for an existing data node `dn1`:sql SELECT alter_data_node('dn1', host => 'dn1.example.com', port => 6999);
Data nodes are available for read/write queries by default. If the data node becomes unavailable for some reason, the read/write query gives an error. This API provides an optional argument, `available`, to mark an existing data node as available or unavailable for read/write queries. By marking a data node as unavailable you can allow read/write queries to proceed in the cluster. For more information, see the [multi-node HA section][multi-node-ha] ===== PAGE: https://docs.tigerdata.com/api/distributed-hypertables/move_chunk_experimental/ ===== # move_chunk() [Multi-node support is sunsetted][multi-node-deprecation]. TimescaleDB v2.13 is the last release that includes multi-node support for Postgres versions 13, 14, and 15. TimescaleDB allows you to move chunks to other data nodes. Moving chunks is useful in order to rebalance a multi-node cluster or remove a data node from the cluster. Experimental features could have bugs. They might not be backwards compatible, and could be removed in future releases. Use these features at your own risk, and do not use any experimental features in production. ## Required arguments |Name|Type|Description| |-|-|-| |`chunk`|REGCLASS|Name of chunk to be copied| |`source_node`|NAME|Data node where the chunk currently resides| |`destination_node`|NAME|Data node where the chunk is to be copied| ## Required settings When moving a chunk, the destination data node needs a way to authenticate with the data node that holds the source chunk. It is currently recommended to use a [password file][password-config] on the data node. The `wal_level` setting must also be set to `logical` or higher on data nodes from which chunks are moved. If you are copying or moving many chunks in parallel, you can increase `max_wal_senders` and `max_replication_slots`. ## Failures When a move operation fails, it sometimes creates objects and metadata on the destination data node. It can also hold a replication slot open on the source data node. To clean up these objects and metadata, use [`cleanup_copy_chunk_operation`][cleanup_copy_chunk]. ## Sample usagesql CALL timescaledb_experimental.move_chunk('_timescaledb_internal._dist_hyper_1_1_chunk', 'data_node_2', 'data_node_3');
===== PAGE: https://docs.tigerdata.com/api/distributed-hypertables/distributed_exec/ ===== # distributed_exec() [Multi-node support is sunsetted][multi-node-deprecation]. TimescaleDB v2.13 is the last release that includes multi-node support for Postgres versions 13, 14, and 15. This procedure is used on an access node to execute a SQL command across the data nodes of a distributed database. For instance, one use case is to create the roles and permissions needed in a distributed database. The procedure can run distributed commands transactionally, so a command is executed either everywhere or nowhere. However, not all SQL commands can run in a transaction. This can be toggled with the argument `transactional`. Note if the execution is not transactional, a failure on one of the data node requires manual dealing with any introduced inconsistency. Note that the command is _not_ executed on the access node itself and it is not possible to chain multiple commands together in one call. You cannot run `distributed_exec` with some SQL commands. For example, `ALTER EXTENSION` doesn't work because it can't be called after the TimescaleDB extension is already loaded. ## Required arguments |Name|Type|Description| |---|---|---| | `query` | TEXT | The command to execute on data nodes. | ## Optional arguments |Name|Type|Description| |---|---|---| | `node_list` | ARRAY | An array of data nodes where the command should be executed. Defaults to all data nodes if not specified. | | `transactional` | BOOLEAN | Allows to specify if the execution of the statement should be transactional or not. Defaults to TRUE. | ## Sample usage Create the role `testrole` across all data nodes in a distributed database:sql CALL distributed_exec($$ CREATE USER testrole WITH LOGIN $$);
Create the role `testrole` on two specific data nodes:sql CALL distributed_exec($$ CREATE USER testrole WITH LOGIN $$, node_list => '{ "dn1", "dn2" }');
Create the table `example` on all data nodes:sql CALL distributed_exec($$ CREATE TABLE example (ts TIMESTAMPTZ, value INTEGER) $$);
Create new databases `dist_database` on data nodes, which requires setting `transactional` to FALSE:sql CALL distributed_exec('CREATE DATABASE dist_database', transactional => FALSE);
===== PAGE: https://docs.tigerdata.com/api/distributed-hypertables/create_distributed_hypertable/ ===== # create_distributed_hypertable() [Multi-node support is sunsetted][multi-node-deprecation]. TimescaleDB v2.13 is the last release that includes multi-node support for Postgres versions 13, 14, and 15. Create a TimescaleDB hypertable distributed across a multinode environment. `create_distributed_hypertable()` replaces [`create_hypertable() (old interface)`][create-hypertable-old]. Distributed tables use the old API. The new generalized [`create_hypertable`][create-hypertable-new] API was introduced in TimescaleDB v2.13. ## Required arguments |Name|Type| Description | |---|---|----------------------------------------------------------------------------------------------| | `relation` | REGCLASS | Identifier of the table you want to convert to a hypertable. | | `time_column_name` | TEXT | Name of the column that contains time values, as well as the primary column to partition by. | ## Optional arguments |Name|Type|Description| |---|---|---| | `partitioning_column` | TEXT | Name of an additional column to partition by. | | `number_partitions` | INTEGER | Number of hash partitions to use for `partitioning_column`. Must be > 0. Default is the number of `data_nodes`. | | `associated_schema_name` | TEXT | Name of the schema for internal hypertable tables. Default is `_timescaledb_internal`. | | `associated_table_prefix` | TEXT | Prefix for internal hypertable chunk names. Default is `_hyper`. | | `chunk_time_interval` | INTERVAL | Interval in event time that each chunk covers. Must be > 0. Default is 7 days. | | `create_default_indexes` | BOOLEAN | Boolean whether to create default indexes on time/partitioning columns. Default is TRUE. | | `if_not_exists` | BOOLEAN | Boolean whether to print warning if table already converted to hypertable or raise exception. Default is FALSE. | | `partitioning_func` | REGCLASS | The function to use for calculating a value's partition.| | `migrate_data` | BOOLEAN | Set to TRUE to migrate any existing data from the `relation` table to chunks in the new hypertable. A non-empty table generates an error without this option. Large tables may take significant time to migrate. Default is FALSE. | | `time_partitioning_func` | REGCLASS | Function to convert incompatible primary time column values to compatible ones. The function must be `IMMUTABLE`. | | `replication_factor` | INTEGER | The number of data nodes to which the same data is written to. This is done by creating chunk copies on this amount of data nodes. Must be >= 1; If not set, the default value is determined by the `timescaledb.hypertable_replication_factor_default` GUC. Read [the best practices][best-practices] before changing the default. | | `data_nodes` | ARRAY | The set of data nodes used for the distributed hypertable. If not present, defaults to all data nodes known by the access node (the node on which the distributed hypertable is created). | ## Returns |Column|Type|Description| |---|---|---| | `hypertable_id` | INTEGER | ID of the hypertable in TimescaleDB. | | `schema_name` | TEXT | Schema name of the table converted to hypertable. | | `table_name` | TEXT | Table name of the table converted to hypertable. | | `created` | BOOLEAN | TRUE if the hypertable was created, FALSE when `if_not_exists` is TRUE and no hypertable was created. | ## Sample usage Create a table `conditions` which is partitioned across data nodes by the 'location' column. Note that the number of space partitions is automatically equal to the number of data nodes assigned to this hypertable (all configured data nodes in this case, as `data_nodes` is not specified).sql SELECT create_distributed_hypertable('conditions', 'time', 'location');
Create a table `conditions` using a specific set of data nodes.sql SELECT create_distributed_hypertable('conditions', 'time', 'location',
data_nodes => '{ "data_node_1", "data_node_2", "data_node_4", "data_node_7" }');### Best practices * **Hash partitions**: Best practice for distributed hypertables is to enable [hash partitions](https://www.techopedia.com/definition/31996/hash-partitioning). With hash partitions, incoming data is divided between the data nodes. Without hash partition, all data for each time slice is written to a single data node. * **Time intervals**: Follow the guidelines for `chunk_time_interval` defined in [`create_hypertable`] [create-hypertable-old]. When you enable hash partitioning, the hypertable is evenly distributed across the data nodes. This means you can set a larger time interval. For example, you ingest 10 GB of data per day shared over five data nodes, each node has 64 GB of memory. If this is the only table being served by these data nodes, use a time interval of 1 week:7 days * 10 GB 70 -------------------- == --- ~= 22% of main memory used for the most recent chunks 5 data nodes * 64 GB 320
If you do not enable hash partitioning, use the same `chunk_time_interval` settings as a non-distributed instance. This is because all incoming data is handled by a single node. * **Replication factor**: `replication_factor` defines the number of data nodes a newly created chunk is replicated in. For example, when you set `replication_factor` to `3`, each chunk exists on 3 separate data nodes. Rows written to a chunk are inserted into all data notes in a two-phase commit protocol. If a data node fails or is removed, no data is lost. Writes succeed on the other data nodes. However, the chunks on the lost data node are now under-replicated. When the failed data node becomes available, rebalance the chunks with a call to [copy_chunk][copy_chunk]. ===== PAGE: https://docs.tigerdata.com/api/distributed-hypertables/attach_data_node/ ===== # attach_data_node() [Multi-node support is sunsetted][multi-node-deprecation]. TimescaleDB v2.13 is the last release that includes multi-node support for Postgres versions 13, 14, and 15. Attach a data node to a hypertable. The data node should have been previously created using [`add_data_node`][add_data_node]. When a distributed hypertable is created, by default it uses all available data nodes for the hypertable, but if a data node is added *after* a hypertable is created, the data node is not automatically used by existing distributed hypertables. If you want a hypertable to use a data node that was created later, you must attach the data node to the hypertable using this function. ## Required arguments | Name | Description | |-------------------|-----------------------------------------------| | `node_name` | Name of data node to attach | | `hypertable` | Name of distributed hypertable to attach node to | ## Optional arguments | Name | Description | |-------------------|-----------------------------------------------| | `if_not_attached` | Prevents error if the data node is already attached to the hypertable. A notice is printed that the data node is attached. Defaults to `FALSE`. | | `repartition` | Change the partitioning configuration so that all the attached data nodes are used. Defaults to `TRUE`. | ## Returns | Column | Description | |-------------------|-----------------------------------------------| | `hypertable_id` | Hypertable id of the modified hypertable | | `node_hypertable_id` | Hypertable id on the remote data node | | `node_name` | Name of the attached data node | ## Sample usage Attach a data node `dn3` to a distributed hypertable `conditions` previously created with [`create_distributed_hypertable`][create_distributed_hypertable].sql SELECT * FROM attach_data_node('dn3','conditions');
hypertable_id | node_hypertable_id | node_name --------------+--------------------+-------------
5 | 3 | dn3(1 row)
You must add a data node to your distributed database first with [`add_data_node`](https://docs.tigerdata.com/api/latest/distributed-hypertables/add_data_node/) first before attaching it. ===== PAGE: https://docs.tigerdata.com/api/distributed-hypertables/set_number_partitions/ ===== # set_number_partitions() [Multi-node support is sunsetted][multi-node-deprecation]. TimescaleDB v2.13 is the last release that includes multi-node support for Postgres versions 13, 14, and 15. Sets the number of partitions (slices) of a space dimension on a hypertable. The new partitioning only affects new chunks. ## Required arguments | Name | Type | Description | | --- | --- | --- | | `hypertable`| REGCLASS | Hypertable to update the number of partitions for.| | `number_partitions` | INTEGER | The new number of partitions for the dimension. Must be greater than 0 and less than 32,768. | ## Optional arguments | Name | Type | Description | | --- | --- | --- | | `dimension_name` | REGCLASS | The name of the space dimension to set the number of partitions for. | The `dimension_name` needs to be explicitly specified only if the hypertable has more than one space dimension. An error is thrown otherwise. ## Sample usage For a table with a single space dimension:sql SELECT set_number_partitions('conditions', 2);
For a table with more than one space dimension:sql SELECT set_number_partitions('conditions', 2, 'device_id');
===== PAGE: https://docs.tigerdata.com/api/distributed-hypertables/add_data_node/ ===== # add_data_node() [Multi-node support is sunsetted][multi-node-deprecation]. TimescaleDB v2.13 is the last release that includes multi-node support for Postgres versions 13, 14, and 15. Add a new data node on the access node to be used by distributed hypertables. The data node is automatically used by distributed hypertables that are created after the data node has been added, while existing distributed hypertables require an additional [`attach_data_node`][attach_data_node]. If the data node already exists, the command aborts with either an error or a notice depending on the value of `if_not_exists`. For security purposes, only superusers or users with necessary privileges can add data nodes (see below for details). When adding a data node, the access node also tries to connect to the data node and therefore needs a way to authenticate with it. TimescaleDB currently supports several different such authentication methods for flexibility (including trust, user mappings, password, and certificate methods). Refer to [Setting up Multi-Node TimescaleDB][multinode] for more information about node-to-node authentication. Unless `bootstrap` is false, the function attempts to bootstrap the data node by: 1. Creating the database given in `database` that serve as the new data node. 1. Loading the TimescaleDB extension in the new database. 1. Setting metadata to make the data node part of the distributed database. Note that user roles are not automatically created on the new data node during bootstrapping. The [`distributed_exec`][distributed_exec] procedure can be used to create additional roles on the data node after it is added. ## Required arguments | Name | Description | | ----------- | ----------- | | `node_name` | Name for the data node. | | `host` | Host name for the remote data node. | ## Optional arguments | Name | Description | |----------------------|-------------------------------------------------------| | `database` | Database name where remote hypertables are created. The default is the current database name. | | `port` | Port to use on the remote data node. The default is the Postgres port used by the access node on which the function is executed. | | `if_not_exists` | Do not fail if the data node already exists. The default is `FALSE`. | | `bootstrap` | Bootstrap the remote data node. The default is `TRUE`. | | `password` | Password for authenticating with the remote data node during bootstrapping or validation. A password only needs to be provided if the data node requires password authentication and a password for the user does not exist in a local password file on the access node. If password authentication is not used, the specified password is ignored. | ## Returns | Column | Description | |---------------------|---------------------------------------------------| | `node_name` | Local name to use for the data node | | `host` | Host name for the remote data node | | `port` | Port for the remote data node | | `database` | Database name used on the remote data node | | `node_created` | Was the data node created locally | | `database_created` | Was the database created on the remote data node | | `extension_created` | Was the extension created on the remote data node | ### Errors An error is given if: * The function is executed inside a transaction. * The function is executed in a database that is already a data node. * The data node already exists and `if_not_exists` is `FALSE`. * The access node cannot connect to the data node due to a network failure or invalid configuration (for example, wrong port, or there is no way to authenticate the user). * If `bootstrap` is `FALSE` and the database was not previously bootstrapped. ### Privileges To add a data node, you must be a superuser or have the `USAGE` privilege on the `timescaledb_fdw` foreign data wrapper. To grant such privileges to a regular user role, do:sql GRANT USAGE ON FOREIGN DATA WRAPPER timescaledb_fdw TO ;
Note, however, that superuser privileges might still be necessary on the data node in order to bootstrap it, including creating the TimescaleDB extension on the data node unless it is already installed. ## Sample usage If you have an existing hypertable `conditions` and want to use `time` as the range partitioning column and `location` as the hash partitioning column. You also want to distribute the chunks of the hypertable on two data nodes `dn1.example.com` and `dn2.example.com`:sql SELECT add_data_node('dn1', host => 'dn1.example.com'); SELECT add_data_node('dn2', host => 'dn2.example.com'); SELECT create_distributed_hypertable('conditions', 'time', 'location');
If you want to create a distributed database with the two data nodes local to this instance, you can write:sql SELECT add_data_node('dn1', host => 'localhost', database => 'dn1'); SELECT add_data_node('dn2', host => 'localhost', database => 'dn2'); SELECT create_distributed_hypertable('conditions', 'time', 'location');
Note that this does not offer any performance advantages over using a regular hypertable, but it can be useful for testing. ===== PAGE: https://docs.tigerdata.com/api/distributed-hypertables/detach_data_node/ ===== # detach_data_node() [Multi-node support is sunsetted][multi-node-deprecation]. TimescaleDB v2.13 is the last release that includes multi-node support for Postgres versions 13, 14, and 15. Detach a data node from one hypertable or from all hypertables. Reasons for detaching a data node include: * A data node should no longer be used by a hypertable and needs to be removed from all hypertables that use it * You want to have fewer data nodes for a distributed hypertable to partition across ## Required arguments | Name | Type|Description | |-------------|----|-------------------------------| | `node_name` | TEXT | Name of data node to detach from the distributed hypertable | ## Optional arguments | Name | Type|Description | |---------------|---|-------------------------------------| | `hypertable` | REGCLASS | Name of the distributed hypertable where the data node should be detached. If NULL, the data node is detached from all hypertables. | | `if_attached` | BOOLEAN | Prevent error if the data node is not attached. Defaults to false. | | `force` | BOOLEAN | Force detach of the data node even if that means that the replication factor is reduced below what was set. Note that it is never allowed to reduce the replication factor below 1 since that would cause data loss. | | `repartition` | BOOLEAN | Make the number of hash partitions equal to the new number of data nodes (if such partitioning exists). This ensures that the remaining data nodes are used evenly. Defaults to true. | ## Returns The number of hypertables the data node was detached from. ### Errors Detaching a node is not permitted: * If it would result in data loss for the hypertable due to the data node containing chunks that are not replicated on other data nodes * If it would result in under-replicated chunks for the distributed hypertable (without the `force` argument) Replication is currently experimental, and not a supported feature Detaching a data node is under no circumstances possible if that would mean data loss for the hypertable. Nor is it possible to detach a data node, unless forced, if that would mean that the distributed hypertable would end up with under-replicated chunks. The only safe way to detach a data node is to first safely delete any data on it or replicate it to another data node. ## Sample usage Detach data node `dn3` from `conditions`:sql SELECT detach_data_node('dn3', 'conditions');
===== PAGE: https://docs.tigerdata.com/api/distributed-hypertables/set_replication_factor/ ===== # set_replication_factor() [Multi-node support is sunsetted][multi-node-deprecation]. TimescaleDB v2.13 is the last release that includes multi-node support for Postgres versions 13, 14, and 15. Sets the replication factor of a distributed hypertable to the given value. Changing the replication factor does not affect the number of replicas for existing chunks. Chunks created after changing the replication factor are replicated in accordance with new value of the replication factor. If the replication factor cannot be satisfied, since the amount of attached data nodes is less than new replication factor, the command aborts with an error. If existing chunks have less replicas than new value of the replication factor, the function prints a warning. ## Required arguments |Name|Type|Description| |---|---|---| | `hypertable` | REGCLASS | Distributed hypertable to update the replication factor for.| | `replication_factor` | INTEGER | The new value of the replication factor. Must be greater than 0, and smaller than or equal to the number of attached data nodes.| ### Errors An error is given if: * `hypertable` is not a distributed hypertable. * `replication_factor` is less than `1`, which cannot be set on a distributed hypertable. * `replication_factor` is bigger than the number of attached data nodes. If a bigger replication factor is desired, it is necessary to attach more data nodes by using [attach_data_node][attach_data_node]. ## Sample usage Update the replication factor for a distributed hypertable to `2`:sql SELECT set_replication_factor('conditions', 2);
Example of the warning if any existing chunk of the distributed hypertable has less than 2 replicas:WARNING: hypertable "conditions" is under-replicated DETAIL: Some chunks have less than 2 replicas.
Example of providing too big of a replication factor for a hypertable with 2 attached data nodes:sql SELECT set_replication_factor('conditions', 3); ERROR: too big replication factor for hypertable "conditions" DETAIL: The hypertable has 2 data nodes attached, while the replication factor is 3. HINT: Decrease the replication factor or attach more data nodes to the hypertable.
===== PAGE: https://docs.tigerdata.com/api/distributed-hypertables/delete_data_node/ ===== # delete_data_node() [Multi-node support is sunsetted][multi-node-deprecation]. TimescaleDB v2.13 is the last release that includes multi-node support for Postgres versions 13, 14, and 15. This function is executed on an access node to remove a data node from the local database. As part of the deletion, the data node is detached from all hypertables that are using it, if permissions and data integrity requirements are satisfied. For more information, see [`detach_data_node`][detach_data_node]. Deleting a data node is strictly a local operation; the data node itself is not affected and the corresponding remote database on the data node is left intact, including all its data. The operation is local to ensure it can complete even if the remote data node is not responding and to avoid unintentional data loss on the data node. It is not possible to use [`add_data_node`](https://docs.tigerdata.com/api/latest/distributed-hypertables/add_data_node) to add the same data node again without first deleting the database on the data node or using another database. This is to prevent adding a data node that was previously part of the same or another distributed database but is no longer synchronized. ### Errors An error is generated if the data node cannot be detached from all attached hypertables. ## Required arguments |Name|Type|Description| |---|---|---| | `node_name` | TEXT | Name of the data node. | ## Optional arguments |Name|Type|Description| |---|---|---| | `if_exists` | BOOLEAN | Prevent error if the data node does not exist. Defaults to false. | | `force` | BOOLEAN | Force removal of data nodes from hypertables unless that would result in data loss. Defaults to false. | | `repartition` | BOOLEAN | Make the number of hash partitions equal to the new number of data nodes (if such partitioning exists). This ensures that the remaining data nodes are used evenly. Defaults to true. | ## Returns A boolean indicating if the operation was successful or not. ## Sample usage To delete a data node named `dn1`:sql SELECT delete_data_node('dn1');
===== PAGE: https://docs.tigerdata.com/api/informational-views/chunk_compression_settings/ ===== # timescaledb_information.chunk_compression_settings Shows information about compression settings for each chunk that has compression enabled on it. ## Samples Show compression settings for all chunks:sql SELECT * FROM timescaledb_information.chunk_compression_settings' hypertable | measurements chunk | _timescaledb_internal._hyper_1_1_chunk segmentby | orderby | "time" DESC
Find all chunk compression settings for a specific hypertable:sql SELECT * FROM timescaledb_information.chunk_compression_settings WHERE hypertable::TEXT LIKE 'metrics'; hypertable | metrics chunk | _timescaledb_internal._hyper_2_3_chunk segmentby | metric_id orderby | "time"
## Arguments |Name|Type|Description| |-|-|-| |`hypertable`|`REGCLASS`|Hypertable which has compression enabled| |`chunk`|`REGCLASS`|Chunk which has compression enabled| |`segmentby`|`TEXT`|List of columns used for segmenting the compressed data| |`orderby`|`TEXT`| List of columns used for ordering compressed data along with ordering and NULL ordering information| ===== PAGE: https://docs.tigerdata.com/api/informational-views/jobs/ ===== # timescaledb_information.jobs Shows information about all jobs registered with the automation framework. ## Samples Shows a job associated with the refresh policy for continuous aggregates:sql SELECT * FROM timescaledb_information.jobs; job_id | 1001 application_name | Refresh Continuous Aggregate Policy [1001] schedule_interval | 01:00:00 max_runtime | 00:00:00 max_retries | -1 retry_period | 01:00:00 proc_schema | _timescaledb_internal proc_name | policy_refresh_continuous_aggregate owner | postgres scheduled | t config | {"start_offset": "20 days", "end_offset": "10 days", "mat_hypertable_id": 2} next_start | 2020-10-02 12:38:07.014042-04 hypertable_schema | _timescaledb_internal hypertable_name | _materialized_hypertable_2 check_schema | _timescaledb_internal check_name | policy_refresh_continuous_aggregate_check
Find all jobs related to compression policies (before TimescaleDB v2.20):sql SELECT * FROM timescaledb_information.jobs where application_name like 'Compression%'; -[ RECORD 1 ]-----+-------------------------------------------------- job_id | 1002 application_name | Compression Policy [1002] schedule_interval | 15 days 12:00:00 max_runtime | 00:00:00 max_retries | -1 retry_period | 01:00:00 proc_schema | _timescaledb_internal proc_name | policy_compression owner | postgres scheduled | t config | {"hypertable_id": 3, "compress_after": "60 days"} next_start | 2020-10-18 01:31:40.493764-04 hypertable_schema | public hypertable_name | conditions check_schema | _timescaledb_internal check_name | policy_compression_check
Find all jobs related to columnstore policies (TimescaleDB v2.20 and later):sql SELECT * FROM timescaledb_information.jobs where application_name like 'Columnstore%'; -[ RECORD 1 ]-----+-------------------------------------------------- job_id | 1002 application_name | Columnstore Policy [1002] schedule_interval | 15 days 12:00:00 max_runtime | 00:00:00 max_retries | -1 retry_period | 01:00:00 proc_schema | _timescaledb_internal proc_name | policy_compression owner | postgres scheduled | t config | {"hypertable_id": 3, "compress_after": "60 days"} next_start | 2025-10-18 01:31:40.493764-04 hypertable_schema | public hypertable_name | conditions check_schema | _timescaledb_internal check_name | policy_compression_check
Find custom jobs:sql SELECT * FROM timescaledb_information.jobs where application_name like 'User-Define%'; -[ RECORD 1 ]-----+------------------------------ job_id | 1003 application_name | User-Defined Action [1003] schedule_interval | 01:00:00 max_runtime | 00:00:00 max_retries | -1 retry_period | 00:05:00 proc_schema | public proc_name | custom_aggregation_func owner | postgres scheduled | t config | {"type": "function"} next_start | 2020-10-02 14:45:33.339885-04 hypertable_schema | hypertable_name | check_schema | NULL check_name | NULL -[ RECORD 2 ]-----+------------------------------ job_id | 1004 application_name | User-Defined Action [1004] schedule_interval | 01:00:00 max_runtime | 00:00:00 max_retries | -1 retry_period | 00:05:00 proc_schema | public proc_name | custom_retention_func owner | postgres scheduled | t config | {"type": "function"} next_start | 2020-10-02 14:45:33.353733-04 hypertable_schema | hypertable_name | check_schema | NULL check_name | NULL
## Arguments |Name|Type| Description | |-|-|--------------------------------------------------------------------------------------------------------------| |`job_id`|`INTEGER`| The ID of the background job | |`application_name`|`TEXT`| Name of the policy or job | |`schedule_interval`|`INTERVAL`| The interval at which the job runs. Defaults to 24 hours | |`max_runtime`|`INTERVAL`| The maximum amount of time the job is allowed to run by the background worker scheduler before it is stopped | |`max_retries`|`INTEGER`| The number of times the job is retried if it fails | |`retry_period`|`INTERVAL`| The amount of time the scheduler waits between retries of the job on failure | |`proc_schema`|`TEXT`| Schema name of the function or procedure executed by the job | |`proc_name`|`TEXT`| Name of the function or procedure executed by the job | |`owner`|`TEXT`| Owner of the job | |`scheduled`|`BOOLEAN`| Set to `true` to run the job automatically | |`fixed_schedule`|BOOLEAN| Set to `true` for jobs executing at fixed times according to a schedule interval and initial start | |`config`|`JSONB`| Configuration passed to the function specified by `proc_name` at execution time | |`next_start`|`TIMESTAMP WITH TIME ZONE`| Next start time for the job, if it is scheduled to run automatically | |`initial_start`|`TIMESTAMP WITH TIME ZONE`| Time the job is first run and also the time on which execution times are aligned for jobs with fixed schedules | |`hypertable_schema`|`TEXT`| Schema name of the hypertable. Set to `NULL` for a job | |`hypertable_name`|`TEXT`| Table name of the hypertable. Set to `NULL` for a job | |`check_schema`|`TEXT`| Schema name of the optional configuration validation function, set when the job is created or updated | |`check_name`|`TEXT`| Name of the optional configuration validation function, set when the job is created or updated | ===== PAGE: https://docs.tigerdata.com/api/informational-views/hypertables/ ===== # timescaledb_information.hypertables Get metadata information about hypertables. For more information about using hypertables, including chunk size partitioning, see the [hypertable section][hypertable-docs]. ## Samples Get information about a hypertable.sql CREATE TABLE metrics(time timestamptz, device int, temp float); SELECT create_hypertable('metrics','time');
SELECT * from timescaledb_information.hypertables WHERE hypertable_name = 'metrics';
-[ RECORD 1 ]-------+-------- hypertable_schema | public hypertable_name | metrics owner | sven num_dimensions | 1 num_chunks | 0 compression_enabled | f tablespaces | NULL
## Available columns |Name|Type| Description | |-|-|-------------------------------------------------------------------| |`hypertable_schema`|TEXT| Schema name of the hypertable | |`hypertable_name`|TEXT| Table name of the hypertable | |`owner`|TEXT| Owner of the hypertable | |`num_dimensions`|SMALLINT| Number of dimensions | |`num_chunks`|BIGINT| Number of chunks | |`compression_enabled`|BOOLEAN| Is compression enabled on the hypertable? | |`is_distributed`|BOOLEAN| Sunsetted since TimescaleDB v2.14.0 Is the hypertable distributed? | |`replication_factor`|SMALLINT| Sunsetted since TimescaleDB v2.14.0 Replication factor for a distributed hypertable | |`data_nodes`|TEXT| Sunsetted since TimescaleDB v2.14.0 Nodes on which hypertable is distributed | |`tablespaces`|TEXT| Tablespaces attached to the hypertable | ===== PAGE: https://docs.tigerdata.com/api/informational-views/policies/ ===== # timescaledb_experimental.policies <!-- vale Google.Headings = NO --> <!-- markdownlint-disable-next-line line-length --> <!-- vale Google.Headings = YES --> The `policies` view provides information on all policies set on continuous aggregates. Only policies applying to continuous aggregates are shown in this view. Policies applying to regular hypertables or regular materialized views are not displayed. Experimental features could have bugs. They might not be backwards compatible, and could be removed in future releases. Use these features at your own risk, and do not use any experimental features in production. ## Samples Select from the `timescaledb_experimental.policies` table to view it:sql SELECT * FROM timescaledb_experimental.policies;
Example of the returned output:sql -[ RECORD 1 ]-------------------------------------------------------------------- relation_name | mat_m1 relation_schema | public schedule_interval | @ 1 hour proc_schema | _timescaledb_internal proc_name | policy_refresh_continuous_aggregate config | {"end_offset": 1, "start_offset", 10, "mat_hypertable_id": 2} hypertable_schema | _timescaledb_internal hypertable_name | _materialized_hypertable_2 -[ RECORD 2 ]-------------------------------------------------------------------- relation_name | mat_m1 relation_schema | public schedule_interval | @ 1 day proc_schema | _timescaledb_internal proc_name | policy_compression config | {"hypertable_id": 2, "compress_after", 11} hypertable_schema | _timescaledb_internal hypertable_name | _materialized_hypertable_2 -[ RECORD 3 ]-------------------------------------------------------------------- relation_name | mat_m1 relation_schema | public schedule_interval | @ 1 day proc_schema | _timescaledb_internal proc_name | policy_retention config | {"drop_after": 20, "hypertable_id": 2} hypertable_schema | _timescaledb_internal hypertable_name | _materialized_hypertable_2
## Available columns |Column|Type|Description| |-|-|-| |`relation_name`|Name of the continuous aggregate| |`relation_schema`|Schema of the continuous aggregate| |`schedule_interval`|How often the policy job runs| |`proc_schema`|Schema of the policy job| |`proc_name`|Name of the policy job| |`config`|Configuration details for the policy job| |`hypertable_schema`|Schema of the hypertable that contains the actual data for the continuous aggregate view| |`hypertable_name`|Name of the hypertable that contains the actual data for the continuous aggregate view| ===== PAGE: https://docs.tigerdata.com/api/informational-views/chunks/ ===== # timescaledb_information.chunks Get metadata about the chunks of hypertables. This view shows metadata for the chunk's primary time-based dimension. For information about a hypertable's secondary dimensions, the [dimensions view][dimensions] should be used instead. If the chunk's primary dimension is of a time datatype, `range_start` and `range_end` are set. Otherwise, if the primary dimension type is integer based, `range_start_integer` and `range_end_integer` are set. ## Samples Get information about the chunks of a hypertable. Dimension builder `by_range` was introduced in TimescaleDB 2.13. The `chunk_creation_time` metadata was introduced in TimescaleDB 2.13.sql CREATE TABLESPACE tablespace1 location '/usr/local/pgsql/data1';
CREATE TABLE hyper_int (a_col integer, b_col integer, c integer); SELECT table_name from create_hypertable('hyper_int', by_range('a_col', 10)); CREATE OR REPLACE FUNCTION integer_now_hyper_int() returns int LANGUAGE SQL STABLE as $$ SELECT coalesce(max(a_col), 0) FROM hyper_int $$; SELECT set_integer_now_func('hyper_int', 'integer_now_hyper_int');
INSERT INTO hyper_int SELECT generate_series(1,5,1), 10, 50;
SELECT attach_tablespace('tablespace1', 'hyper_int'); INSERT INTO hyper_int VALUES( 25 , 14 , 20), ( 25, 15, 20), (25, 16, 20);
SELECT * FROM timescaledb_information.chunks WHERE hypertable_name = 'hyper_int';
-[ RECORD 1 ]----------+---------------------- hypertable_schema | public hypertable_name | hyper_int chunk_schema | _timescaledb_internal chunk_name | _hyper_7_10_chunk primary_dimension | a_col primary_dimension_type | integer range_start | range_end | range_start_integer | 0 range_end_integer | 10 is_compressed | f chunk_tablespace | data_nodes | -[ RECORD 2 ]----------+---------------------- hypertable_schema | public hypertable_name | hyper_int chunk_schema | _timescaledb_internal chunk_name | _hyper_7_11_chunk primary_dimension | a_col primary_dimension_type | integer range_start | range_end | range_start_integer | 20 range_end_integer | 30 is_compressed | f chunk_tablespace | tablespace1 data_nodes |
## Available columns |Name|Type|Description| |---|---|---| | `hypertable_schema` | TEXT | Schema name of the hypertable | | `hypertable_name` | TEXT | Table name of the hypertable | | `chunk_schema` | TEXT | Schema name of the chunk | | `chunk_name` | TEXT | Name of the chunk | | `primary_dimension` | TEXT | Name of the column that is the primary dimension| | `primary_dimension_type` | REGTYPE | Type of the column that is the primary dimension| | `range_start` | TIMESTAMP WITH TIME ZONE | Start of the range for the chunk's dimension | | `range_end` | TIMESTAMP WITH TIME ZONE | End of the range for the chunk's dimension | | `range_start_integer` | BIGINT | Start of the range for the chunk's dimension, if the dimension type is integer based | | `range_end_integer` | BIGINT | End of the range for the chunk's dimension, if the dimension type is integer based | | `is_compressed` | BOOLEAN | Is the data in the chunk compressed? <br/><br/> Note that for distributed hypertables, this is the cached compression status of the chunk on the access node. The cached status on the access node and data node is not in sync in some scenarios. For example, if a user compresses or decompresses the chunk on the data node instead of the access node, or sets up compression policies directly on data nodes. <br/><br/> Use `chunk_compression_stats()` function to get real-time compression status for distributed chunks.| | `chunk_tablespace` | TEXT | Tablespace used by the chunk| | `data_nodes` | ARRAY | Nodes on which the chunk is replicated. This is applicable only to chunks for distributed hypertables | | `chunk_creation_time` | TIMESTAMP WITH TIME ZONE | The time when this chunk was created for data addition | ===== PAGE: https://docs.tigerdata.com/api/informational-views/data_nodes/ ===== # timescaledb_information.data_nodes Get information on data nodes. This function is specific to running TimescaleDB in a multi-node setup. [Multi-node support is sunsetted][multi-node-deprecation]. TimescaleDB v2.13 is the last release that includes multi-node support for Postgres versions 13, 14, and 15. ## Samples Get metadata related to data nodes.sql SELECT * FROM timescaledb_information.data_nodes;
node_name | owner | options --------------+------------+-------------------------------- dn1 | postgres | {host=localhost,port=15431,dbname=test} dn2 | postgres | {host=localhost,port=15432,dbname=test} (2 rows)
## Available columns |Name|Type|Description| |---|---|---| | `node_name` | TEXT | Data node name. | | `owner` | REGCLASS | Oid of the user, who added the data node. | | `options` | JSONB | Options used when creating the data node. | ===== PAGE: https://docs.tigerdata.com/api/informational-views/hypertable_compression_settings/ ===== # timescaledb_information.hypertable_compression_settings Shows information about compression settings for each hypertable chunk that has compression enabled on it. ## Samples Show compression settings for all hypertables:sql SELECT * FROM timescaledb_information.hypertable_compression_settings; hypertable | measurements chunk | _timescaledb_internal._hyper_2_97_chunk segmentby | orderby | time DESC
Find compression settings for a specific hypertable:sql SELECT * FROM timescaledb_information.hypertable_compression_settings WHERE hypertable::TEXT LIKE 'metrics'; hypertable | metrics chunk | _timescaledb_internal._hyper_1_12_chunk segmentby | metric_id orderby | time DESC
## Arguments |Name|Type|Description| |-|-|-| |`hypertable`|`REGCLASS`|Hypertable which has compression enabled| |`chunk`|`REGCLASS`|Hypertable chunk which has compression enabled| |`segmentby`|`TEXT`|List of columns used for segmenting the compressed data| |`orderby`|`TEXT`| List of columns used for ordering compressed data along with ordering and NULL ordering information| ===== PAGE: https://docs.tigerdata.com/api/informational-views/compression_settings/ ===== # timescaledb_information.compression_settings This view exists for backwards compatibility. The supported views to retrieve information about compression are: - [timescaledb_information.hypertable_compression_settings][hypertable_compression_settings] - [timescaledb_information.chunk_compression_settings][chunk_compression_settings]. This section describes a feature that is deprecated. We strongly recommend that you do not use this feature in a production environment. If you need more information, [contact us](https://www.tigerdata.com/contact/). Get information about compression-related settings for hypertables. Each row of the view provides information about individual `orderby` and `segmentby` columns used by compression. How you use `segmentby` is the single most important thing for compression. It affects compresion rates, query performance, and what is compressed or decompressed by mutable compression. ## Samplessql CREATE TABLE hypertab (a_col integer, b_col integer, c_col integer, d_col integer, e_col integer); SELECT table_name FROM create_hypertable('hypertab', by_range('a_col', 864000000));
ALTER TABLE hypertab SET (timescaledb.compress, timescaledb.compress_segmentby = 'a_col,b_col', timescaledb.compress_orderby = 'c_col desc, d_col asc nulls last');
SELECT * FROM timescaledb_information.compression_settings WHERE hypertable_name = 'hypertab';
-[ RECORD 1 ]----------+--------- hypertable_schema | public hypertable_name | hypertab attname | a_col segmentby_column_index | 1 orderby_column_index | orderby_asc | orderby_nullsfirst | -[ RECORD 2 ]----------+--------- hypertable_schema | public hypertable_name | hypertab attname | b_col segmentby_column_index | 2 orderby_column_index | orderby_asc | orderby_nullsfirst | -[ RECORD 3 ]----------+--------- hypertable_schema | public hypertable_name | hypertab attname | c_col segmentby_column_index | orderby_column_index | 1 orderby_asc | f orderby_nullsfirst | t -[ RECORD 4 ]----------+--------- hypertable_schema | public hypertable_name | hypertab attname | d_col segmentby_column_index | orderby_column_index | 2 orderby_asc | t orderby_nullsfirst | f
The `by_range` dimension builder is an addition to TimescaleDB 2.13. ## Available columns |Name|Type|Description| |---|---|---| | `hypertable_schema` | TEXT | Schema name of the hypertable | | `hypertable_name` | TEXT | Table name of the hypertable | | `attname` | TEXT | Name of the column used in the compression settings | | `segmentby_column_index` | SMALLINT | Position of attname in the compress_segmentby list | | `orderby_column_index` | SMALLINT | Position of attname in the compress_orderby list | | `orderby_asc` | BOOLEAN | True if this is used for order by ASC, False for order by DESC | | `orderby_nullsfirst` | BOOLEAN | True if nulls are ordered first for this column, False if nulls are ordered last| ===== PAGE: https://docs.tigerdata.com/api/informational-views/dimensions/ ===== # timescaledb_information.dimensions Returns information about the dimensions of a hypertable. Hypertables can be partitioned on a range of different dimensions. By default, all hypertables are partitioned on time, but it is also possible to partition on other dimensions in addition to time. For hypertables that are partitioned solely on time, `timescaledb_information.dimensions` returns a single row of metadata. For hypertables that are partitioned on more than one dimension, the call returns a row for each dimension. For time-based dimensions, the metadata returned indicates the integer datatype, such as BIGINT, INTEGER, or SMALLINT, and the time-related datatype, such as TIMESTAMPTZ, TIMESTAMP, or DATE. For space-based dimension, the metadata returned specifies the number of `num_partitions`. If the hypertable uses time data types, the `time_interval` column is defined. Alternatively, if the hypertable uses integer data types, the `integer_interval` and `integer_now_func` columns are defined. ## Samples Get information about the dimensions of hypertables.sql -- Create a range and hash partitioned hypertable CREATE TABLE dist_table(time timestamptz, device int, temp float); SELECT create_hypertable('dist_table', by_range('time', INTERVAL '7 days')); SELECT add_dimension('dist_table', by_hash('device', 3));
SELECT * from timescaledb_information.dimensions ORDER BY hypertable_name, dimension_number;
-[ RECORD 1 ]-----+------------------------- hypertable_schema | public hypertable_name | dist_table dimension_number | 1 column_name | time column_type | timestamp with time zone dimension_type | Time time_interval | 7 days integer_interval | integer_now_func | num_partitions | -[ RECORD 2 ]-----+------------------------- hypertable_schema | public hypertable_name | dist_table dimension_number | 2 column_name | device column_type | integer dimension_type | Space time_interval | integer_interval | integer_now_func | num_partitions | 2
The `by_range` and `by_hash` dimension builders are an addition to TimescaleDB 2.13. Get information about dimensions of a hypertable that has two time-based dimensions.sql CREATE TABLE hyper_2dim (a_col date, b_col timestamp, c_col integer); SELECT table_name from create_hypertable('hyper_2dim', by_range('a_col')); SELECT add_dimension('hyper_2dim', by_range('b_col', INTERVAL '7 days'));
SELECT * FROM timescaledb_information.dimensions WHERE hypertable_name = 'hyper_2dim';
-[ RECORD 1 ]-----+---------------------------- hypertable_schema | public hypertable_name | hyper_2dim dimension_number | 1 column_name | a_col column_type | date dimension_type | Time time_interval | 7 days integer_interval | integer_now_func | num_partitions | -[ RECORD 2 ]-----+---------------------------- hypertable_schema | public hypertable_name | hyper_2dim dimension_number | 2 column_name | b_col column_type | timestamp without time zone dimension_type | Time time_interval | 7 days integer_interval | integer_now_func | num_partitions |
## Available columns |Name|Type|Description| |-|-|-| |`hypertable_schema`|TEXT|Schema name of the hypertable| |`hypertable_name`|TEXT|Table name of the hypertable| |`dimension_number`|BIGINT|Dimension number of the hypertable, starting from 1| |`column_name`|TEXT|Name of the column used to create this dimension| |`column_type`|REGTYPE|Type of the column used to create this dimension| |`dimension_type`|TEXT|Is this a time based or space based dimension| |`time_interval`|INTERVAL|Time interval for primary dimension if the column type is a time datatype| |`integer_interval`|BIGINT|Integer interval for primary dimension if the column type is an integer datatype| |`integer_now_func`|TEXT|`integer_now`` function for primary dimension if the column type is an integer datatype| |`num_partitions`|SMALLINT|Number of partitions for the dimension| The `time_interval` and `integer_interval` columns are not applicable for space based dimensions. ===== PAGE: https://docs.tigerdata.com/api/informational-views/job_errors/ ===== # timescaledb_information.job_errors Shows information about runtime errors encountered by jobs run by the automation framework. This includes custom jobs and jobs run by policies created to manage data retention, continuous aggregates, columnstore, and other automation policies. For more information about automation policies, see the [policies][jobs] section. ## Samples See information about recent job failures:sql SELECT job_id, proc_schema, proc_name, pid, sqlerrcode, err_message from timescaledb_information.job_errors ;
job_id | proc_schema | proc_name | pid | sqlerrcode | err_message --------+-------------+--------------+-------+------------+----------------------------------------------------- 1001 | public | custom_proc2 | 83111 | 40001 | could not serialize access due to concurrent update 1003 | public | job_fail | 83134 | 57014 | canceling statement due to user request 1005 | public | job_fail | | | job crash detected, see server logs (3 rows)
## Available columns |Name|Type|Description| |-|-|-| |`job_id`|INTEGER|The ID of the background job created to implement the policy| |`proc_schema`|TEXT|Schema name of the function or procedure executed by the job| |`proc_name`|TEXT|Name of the function or procedure executed by the job| |`pid`|INTEGER|The process ID of the background worker executing the job. This is `NULL` in the case of a job crash| |`start_time`|TIMESTAMP WITH TIME ZONE|Start time of the job| |`finish_time`|TIMESTAMP WITH TIME ZONE|Time when error was reported| |`sqlerrcode`|TEXT|The error code associated with this error, if any. See the [official Postgres documentation](https://www.postgresql.org/docs/current/errcodes-appendix.html) for a full list of error codes| |`err_message`|TEXT|The detailed error message| ## Error retention policy The informational view `timescaledb_information.job_errors` is defined on top of the table `_timescaledb_internal.job_errors` in the internal schema. To prevent this table from growing too large, a system background job `Error Log Retention Policy [2]` is enabled by default, with this configuration:sql id | 2 application_name | Error Log Retention Policy [2] schedule_interval | 1 mon max_runtime | 01:00:00 max_retries | -1 retry_period | 01:00:00 proc_schema | _timescaledb_internal proc_name | policy_job_error_retention owner | owner must be a user with WRITE privilege on the table
_timescaledb_internal.job_errorsscheduled | t fixed_schedule | t initial_start | 2000-01-01 02:00:00+02 hypertable_id | config | {"drop_after": "1 month"} check_schema | _timescaledb_internal check_name | policy_job_error_retention_check timezone |On TimescaleDB and Managed Service for TimescaleDB, the owner of the error retention job is `tsdbadmin`. In an on-premise installation, the owner of the job is the same as the extension owner. The owner of the retention job can alter it and delete it. For example, the owner can change the retention interval like this:sql SELECT alter_job(id,config:=jsonb_set(config,'{drop_after}', '"2 weeks"')) FROM _timescaledb_config.bgw_job WHERE id = 2;
===== PAGE: https://docs.tigerdata.com/api/informational-views/job_history/ ===== # timescaledb_information.history Shows information about the jobs run by the automation framework. This includes custom jobs and jobs run by policies created to manage data retention, continuous aggregates, columnstore, and other automation policies. For more information about automation policies, see [jobs][jobs]. ## Samples To retrieve information about recent jobs:sql SELECT job_id, pid, proc_schema, proc_name, succeeded, config, sqlerrcode, err_message FROM timescaledb_information.job_history ORDER BY id, job_id; job_id | pid | proc_schema | proc_name | succeeded | config | sqlerrcode | err_message --------+---------+-------------+------------------+-----------+------------+------------+------------------ 1001 | 1779278 | public | custom_job_error | f | | 22012 | division by zero 1000 | 1779407 | public | custom_job_ok | t | | | 1001 | 1779408 | public | custom_job_error | f | | 22012 | division by zero 1000 | 1779467 | public | custom_job_ok | t | {"foo": 1} | | 1001 | 1779468 | public | custom_job_error | f | {"bar": 1} | 22012 | division by zero (5 rows)
## Available columns |Name|Type|Description| |-|-|-| |`id`|INTEGER|The sequencial ID to identify the job execution| |`job_id`|INTEGER|The ID of the background job created to implement the policy| |`succeeded`|BOOLEAN|`TRUE` when the job ran successfully, `FALSE` for failed executions| |`proc_schema`|TEXT| The schema name of the function or procedure executed by the job| |`proc_name`|TEXT| The name of the function or procedure executed by the job| |`pid`|INTEGER|The process ID of the background worker executing the job. This is `NULL` in the case of a job crash| |`start_time`|TIMESTAMP WITH TIME ZONE| The time the job started| |`finish_time`|TIMESTAMP WITH TIME ZONE| The time when the error was reported| |`config`|JSONB| The job configuration at the moment of execution| |`sqlerrcode`|TEXT|The error code associated with this error, if any. See the [official Postgres documentation](https://www.postgresql.org/docs/current/errcodes-appendix.html) for a full list of error codes| |`err_message`|TEXT|The detailed error message| ## Error retention policy The `timescaledb_information.job_history` informational view is defined on top of the `_timescaledb_internal.bgw_job_stat_history` table in the internal schema. To prevent this table from growing too large, the `Job History Log Retention Policy [3]` system background job is enabled by default, with this configuration:sql job_id | 3 application_name | Job History Log Retention Policy [3] schedule_interval | 1 mon max_runtime | 01:00:00 max_retries | -1 retry_period | 01:00:00 proc_schema | _timescaledb_functions proc_name | policy_job_stat_history_retention owner | owner must be a user with WRITE privilege on the table
_timescaledb_internal.bgw_job_stat_historyscheduled | t fixed_schedule | t config | {"drop_after": "1 month"} next_start | 2024-06-01 01:00:00+00 initial_start | 2000-01-01 00:00:00+00 hypertable_schema | hypertable_name | check_schema | _timescaledb_functions check_name | policy_job_stat_history_retention_checkOn TimescaleDB and Managed Service for TimescaleDB, the owner of the job history retention job is `tsdbadmin`. In an on-premise installation, the owner of the job is the same as the extension owner. The owner of the retention job can alter it and delete it. For example, the owner can change the retention interval like this:sql SELECT alter_job(id,config:=jsonb_set(config,'{drop_after}', '"2 weeks"')) FROM _timescaledb_config.bgw_job WHERE id = 3;
===== PAGE: https://docs.tigerdata.com/api/informational-views/job_stats/ ===== # timescaledb_information.job_stats Shows information and statistics about jobs run by the automation framework. This includes jobs set up for user defined actions and jobs run by policies created to manage data retention, continuous aggregates, columnstore, and other automation policies. (See [policies][actions]). The statistics include information useful for administering jobs and determining whether they ought be rescheduled, such as: when and whether the background job used to implement the policy succeeded and when it is scheduled to run next. ## Samples Get job success/failure information for a specific hypertable.sql SELECT job_id, total_runs, total_failures, total_successes FROM timescaledb_information.job_stats WHERE hypertable_name = 'test_table';
job_id | total_runs | total_failures | total_successes --------+------------+----------------+----------------- 1001 | 1 | 0 | 1 1004 | 1 | 0 | 1 (2 rows)
Get information about continuous aggregate policy related statisticssql SELECT js.* FROM timescaledb_information.job_stats js, timescaledb_information.continuous_aggregates cagg WHERE cagg.view_name = 'max_mat_view_timestamp' and cagg.materialization_hypertable_name = js.hypertable_name;
-[ RECORD 1 ]----------+------------------------------ hypertable_schema | _timescaledb_internal hypertable_name | _materialized_hypertable_2 job_id | 1001 last_run_started_at | 2020-10-02 09:38:06.871953-04 last_successful_finish | 2020-10-02 09:38:06.932675-04 last_run_status | Success job_status | Scheduled last_run_duration | 00:00:00.060722 next_start | 2020-10-02 10:38:06.932675-04 total_runs | 1 total_successes | 1 total_failures | 0
## Available columns <!-- vale Google.Acronyms = NO --> |Name|Type|Description| |---|---|---| |`hypertable_schema` | TEXT | Schema name of the hypertable | |`hypertable_name` | TEXT | Table name of the hypertable | |`job_id` | INTEGER | The id of the background job created to implement the policy | |`last_run_started_at`| TIMESTAMP WITH TIME ZONE | Start time of the last job| |`last_successful_finish`| TIMESTAMP WITH TIME ZONE | Time when the job completed successfully| |`last_run_status` | TEXT | Whether the last run succeeded or failed | |`job_status`| TEXT | Status of the job. Valid values are 'Running', 'Scheduled' and 'Paused'| |`last_run_duration`| INTERVAL | Duration of last run of the job| |`next_start` | TIMESTAMP WITH TIME ZONE | Start time of the next run | |`total_runs` | BIGINT | The total number of runs of this job| |`total_successes` | BIGINT | The total number of times this job succeeded | |`total_failures` | BIGINT | The total number of times this job failed | <!-- vale Google.Acronyms = YES --> ===== PAGE: https://docs.tigerdata.com/api/informational-views/continuous_aggregates/ ===== # timescaledb_information.continuous_aggregates Get metadata and settings information for continuous aggregates. ## Samplessql SELECT * FROM timescaledb_information.continuous_aggregates;
-[ RECORD 1 ]---------------------+------------------------------------------------- hypertable_schema | public hypertable_name | foo view_schema | public view_name | contagg_view view_owner | postgres materialized_only | f compression_enabled | f materialization_hypertable_schema | _timescaledb_internal materialization_hypertable_name | _materialized_hypertable_2 view_definition | SELECT foo.a, +
| COUNT(foo.b) AS countb + | FROM foo + | GROUP BY (time_bucket('1 day', foo.a)), foo.a;finalized | t
## Available columns |Name|Type|Description| |---|---|---| |`hypertable_schema` | TEXT | Schema of the hypertable from the continuous aggregate view| |`hypertable_name` | TEXT | Name of the hypertable from the continuous aggregate view| |`view_schema` | TEXT | Schema for continuous aggregate view | |`view_name` | TEXT | User supplied name for continuous aggregate view | |`view_owner` | TEXT | Owner of the continuous aggregate view| |`materialized_only` | BOOLEAN | Return only materialized data when querying the continuous aggregate view| |`compression_enabled` | BOOLEAN | Is compression enabled for the continuous aggregate view?| |`materialization_hypertable_schema` | TEXT | Schema of the underlying materialization table| |`materialization_hypertable_name` | TEXT | Name of the underlying materialization table| |`view_definition` | TEXT | `SELECT` query for continuous aggregate view| |`finalized`| BOOLEAN | Whether the continuous aggregate stores data in finalized or partial form. Since TimescaleDB 2.7, the default is finalized. | ===== PAGE: https://docs.tigerdata.com/api/jobs-automation/alter_job/ ===== # alter_job() Jobs scheduled using the TimescaleDB automation framework run periodically in a background worker. You can change the schedule of these jobs with the `alter_job` function. To alter an existing job, refer to it by `job_id`. The `job_id` runs a given job, and its current schedule can be found in the `timescaledb_information.jobs` view, which lists information about every scheduled jobs, as well as in `timescaledb_information.job_stats`. The `job_stats` view also gives information about when each job was last run and other useful statistics for deciding what the new schedule should be. ## Samples Reschedules job ID `1000` so that it runs every two days:sql SELECT alter_job(1000, schedule_interval => INTERVAL '2 days');
Disables scheduling of the compression policy on the `conditions` hypertable:sql SELECT alter_job(job_id, scheduled => false) FROM timescaledb_information.jobs WHERE proc_name = 'policy_compression' AND hypertable_name = 'conditions'
Reschedules continuous aggregate job ID `1000` so that it next runs at 9:00:00 on 15 March, 2020:sql SELECT alter_job(1000, next_start => '2020-03-15 09:00:00.0+00');
## Required arguments |Name|Type|Description| |-|-|-| |`job_id`|`INTEGER`|The ID of the policy job being modified| ## Optional arguments |Name|Type| Description | |-|-|--------------------------------------------------------------------------------------------------------------------------------------------------------------------------------------------------------------------------------------------------------------------------------------------------------------------------------------------------------------------------------------------------------------------------------------------------------------------------------------------------------------------------------------------------------------------------------------------------------------------------------------------------------------------------------------------------------------------------------------------------------------------------------------------------------------------------------------------------------------------| |`schedule_interval`|`INTERVAL`| The interval at which the job runs. Defaults to 24 hours. | |`max_runtime`|`INTERVAL`| The maximum amount of time the job is allowed to run by the background worker scheduler before it is stopped. | |`max_retries`|`INTEGER`| The number of times the job is retried if it fails. | |`retry_period`|`INTERVAL`| The amount of time the scheduler waits between retries of the job on failure. | |`scheduled`|`BOOLEAN`| Set to `FALSE` to exclude this job from being run as background job. | |`config`|`JSONB`| Job-specific configuration, passed to the function when it runs. This includes: <li><code>verbose_log</code>: boolean, defaults to <code>false</code>. Enable verbose logging output when running the compression policy.</li><li><code>maxchunks_to_compress</code>: integer, defaults to <code>0</code> (no limit). The maximum number of chunks to compress during a policy run.</li><li><code>recompress</code>: boolean, defaults to <code>true</code>. Recompress partially compressed chunks.</li><li><code>compress_after</code>: see <code>[add_compression_policy][add-policy]</code>.</li><li><code>compress_created_before</code>: see <code>[add_compression_policy][add-policy]</code>.</li> | |`next_start`|`TIMESTAMPTZ`| The next time at which to run the job. The job can be paused by setting this value to `infinity`, and restarted with a value of `now()`. | |`if_exists`|`BOOLEAN`| Set to `true`to issue a notice instead of an error if the job does not exist. Defaults to false. | |`check_config`|`REGPROC`| A function that takes a single argument, the `JSONB` `config` structure. The function is expected to raise an error if the configuration is not valid, and return nothing otherwise. Can be used to validate the configuration when updating a job. Only functions, not procedures, are allowed as values for `check_config`. | |`fixed_schedule`|`BOOLEAN`| To enable fixed scheduled job runs, set to `TRUE`. | |`initial_start`|`TIMESTAMPTZ`| Set the time when the `fixed_schedule` job run starts. For example, `19:10:25-07`. | |`timezone`|`TEXT`| Address the 1-hour shift in start time when clocks change from [Daylight Saving Time to Standard Time](https://en.wikipedia.org/wiki/Daylight_saving_time). For example, `America/Sao_Paulo`. | When a job begins, the `next_start` parameter is set to `infinity`. This prevents the job from attempting to be started again while it is running. When the job completes, whether or not the job is successful, the parameter is automatically updated to the next computed start time. Note that altering the `next_start` value is only effective for the next execution of the job in case of fixed schedules. On the next execution, it will automatically return to the schedule. ## Returns |Column|Type| Description | |-|-|---------------------------------------------------------------------------------------------------------------| |`job_id`|`INTEGER`| The ID of the job being modified | |`schedule_interval`|`INTERVAL`| The interval at which the job runs. Defaults to 24 hours | |`max_runtime`|`INTERVAL`| The maximum amount of time the job is allowed to run by the background worker scheduler before it is stopped | |`max_retries`|INTEGER| The number of times the job is retried if it fails | |`retry_period`|`INTERVAL`| The amount of time the scheduler waits between retries of the job on failure | |`scheduled`|`BOOLEAN`| Returns `true` if the job is executed by the TimescaleDB scheduler | |`config`|`JSONB`| Jobs-specific configuration, passed to the function when it runs | |`next_start`|`TIMESTAMPTZ`| The next time to run the job | |`check_config`|`TEXT`| The function used to validate updated job configurations | ## Calculation of next start on failure When a job run results in a runtime failure, the next start of the job is calculated taking into account both its `retry_period` and `schedule_interval`. The `next_start` time is calculated using the following formula:next_start = finish_time + consecutive_failures * retry_period ± jitter
where jitter (± 13%) is added to avoid the "thundering herds" effect. To ensure that the `next_start` time is not put off indefinitely or produce timestamps so large they end up out of range, it is capped at 5*`schedule_interval`. Also, more than 20 consecutive failures are not considered, so if the number of consecutive failures is higher, then it multiplies by 20. Additionally, for jobs with fixed schedules, the system ensures that if the next start ( calculated as specified), surpasses the next scheduled execution, the job is executed again at the next scheduled slot and not after that. This ensures that the job does not miss scheduled executions. There is a distinction between runtime failures that do not cause the job to crash and job crashes. In the event of a job crash, the next start calculation follows the same formula, but it is always at least 5 minutes after the job's last finish, to give an operator enough time to disable it before another crash. ===== PAGE: https://docs.tigerdata.com/api/jobs-automation/delete_job/ ===== # delete_job() Delete a job registered with the automation framework. This works for jobs as well as policies. If the job is currently running, the process is terminated. ## Samples Delete the job with the job id 1000:sql SELECT delete_job(1000);
## Required arguments |Name|Type|Description| |---|---|---| |`job_id`| INTEGER | TimescaleDB background job id | ===== PAGE: https://docs.tigerdata.com/api/jobs-automation/run_job/ ===== # run_job() Run a previously registered job in the current session. This works for job as well as policies. Since `run_job` is implemented as stored procedure it cannot be executed inside a SELECT query but has to be executed with `CALL`. Any background worker job can be run in the foreground when executed with `run_job`. You can use this with an increased log level to help debug problems. ## Samples Set log level shown to client to `DEBUG1` and run the job with the job ID 1000:sql SET client_min_messages TO DEBUG1; CALL run_job(1000);
## Required arguments |Name|Description| |---|---| |`job_id`| (INTEGER) TimescaleDB background job ID | ===== PAGE: https://docs.tigerdata.com/api/jobs-automation/add_job/ ===== # add_job() Register a job for scheduling by the automation framework. For more information about scheduling, including example jobs, see the [jobs documentation section][using-jobs]. ## Samples Register the `user_defined_action` procedure to run every hour:sql CREATE OR REPLACE PROCEDURE user_defined_action(job_id int, config jsonb) LANGUAGE PLPGSQL AS $$ BEGIN RAISE NOTICE 'Executing action % with config %', job_id, config; END $$;
SELECT add_job('user_defined_action','1h'); SELECT add_job('user_defined_action','1h', fixed_schedule => false);
Register the `user_defined_action` procedure to run at midnight every Sunday. The `initial_start` provided must satisfy these requirements, so it must be a Sunday midnight:sql -- December 4, 2022 is a Sunday SELECT add_job('user_defined_action','1 week', initial_start => '2022-12-04 00:00:00+00'::timestamptz); -- if subject to DST SELECT add_job('user_defined_action','1 week', initial_start => '2022-12-04 00:00:00+00'::timestamptz, timezone => 'Europe/Berlin');
## Required arguments |Name|Type| Description | |-|-|---------------------------------------------------------------| |`proc`|REGPROC| Name of the function or procedure to register as a job. | |`schedule_interval`|INTERVAL| Interval between executions of this job. Defaults to 24 hours | ## Optional arguments |Name|Type| Description | |-|-|------------------------------------------------------------------------------------------------------------------------------------------------------------------------------------------------------------------------------------------------------------------------------------------------------------------------------| |`config`|JSONB| Jobs-specific configuration, passed to the function when it runs | |`initial_start`|TIMESTAMPTZ| Time the job is first run. In the case of fixed schedules, this also serves as the origin on which job executions are aligned. If omitted, the current time is used as origin in the case of fixed schedules. | |`scheduled`|BOOLEAN| Set to `FALSE` to exclude this job from scheduling. Defaults to `TRUE`. | |`check_config`|`REGPROC`| A function that takes a single argument, the `JSONB` `config` structure. The function is expected to raise an error if the configuration is not valid, and return nothing otherwise. Can be used to validate the configuration when adding a job. Only functions, not procedures, are allowed as values for `check_config`. | |`fixed_schedule`|BOOLEAN| Set to `FALSE` if you want the next start of a job to be determined as its last finish time plus the schedule interval. Set to `TRUE` if you want the next start of a job to begin `schedule_interval` after the last start. Defaults to `TRUE` | |`timezone`|TEXT| A valid time zone. If fixed_schedule is `TRUE`, subsequent executions of the job are aligned on its initial start. However, daylight savings time (DST) changes may shift this alignment. Set to a valid time zone if you want to mitigate this issue. Defaults to `NULL`. | ## Returns |Column|Type|Description| |-|-|-| |`job_id`|INTEGER|TimescaleDB background job ID| ===== PAGE: https://docs.tigerdata.com/api/data-retention/add_retention_policy/ ===== # add_retention_policy() Create a policy to drop chunks older than a given interval of a particular hypertable or continuous aggregate on a schedule in the background. For more information, see the [drop_chunks][drop_chunks] section. This implements a data retention policy and removes data on a schedule. Only one retention policy may exist per hypertable. When you create a retention policy on a hypertable with an integer based time column, you must set the [integer_now_func][set_integer_now_func] to match your data. If you are seeing `invalid value` issues when you call `add_retention_policy`, set `VERBOSITY verbose` to see the full context. ## Samples - **Create a data retention policy to discard chunks greater than 6 months old**: ```sql SELECT add_retention_policy('conditions', drop_after => INTERVAL '6 months'); ``` When you call `drop_after`, the time data range present in the partitioning time column is used to select the target chunks. - **Create a data retention policy with an integer-based time column**: ```sql SELECT add_retention_policy('conditions', drop_after => BIGINT '600000'); ``` - **Create a data retention policy to discard chunks created before 6 months**: ```sql SELECT add_retention_policy('conditions', drop_created_before => INTERVAL '6 months'); ``` When you call `drop_created_before`, chunks created 3 months ago are selected. ## Arguments | Name | Type | Default | Required | Description | |-|-|-|-|-------------------------------------------------------------------------------------------------------------------------------------------------------------------------------------------------------------------------------------------------------------------------------------------------------------------------------------------------------------------------------------------------------------------------------------------------| |`relation`|REGCLASS|-|✔| Name of the hypertable or continuous aggregate to create the policy for | |`drop_after`|INTERVAL or INTEGER|-|✔| Chunks fully older than this interval when the policy is run are dropped. <BR/> You specify `drop_after` differently depending on the hypertable time column type: <ul><li>TIMESTAMP, TIMESTAMPTZ, and DATE: use INTERVAL type</li><li>Integer-based timestamps: use INTEGER type. You must set <a href="https://docs.tigerdata.com/api/latest/hypertable/set_integer_now_func/">integer_now_func</a> to match your data</li></ul> | |`schedule_interval`|INTERVAL|`NULL`|✖| The interval between the finish time of the last execution and the next start. | |`initial_start`|TIMESTAMPTZ|`NULL`|✖| Time the policy is first run. If omitted, then the schedule interval is the interval between the finish time of the last execution and the next start. If provided, it serves as the origin with respect to which the next_start is calculated. | |`timezone`|TEXT|`NULL`|✖| A valid time zone. If `initial_start` is also specified, subsequent executions of the retention policy are aligned on its initial start. However, daylight savings time (DST) changes may shift this alignment. Set to a valid time zone if this is an issue you want to mitigate. If omitted, UTC bucketing is performed. | |`if_not_exists`|BOOLEAN|`false`|✖| Set to `true` to avoid an error if the `drop_chunks_policy` already exists. A notice is issued instead. | |`drop_created_before`|INTERVAL|`NULL`|✖| Chunks with creation time older than this cut-off point are dropped. The cut-off point is computed as `now() - drop_created_before`. Not supported for continuous aggregates yet. | You specify `drop_after` differently depending on the hypertable time column type: * TIMESTAMP, TIMESTAMPTZ, and DATE time columns: the time interval should be an INTERVAL type. * Integer-based timestamps: the time interval should be an integer type. You must set the [integer_now_func][set_integer_now_func]. ## Returns |Column|Type|Description| |-|-|-| |`job_id`|INTEGER|TimescaleDB background job ID created to implement this policy| ===== PAGE: https://docs.tigerdata.com/api/data-retention/remove_retention_policy/ ===== # remove_retention_policy() Remove a policy to drop chunks of a particular hypertable. ## Samplessql SELECT remove_retention_policy('conditions');
Removes the existing data retention policy for the `conditions` table. ## Required arguments |Name|Type|Description| |---|---|---| | `relation` | REGCLASS | Name of the hypertable or continuous aggregate from which to remove the policy | ## Optional arguments |Name|Type|Description| |---|---|---| | `if_exists` | BOOLEAN | Set to true to avoid throwing an error if the policy does not exist. Defaults to false.| ===== PAGE: https://docs.tigerdata.com/api/hypertable/create_table/ ===== # CREATE TABLE Create a [hypertable][hypertable-docs] partitioned on a single dimension with [columnstore][hypercore] enabled, or create a standard Postgres relational table. A hypertable is a specialized Postgres table that automatically partitions your data by time. All actions that work on a Postgres table, work on hypertables. For example, [ALTER TABLE][alter_table_hypercore] and [SELECT][sql-select]. By default, a hypertable is partitioned on the time dimension. To add secondary dimensions to a hypertable, call [add_dimension][add-dimension]. To convert an existing relational table into a hypertable, call [create_hypertable][create_hypertable]. As the data cools and becomes more suited for analytics, [add a columnstore policy][add_columnstore_policy] so your data is automatically converted to the columnstore after a specific time interval. This columnar format enables fast scanning and aggregation, optimizing performance for analytical workloads while also saving significant storage space. In the columnstore conversion, hypertable chunks are compressed by up to 98%, and organized for efficient, large-scale queries. This columnar format enables fast scanning and aggregation, optimizing performance for analytical workloads. You can also manually [convert chunks][convert_to_columnstore] in a hypertable to the columnstore. Hypertable to hypertable foreign keys are not allowed, all other combinations are permitted. The [columnstore][hypercore] settings are applied on a per-chunk basis. You can change the settings by calling [ALTER TABLE][alter_table_hypercore] without first converting the entire hypertable back to the [rowstore][hypercore]. The new settings apply only to the chunks that have not yet been converted to columnstore, the existing chunks in the columnstore do not change. Similarly, if you [remove an existing columnstore policy][remove_columnstore_policy] and then [add a new one][add_columnstore_policy], the new policy applies only to the unconverted chunks. This means that chunks with different columnstore settings can co-exist in the same hypertable. TimescaleDB calculates default columnstore settings for each chunk when it is created. These settings apply to each chunk, and not the entire hypertable. To explicitly disable the defaults, set a setting to an empty string. `CREATE TABLE` extends the standard Postgres [CREATE TABLE][pg-create-table]. This page explains the features and arguments specific to TimescaleDB. Since [TimescaleDB v2.20.0](https://github.com/timescale/timescaledb/releases/tag/2.20.0) ## Samples - **Create a hypertable partitioned on the time dimension and enable columnstore**: 1. Create the hypertable: ```sql CREATE TABLE crypto_ticks ( "time" TIMESTAMPTZ, symbol TEXT, price DOUBLE PRECISION, day_volume NUMERIC ) WITH ( tsdb.hypertable, tsdb.partition_column='time', tsdb.segmentby='symbol', tsdb.orderby='time DESC' ); ``` 1. Enable hypercore by adding a columnstore policy: ```sql CALL add_columnstore_policy('crypto_ticks', after => INTERVAL '1d'); ``` - **Create a hypertable partitioned on the time with fewer chunks based on time interval**:sql CREATE TABLE IF NOT EXISTS hypertable_control_chunk_interval(
time int4 NOT NULL, device text, value float) WITH (
tsdb.hypertable, tsdb.partition_column='time', tsdb.chunk_interval=3453);
- **Create a hypertable partitioned using [UUIDv7][uuidv7_functions]**: <Terminal> ```sql -- For optimal compression on the ID column, first enable UUIDv7 compression SET enable_uuid_compression=true; -- Then create your table CREATE TABLE events ( id uuid PRIMARY KEY DEFAULT generate_uuidv7(), payload jsonb ) WITH (tsdb.hypertable, tsdb.partition_column = 'id'); ``` ```sql -- For optimal compression on the ID column, first enable UUIDv7 compression SET enable_uuid_compression=true; -- Then create your table CREATE TABLE events ( id uuid PRIMARY KEY DEFAULT uuidv7(), payload jsonb ) WITH (tsdb.hypertable, tsdb.partition_column = 'id'); ``` </Terminal> - **Enable data compression during ingestion**: When you set `timescaledb.enable_direct_compress_copy` your data gets compressed in memory during ingestion with `COPY` statements. By writing the compressed batches immediately in the columnstore, the IO footprint is significantly lower. Also, the [columnstore policy][add_columnstore_policy] you set is less important, `INSERT` already produces compressed chunks. Please note that this feature is a **tech preview** and not production-ready. Using this feature could lead to regressed query performance and/or storage ratio, if the ingested batches are not correctly ordered or are of too high cardinality. To enable in-memory data compression during ingestion:sql SET timescaledb.enable_direct_compress_copy=on;
**Important facts** - High cardinality use cases do not produce good batches and lead to degreaded query performance. - The columnstore is optimized to store 1000 records per batch, which is the optimal format for ingestion per segment by. - WAL records are written for the compressed batches rather than the individual tuples. - Currently only `COPY` is support, `INSERT` will eventually follow. - Best results are achieved for batch ingestion with 1000 records or more, upper boundary is 10.000 records. - Continous Aggregates are **not** supported at the moment. 1. Create a hypertable: ```sql CREATE TABLE t(time timestamptz, device text, value float) WITH (tsdb.hypertable,tsdb.partition_column='time'); ``` 1. Copy data into the hypertable: You achieve the highest insert rate using binary format. CSV and text format are also supported. ```sql COPY t FROM '/tmp/t.binary' WITH (format binary); ``` - **Create a Postgres relational table**:sql CREATE TABLE IF NOT EXISTS relational_table(
device text, value float);
## Arguments The syntax is:sql CREATE TABLE ( -- Standard Postgres syntax for CREATE TABLE ) WITH ( tsdb.hypertable = true | false tsdb.partition_column = ' ', tsdb.chunk_interval = '' tsdb.create_default_indexes = true | false tsdb.associated_schema = '', tsdb.associated_table_prefix = '' tsdb.orderby = ' [ASC | DESC] [ NULLS { FIRST | LAST } ] [, ...]', tsdb.segmentby = ' [, ...]', tsdb.sparse_index = '(), index()' )
| Name | Type | Default | Required | Description | |--------------------------------|------------------|-----------------------------------------------------------------------------------------------------------------------------------------------------------------------------------------------------------------------------------|-------------------------------------------------------------|-------------------------------------------------------------------------------------------------------------------------------------------------------------------------------------------------------------------------------------------------------------------------------------------------------------------------------------------------------------------------------------------------------------------------------------------------------------------------------------------------------------------------------------------------------------------------------------------------------------------------------------------------| | `tsdb.hypertable` |BOOLEAN| `true` | ✖ | Create a new [hypertable][hypertable-docs] for time-series data rather than a standard Postgres relational table. | | `tsdb.partition_column` |TEXT| `true` | ✖ | Set the time column to automatically partition your time-series data by. | | `tsdb.chunk_interval` |TEXT| `7 days` | ✖ | Change this to better suit your needs. For example, if you set `chunk_interval` to 1 day, each chunk stores data from the same day. Data from different days is stored in different chunks. | | `tsdb.create_default_indexes` | BOOLEAN | `true` | ✖ | Set to `false` to not automatically create indexes. <br/> The default indexes are: <ul><li>On all hypertables, a descending index on `partition_column`</li><li>On hypertables with space partitions, an index on the space parameter and `partition_column`</li></ul> | | `tsdb.associated_schema` |REGCLASS| `_timescaledb_internal` | ✖ | Set the schema name for internal hypertable tables. | | `tsdb.associated_table_prefix` |TEXT| `_hyper` | ✖ | Set the prefix for the names of internal hypertable chunks. | | `tsdb.orderby` |TEXT| Descending order on the time column in `table_name`. | ✖| The order in which items are used in the columnstore. Specified in the same way as an `ORDER BY` clause in a `SELECT` query. Setting `tsdb.orderby` automatically creates an implicit min/max sparse index on the `orderby` column. | | `tsdb.segmentby` |TEXT| TimescaleDB looks at [`pg_stats`](https://www.postgresql.org/docs/current/view-pg-stats.html) and determines an appropriate column based on the data cardinality and distribution. If `pg_stats` is not available, TimescaleDB looks for an appropriate column from the existing indexes. | ✖| Set the list of columns used to segment data in the columnstore for `table`. An identifier representing the source of the data such as `device_id` or `tags_id` is usually a good candidate. | |`tsdb.sparse_index`| TEXT | TimescaleDB evaluates the columns you already have indexed, checks which data types are a good fit for sparse indexing, then creates a sparse index as an optimization. | ✖ | Configure the sparse indexes for compressed chunks. Requires setting `tsdb.orderby`. Supported index types include: <li> `bloom(<column_name>)`: a probabilistic index, effective for `=` filters. Cannot be applied to `tsdb.orderby` columns.</li> <li> `minmax(<column_name>)`: stores min/max values for each compressed chunk. Setting `tsdb.orderby` automatically creates an implicit min/max sparse index on the `orderby` column. </li> Define multiple indexes using a comma-separated list. You can set only one index per column. Set to an empty string to avoid using sparse indexes and explicitly disable the default behavior. | ## Returns TimescaleDB returns a simple message indicating success or failure. ===== PAGE: https://docs.tigerdata.com/api/hypertable/drop_chunks/ ===== # drop_chunks() Removes data chunks whose time range falls completely before (or after) a specified time. Shows a list of the chunks that were dropped, in the same style as the `show_chunks` [function][show_chunks]. Chunks are constrained by a start and end time and the start time is always before the end time. A chunk is dropped if its end time is older than the `older_than` timestamp or, if `newer_than` is given, its start time is newer than the `newer_than` timestamp. Note that, because chunks are removed if and only if their time range falls fully before (or after) the specified timestamp, the remaining data may still contain timestamps that are before (or after) the specified one. Chunks can only be dropped based on their time intervals. They cannot be dropped based on a hash partition. ## Samples Drop all chunks from hypertable `conditions` older than 3 months:sql SELECT drop_chunks('conditions', INTERVAL '3 months');
Example output:sql
drop_chunks
_timescaledb_internal._hyper_3_5_chunk _timescaledb_internal._hyper_3_6_chunk _timescaledb_internal._hyper_3_7_chunk _timescaledb_internal._hyper_3_8_chunk _timescaledb_internal._hyper_3_9_chunk (5 rows)
Drop all chunks from hypertable `conditions` created before 3 months:sql SELECT drop_chunks('conditions', created_before => now() - INTERVAL '3 months');
Drop all chunks more than 3 months in the future from hypertable `conditions`. This is useful for correcting data ingested with incorrect clocks:sql SELECT drop_chunks('conditions', newer_than => now() + interval '3 months');
Drop all chunks from hypertable `conditions` before 2017:sql SELECT drop_chunks('conditions', '2017-01-01'::date);
Drop all chunks from hypertable `conditions` before 2017, where time column is given in milliseconds from the UNIX epoch:sql SELECT drop_chunks('conditions', 1483228800000);
Drop all chunks older than 3 months ago and newer than 4 months ago from hypertable `conditions`:sql SELECT drop_chunks('conditions', older_than => INTERVAL '3 months', newer_than => INTERVAL '4 months')
Drop all chunks created 3 months ago and created 4 months before from hypertable `conditions`:sql SELECT drop_chunks('conditions', created_before => INTERVAL '3 months', created_after => INTERVAL '4 months')
Drop all chunks older than 3 months ago across all hypertables:sql SELECT drop_chunks(format('%I.%I', hypertable_schema, hypertable_name)::regclass, INTERVAL '3 months') FROM timescaledb_information.hypertables;
## Required arguments |Name|Type|Description| |-|-|-| |`relation`|REGCLASS|Hypertable or continuous aggregate from which to drop chunks.| ## Optional arguments |Name|Type|Description| |-|-|-| |`older_than`|ANY|Specification of cut-off point where any chunks older than this timestamp should be removed.| |`newer_than`|ANY|Specification of cut-off point where any chunks newer than this timestamp should be removed.| |`verbose`|BOOLEAN|Setting to true displays messages about the progress of the reorder command. Defaults to false.| |`created_before`|ANY|Specification of cut-off point where any chunks created before this timestamp should be removed.| |`created_after`|ANY|Specification of cut-off point where any chunks created after this timestamp should be removed.| The `older_than` and `newer_than` parameters can be specified in two ways: * **interval type:** The cut-off point is computed as `now() - older_than` and similarly `now() - newer_than`. An error is returned if an INTERVAL is supplied and the time column is not one of a `TIMESTAMP`, `TIMESTAMPTZ`, or `DATE`. * **timestamp, date, or integer type:** The cut-off point is explicitly given as a `TIMESTAMP` / `TIMESTAMPTZ` / `DATE` or as a `SMALLINT` / `INT` / `BIGINT`. The choice of timestamp or integer must follow the type of the hypertable's time column. The `created_before` and `created_after` parameters can be specified in two ways: * **interval type:** The cut-off point is computed as `now() - created_before` and similarly `now() - created_after`. This uses the chunk creation time relative to the current time for the filtering. * **timestamp, date, or integer type:** The cut-off point is explicitly given as a `TIMESTAMP` / `TIMESTAMPTZ` / `DATE` or as a `SMALLINT` / `INT` / `BIGINT`. The choice of integer value must follow the type of the hypertable's partitioning column. Otherwise the chunk creation time is used for the filtering. When using just an interval type, the function assumes that you are removing things _in the past_. If you want to remove data in the future, for example to delete erroneous entries, use a timestamp. When both `older_than` and `newer_than` arguments are used, the function returns the intersection of the resulting two ranges. For example, specifying `newer_than => 4 months` and `older_than => 3 months` drops all chunks between 3 and 4 months old. Similarly, specifying `newer_than => '2017-01-01'` and `older_than => '2017-02-01'` drops all chunks between '2017-01-01' and '2017-02-01'. Specifying parameters that do not result in an overlapping intersection between two ranges results in an error. When both `created_before` and `created_after` arguments are used, the function returns the intersection of the resulting two ranges. For example, specifying `created_after` => 4 months` and `created_before`=> 3 months` drops all chunks created between 3 and 4 months from now. Similarly, specifying `created_after`=> '2017-01-01'` and `created_before` => '2017-02-01'` drops all chunks created between '2017-01-01' and '2017-02-01'. Specifying parameters that do not result in an overlapping intersection between two ranges results in an error. The `created_before`/`created_after` parameters cannot be used together with `older_than`/`newer_than`. ===== PAGE: https://docs.tigerdata.com/api/hypertable/detach_chunk/ ===== # detach_chunk() Separate a chunk from a [hypertable][hypertables-section].  `chunk` becomes a standalone hypertable with the same name and schema. All existing constraints and indexes on `chunk` are preserved after detaching. Foreign keys are dropped. In this initial release, you cannot detach a chunk that has been [converted to the columnstore][setup-hypercore]. Since [TimescaleDB v2.21.0](https://github.com/timescale/timescaledb/releases/tag/2.21.0) ## Samples Detach a chunk from a hypertable:sql CALL detach_chunk('_timescaledb_internal._hyper_1_2_chunk');
## Arguments |Name|Type| Description | |---|---|------------------------------| | `chunk` | REGCLASS | Name of the chunk to detach. | ## Returns This function returns void. ===== PAGE: https://docs.tigerdata.com/api/hypertable/attach_tablespace/ ===== # attach_tablespace() Attach a tablespace to a hypertable and use it to store chunks. A [tablespace][postgres-tablespaces] is a directory on the filesystem that allows control over where individual tables and indexes are stored on the filesystem. A common use case is to create a tablespace for a particular storage disk, allowing tables to be stored there. To learn more, see the [Postgres documentation on tablespaces][postgres-tablespaces]. TimescaleDB can manage a set of tablespaces for each hypertable, automatically spreading chunks across the set of tablespaces attached to a hypertable. If a hypertable is hash partitioned, TimescaleDB tries to place chunks that belong to the same partition in the same tablespace. Changing the set of tablespaces attached to a hypertable may also change the placement behavior. A hypertable with no attached tablespaces has its chunks placed in the database's default tablespace. ## Samples Attach the tablespace `disk1` to the hypertable `conditions`:sql SELECT attach_tablespace('disk1', 'conditions'); SELECT attach_tablespace('disk2', 'conditions', if_not_attached => true);
## Required arguments |Name|Type|Description| |---|---|---| | `tablespace` | TEXT | Name of the tablespace to attach.| | `hypertable` | REGCLASS | Hypertable to attach the tablespace to.| Tablespaces need to be [created][postgres-createtablespace] before being attached to a hypertable. Once created, tablespaces can be attached to multiple hypertables simultaneously to share the underlying disk storage. Associating a regular table with a tablespace using the `TABLESPACE` option to `CREATE TABLE`, prior to calling `create_hypertable`, has the same effect as calling `attach_tablespace` immediately following `create_hypertable`. ## Optional arguments |Name|Type|Description| |---|---|---| | `if_not_attached` | BOOLEAN |Set to true to avoid throwing an error if the tablespace is already attached to the table. A notice is issued instead. Defaults to false. | ===== PAGE: https://docs.tigerdata.com/api/hypertable/hypertable_size/ ===== # hypertable_size() # hypertable_size() Get the total disk space used by a hypertable or continuous aggregate, that is, the sum of the size for the table itself including chunks, any indexes on the table, and any toast tables. The size is reported in bytes. This is equivalent to computing the sum of `total_bytes` column from the output of `hypertable_detailed_size` function. When a continuous aggregate name is provided, the function transparently looks up the backing hypertable and returns its statistics instead. For more information about using hypertables, including chunk size partitioning, see the [hypertable section][hypertable-docs]. ## Samples Get the size information for a hypertable.sql SELECT hypertable_size('devices');
hypertable_size
73728Get the size information for all hypertables.sql SELECT hypertable_name, hypertable_size(format('%I.%I', hypertable_schema, hypertable_name)::regclass) FROM timescaledb_information.hypertables;
Get the size information for a continuous aggregate.sql SELECT hypertable_size('device_stats_15m');
hypertable_size
73728## Required arguments |Name|Type|Description| |-|-|-| |`hypertable`|REGCLASS|Hypertable or continuous aggregate to show size of.| ## Returns |Name|Type|Description| |-|-|-| |hypertable_size|BIGINT|Total disk space used by the specified hypertable, including all indexes and TOAST data| `NULL` is returned if the function is executed on a non-hypertable relation. ===== PAGE: https://docs.tigerdata.com/api/hypertable/hypertable_approximate_size/ ===== # hypertable_approximate_size() Get the approximate total disk space used by a hypertable or continuous aggregate, that is, the sum of the size for the table itself including chunks, any indexes on the table, and any toast tables. The size is reported in bytes. This is equivalent to computing the sum of `total_bytes` column from the output of `hypertable_approximate_detailed_size` function. When a continuous aggregate name is provided, the function transparently looks up the backing hypertable and returns its statistics instead. This function relies on the per backend caching using the in-built Postgres storage manager layer to compute the approximate size cheaply. The PG cache invalidation clears off the cached size for a chunk when DML happens into it. That size cache is thus able to get the latest size in a matter of minutes. Also, due to the backend caching, any long running session will only fetch latest data for new or modified chunks and can use the cached data (which is calculated afresh the first time around) effectively for older chunks. Thus it is recommended to use a single connected Postgres backend session to compute the approximate sizes of hypertables to get faster results. For more information about using hypertables, including chunk size partitioning, see the [hypertable section][hypertable-docs]. ## Samples Get the approximate size information for a hypertable.sql SELECT * FROM hypertable_approximate_size('devices');
hypertable_approximate_size
8192Get the approximate size information for all hypertables.sql SELECT hypertable_name, hypertable_approximate_size(format('%I.%I', hypertable_schema, hypertable_name)::regclass) FROM timescaledb_information.hypertables;
Get the approximate size information for a continuous aggregate.sql SELECT hypertable_approximate_size('device_stats_15m');
hypertable_approximate_size
8192## Required arguments |Name|Type|Description| |-|-|-| |`hypertable`|REGCLASS|Hypertable or continuous aggregate to show size of.| ## Returns |Name|Type|Description| |-|-|-| |hypertable_approximate_size|BIGINT|Total approximate disk space used by the specified hypertable, including all indexes and TOAST data| `NULL` is returned if the function is executed on a non-hypertable relation. ===== PAGE: https://docs.tigerdata.com/api/hypertable/split_chunk/ ===== # split_chunk() Split a large chunk at a specific point in time. If you do not specify the timestamp to split at, `chunk` is split equally. ## Samples * Split a chunk at a specific time: ```sql CALL split_chunk('chunk_1', split_at => '2025-03-01 00:00'); ``` * Split a chunk in two: For example, If the chunk duration is, 24 hours, the following command splits `chunk_1` into two chunks of 12 hours each. ```sql CALL split_chunk('chunk_1'); ``` ## Required arguments |Name|Type| Required | Description | |---|---|---|----------------------------------| | `chunk` | REGCLASS | ✔ | Name of the chunk to split. | | `split_at` | `TIMESTAMPTZ`| ✖ |Timestamp to split the chunk at. | ## Returns This function returns void. ===== PAGE: https://docs.tigerdata.com/api/hypertable/attach_chunk/ ===== # attach_chunk() Attach a hypertable as a chunk in another [hypertable][hypertables-section] at a given slice in a dimension.  The schema, name, existing constraints, and indexes of `chunk` do not change, even if a constraint conflicts with a chunk constraint in `hypertable`. The `hypertable` you attach `chunk` to does not need to have the same dimension columns as the hypertable you previously [detached `chunk`][hypertable-detach-chunk] from. While attaching `chunk` to `hypertable`: - Dimension columns in `chunk` are set as `NOT NULL`. - Any foreign keys in `hypertable` are created in `chunk`. You cannot: - Attaching a chunk that is still attached to another hypertable. First call [detach_chunk][hypertable-detach-chunk]. - Attaching foreign tables are not supported. Since [TimescaleDB v2.21.0](https://github.com/timescale/timescaledb/releases/tag/2.21.0) ## Samples Attach a hypertable as a chunk in another hypertable for a specific slice in a dimension:sql CALL attach_chunk('ht', '_timescaledb_internal._hyper_1_2_chunk', '{"device_id": [0, 1000]}');
## Arguments |Name|Type| Description | |---|---|-----------------------------------------------------------------------------------------------------------------------------------------------| | `hypertable` | REGCLASS | Name of the hypertable to attach `chunk` to. | | `chunk` | REGCLASS | Name of the chunk to attach. | | `slices` | JSONB | The slice `chunk` will occupy in `hypertable`. `slices` cannot clash with the slice already occupied by an existing chunk in `hypertable`. | ## Returns This function returns void. ===== PAGE: https://docs.tigerdata.com/api/hypertable/detach_tablespaces/ ===== # detach_tablespaces() Detach all tablespaces from a hypertable. After issuing this command on a hypertable, it no longer has any tablespaces attached to it. New chunks are instead placed in the database's default tablespace. ## Samples Detach all tablespaces from the hypertable `conditions`:sql SELECT detach_tablespaces('conditions');
## Required arguments |Name|Type|Description| |---|---|---| | `hypertable` | REGCLASS | Hypertable to detach a the tablespace from.| ===== PAGE: https://docs.tigerdata.com/api/hypertable/create_hypertable/ ===== # create_hypertable() Replace a standard Postgres relational table with a [hypertable][hypertable-docs] that is partitioned on a single dimension. To create a new hypertable, best practice is to call <a href="https://docs.tigerdata.com/api/latest/hypertable/create_table/">CREATE TABLE</a>. A hypertable is a Postgres table that automatically partitions your data by time. A dimension defines the way your data is partitioned. All actions work on the resulting hypertable. For example, `ALTER TABLE`, and `SELECT`. If the table to convert already contains data, set [migrate_data][migrate-data] to `TRUE`. However, this may take a long time and there are limitations when the table contains foreign key constraints. You cannot run `create_hypertable()` on a table that is already partitioned using [declarative partitioning][declarative-partitioning] or [inheritance][inheritance]. The time column must be defined as `NOT NULL`. If this is not already specified on table creation, `create_hypertable` automatically adds this constraint on the table when it is executed. This page describes the generalized hypertable API introduced in TimescaleDB v2.13. The [old interface for `create_hypertable` is also available](https://docs.tigerdata.com/api/latest/hypertable/create_hypertable_old/). ## Samples Before you call `create_hypertable`, you create a standard Postgres relational table. For example:sql CREATE TABLE conditions ( time TIMESTAMPTZ NOT NULL, location text NOT NULL, temperature DOUBLE PRECISION NULL );
The following examples show you how to create a hypertable from an existing table or a function: - [Time partition a hypertable by time range][sample-time-range] - [Time partition a hypertable using composite columns and immutable functions][sample-composite-columns] - [Time partition a hypertable using ISO formatting][sample-iso-formatting] - [Time partition a hypertable using UUIDv7][sample-uuidv7] ### Time partition a hypertable by time range The following examples show different ways to create a hypertable: - Convert with range partitioning on the `time` column:sql SELECT create_hypertable('conditions', by_range('time'));
- Convert with a [set_chunk_time_interval][set_chunk_time_interval] of 24 hours: Either:sql SELECT create_hypertable('conditions', by_range('time', 86400000000));
or:sql SELECT create_hypertable('conditions', by_range('time', INTERVAL '1 day'));
- with range partitioning on the `time` column, do not raise a warning if `conditions` is already a hypertable:sql SELECT create_hypertable('conditions', by_range('time'), if_not_exists => TRUE);
If you call `SELECT * FROM create_hypertable(...)` the return value is formatted as a table with column headings. ### Time partition a hypertable using composite columns and immutable functions The following example shows how to time partition the `measurements` relational table on a composite column type using a range partitioning function. 1. Create the report type, then an immutable function that converts the column value into a supported column value: ```sql CREATE TYPE report AS (reported timestamp with time zone, contents jsonb); CREATE FUNCTION report_reported(report) RETURNS timestamptz LANGUAGE SQL IMMUTABLE AS 'SELECT $1.reported'; ``` 1. Create the hypertable using the immutable function: ```sql SELECT create_hypertable('measurements', by_range('report', partition_func => 'report_reported')); ``` ### Time partition a hypertable using ISO formatting The following example shows how to time partition the `events` table on a `jsonb` (`event`) column type, which has a top level `started` key that contains an ISO 8601 formatted timestamp:sql CREATE FUNCTION event_started(jsonb)
RETURNS timestamptz LANGUAGE SQL IMMUTABLE AS$func$SELECT ($1->>'started')::timestamptz$func$;
SELECT create_hypertable('events', by_range('event', partition_func => 'event_started'));
### Time partition a hypertable using [UUIDv7][uuidv7_functions]: 1. Create a table with a UUIDv7 column: <Terminal> ```sql CREATE TABLE events ( id uuid PRIMARY KEY DEFAULT generate_uuidv7(), payload jsonb ); ``` ```sql CREATE TABLE events ( id uuid PRIMARY KEY DEFAULT uuidv7(), payload jsonb ); ``` </Terminal> 1. Partition the table based on the timestamps embedded within the UUID values: ```sql SELECT create_hypertable( 'events', by_range('id', INTERVAL '1 month') ); ``` Subsequent data insertion and queries automatically leverage the UUIDv7-based partitioning. ## Arguments | Name | Type | Default | Required | Description | |-------------|------------------|---------|-|---------------------------------------------------------------------------------------------------------------------------------------------------------------------------------------------------------------------------------------------------------------------------------------------------------------------------------------------------------------------------------------------------------------------------------------------------------------------------------------------------------------------------------------------------------------------------------------------------------------------------------------------------------------------------------------------------------------------------------------------------------------------------------------------------------------------------------------------------------------------------------------------------------------------------------------------------------------------------------------------------------------------------------------------------------------------------------------------------------------------------------------------| |`create_default_indexes`| `BOOLEAN` | `TRUE` | ✖ | Create default indexes on time/partitioning columns. | |`dimension`| [DIMENSION_INFO][dimension-info] | - | ✔ | To create a `_timescaledb_internal.dimension_info` instance to partition a hypertable, you call [`by_range`][by-range] and [`by_hash`][by-hash]. | |`if_not_exists` | `BOOLEAN` | `FALSE` | ✖ | Set to `TRUE` to print a warning if `relation` is already a hypertable. By default, an exception is raised. | |`migrate_data`| `BOOLEAN` | `FALSE` | ✖ | Set to `TRUE` to migrate any existing data in `relation` in to chunks in the new hypertable. Depending on the amount of data to be migrated, setting `migrate_data` can lock the table for a significant amount of time. If there are [foreign key constraints](https://docs.tigerdata.com/use-timescale/latest/schema-management/about-constraints/) to other tables in the data to be migrated, `create_hypertable()` can run into deadlock. A hypertable can only contain foreign keys to another hypertable. `UNIQUE` and `PRIMARY` constraints must include the partitioning key. <br></br> Deadlock may happen when concurrent transactions simultaneously try to insert data into tables that are referenced in the foreign key constraints, and into the converting table itself. To avoid deadlock, manually obtain a [SHARE ROW EXCLUSIVE](https://www.postgresql.org/docs/current/sql-lock.html) lock on the referenced tables before you call `create_hypertable` in the same transaction. <br></br> If you leave `migrate_data` set to the default, non-empty tables generate an error when you call `create_hypertable`. | |`relation`| REGCLASS | - | ✔ | Identifier of the table to convert to a hypertable. | ### Dimension info To create a `_timescaledb_internal.dimension_info` instance, you call [add_dimension][add_dimension] to an existing hypertable. #### Samples Hypertables must always have a primary range dimension, followed by an arbitrary number of additional dimensions that can be either range or hash, Typically this is just one hash. For example:sql SELECT add_dimension('conditions', by_range('time')); SELECT add_dimension('conditions', by_hash('location', 2));
For incompatible data types such as `jsonb`, you can specify a function to the `partition_func` argument of the dimension build to extract a compatible data type. Look in the example section below. #### Custom partitioning By default, TimescaleDB calls Postgres's internal hash function for the given type. You use a custom partitioning function for value types that do not have a native Postgres hash function. You can specify a custom partitioning function for both range and hash partitioning. A partitioning function should take a `anyelement` argument as the only parameter and return a positive `integer` hash value. This hash value is _not_ a partition identifier, but rather the inserted value's position in the dimension's key space, which is then divided across the partitions. #### by_range() Create a by-range dimension builder. You can partition `by_range` on it's own. ##### Samples - Partition on time using `CREATE TABLE` The simplest usage is to partition on a time column:sql CREATE TABLE conditions (
time TIMESTAMPTZ NOT NULL, location TEXT NOT NULL, device TEXT NOT NULL, temperature DOUBLE PRECISION NULL, humidity DOUBLE PRECISION NULL) WITH (
tsdb.hypertable, tsdb.partition_column='time');
If you are self-hosting TimescaleDB v2.19.3 and below, create a [Postgres relational table][pg-create-table], then convert it using [create_hypertable][create_hypertable]. You then enable hypercore with a call to [ALTER TABLE][alter_table_hypercore]. This is the default partition, you do not need to add it explicitly. - Extract time from a non-time column using `create_hypertable` If you have a table with a non-time column containing the time, such as a JSON column, add a partition function to extract the time:sql CREATE TABLE my_table (
metric_id serial not null, data jsonb,);
CREATE FUNCTION get_time(jsonb) RETURNS timestamptz AS $$
SELECT ($1->>'time')::timestamptz$$ LANGUAGE sql IMMUTABLE;
SELECT create_hypertable('my_table', by_range('data', '1 day', 'get_time'));
##### Arguments | Name | Type | Default | Required | Description | |-|----------|---------|-|-| |`column_name`| `NAME` | - |✔|Name of column to partition on.| |`partition_func`| `REGPROC` | - |✖|The function to use for calculating the partition of a value.| |`partition_interval`|`ANYELEMENT` | - |✖|Interval to partition column on.| If the column to be partitioned is a: - `TIMESTAMP`, `TIMESTAMPTZ`, or `DATE`: specify `partition_interval` either as an `INTERVAL` type or an integer value in *microseconds*. - Another integer type: specify `partition_interval` as an integer that reflects the column's underlying semantics. For example, if this column is in UNIX time, specify `partition_interval` in milliseconds. The partition type and default value depending on column type is:<a id="partition-types" href=""></a> | Column Type | Partition Type | Default value | |------------------------------|------------------|---------------| | `TIMESTAMP WITHOUT TIMEZONE` | INTERVAL/INTEGER | 1 week | | `TIMESTAMP WITH TIMEZONE` | INTERVAL/INTEGER | 1 week | | `DATE` | INTERVAL/INTEGER | 1 week | | `SMALLINT` | SMALLINT | 10000 | | `INT` | INT | 100000 | | `BIGINT` | BIGINT | 1000000 | #### by_hash() The main purpose of hash partitioning is to enable parallelization across multiple disks within the same time interval. Every distinct item in hash partitioning is hashed to one of *N* buckets. By default, TimescaleDB uses flexible range intervals to manage chunk sizes. ### Parallelizing disk I/O You use Parallel I/O in the following scenarios: - Two or more concurrent queries should be able to read from different disks in parallel. - A single query should be able to use query parallelization to read from multiple disks in parallel. For the following options: - **RAID**: use a RAID setup across multiple physical disks, and expose a single logical disk to the hypertable. That is, using a single tablespace. Best practice is to use RAID when possible, as you do not need to manually manage tablespaces in the database. - **Multiple tablespaces**: for each physical disk, add a separate tablespace to the database. TimescaleDB allows you to add multiple tablespaces to a *single* hypertable. However, although under the hood, a hypertable's chunks are spread across the tablespaces associated with that hypertable. When using multiple tablespaces, a best practice is to also add a second hash-partitioned dimension to your hypertable and to have at least one hash partition per disk. While a single time dimension would also work, it would mean that the first chunk is written to one tablespace, the second to another, and so on, and thus would parallelize only if a query's time range exceeds a single chunk. When adding a hash partitioned dimension, set the number of partitions to a multiple of number of disks. For example, the number of partitions P=N*Pd where N is the number of disks and Pd is the number of partitions per disk. This enables you to add more disks later and move partitions to the new disk from other disks. TimescaleDB does *not* benefit from a very large number of hash partitions, such as the number of unique items you expect in partition field. A very large number of hash partitions leads both to poorer per-partition load balancing (the mapping of items to partitions using hashing), as well as much increased planning latency for some types of queries. ##### Samplessql CREATE TABLE conditions ( "time" TIMESTAMPTZ NOT NULL, location TEXT NOT NULL, device TEXT NOT NULL, temperature DOUBLE PRECISION NULL, humidity DOUBLE PRECISION NULL ) WITH ( tsdb.hypertable, tsdb.partition_column='time', tsdb.chunk_interval='1 day' );
SELECT add_dimension('conditions', by_hash('location', 2));
##### Arguments | Name | Type | Default | Required | Description | |-|----------|---------|-|----------------------------------------------------------| |`column_name`| `NAME` | - |✔| Name of column to partition on. | |`partition_func`| `REGPROC` | - |✖| The function to use to calcule the partition of a value. | |`number_partitions`|`ANYELEMENT` | - |✔| Number of hash partitions to use for `partitioning_column`. Must be greater than 0. | #### Returns `by_range` and `by-hash` return an opaque `_timescaledb_internal.dimension_info` instance, holding the dimension information used by this function. ## Returns |Column|Type| Description | |-|-|-------------------------------------------------------------------------------------------------------------| |`hypertable_id`|INTEGER| The ID of the hypertable you created. | |`created`|BOOLEAN| `TRUE` when the hypertable is created. `FALSE` when `if_not_exists` is `true` and no hypertable was created. | ===== PAGE: https://docs.tigerdata.com/api/hypertable/move_chunk/ ===== # move_chunk() TimescaleDB allows you to move data and indexes to different tablespaces. This allows you to move data to more cost-effective storage as it ages. The `move_chunk` function acts like a combination of the [Postgres CLUSTER command][postgres-cluster] and [Postgres ALTER TABLE...SET TABLESPACE][postgres-altertable] commands. Unlike these Postgres commands, however, the `move_chunk` function uses lower lock levels so that the chunk and hypertable are able to be read for most of the process. This comes at a cost of slightly higher disk usage during the operation. For a more detailed discussion of this capability, see the documentation on [managing storage with tablespaces][manage-storage]. You must be logged in as a super user, such as the `postgres` user, to use the `move_chunk()` call. ## Samplessql SELECT move_chunk( chunk => '_timescaledb_internal._hyper_1_4_chunk', destination_tablespace => 'tablespace_2', index_destination_tablespace => 'tablespace_3', reorder_index => 'conditions_device_id_time_idx', verbose => TRUE );
## Required arguments |Name|Type|Description| |-|-|-| |`chunk`|REGCLASS|Name of chunk to be moved| |`destination_tablespace`|NAME|Target tablespace for chunk being moved| |`index_destination_tablespace`|NAME|Target tablespace for index associated with the chunk you are moving| ## Optional arguments |Name|Type|Description| |-|-|-| |`reorder_index`|REGCLASS|The name of the index (on either the hypertable or chunk) to order by| |`verbose`|BOOLEAN|Setting to true displays messages about the progress of the move_chunk command. Defaults to false.| ===== PAGE: https://docs.tigerdata.com/api/hypertable/hypertable_index_size/ ===== # hypertable_index_size() Get the disk space used by an index on a hypertable, including the disk space needed to provide the index on all chunks. The size is reported in bytes. For more information about using hypertables, including chunk size partitioning, see the [hypertable section][hypertable-docs]. ## Samples Get size of a specific index on a hypertable.sql \d conditions_table
Table "public.conditions_table"Column | Type | Collation | Nullable | Default --------+--------------------------+-----------+----------+--------- time | timestamp with time zone | | not null | device | integer | | | volume | integer | | | Indexes:
"second_index" btree ("time") "test_table_time_idx" btree ("time" DESC) "third_index" btree ("time")SELECT hypertable_index_size('second_index');
hypertable_index_size
163840SELECT pg_size_pretty(hypertable_index_size('second_index'));
pg_size_pretty
160 kB
## Required arguments |Name|Type|Description| |-|-|-| |`index_name`|REGCLASS|Name of the index on a hypertable| ## Returns |Column|Type|Description| |-|-|-| |hypertable_index_size|BIGINT|Returns the disk space used by the index| NULL is returned if the function is executed on a non-hypertable relation. ===== PAGE: https://docs.tigerdata.com/api/hypertable/enable_chunk_skipping/ ===== # enable_chunk_skipping() <!-- vale Google.Headings = NO --> <!-- markdownlint-disable-next-line line-length --> <!-- vale Google.Headings = YES --> Early access: TimescaleDB v2.17.1 Enable range statistics for a specific column in a **compressed** hypertable. This tracks a range of values for that column per chunk. Used for chunk skipping during query optimization and applies only to the chunks created after chunk skipping is enabled. Best practice is to enable range tracking on columns that are correlated to the partitioning column. In other words, enable tracking on secondary columns which are referenced in the `WHERE` clauses in your queries. TimescaleDB supports min/max range tracking for the `smallint`, `int`, `bigint`, `serial`, `bigserial`, `date`, `timestamp`, and `timestamptz` data types. The min/max ranges are calculated when a chunk belonging to this hypertable is compressed using the [compress_chunk][compress_chunk] function. The range is stored in start (inclusive) and end (exclusive) form in the `chunk_column_stats` catalog table. This way you store the min/max values for such columns in this catalog table at the per-chunk level. These min/max range values do not participate in partitioning of the data. These ranges are used for chunk skipping when the `WHERE` clause of an SQL query specifies ranges on the column. A [DROP COLUMN](https://www.postgresql.org/docs/current/sql-altertable.html#SQL-ALTERTABLE-DESC-DROP-COLUMN) on a column with statistics tracking enabled on it ends up removing all relevant entries from the catalog table. A [decompress_chunk][decompress_chunk] invocation on a compressed chunk resets its entries from the `chunk_column_stats` catalog table since now it's available for DML and the min/max range values can change on any further data manipulation in the chunk. By default, this feature is disabled. To enable chunk skipping, set `timescaledb.enable_chunk_skipping = on` in `postgresql.conf`. When you upgrade from a database instance that uses compression but does not support chunk skipping, you need to recompress the previously compressed chunks for chunk skipping to work. ## Samples In this sample, you create the `conditions` hypertable with partitioning on the `time` column. You then specify and enable additional columns to track ranges for.sql CREATE TABLE conditions ( time TIMESTAMPTZ NOT NULL, location TEXT NOT NULL, device TEXT NOT NULL, temperature DOUBLE PRECISION NULL, humidity DOUBLE PRECISION NULL ) WITH ( tsdb.hypertable, tsdb.partition_column='time' );
SELECT enable_chunk_skipping('conditions', 'device_id');
If you are self-hosting TimescaleDB v2.19.3 and below, create a [Postgres relational table][pg-create-table], then convert it using [create_hypertable][create_hypertable]. You then enable hypercore with a call to [ALTER TABLE][alter_table_hypercore]. ## Arguments | Name | Type | Default | Required | Description | |-------------|------------------|---------|-|----------------------------------------| |`column_name`| `TEXT` | - | ✔ | Column to track range statistics for | |`hypertable`| `REGCLASS` | - | ✔ | Hypertable that the column belongs to | |`if_not_exists`| `BOOLEAN` | `false` | ✖ | Set to `true` so that a notice is sent when ranges are not being tracked for a column. By default, an error is thrown | ## Returns |Column|Type|Description| |-|-|-| |`column_stats_id`|INTEGER|ID of the entry in the TimescaleDB internal catalog| |`enabled`|BOOLEAN|Returns `true` when tracking is enabled, `if_not_exists` is `true`, and when a new entry is not added| ===== PAGE: https://docs.tigerdata.com/api/hypertable/detach_tablespace/ ===== # detach_tablespace() Detach a tablespace from one or more hypertables. This _only_ means that _new_ chunks are not placed on the detached tablespace. This is useful, for instance, when a tablespace is running low on disk space and one would like to prevent new chunks from being created in the tablespace. The detached tablespace itself and any existing chunks with data on it remains unchanged and continue to work as before, including being available for queries. Note that newly inserted data rows may still be inserted into an existing chunk on the detached tablespace since existing data is not cleared from a detached tablespace. A detached tablespace can be reattached if desired to once again be considered for chunk placement. ## Samples Detach the tablespace `disk1` from the hypertable `conditions`:sql SELECT detach_tablespace('disk1', 'conditions'); SELECT detach_tablespace('disk2', 'conditions', if_attached => true);
Detach the tablespace `disk1` from all hypertables that the current user has permissions for:sql SELECT detach_tablespace('disk1');
## Required arguments |Name|Type|Description| |---|---|---| | `tablespace` | TEXT | Tablespace to detach.| When giving only the tablespace name as argument, the given tablespace is detached from all hypertables that the current role has the appropriate permissions for. Therefore, without proper permissions, the tablespace may still receive new chunks after this command is issued. ## Optional arguments |Name|Type|Description| |---|---|---| | `hypertable` | REGCLASS | Hypertable to detach a the tablespace from.| | `if_attached` | BOOLEAN | Set to true to avoid throwing an error if the tablespace is not attached to the given table. A notice is issued instead. Defaults to false. | When specifying a specific hypertable, the tablespace is only detached from the given hypertable and thus may remain attached to other hypertables. ===== PAGE: https://docs.tigerdata.com/api/hypertable/chunks_detailed_size/ ===== # chunks_detailed_size() Get information about the disk space used by the chunks belonging to a hypertable, returning size information for each chunk table, any indexes on the chunk, any toast tables, and the total size associated with the chunk. All sizes are reported in bytes. If the function is executed on a distributed hypertable, it returns disk space usage information as a separate row per node. The access node is not included since it doesn't have any local chunk data. Additional metadata associated with a chunk can be accessed via the `timescaledb_information.chunks` view. ## Samplessql SELECT * FROM chunks_detailed_size('dist_table') ORDER BY chunk_name, node_name;
chunk_schema | chunk_name | table_bytes | index_bytes | toast_bytes | total_bytes | node_name-----------------------+-----------------------+-------------+-------------+-------------+-------------+----------------------- _timescaledb_internal | _dist_hyper_1_1_chunk | 8192 | 32768 | 0 | 40960 | data_node_1 _timescaledb_internal | _dist_hyper_1_2_chunk | 8192 | 32768 | 0 | 40960 | data_node_2 _timescaledb_internal | _dist_hyper_1_3_chunk | 8192 | 32768 | 0 | 40960 | data_node_3
## Required arguments |Name|Type|Description| |---|---|---| | `hypertable` | REGCLASS | Name of the hypertable | ## Returns |Column|Type|Description| |---|---|---| |chunk_schema| TEXT | Schema name of the chunk | |chunk_name| TEXT | Name of the chunk| |table_bytes|BIGINT | Disk space used by the chunk table| |index_bytes|BIGINT | Disk space used by indexes| |toast_bytes|BIGINT | Disk space of toast tables| |total_bytes|BIGINT | Total disk space used by the chunk, including all indexes and TOAST data| |node_name| TEXT | Node for which size is reported, applicable only to distributed hypertables| If executed on a relation that is not a hypertable, the function returns `NULL`. ===== PAGE: https://docs.tigerdata.com/api/hypertable/create_hypertable_old/ ===== # create_hypertable() This page describes the hypertable API supported prior to TimescaleDB v2.13. Best practice is to use the new [`create_hypertable`][api-create-hypertable] interface. Creates a TimescaleDB hypertable from a Postgres table (replacing the latter), partitioned on time and with the option to partition on one or more other columns. The Postgres table cannot be an already partitioned table (declarative partitioning or inheritance). In case of a non-empty table, it is possible to migrate the data during hypertable creation using the `migrate_data` option, although this might take a long time and has certain limitations when the table contains foreign key constraints (see below). After creation, all actions, such as `ALTER TABLE`, `SELECT`, etc., still work on the resulting hypertable. For more information about using hypertables, including chunk size partitioning, see the [hypertable section][hypertable-docs]. ## Samples Convert table `conditions` to hypertable with just time partitioning on column `time`:sql SELECT create_hypertable('conditions', 'time');
Convert table `conditions` to hypertable, setting `chunk_time_interval` to 24 hours.sql SELECT create_hypertable('conditions', 'time', chunk_time_interval => 86400000000); SELECT create_hypertable('conditions', 'time', chunk_time_interval => INTERVAL '1 day');
Convert table `conditions` to hypertable. Do not raise a warning if `conditions` is already a hypertable:sql SELECT create_hypertable('conditions', 'time', if_not_exists => TRUE);
Time partition table `measurements` on a composite column type `report` using a time partitioning function. Requires an immutable function that can convert the column value into a supported column value:sql CREATE TYPE report AS (reported timestamp with time zone, contents jsonb);
CREATE FUNCTION report_reported(report) RETURNS timestamptz LANGUAGE SQL IMMUTABLE AS 'SELECT $1.reported';
SELECT create_hypertable('measurements', 'report', time_partitioning_func => 'report_reported');
Time partition table `events`, on a column type `jsonb` (`event`), which has a top level key (`started`) containing an ISO 8601 formatted timestamp:sql CREATE FUNCTION event_started(jsonb) RETURNS timestamptz LANGUAGE SQL IMMUTABLE AS $func$SELECT ($1->>'started')::timestamptz$func$;
SELECT create_hypertable('events', 'event', time_partitioning_func => 'event_started');
## Required arguments |Name|Type|Description| |-|-|-| |`relation`|REGCLASS|Identifier of table to convert to hypertable.| |`time_column_name`|REGCLASS| Name of the column containing time values as well as the primary column to partition by.| ## Optional arguments |Name|Type|Description| |-|-|-| |`partitioning_column`|REGCLASS|Name of an additional column to partition by. If provided, the `number_partitions` argument must also be provided.| |`number_partitions`|INTEGER|Number of [hash partitions][hash-partitions] to use for `partitioning_column`. Must be > 0.| |`chunk_time_interval`|INTERVAL|Event time that each chunk covers. Must be > 0. Default is 7 days.| |`create_default_indexes`|BOOLEAN|Whether to create default indexes on time/partitioning columns. Default is TRUE.| |`if_not_exists`|BOOLEAN|Whether to print warning if table already converted to hypertable or raise exception. Default is FALSE.| |`partitioning_func`|REGCLASS|The function to use for calculating a value's partition.| |`associated_schema_name`|REGCLASS|Name of the schema for internal hypertable tables. Default is `_timescaledb_internal`.| |`associated_table_prefix`|TEXT|Prefix for internal hypertable chunk names. Default is `_hyper`.| |`migrate_data`|BOOLEAN|Set to TRUE to migrate any existing data from the `relation` table to chunks in the new hypertable. A non-empty table generates an error without this option. Large tables may take significant time to migrate. Defaults to FALSE.| |`time_partitioning_func`|REGCLASS| Function to convert incompatible primary time column values to compatible ones. The function must be `IMMUTABLE`.| |`replication_factor`|INTEGER|Replication factor to use with distributed hypertable. If not provided, value is determined by the `timescaledb.hypertable_replication_factor_default` GUC. | |`data_nodes`|ARRAY|This is the set of data nodes that are used for this table if it is distributed. This has no impact on non-distributed hypertables. If no data nodes are specified, a distributed hypertable uses all data nodes known by this instance.| |`distributed`|BOOLEAN|Set to TRUE to create distributed hypertable. If not provided, value is determined by the `timescaledb.hypertable_distributed_default` GUC. When creating a distributed hypertable, consider using [`create_distributed_hypertable`][create_distributed_hypertable] in place of `create_hypertable`. Default is NULL. | ## Returns |Column|Type|Description| |-|-|-| |`hypertable_id`|INTEGER|ID of the hypertable in TimescaleDB.| |`schema_name`|TEXT|Schema name of the table converted to hypertable.| |`table_name`|TEXT|Table name of the table converted to hypertable.| |`created`|BOOLEAN|TRUE if the hypertable was created, FALSE when `if_not_exists` is true and no hypertable was created.| If you use `SELECT * FROM create_hypertable(...)` you get the return value formatted as a table with column headings. The use of the `migrate_data` argument to convert a non-empty table can lock the table for a significant amount of time, depending on how much data is in the table. It can also run into deadlock if foreign key constraints exist to other tables. When converting a normal SQL table to a hypertable, pay attention to how you handle constraints. A hypertable can contain foreign keys to normal SQL table columns, but the reverse is not allowed. UNIQUE and PRIMARY constraints must include the partitioning key. The deadlock is likely to happen when concurrent transactions simultaneously try to insert data into tables that are referenced in the foreign key constraints and into the converting table itself. The deadlock can be prevented by manually obtaining `SHARE ROW EXCLUSIVE` lock on the referenced tables before calling `create_hypertable` in the same transaction, see [Postgres documentation](https://www.postgresql.org/docs/current/sql-lock.html) for the syntax. ## Units The `time` column supports the following data types: |Description|Types| |-|-| |Timestamp| TIMESTAMP, TIMESTAMPTZ| |Date|DATE| |Integer|SMALLINT, INT, BIGINT| The type flexibility of the 'time' column allows the use of non-time-based values as the primary chunk partitioning column, as long as those values can increment. For incompatible data types (for example, `jsonb`) you can specify a function to the `time_partitioning_func` argument which can extract a compatible data type. The units of `chunk_time_interval` should be set as follows: * For time columns having timestamp or DATE types, the `chunk_time_interval` should be specified either as an `interval` type or an integral value in *microseconds*. * For integer types, the `chunk_time_interval` **must** be set explicitly, as the database does not otherwise understand the semantics of what each integer value represents (a second, millisecond, nanosecond, etc.). So if your time column is the number of milliseconds since the UNIX epoch, and you wish to have each chunk cover 1 day, you should specify `chunk_time_interval => 86400000`. In case of hash partitioning (in other words, if `number_partitions` is greater than zero), it is possible to optionally specify a custom partitioning function. If no custom partitioning function is specified, the default partitioning function is used. The default partitioning function calls Postgres's internal hash function for the given type, if one exists. Thus, a custom partitioning function can be used for value types that do not have a native Postgres hash function. A partitioning function should take a single `anyelement` type argument and return a positive `integer` hash value. Note that this hash value is *not* a partition ID, but rather the inserted value's position in the dimension's key space, which is then divided across the partitions. The time column in `create_hypertable` must be defined as `NOT NULL`. If this is not already specified on table creation, `create_hypertable` automatically adds this constraint on the table when it is executed. ===== PAGE: https://docs.tigerdata.com/api/hypertable/set_chunk_time_interval/ ===== # set_chunk_time_interval() Sets the `chunk_time_interval` on a hypertable. The new interval is used when new chunks are created, and time intervals on existing chunks are not changed. ## Samples For a TIMESTAMP column, set `chunk_time_interval` to 24 hours:sql SELECT set_chunk_time_interval('conditions', INTERVAL '24 hours'); SELECT set_chunk_time_interval('conditions', 86400000000);
For a time column expressed as the number of milliseconds since the UNIX epoch, set `chunk_time_interval` to 24 hours:sql SELECT set_chunk_time_interval('conditions', 86400000);
## Arguments | Name | Type | Default | Required | Description | |-------------|------------------|---------|----------------------------------------------------------------------|--------------------------------------------------------------------------------------------------------------------------------------------------| |`hypertable`|REGCLASS| - | ✔ | Hypertable or continuous aggregate to update interval for. | |`chunk_time_interval`|See note|- | ✔ | Event time that each new chunk covers. | |`dimension_name`|REGCLASS|- | ✖ | The name of the time dimension to set the number of partitions for. Only use `dimension_name` when your hypertable has multiple time dimensions. | If you change chunk time interval you may see a chunk that is smaller than the new interval. For example, if you have two 7-day chunks that cover 14 days, then change `chunk_time_interval` to 3 days, you may end up with a transition chunk covering one day. This happens because the start and end of the new chunk is calculated based on dividing the timeline by the `chunk_time_interval` starting at epoch 0. This leads to the following chunks [0, 3), [3, 6), [6, 9), [9, 12), [12, 15), [15, 18) and so on. The two 7-day chunks covered data up to day 14: [0, 7), [8, 14), so the 3-day chunk for [12, 15) is reduced to a one day chunk. The following chunk [15, 18) is created as a full 3 day chunk. The valid types for the `chunk_time_interval` depend on the type used for the hypertable `time` column: |`time` column type|`chunk_time_interval` type|Time unit| |-|-|-| |TIMESTAMP|INTERVAL|days, hours, minutes, etc| ||INTEGER or BIGINT|microseconds| |TIMESTAMPTZ|INTERVAL|days, hours, minutes, etc| ||INTEGER or BIGINT|microseconds| |DATE|INTERVAL|days, hours, minutes, etc| ||INTEGER or BIGINT|microseconds| |SMALLINT|SMALLINT|The same time unit as the `time` column| |INT|INT|The same time unit as the `time` column| |BIGINT|BIGINT|The same time unit as the `time` column| For more information, see [hypertable partitioning][hypertable-partitioning]. ===== PAGE: https://docs.tigerdata.com/api/hypertable/show_tablespaces/ ===== # show_tablespaces() Show the tablespaces attached to a hypertable. ## Samplessql SELECT * FROM show_tablespaces('conditions');
show_tablespaces
disk1 disk2
## Required arguments |Name|Type|Description| |---|---|---| | `hypertable` | REGCLASS | Hypertable to show attached tablespaces for.| ===== PAGE: https://docs.tigerdata.com/api/hypertable/disable_chunk_skipping/ ===== # disable_chunk_skipping() Disable range tracking for a specific column in a hypertable **in the columnstore**. ## Samples In this sample, you convert the `conditions` table to a hypertable with partitioning on the `time` column. You then specify and enable additional columns to track ranges for. You then disable range tracking:sql SELECT create_hypertable('conditions', 'time'); SELECT enable_chunk_skipping('conditions', 'device_id'); SELECT disable_chunk_skipping('conditions', 'device_id');
Best practice is to enable range tracking on columns which are correlated to the partitioning column. In other words, enable tracking on secondary columns that are referenced in the `WHERE` clauses in your queries. Use this API to disable range tracking on columns when the query patterns don't use this secondary column anymore. ## Required arguments |Name|Type|Description| |-|-|-| |`hypertable`|REGCLASS|Hypertable that the column belongs to| |`column_name`|TEXT|Column to disable tracking range statistics for| ## Optional arguments |Name|Type|Description| |-|-|-| |`if_not_exists`|BOOLEAN|Set to `true` so that a notice is sent when ranges are not being tracked for a column. By default, an error is thrown| ## Returns |Column|Type|Description| |-|-|-| |`hypertable_id`|INTEGER|ID of the hypertable in TimescaleDB.| |`column_name`|TEXT|Name of the column range tracking is disabled for| |`disabled`|BOOLEAN|Returns `true` when tracking is disabled. `false` when `if_not_exists` is `true` and the entry was not removed| To `disable_chunk_skipping()`, you must have first called [enable_chunk_skipping][enable_chunk_skipping] and enabled range tracking on a column in the hypertable. ===== PAGE: https://docs.tigerdata.com/api/hypertable/remove_reorder_policy/ ===== # remove_reorder_policy() Remove a policy to reorder a particular hypertable. ## Samplessql SELECT remove_reorder_policy('conditions', if_exists => true);
removes the existing reorder policy for the `conditions` table if it exists. ## Required arguments |Name|Type|Description| |---|---|---| | `hypertable` | REGCLASS | Name of the hypertable from which to remove the policy. | ## Optional arguments |Name|Type|Description| |---|---|---| | `if_exists` | BOOLEAN | Set to true to avoid throwing an error if the reorder_policy does not exist. A notice is issued instead. Defaults to false. | ===== PAGE: https://docs.tigerdata.com/api/hypertable/reorder_chunk/ ===== # reorder_chunk() Reorder a single chunk's heap to follow the order of an index. This function acts similarly to the [Postgres CLUSTER command][postgres-cluster] , however it uses lower lock levels so that, unlike with the CLUSTER command, the chunk and hypertable are able to be read for most of the process. It does use a bit more disk space during the operation. This command can be particularly useful when data is often queried in an order different from that in which it was originally inserted. For example, data is commonly inserted into a hypertable in loose time order (for example, many devices concurrently sending their current state), but one might typically query the hypertable about a _specific_ device. In such cases, reordering a chunk using an index on `(device_id, time)` can lead to significant performance improvement for these types of queries. One can call this function directly on individual chunks of a hypertable, but using [add_reorder_policy][add_reorder_policy] is often much more convenient. ## Samples Reorder a chunk on an index:sql SELECT reorder_chunk('_timescaledb_internal._hyper_1_10_chunk', '_timescaledb_internal.conditions_device_id_time_idx');
## Required arguments |Name|Type|Description| |---|---|---| | `chunk` | REGCLASS | Name of the chunk to reorder. | ## Optional arguments |Name|Type|Description| |---|---|---| | `index` | REGCLASS | The name of the index (on either the hypertable or chunk) to order by.| | `verbose` | BOOLEAN | Setting to true displays messages about the progress of the reorder command. Defaults to false.| ## Returns This function returns void. ===== PAGE: https://docs.tigerdata.com/api/hypertable/add_reorder_policy/ ===== # add_reorder_policy() Create a policy to reorder the rows of a hypertable's chunks on a specific index. The policy reorders the rows for all chunks except the two most recent ones, because these are still getting writes. By default, the policy runs every 24 hours. To change the schedule, call [alter_job][alter_job] and adjust `schedule_interval`. You can have only one reorder policy on each hypertable. For manual reordering of individual chunks, see [reorder_chunk][reorder_chunk]. When a chunk's rows have been reordered by a policy, they are not reordered by subsequent runs of the same policy. If you write significant amounts of data into older chunks that have already been reordered, re-run [reorder_chunk][reorder_chunk] on them. If you have changed a lot of older chunks, it is better to drop and recreate the policy. ## Samplessql SELECT add_reorder_policy('conditions', 'conditions_device_id_time_idx');
Creates a policy to reorder chunks by the existing `(device_id, time)` index every 24 hours. This applies to all chunks except the two most recent ones. ## Required arguments |Name|Type| Description | |-|-|--------------------------------------------------------------| |`hypertable`|REGCLASS| Hypertable to create the policy for | |`index_name`|TEXT| Existing hypertable index by which to order the rows on disk | ## Optional arguments |Name|Type| Description | |-|-|-------------------------------------------------------------------------------------------------------------------------------------------------------------------------------------------------------------------------------------------------------------------------------------------------------------------------------------------------------------------------------------------------------------------------------------------------------------------------------------------------------------------------------------------------------------------------------------------------------------------------| |`if_not_exists`|BOOLEAN| Set to `true` to avoid an error if the `reorder_policy` already exists. A notice is issued instead. Defaults to `false`. | |`initial_start`|TIMESTAMPTZ| Controls when the policy first runs and how its future run schedule is calculated. <ul><li>If omitted or set to <code>NULL</code> (default): <ul><li>The first run is scheduled at <code>now()</code> + <code>schedule_interval</code> (defaults to 24 hours).</li><li>The next run is scheduled at one full <code>schedule_interval</code> after the end of the previous run.</li></ul></li><li>If set: <ul><li>The first run is at the specified time.</li><li>The next run is scheduled as <code>initial_start</code> + <code>schedule_interval</code> regardless of when the previous run ends.</li></ul></li></ul> | |`timezone`|TEXT| A valid time zone. If `initial_start` is also specified, subsequent runs of the reorder policy are aligned on its initial start. However, daylight savings time (DST) changes might shift this alignment. Set to a valid time zone if this is an issue you want to mitigate. If omitted, UTC bucketing is performed. Defaults to `NULL`. | ## Returns |Column|Type|Description| |-|-|-| |`job_id`|INTEGER|TimescaleDB background job ID created to implement this policy| ===== PAGE: https://docs.tigerdata.com/api/hypertable/hypertable_detailed_size/ ===== # hypertable_detailed_size() # hypertable_detailed_size() Get detailed information about disk space used by a hypertable or continuous aggregate, returning size information for the table itself, any indexes on the table, any toast tables, and the total size of all. All sizes are reported in bytes. If the function is executed on a distributed hypertable, it returns size information as a separate row per node, including the access node. When a continuous aggregate name is provided, the function transparently looks up the backing hypertable and returns its statistics instead. For more information about using hypertables, including chunk size partitioning, see the [hypertable section][hypertable-docs]. ## Samples Get the size information for a hypertable.sql -- disttable is a distributed hypertable -- SELECT * FROM hypertable_detailed_size('disttable') ORDER BY node_name;
table_bytes | index_bytes | toast_bytes | total_bytes | node_name -------------+-------------+-------------+-------------+-------------
16384 | 40960 | 0 | 57344 | data_node_1 8192 | 24576 | 0 | 32768 | data_node_2 0 | 8192 | 0 | 8192 |The access node is listed without a user-given node name. Normally, the access node holds no data, but still maintains, for example, index information that occupies a small amount of disk space. ## Required arguments |Name|Type|Description| |---|---|---| | `hypertable` | REGCLASS | Hypertable or continuous aggregate to show detailed size of. | ## Returns |Column|Type|Description| |-|-|-| |table_bytes|BIGINT|Disk space used by main_table (like `pg_relation_size(main_table)`)| |index_bytes|BIGINT|Disk space used by indexes| |toast_bytes|BIGINT|Disk space of toast tables| |total_bytes|BIGINT|Total disk space used by the specified table, including all indexes and TOAST data| |node_name|TEXT|For distributed hypertables, this is the user-given name of the node for which the size is reported. `NULL` is returned for the access node and non-distributed hypertables.| If executed on a relation that is not a hypertable, the function returns `NULL`. ===== PAGE: https://docs.tigerdata.com/api/hypertable/show_chunks/ ===== # show_chunks() Get list of chunks associated with a hypertable. Function accepts the following required and optional arguments. These arguments have the same semantics as the `drop_chunks` [function][drop_chunks]. ## Samples Get list of all chunks associated with a table:sql SELECT show_chunks('conditions');
Get all chunks from hypertable `conditions` older than 3 months:sql SELECT show_chunks('conditions', older_than => INTERVAL '3 months');
Get all chunks from hypertable `conditions` created before 3 months:sql SELECT show_chunks('conditions', created_before => INTERVAL '3 months');
Get all chunks from hypertable `conditions` created in the last 1 month:sql SELECT show_chunks('conditions', created_after => INTERVAL '1 month');
Get all chunks from hypertable `conditions` before 2017:sql SELECT show_chunks('conditions', older_than => DATE '2017-01-01');
## Required arguments |Name|Type|Description| |-|-|-| |`relation`|REGCLASS|Hypertable or continuous aggregate from which to select chunks.| ## Optional arguments |Name|Type|Description| |-|-|-| |`older_than`|ANY|Specification of cut-off point where any chunks older than this timestamp should be shown.| |`newer_than`|ANY|Specification of cut-off point where any chunks newer than this timestamp should be shown.| |`created_before`|ANY|Specification of cut-off point where any chunks created before this timestamp should be shown.| |`created_after`|ANY|Specification of cut-off point where any chunks created after this timestamp should be shown.| The `older_than` and `newer_than` parameters can be specified in two ways: * **interval type:** The cut-off point is computed as `now() - older_than` and similarly `now() - newer_than`. An error is returned if an INTERVAL is supplied and the time column is not one of a TIMESTAMP, TIMESTAMPTZ, or DATE. * **timestamp, date, or integer type:** The cut-off point is explicitly given as a TIMESTAMP / TIMESTAMPTZ / DATE or as a SMALLINT / INT / BIGINT. The choice of timestamp or integer must follow the type of the hypertable's time column. The `created_before` and `created_after` parameters can be specified in two ways: * **interval type:** The cut-off point is computed as `now() - created_before` and similarly `now() - created_after`. This uses the chunk creation time for the filtering. * **timestamp, date, or integer type:** The cut-off point is explicitly given as a `TIMESTAMP` / `TIMESTAMPTZ` / `DATE` or as a `SMALLINT` / `INT` / `BIGINT`. The choice of integer value must follow the type of the hypertable's partitioning column. Otherwise the chunk creation time is used for the filtering. When both `older_than` and `newer_than` arguments are used, the function returns the intersection of the resulting two ranges. For example, specifying `newer_than => 4 months` and `older_than => 3 months` shows all chunks between 3 and 4 months old. Similarly, specifying `newer_than => '2017-01-01'` and `older_than => '2017-02-01'` shows all chunks between '2017-01-01' and '2017-02-01'. Specifying parameters that do not result in an overlapping intersection between two ranges results in an error. When both `created_before` and `created_after` arguments are used, the function returns the intersection of the resulting two ranges. For example, specifying `created_after`=> 4 months` and `created_before`=> 3 months` shows all chunks created between 3 and 4 months from now. Similarly, specifying `created_after`=> '2017-01-01'` and `created_before` => '2017-02-01'` shows all chunks created between '2017-01-01' and '2017-02-01'. Specifying parameters that do not result in an overlapping intersection between two ranges results in an error. The `created_before`/`created_after` parameters cannot be used together with `older_than`/`newer_than`. ===== PAGE: https://docs.tigerdata.com/api/hypertable/merge_chunks/ ===== # merge_chunks() Merge two or more chunks into one. The partition boundaries for the new chunk is the union of all partitions of the merged chunks. The new chunk retains the name, constraints, and triggers of the _first_ chunk in the partition order. You can only merge chunks that have directly adjacent partitions. It is not possible to merge chunks that have another chunk, or an empty range between them in any of the partitioning dimensions. Chunk merging has the following limitations. You cannot: * Merge chunks with tiered data * Read or write from the chunks while they are being merged ## Since2180 Refer to the installation documentation for detailed setup instructions. ## Samples - Merge two chunks:sql CALL merge_chunks('_timescaledb_internal._hyper_1_1_chunk', '_timescaledb_internal._hyper_1_2_chunk');
- Merge more than two chunks:sql CALL merge_chunks('{_timescaledb_internal._hyper_1_1_chunk, _timescaledb_internal._hyper_1_2_chunk, _timescaledb_internal._hyper_1_3_chunk}');
## Arguments You can merge either two chunks, or an arbitrary number of chunks specified as an array of chunk identifiers. When you call `merge_chunks`, you must specify either `chunk1` and `chunk2`, or `chunks`. You cannot use both arguments. | Name | Type | Default | Required | Description | |--------------------|-------------|--|--|------------------------------------------------| | `chunk1`, `chunk2` | REGCLASS | - | ✖ | The two chunk to merge in partition order | | `chunks` | REGCLASS[] |- | ✖ | The array of chunks to merge in partition order | ===== PAGE: https://docs.tigerdata.com/api/hypertable/add_dimension/ ===== # add_dimension() Add an additional partitioning dimension to a TimescaleDB hypertable. You can only execute this `add_dimension` command on an empty hypertable. To convert a normal table to a hypertable, call [create hypertable][create_hypertable]. The column you select as the dimension can use either: - [Interval partitions][range-partition]: for example, for a second range partition. - [hash partitions][hash-partition]: to enable parallelization across multiple disks. Best practice is to not use additional dimensions. However, Tiger Cloud transparently provides seamless storage scaling, both in terms of storage capacity and available storage IOPS/bandwidth. This page describes the generalized hypertable API introduced in [TimescaleDB v2.13.0][rn-2130]. For information about the deprecated interface, see [add_dimension(), deprecated interface][add-dimension-old]. ## Samples First convert table `conditions` to hypertable with just range partitioning on column `time`, then add an additional partition key on `location` with four partitions:sql SELECT create_hypertable('conditions', by_range('time')); SELECT add_dimension('conditions', by_hash('location', 4));
The `by_range` and `by_hash` dimension builders are an addition to TimescaleDB 2.13. Convert table `conditions` to hypertable with range partitioning on `time` then add three additional dimensions: one hash partitioning on `location`, one range partition on `time_received`, and one hash partitionining on `device_id`.sql SELECT create_hypertable('conditions', by_range('time')); SELECT add_dimension('conditions', by_hash('location', 2)); SELECT add_dimension('conditions', by_range('time_received', INTERVAL '1 day')); SELECT add_dimension('conditions', by_hash('device_id', 2)); SELECT add_dimension('conditions', by_hash('device_id', 2), if_not_exists => true);
## Arguments | Name | Type | Default | Required | Description | |-|------------------|-|-|---------------------------------------------------------------------------------------------------------------------------------------------------| |`chunk_time_interval` | INTERVAL | - | ✖ | Interval that each chunk covers. Must be > 0. | |`dimension` | [DIMENSION_INFO][dimension-info] | - | ✔ | To create a `_timescaledb_internal.dimension_info` instance to partition a hypertable, you call [`by_range`][by-range] and [`by_hash`][by-hash]. | |`hypertable`| REGCLASS | - | ✔ | The hypertable to add the dimension to. | |`if_not_exists` | BOOLEAN | `false` | ✖ | Set to `true` to print an error if a dimension for the column already exists. By default an exception is raised. | |`number_partitions` | INTEGER | - | ✖ | Number of hash partitions to use on `column_name`. Must be > 0. | |`partitioning_func` | REGCLASS | - | ✖ | The function to use for calculating a value's partition. See [`create_hypertable`][create_hypertable] for more information. | ### Dimension info To create a `_timescaledb_internal.dimension_info` instance, you call [add_dimension][add_dimension] to an existing hypertable. #### Samples Hypertables must always have a primary range dimension, followed by an arbitrary number of additional dimensions that can be either range or hash, Typically this is just one hash. For example:sql SELECT add_dimension('conditions', by_range('time')); SELECT add_dimension('conditions', by_hash('location', 2));
For incompatible data types such as `jsonb`, you can specify a function to the `partition_func` argument of the dimension build to extract a compatible data type. Look in the example section below. #### Custom partitioning By default, TimescaleDB calls Postgres's internal hash function for the given type. You use a custom partitioning function for value types that do not have a native Postgres hash function. You can specify a custom partitioning function for both range and hash partitioning. A partitioning function should take a `anyelement` argument as the only parameter and return a positive `integer` hash value. This hash value is _not_ a partition identifier, but rather the inserted value's position in the dimension's key space, which is then divided across the partitions. #### by_range() Create a by-range dimension builder. You can partition `by_range` on it's own. ##### Samples - Partition on time using `CREATE TABLE` The simplest usage is to partition on a time column:sql CREATE TABLE conditions (
time TIMESTAMPTZ NOT NULL, location TEXT NOT NULL, device TEXT NOT NULL, temperature DOUBLE PRECISION NULL, humidity DOUBLE PRECISION NULL) WITH (
tsdb.hypertable, tsdb.partition_column='time');
If you are self-hosting TimescaleDB v2.19.3 and below, create a [Postgres relational table][pg-create-table], then convert it using [create_hypertable][create_hypertable]. You then enable hypercore with a call to [ALTER TABLE][alter_table_hypercore]. This is the default partition, you do not need to add it explicitly. - Extract time from a non-time column using `create_hypertable` If you have a table with a non-time column containing the time, such as a JSON column, add a partition function to extract the time:sql CREATE TABLE my_table (
metric_id serial not null, data jsonb,);
CREATE FUNCTION get_time(jsonb) RETURNS timestamptz AS $$
SELECT ($1->>'time')::timestamptz$$ LANGUAGE sql IMMUTABLE;
SELECT create_hypertable('my_table', by_range('data', '1 day', 'get_time'));
##### Arguments | Name | Type | Default | Required | Description | |-|----------|---------|-|-| |`column_name`| `NAME` | - |✔|Name of column to partition on.| |`partition_func`| `REGPROC` | - |✖|The function to use for calculating the partition of a value.| |`partition_interval`|`ANYELEMENT` | - |✖|Interval to partition column on.| If the column to be partitioned is a: - `TIMESTAMP`, `TIMESTAMPTZ`, or `DATE`: specify `partition_interval` either as an `INTERVAL` type or an integer value in *microseconds*. - Another integer type: specify `partition_interval` as an integer that reflects the column's underlying semantics. For example, if this column is in UNIX time, specify `partition_interval` in milliseconds. The partition type and default value depending on column type is:<a id="partition-types" href=""></a> | Column Type | Partition Type | Default value | |------------------------------|------------------|---------------| | `TIMESTAMP WITHOUT TIMEZONE` | INTERVAL/INTEGER | 1 week | | `TIMESTAMP WITH TIMEZONE` | INTERVAL/INTEGER | 1 week | | `DATE` | INTERVAL/INTEGER | 1 week | | `SMALLINT` | SMALLINT | 10000 | | `INT` | INT | 100000 | | `BIGINT` | BIGINT | 1000000 | #### by_hash() The main purpose of hash partitioning is to enable parallelization across multiple disks within the same time interval. Every distinct item in hash partitioning is hashed to one of *N* buckets. By default, TimescaleDB uses flexible range intervals to manage chunk sizes. ### Parallelizing disk I/O You use Parallel I/O in the following scenarios: - Two or more concurrent queries should be able to read from different disks in parallel. - A single query should be able to use query parallelization to read from multiple disks in parallel. For the following options: - **RAID**: use a RAID setup across multiple physical disks, and expose a single logical disk to the hypertable. That is, using a single tablespace. Best practice is to use RAID when possible, as you do not need to manually manage tablespaces in the database. - **Multiple tablespaces**: for each physical disk, add a separate tablespace to the database. TimescaleDB allows you to add multiple tablespaces to a *single* hypertable. However, although under the hood, a hypertable's chunks are spread across the tablespaces associated with that hypertable. When using multiple tablespaces, a best practice is to also add a second hash-partitioned dimension to your hypertable and to have at least one hash partition per disk. While a single time dimension would also work, it would mean that the first chunk is written to one tablespace, the second to another, and so on, and thus would parallelize only if a query's time range exceeds a single chunk. When adding a hash partitioned dimension, set the number of partitions to a multiple of number of disks. For example, the number of partitions P=N*Pd where N is the number of disks and Pd is the number of partitions per disk. This enables you to add more disks later and move partitions to the new disk from other disks. TimescaleDB does *not* benefit from a very large number of hash partitions, such as the number of unique items you expect in partition field. A very large number of hash partitions leads both to poorer per-partition load balancing (the mapping of items to partitions using hashing), as well as much increased planning latency for some types of queries. ##### Samplessql CREATE TABLE conditions ( "time" TIMESTAMPTZ NOT NULL, location TEXT NOT NULL, device TEXT NOT NULL, temperature DOUBLE PRECISION NULL, humidity DOUBLE PRECISION NULL ) WITH ( tsdb.hypertable, tsdb.partition_column='time', tsdb.chunk_interval='1 day' );
SELECT add_dimension('conditions', by_hash('location', 2));
##### Arguments | Name | Type | Default | Required | Description | |-|----------|---------|-|----------------------------------------------------------| |`column_name`| `NAME` | - |✔| Name of column to partition on. | |`partition_func`| `REGPROC` | - |✖| The function to use to calcule the partition of a value. | |`number_partitions`|`ANYELEMENT` | - |✔| Number of hash partitions to use for `partitioning_column`. Must be greater than 0. | #### Returns `by_range` and `by-hash` return an opaque `_timescaledb_internal.dimension_info` instance, holding the dimension information used by this function. ## Returns |Column|Type| Description | |-|-|-------------------------------------------------------------------------------------------------------------| |`dimension_id`|INTEGER| ID of the dimension in the TimescaleDB internal catalog | |`created`|BOOLEAN| `true` if the dimension was added, `false` when you set `if_not_exists` to `true` and no dimension was added. | ===== PAGE: https://docs.tigerdata.com/api/hypertable/add_dimension_old/ ===== # add_dimension() This interface is deprecated since [TimescaleDB v2.13.0][rn-2130]. For information about the supported hypertable interface, see [add_dimension()][add-dimension]. Add an additional partitioning dimension to a TimescaleDB hypertable. The column selected as the dimension can either use interval partitioning (for example, for a second time partition) or hash partitioning. The `add_dimension` command can only be executed after a table has been converted to a hypertable (via `create_hypertable`), but must similarly be run only on an empty hypertable. **Space partitions**: Using space partitions is highly recommended for [distributed hypertables][distributed-hypertables] to achieve efficient scale-out performance. For [regular hypertables][regular-hypertables] that exist only on a single node, additional partitioning can be used for specialized use cases and not recommended for most users. Space partitions use hashing: Every distinct item is hashed to one of *N* buckets. Remember that we are already using (flexible) time intervals to manage chunk sizes; the main purpose of space partitioning is to enable parallelization across multiple data nodes (in the case of distributed hypertables) or across multiple disks within the same time interval (in the case of single-node deployments). ## Samples First convert table `conditions` to hypertable with just time partitioning on column `time`, then add an additional partition key on `location` with four partitions:sql SELECT create_hypertable('conditions', 'time'); SELECT add_dimension('conditions', 'location', number_partitions => 4);
Convert table `conditions` to hypertable with time partitioning on `time` and space partitioning (2 partitions) on `location`, then add two additional dimensions.sql SELECT create_hypertable('conditions', 'time', 'location', 2); SELECT add_dimension('conditions', 'time_received', chunk_time_interval => INTERVAL '1 day'); SELECT add_dimension('conditions', 'device_id', number_partitions => 2); SELECT add_dimension('conditions', 'device_id', number_partitions => 2, if_not_exists => true);
Now in a multi-node example for distributed hypertables with a cluster of one access node and two data nodes, configure the access node for access to the two data nodes. Then, convert table `conditions` to a distributed hypertable with just time partitioning on column `time`, and finally add a space partitioning dimension on `location` with two partitions (as the number of the attached data nodes).sql SELECT add_data_node('dn1', host => 'dn1.example.com'); SELECT add_data_node('dn2', host => 'dn2.example.com'); SELECT create_distributed_hypertable('conditions', 'time'); SELECT add_dimension('conditions', 'location', number_partitions => 2);
### Parallelizing queries across multiple data nodes In a distributed hypertable, space partitioning enables inserts to be parallelized across data nodes, even while the inserted rows share timestamps from the same time interval, and thus increases the ingest rate. Query performance also benefits by being able to parallelize queries across nodes, particularly when full or partial aggregations can be "pushed down" to data nodes (for example, as in the query `avg(temperature) FROM conditions GROUP BY hour, location` when using `location` as a space partition). Please see our [best practices about partitioning in distributed hypertables][distributed-hypertable-partitioning-best-practices] for more information. ### Parallelizing disk I/O on a single node Parallel I/O can benefit in two scenarios: (a) two or more concurrent queries should be able to read from different disks in parallel, or (b) a single query should be able to use query parallelization to read from multiple disks in parallel. Thus, users looking for parallel I/O have two options: 1. Use a RAID setup across multiple physical disks, and expose a single logical disk to the hypertable (that is, via a single tablespace). 1. For each physical disk, add a separate tablespace to the database. TimescaleDB allows you to actually add multiple tablespaces to a *single* hypertable (although under the covers, a hypertable's chunks are spread across the tablespaces associated with that hypertable). We recommend a RAID setup when possible, as it supports both forms of parallelization described above (that is, separate queries to separate disks, single query to multiple disks in parallel). The multiple tablespace approach only supports the former. With a RAID setup, *no spatial partitioning is required*. That said, when using space partitions, we recommend using 1 space partition per disk. TimescaleDB does *not* benefit from a very large number of space partitions (such as the number of unique items you expect in partition field). A very large number of such partitions leads both to poorer per-partition load balancing (the mapping of items to partitions using hashing), as well as much increased planning latency for some types of queries. ## Required arguments |Name|Type|Description| |-|-|-| |`hypertable`|REGCLASS|Hypertable to add the dimension to| |`column_name`|TEXT|Column to partition by| ## Optional arguments |Name|Type|Description| |-|-|-| |`number_partitions`|INTEGER|Number of hash partitions to use on `column_name`. Must be > 0| |`chunk_time_interval`|INTERVAL|Interval that each chunk covers. Must be > 0| |`partitioning_func`|REGCLASS|The function to use for calculating a value's partition (see `create_hypertable` [instructions][create_hypertable])| |`if_not_exists`|BOOLEAN|Set to true to avoid throwing an error if a dimension for the column already exists. A notice is issued instead. Defaults to false| ## Returns |Column|Type|Description| |-|-|-| |`dimension_id`|INTEGER|ID of the dimension in the TimescaleDB internal catalog| |`schema_name`|TEXT|Schema name of the hypertable| |`table_name`|TEXT|Table name of the hypertable| |`column_name`|TEXT|Column name of the column to partition by| |`created`|BOOLEAN|True if the dimension was added, false when `if_not_exists` is true and no dimension was added| When executing this function, either `number_partitions` or `chunk_time_interval` must be supplied, which dictates if the dimension uses hash or interval partitioning. The `chunk_time_interval` should be specified as follows: * If the column to be partitioned is a TIMESTAMP, TIMESTAMPTZ, or DATE, this length should be specified either as an INTERVAL type or an integer value in *microseconds*. * If the column is some other integer type, this length should be an integer that reflects the column's underlying semantics (for example, the `chunk_time_interval` should be given in milliseconds if this column is the number of milliseconds since the UNIX epoch). Supporting more than **one** additional dimension is currently experimental. For any production environments, users are recommended to use at most one "space" dimension. ===== PAGE: https://docs.tigerdata.com/api/hypertable/hypertable_approximate_detailed_size/ ===== # hypertable_approximate_detailed_size() Get detailed information about approximate disk space used by a hypertable or continuous aggregate, returning size information for the table itself, any indexes on the table, any toast tables, and the total size of all. All sizes are reported in bytes. When a continuous aggregate name is provided, the function transparently looks up the backing hypertable and returns its approximate size statistics instead. This function relies on the per backend caching using the in-built Postgres storage manager layer to compute the approximate size cheaply. The PG cache invalidation clears off the cached size for a chunk when DML happens into it. That size cache is thus able to get the latest size in a matter of minutes. Also, due to the backend caching, any long running session will only fetch latest data for new or modified chunks and can use the cached data (which is calculated afresh the first time around) effectively for older chunks. Thus it is recommended to use a single connected Postgres backend session to compute the approximate sizes of hypertables to get faster results. For more information about using hypertables, including chunk size partitioning, see the [hypertable section][hypertable-docs]. ## Samples Get the approximate size information for a hypertable.sql SELECT * FROM hypertable_approximate_detailed_size('hyper_table'); table_bytes | index_bytes | toast_bytes | total_bytes -------------+-------------+-------------+-------------
8192 | 24576 | 32768 | 65536## Required arguments |Name|Type|Description| |---|---|---| | `hypertable` | REGCLASS | Hypertable or continuous aggregate to show detailed approximate size of. | ## Returns |Column|Type|Description| |-|-|-| |table_bytes|BIGINT|Approximate disk space used by main_table (like `pg_relation_size(main_table)`)| |index_bytes|BIGINT|Approximate disk space used by indexes| |toast_bytes|BIGINT|Approximate disk space of toast tables| |total_bytes|BIGINT|Approximate total disk space used by the specified table, including all indexes and TOAST data| If executed on a relation that is not a hypertable, the function returns `NULL`. ===== PAGE: https://docs.tigerdata.com/api/hypertable/set_integer_now_func/ ===== # set_integer_now_fun() Override the [`now()`](https://www.postgresql.org/docs/16/functions-datetime.html) date/time function used to set the current time in the integer `time` column in a hypertable. Many policies only apply to [chunks][chunks] of a certain age. `integer_now_func` determines the age of each chunk. The function you set as `integer_now_func` has no arguments. It must be either: - `IMMUTABLE`: Use when you execute the query each time rather than prepare it prior to execution. The value for `integer_now_func` is computed before the plan is generated. This generates a significantly smaller plan, especially if you have a lot of chunks. - `STABLE`: `integer_now_func` is evaluated just before query execution starts. [chunk pruning](https://www.timescale.com/blog/optimizing-queries-timescaledb-hypertables-with-partitions-postgresql-6366873a995d) is executed at runtime. This generates a correct result, but may increase planning time. `set_integer_now_func` does not work on tables where the `time` column type is `TIMESTAMP`, `TIMESTAMPTZ`, or `DATE`. ## Samples Set the integer `now` function for a hypertable with a time column in [unix time](https://en.wikipedia.org/wiki/Unix_time). - `IMMUTABLE`: when you execute the query each time: ```sql CREATE OR REPLACE FUNCTION unix_now_immutable() returns BIGINT LANGUAGE SQL IMMUTABLE as $$ SELECT extract (epoch from now())::BIGINT $$; SELECT set_integer_now_func('hypertable_name', 'unix_now_immutable'); ``` - `STABLE`: for prepared statements: ```sql CREATE OR REPLACE FUNCTION unix_now_stable() returns BIGINT LANGUAGE SQL STABLE AS $$ SELECT extract(epoch from now())::BIGINT $$; SELECT set_integer_now_func('hypertable_name', 'unix_now_stable'); ``` ## Required arguments |Name|Type| Description | |-|-|-| |`main_table`|REGCLASS| The hypertable `integer_now_func` is used in. | |`integer_now_func`|REGPROC| A function that returns the current time set in each row in the `time` column in `main_table`.| ## Optional arguments |Name|Type| Description| |-|-|-| |`replace_if_exists`|BOOLEAN| Set to `true` to override `integer_now_func` when you have previously set a custom function. Default is `false`. | ===== PAGE: https://docs.tigerdata.com/api/hypertable/create_index/ ===== # CREATE INDEX (Transaction Per Chunk)SQL CREATE INDEX ... WITH (timescaledb.transaction_per_chunk, ...);
This option extends [`CREATE INDEX`][postgres-createindex] with the ability to use a separate transaction for each chunk it creates an index on, instead of using a single transaction for the entire hypertable. This allows `INSERT`s, and other operations to be performed concurrently during most of the duration of the `CREATE INDEX` command. While the index is being created on an individual chunk, it functions as if a regular `CREATE INDEX` were called on that chunk, however other chunks are completely unblocked. This version of `CREATE INDEX` can be used as an alternative to `CREATE INDEX CONCURRENTLY`, which is not currently supported on hypertables. - Not supported for `CREATE UNIQUE INDEX`. - If the operation fails partway through, indexes might not be created on all hypertable chunks. If this occurs, the index on the root table of the hypertable is marked as invalid. You can check this by running `\d+` on the hypertable. The index still works, and is created on new chunks, but if you want to ensure all chunks have a copy of the index, drop and recreate it. You can also use the following query to find all invalid indexes:SQL SELECT * FROM pg_index i WHERE i.indisvalid IS FALSE;
## Samples Create an anonymous index:SQL CREATE INDEX ON conditions(time, device_id)
WITH (timescaledb.transaction_per_chunk);Alternatively:SQL CREATE INDEX ON conditions USING brin(time, location)
WITH (timescaledb.transaction_per_chunk);===== PAGE: https://docs.tigerdata.com/api/continuous-aggregates/refresh_continuous_aggregate/ ===== # refresh_continuous_aggregate() Refresh all buckets of a continuous aggregate in the refresh window given by `window_start` and `window_end`. A continuous aggregate materializes aggregates in time buckets. For example, min, max, average over 1 day worth of data, and is determined by the `time_bucket` interval. Therefore, when refreshing the continuous aggregate, only buckets that completely fit within the refresh window are refreshed. In other words, it is not possible to compute the aggregate over, for an incomplete bucket. Therefore, any buckets that do not fit within the given refresh window are excluded. The function expects the window parameter values to have a time type that is compatible with the continuous aggregate's time bucket expression—for example, if the time bucket is specified in `TIMESTAMP WITH TIME ZONE`, then the start and end time should be a date or timestamp type. Note that a continuous aggregate using the `TIMESTAMP WITH TIME ZONE` type aligns with the UTC time zone, so, if `window_start` and `window_end` is specified in the local time zone, any time zone shift relative UTC needs to be accounted for when refreshing to align with bucket boundaries. To improve performance for continuous aggregate refresh, see [CREATE MATERIALIZED VIEW ][create_materialized_view]. ## Samples Refresh the continuous aggregate `conditions` between `2020-01-01` and `2020-02-01` exclusive.sql CALL refresh_continuous_aggregate('conditions', '2020-01-01', '2020-02-01');
Alternatively, incrementally refresh the continuous aggregate `conditions` between `2020-01-01` and `2020-02-01` exclusive, working in `12h` intervals:sql DO $$ DECLARE refresh_interval INTERVAL = '12h'::INTERVAL; start_timestamp TIMESTAMPTZ = '2020-01-01T00:00:00Z'; end_timestamp TIMESTAMPTZ = start_timestamp + refresh_interval; BEGIN WHILE start_timestamp < '2020-02-01T00:00:00Z' LOOP
CALL refresh_continuous_aggregate('conditions', start_timestamp, end_timestamp); COMMIT; RAISE NOTICE 'finished with timestamp %', end_timestamp; start_timestamp = end_timestamp; end_timestamp = end_timestamp + refresh_interval;END LOOP; END $$;
Force the `conditions` continuous aggregate to refresh between `2020-01-01` and `2020-02-01` exclusive, even if the data has already been refreshed.sql CALL refresh_continuous_aggregate('conditions', '2020-01-01', '2020-02-01', force => TRUE);
## Required arguments |Name|Type|Description| |-|-|-| |`continuous_aggregate`|REGCLASS|The continuous aggregate to refresh.| |`window_start`|INTERVAL, TIMESTAMPTZ, INTEGER|Start of the window to refresh, has to be before `window_end`.| |`window_end`|INTERVAL, TIMESTAMPTZ, INTEGER|End of the window to refresh, has to be after `window_start`.| You must specify the `window_start` and `window_end` parameters differently, depending on the type of the time column of the hypertable. For hypertables with `TIMESTAMP`, `TIMESTAMPTZ`, and `DATE` time columns, set the refresh window as an `INTERVAL` type. For hypertables with integer-based timestamps, set the refresh window as an `INTEGER` type. A `NULL` value for `window_start` is equivalent to the lowest changed element in the raw hypertable of the CAgg. A `NULL` value for `window_end` is equivalent to the largest changed element in raw hypertable of the CAgg. As changed element tracking is performed after the initial CAgg refresh, running CAgg refresh without `window_start` and `window_end` covers the entire time range. Note that it's not guaranteed that all buckets will be updated: refreshes will not take place when buckets are materialized with no data changes or with changes that only occurred in the secondary table used in the JOIN. ## Optional arguments |Name|Type| Description | |-|-|------------------------------------------------------------------------------------------------------------------------------------------------------------------------------------------------------------------------| | `force` | BOOLEAN | Force refresh every bucket in the time range between `window_start` and `window_end`, even when the bucket has already been refreshed. This can be very expensive when a lot of data is refreshed. Default is `FALSE`. | | `refresh_newest_first` | BOOLEAN | Set to `FALSE` to refresh the oldest data first. Default is `TRUE`. | ===== PAGE: https://docs.tigerdata.com/api/continuous-aggregates/remove_policies/ ===== # remove_policies() <!-- markdownlint-disable-next-line line-length --> Remove refresh, columnstore, and data retention policies from a continuous aggregate. The removed columnstore and retention policies apply to the continuous aggregate, _not_ to the original hypertable.sql timescaledb_experimental.remove_policies(
relation REGCLASS, if_exists BOOL = false, VARIADIC policy_names TEXT[] = NULL) RETURNS BOOL
To remove all policies on a continuous aggregate, see [`remove_all_policies()`][remove-all-policies]. Experimental features could have bugs. They might not be backwards compatible, and could be removed in future releases. Use these features at your own risk, and do not use any experimental features in production. ## Samples Given a continuous aggregate named `example_continuous_aggregate` with a refresh policy and a data retention policy, remove both policies. Throw an error if either policy doesn't exist. If the continuous aggregate has a columnstore policy, leave it unchanged:sql SELECT timescaledb_experimental.remove_policies(
'example_continuous_aggregate', false, 'policy_refresh_continuous_aggregate', 'policy_retention');
## Required arguments |Name|Type|Description| |-|-|-| |`relation`|`REGCLASS`|The continuous aggregate to remove policies from| ## Optional arguments |Name|Type|Description| |-|-|-| |`if_exists`|`BOOL`|When true, prints a warning instead of erroring if the policy doesn't exist. Defaults to false.| |`policy_names`|`TEXT`|The policies to remove. You can list multiple policies, separated by a comma. Allowed policy names are `policy_refresh_continuous_aggregate`, `policy_compression`, and `policy_retention`.| ## Returns Returns true if successful. ===== PAGE: https://docs.tigerdata.com/api/continuous-aggregates/add_continuous_aggregate_policy/ ===== # add_continuous_aggregate_policy() Create a policy that automatically refreshes a continuous aggregate. To view the policies that you set or the policies that already exist, see [informational views][informational-views]. ## Samples Add a policy that refreshes the last month once an hour, excluding the latest hour from the aggregate. For performance reasons, we recommend that you exclude buckets that see lots of writes:sql SELECT add_continuous_aggregate_policy('conditions_summary', start_offset => INTERVAL '1 month', end_offset => INTERVAL '1 hour', schedule_interval => INTERVAL '1 hour');
## Required arguments |Name|Type|Description| |-|-|-| |`continuous_aggregate`|REGCLASS|The continuous aggregate to add the policy for| |`start_offset`|INTERVAL or integer|Start of the refresh window as an interval relative to the time when the policy is executed. `NULL` is equivalent to `MIN(timestamp)` of the hypertable.| |`end_offset`|INTERVAL or integer|End of the refresh window as an interval relative to the time when the policy is executed. `NULL` is equivalent to `MAX(timestamp)` of the hypertable.| |`schedule_interval`|INTERVAL|Interval between refresh executions in wall-clock time. Defaults to 24 hours| |`initial_start`|TIMESTAMPTZ|Time the policy is first run. Defaults to NULL. If omitted, then the schedule interval is the intervalbetween the finish time of the last execution and the next start. If provided, it serves as the origin with respect to which the next_start is calculated | The `start_offset` should be greater than `end_offset`. You must specify the `start_offset` and `end_offset` parameters differently, depending on the type of the time column of the hypertable: * For hypertables with `TIMESTAMP`, `TIMESTAMPTZ`, and `DATE` time columns, set the offset as an `INTERVAL` type. * For hypertables with integer-based timestamps, set the offset as an `INTEGER` type. While setting `end_offset` to `NULL` is possible, it is not recommended. To include the data between `end_offset` and the current time in queries, enable [real-time aggregation](https://docs.tigerdata.com/use-timescale/latest/continuous-aggregates/real-time-aggregates/). You can add [concurrent refresh policies](https://docs.tigerdata.com/use-timescale/latest/continuous-aggregates/refresh-policies/) on each continuous aggregate, as long as the `start_offset` and `end_offset` does not overlap with another policy on the same continuous aggregate. ## Optional arguments |Name|Type|Description| |-|-|-| |`if_not_exists`|BOOLEAN|Set to `true` to issue a notice instead of an error if the job already exists. Defaults to false.| |`timezone`|TEXT|A valid time zone. If you specify `initial_start`, subsequent executions of the refresh policy are aligned on `initial_start`. However, daylight savings time (DST) changes may shift this alignment. If this is an issue you want to mitigate, set `timezone` to a valid time zone. Default is `NULL`, [UTC bucketing](https://docs.tigerdata.com/use-timescale/latest/time-buckets/about-time-buckets/) is performed.| | `include_tiered_data` | BOOLEAN | Enable/disable reading tiered data. This setting helps override the current settings for the`timescaledb.enable_tiered_reads` GUC. The default is NULL i.e we use the current setting for `timescaledb.enable_tiered_reads` GUC | | | `buckets_per_batch` | INTEGER | Number of buckets to be refreshed by a _batch_. This value is multiplied by the CAgg bucket width to determine the size of the batch range. Default value is `1`, single batch execution. Values of less than `0` are not allowed. | | | `max_batches_per_execution` | INTEGER | Limit the maximum number of batches to run when a policy executes. If some batches remain, they are processed the next time the policy runs. Default value is `0`, for an unlimted number of batches. Values of less than `0` are not allowed. | | | `refresh_newest_first` | BOOLEAN | Control the order of incremental refreshes. Set to `TRUE` to refresh from the newest data to the oldest. Set to `FALSE` for oldest to newest. The default is `TRUE`. | | Setting `buckets_per_batch` greater than zero means that the refresh window is split in batches of `bucket width` * `buckets per batch`. For example, a given Continuous Aggregate with `bucket width` of `1 day` and `buckets_per_batch` of 10 has a batch size of `10 days` to process the refresh. Because each `batch` is an individual transaction, executing a policy in batches make the data visible for the users before the entire job is executed. Batches are processed from the most recent data to the oldest. ## Returns |Column|Type|Description| |-|-|-| |`job_id`|INTEGER|TimescaleDB background job ID created to implement this policy| ===== PAGE: https://docs.tigerdata.com/api/continuous-aggregates/hypertable_size/ ===== # hypertable_size() # hypertable_size() Get the total disk space used by a hypertable or continuous aggregate, that is, the sum of the size for the table itself including chunks, any indexes on the table, and any toast tables. The size is reported in bytes. This is equivalent to computing the sum of `total_bytes` column from the output of `hypertable_detailed_size` function. When a continuous aggregate name is provided, the function transparently looks up the backing hypertable and returns its statistics instead. For more information about using hypertables, including chunk size partitioning, see the [hypertable section][hypertable-docs]. ## Samples Get the size information for a hypertable.sql SELECT hypertable_size('devices');
hypertable_size
73728Get the size information for all hypertables.sql SELECT hypertable_name, hypertable_size(format('%I.%I', hypertable_schema, hypertable_name)::regclass) FROM timescaledb_information.hypertables;
Get the size information for a continuous aggregate.sql SELECT hypertable_size('device_stats_15m');
hypertable_size
73728## Required arguments |Name|Type|Description| |-|-|-| |`hypertable`|REGCLASS|Hypertable or continuous aggregate to show size of.| ## Returns |Name|Type|Description| |-|-|-| |hypertable_size|BIGINT|Total disk space used by the specified hypertable, including all indexes and TOAST data| `NULL` is returned if the function is executed on a non-hypertable relation. ===== PAGE: https://docs.tigerdata.com/api/continuous-aggregates/alter_policies/ ===== # alter_policies() <!-- markdownlint-disable-next-line line-length --> Alter refresh, columnstore, or data retention policies on a continuous aggregate. The altered columnstore and retention policies apply to the continuous aggregate, _not_ to the original hypertable.sql timescaledb_experimental.alter_policies(
relation REGCLASS, if_exists BOOL = false, refresh_start_offset "any" = NULL, refresh_end_offset "any" = NULL, compress_after "any" = NULL, drop_after "any" = NULL) RETURNS BOOL
Experimental features could have bugs. They might not be backwards compatible, and could be removed in future releases. Use these features at your own risk, and do not use any experimental features in production. ## Samples Given a continuous aggregate named `example_continuous_aggregate` with an existing columnstore policy, alter the columnstore policy to compress data older than 16 days:sql SELECT timescaledb_experimental.alter_policies(
'continuous_agg_max_mat_date', compress_after => '16 days'::interval);
## Required arguments |Name|Type|Description| |-|-|-| |`relation`|`REGCLASS`|The continuous aggregate that you want to alter policies for| ## Optional arguments |Name|Type| Description | |-|-|---------------------------------------------------------------------------------------------------------------------------------------------------| |`if_not_exists`|`BOOL`| When true, prints a warning instead of erroring if the policy doesn't exist. Defaults to false. | |`refresh_start_offset`|`INTERVAL` or `INTEGER`| The start of the continuous aggregate refresh window, expressed as an offset from the policy run time. | |`refresh_end_offset`|`INTERVAL` or `INTEGER`| The end of the continuous aggregate refresh window, expressed as an offset from the policy run time. Must be greater than `refresh_start_offset`. | |`compress_after`|`INTERVAL` or `INTEGER`| Continuous aggregate chunks are compressed into the columnstore if they exclusively contain data older than this interval. | |`drop_after`|`INTERVAL` or `INTEGER`| Continuous aggregate chunks are dropped if they exclusively contain data older than this interval. | For arguments that could be either an `INTERVAL` or an `INTEGER`, use an `INTERVAL` if your time bucket is based on timestamps. Use an `INTEGER` if your time bucket is based on integers. ## Returns Returns true if successful. ===== PAGE: https://docs.tigerdata.com/api/continuous-aggregates/remove_continuous_aggregate_policy/ ===== # remove_continuous_aggregate_policy() Remove all refresh policies from a continuous aggregate.sql remove_continuous_aggregate_policy(
continuous_aggregate REGCLASS, if_exists BOOL = NULL) RETURNS VOID
To view the existing continuous aggregate policies, see the [policies informational view](https://docs.tigerdata.com/api/latest/informational-views/policies/). ## Samples Remove all refresh policies from the `cpu_view` continuous aggregate:sql SELECT remove_continuous_aggregate_policy('cpu_view');
## Required arguments |Name|Type|Description| |-|-|-| |`continuous_aggregate`|`REGCLASS`|Name of the continuous aggregate the policies should be removed from| ## Optional arguments |Name|Type|Description| |-|-|-| |`if_exists` (formerly `if_not_exists`)|`BOOL`|When true, prints a warning instead of erroring if the policy doesn't exist. Defaults to false. Renamed in TimescaleDB 2.8.| ===== PAGE: https://docs.tigerdata.com/api/continuous-aggregates/add_policies/ ===== # add_policies() <!-- markdownlint-disable-next-line line-length --> Add refresh, compression, and data retention policies to a continuous aggregate in one step. The added compression and retention policies apply to the continuous aggregate, _not_ to the original hypertable.sql timescaledb_experimental.add_policies(
relation REGCLASS, if_not_exists BOOL = false, refresh_start_offset "any" = NULL, refresh_end_offset "any" = NULL, compress_after "any" = NULL, drop_after "any" = NULL)) RETURNS BOOL
Experimental features could have bugs. They might not be backwards compatible, and could be removed in future releases. Use these features at your own risk, and do not use any experimental features in production. `add_policies()` does not allow the `schedule_interval` for the continuous aggregate to be set, instead using a default value of 1 hour. If you would like to set this add your policies manually (see [`add_continuous_aggregate_policy`][add_continuous_aggregate_policy]). ## Samples Given a continuous aggregate named `example_continuous_aggregate`, add three policies to it: 1. Regularly refresh the continuous aggregate to materialize data between 1 day and 2 days old. 1. Compress data in the continuous aggregate after 20 days. 1. Drop data in the continuous aggregate after 1 year.sql SELECT timescaledb_experimental.add_policies(
'example_continuous_aggregate', refresh_start_offset => '1 day'::interval, refresh_end_offset => '2 day'::interval, compress_after => '20 days'::interval, drop_after => '1 year'::interval);
## Required arguments |Name|Type|Description| |-|-|-| |`relation`|`REGCLASS`|The continuous aggregate that the policies should be applied to| ## Optional arguments |Name|Type|Description| |-|-|-| |`if_not_exists`|`BOOL`|When true, prints a warning instead of erroring if the continuous aggregate doesn't exist. Defaults to false.| |`refresh_start_offset`|`INTERVAL` or `INTEGER`|The start of the continuous aggregate refresh window, expressed as an offset from the policy run time.| |`refresh_end_offset`|`INTERVAL` or `INTEGER`|The end of the continuous aggregate refresh window, expressed as an offset from the policy run time. Must be greater than `refresh_start_offset`.| |`compress_after`|`INTERVAL` or `INTEGER`|Continuous aggregate chunks are compressed if they exclusively contain data older than this interval.| |`drop_after`|`INTERVAL` or `INTEGER`|Continuous aggregate chunks are dropped if they exclusively contain data older than this interval.| For arguments that could be either an `INTERVAL` or an `INTEGER`, use an `INTERVAL` if your time bucket is based on timestamps. Use an `INTEGER` if your time bucket is based on integers. ## Returns Returns `true` if successful. <!-- vale Vale.Terms = NO --> <!-- vale Vale.Terms = YES --> ===== PAGE: https://docs.tigerdata.com/api/continuous-aggregates/create_materialized_view/ ===== # CREATE MATERIALIZED VIEW (Continuous Aggregate) The `CREATE MATERIALIZED VIEW` statement is used to create continuous aggregates. To learn more, see the [continuous aggregate how-to guides][cagg-how-tos]. The syntax is:sql CREATE MATERIALIZED VIEW [ ( column_name [, ...] ) ] WITH ( timescaledb.continuous [, timescaledb. = ] ) AS
<select_query>[WITH [NO] DATA]
`<select_query>` is of the form:sql SELECT ,
FROM <hypertable or another continuous aggregate>[WHERE ... ] GROUP BY time_bucket( , ),
[ optional grouping exprs>][HAVING ...]
The continuous aggregate view defaults to `WITH DATA`. This means that when the view is created, it refreshes using all the current data in the underlying hypertable or continuous aggregate. This occurs once when the view is created. If you want the view to be refreshed regularly, you can use a refresh policy. If you do not want the view to update when it is first created, use the `WITH NO DATA` parameter. For more information, see [`refresh_continuous_aggregate`][refresh-cagg]. Continuous aggregates have some limitations of what types of queries they can support. For more information, see the [continuous aggregates section][cagg-how-tos]. TimescaleDB v2.17.1 and greater dramatically decrease the amount of data written on a continuous aggregate in the presence of a small number of changes, reduce the i/o cost of refreshing a continuous aggregate, and generate fewer Write-Ahead Logs (WAL), set the`timescaledb.enable_merge_on_cagg_refresh` configuration parameter to `TRUE`. This enables continuous aggregate refresh to use merge instead of deleting old materialized data and re-inserting. For more settings for continuous aggregates, see [timescaledb_information.continuous_aggregates][info-views]. ## Samples Create a daily continuous aggregate view:sql CREATE MATERIALIZED VIEW continuous_aggregate_daily( timec, minl, sumt, sumh ) WITH (timescaledb.continuous) AS SELECT time_bucket('1day', timec), min(location), sum(temperature), sum(humidity)
FROM conditions GROUP BY time_bucket('1day', timec)Add a thirty day continuous aggregate on top of the same raw hypertable:sql CREATE MATERIALIZED VIEW continuous_aggregate_thirty_day( timec, minl, sumt, sumh ) WITH (timescaledb.continuous) AS SELECT time_bucket('30day', timec), min(location), sum(temperature), sum(humidity)
FROM conditions GROUP BY time_bucket('30day', timec);Add an hourly continuous aggregate on top of the same raw hypertable:sql CREATE MATERIALIZED VIEW continuous_aggregate_hourly( timec, minl, sumt, sumh ) WITH (timescaledb.continuous) AS SELECT time_bucket('1h', timec), min(location), sum(temperature), sum(humidity)
FROM conditions GROUP BY time_bucket('1h', timec);## Parameters |Name|Type|Description| |-|-|-| |`<view_name>`|TEXT|Name (optionally schema-qualified) of continuous aggregate view to create| |`<column_name>`|TEXT|Optional list of names to be used for columns of the view. If not given, the column names are calculated from the query| |`WITH` clause|TEXT|Specifies options for the continuous aggregate view| |`<select_query>`|TEXT|A `SELECT` query that uses the specified syntax| Required `WITH` clause options: |Name|Type|Description| |-|-|-| |`timescaledb.continuous`|BOOLEAN|If `timescaledb.continuous` is not specified, this is a regular PostgresSQL materialized view| Optional `WITH` clause options: |Name|Type| Description |Default value| |-|-|----------------------------------------------------------------------------------------------------------------------------------------------------------------------------------------------------------------------------------------------------------------------------------------------------------------------------------------------------------------------------------------------------------------------------------|-| |`timescaledb.chunk_interval`|INTERVAL| Set the chunk interval. The default value is 10x the original hypertable. | |`timescaledb.create_group_indexes`|BOOLEAN| Create indexes on the continuous aggregate for columns in its `GROUP BY` clause. Indexes are in the form `(<GROUP_BY_COLUMN>, time_bucket)` |`TRUE`| |`timescaledb.finalized`|BOOLEAN| In TimescaleDB 2.7 and above, use the new version of continuous aggregates, which stores finalized results for aggregate functions. Supports all aggregate functions, including ones that use `FILTER`, `ORDER BY`, and `DISTINCT` clauses. |`TRUE`| |`timescaledb.materialized_only`|BOOLEAN| Return only materialized data when querying the continuous aggregate view |`TRUE`| | `timescaledb.invalidate_using` | TEXT | Since [TimescaleDB v2.22.0](https://github.com/timescale/timescaledb/releases/tag/2.22.0)Set to `wal` to read changes from the WAL using logical decoding, then update the materialization invalidations for continuous aggregates using this information. This reduces the I/O and CPU needed to manage the hypertable invalidation log. Set to `trigger` to collect invalidations whenever there are inserts, updates, or deletes to a hypertable. This default behaviour uses more resources than `wal`. | `trigger` | For more information, see the [real-time aggregates][real-time-aggregates] section. ===== PAGE: https://docs.tigerdata.com/api/continuous-aggregates/alter_materialized_view/ ===== # ALTER MATERIALIZED VIEW (Continuous Aggregate) You use the `ALTER MATERIALIZED VIEW` statement to modify some of the `WITH` clause [options][create_materialized_view] for a continuous aggregate view. You can only set the `continuous` and `create_group_indexes` options when you [create a continuous aggregate][create_materialized_view]. `ALTER MATERIALIZED VIEW` also supports the following [Postgres clauses][postgres-alterview] on the continuous aggregate view: * `RENAME TO`: rename the continuous aggregate view * `RENAME [COLUMN]`: rename the continuous aggregate column * `SET SCHEMA`: set the new schema for the continuous aggregate view * `SET TABLESPACE`: move the materialization of the continuous aggregate view to the new tablespace * `OWNER TO`: set a new owner for the continuous aggregate view ## Samples - Enable real-time aggregates for a continuous aggregate:sql ALTER MATERIALIZED VIEW contagg_view SET (timescaledb.materialized_only = false);
- Enable hypercore for a continuous aggregate Since [TimescaleDB v2.18.0](https://github.com/timescale/timescaledb/releases/tag/2.18.0):sql
ALTER MATERIALIZED VIEW contagg_view SET ( timescaledb.enable_columnstore = true, timescaledb.segmentby = 'symbol' );- Rename a column for a continuous aggregate:sql ALTER MATERIALIZED VIEW contagg_view RENAME COLUMN old_name TO new_name;
## Arguments The syntax is:sql ALTER MATERIALIZED VIEW SET ( timescaledb. = [, ... ] )
| Name | Type | Default | Required | Description | |---------------------------------------------------------------------------|-----------|------------------------------------------------------|----------|------------------------------------------------------------------------------------------------------------------------------------------------------------------------------------------------------------------------------------------------------------------------------------------------------------------------------------------------------------------------------------------------------------------------------------------------------------------------------------------------------------------------------------------------------------------------| | `view_name` | TEXT | - | ✖ | The name of the continuous aggregate view to be altered. | | `timescaledb.materialized_only` | BOOLEAN | `true` | ✖ | Enable real-time aggregation. | | `timescaledb.enable_columnstore` | BOOLEAN | `true` | ✖ | Since [TimescaleDB v2.18.0](https://github.com/timescale/timescaledb/releases/tag/2.18.0) Enable columnstore. Effectively the same as `timescaledb.compress`. | | `timescaledb.compress` | TEXT | Disabled. | ✖ | Enable compression. | | `timescaledb.orderby` | TEXT | Descending order on the time column in `table_name`. | ✖ | Since [TimescaleDB v2.18.0](https://github.com/timescale/timescaledb/releases/tag/2.18.0) Set the order in which items are used in the columnstore. Specified in the same way as an `ORDER BY` clause in a `SELECT` query. | | `timescaledb.compress_orderby` | TEXT | Descending order on the time column in `table_name`. | ✖ | Set the order used by compression. Specified in the same way as the `ORDER BY` clause in a `SELECT` query. | | `timescaledb.segmentby` | TEXT | No segementation by column. | ✖ | Since [TimescaleDB v2.18.0](https://github.com/timescale/timescaledb/releases/tag/2.18.0) Set the list of columns used to segment data in the columnstore for `table`. An identifier representing the source of the data such as `device_id` or `tags_id` is usually a good candidate. | | `timescaledb.compress_segmentby` | TEXT | No segementation by column. | ✖ | Set the list of columns used to segment the compressed data. An identifier representing the source of the data such as `device_id` or `tags_id` is usually a good candidate. | | `column_name` | TEXT | - | ✖ | Set the name of the column to order by or segment by. | | `timescaledb.compress_chunk_time_interval` | TEXT | - | ✖ | Reduce the total number of compressed/columnstore chunks for `table`. If you set `compress_chunk_time_interval`, compressed/columnstore chunks are merged with the previous adjacent chunk within `chunk_time_interval` whenever possible. These chunks are irreversibly merged. If you call to [decompress][decompress]/[convert_to_rowstore][convert_to_rowstore], merged chunks are not split up. You can call `compress_chunk_time_interval` independently of other compression settings; `timescaledb.compress`/`timescaledb.enable_columnstore` is not required. | | `timescaledb.enable_cagg_window_functions` | BOOLEAN | `false` | ✖ | EXPERIMENTAL: enable window functions on continuous aggregates. Support is experimental, as there is a risk of data inconsistency. For example, in backfill scenarios, buckets could be missed. | | `timescaledb.chunk_interval` (formerly `timescaledb.chunk_time_interval`) | INTERVAL | 10x the original hypertable. | ✖ | Set the chunk interval. Renamed in TimescaleDB V2.20. | ===== PAGE: https://docs.tigerdata.com/api/continuous-aggregates/cagg_migrate/ ===== # cagg_migrate() Migrate a continuous aggregate from the old format to the new format introduced in TimescaleDB 2.7.sql CALL cagg_migrate (
cagg REGCLASS, override BOOLEAN DEFAULT FALSE, drop_old BOOLEAN DEFAULT FALSE);
TimescaleDB 2.7 introduced a new format for continuous aggregates that improves performance. It also makes continuous aggregates compatible with more types of SQL queries. The new format, also called the finalized format, stores the continuous aggregate data exactly as it appears in the final view. The old format, also called the partial format, stores the data in a partially aggregated state. Use this procedure to migrate continuous aggregates from the old format to the new format. For more information, see the [migration how-to guide][how-to-migrate]. There are known issues with `cagg_migrate()` in version TimescaleDB 2.8.0. Upgrade to version 2.8.1 or above before using it. ## Required arguments |Name|Type|Description| |-|-|-| |`cagg`|`REGCLASS`|The continuous aggregate to migrate| ## Optional arguments |Name|Type|Description| |-|-|-| |`override`|`BOOLEAN`|If false, the old continuous aggregate keeps its name. The new continuous aggregate is named `<OLD_CONTINUOUS_AGGREGATE_NAME>_new`. If true, the new continuous aggregate gets the old name. The old continuous aggregate is renamed `<OLD_CONTINUOUS_AGGREGATE_NAME>_old`. Defaults to `false`.| |`drop_old`|`BOOLEAN`|If true, the old continuous aggregate is deleted. Must be used together with `override`. Defaults to `false`.| ===== PAGE: https://docs.tigerdata.com/api/continuous-aggregates/drop_materialized_view/ ===== # DROP MATERIALIZED VIEW (Continuous Aggregate) Continuous aggregate views can be dropped using the `DROP MATERIALIZED VIEW` statement. This statement deletes the continuous aggregate and all its internal objects. It also removes refresh policies for that aggregate. To delete other dependent objects, such as a view defined on the continuous aggregate, add the `CASCADE` option. Dropping a continuous aggregate does not affect the data in the underlying hypertable from which the continuous aggregate is derived.sql DROP MATERIALIZED VIEW ;
## Samples Drop existing continuous aggregate.sql DROP MATERIALIZED VIEW contagg_view;
## Parameters |Name|Type|Description| |---|---|---| | `<view_name>` | TEXT | Name (optionally schema-qualified) of continuous aggregate view to be dropped.| ===== PAGE: https://docs.tigerdata.com/api/continuous-aggregates/remove_all_policies/ ===== # remove_all_policies() <!-- markdownlint-disable-next-line line-length --> Remove all policies from a continuous aggregate. The removed columnstore and retention policies apply to the continuous aggregate, _not_ to the original hypertable.sql timescaledb_experimental.remove_all_policies(
relation REGCLASS, if_exists BOOL = false) RETURNS BOOL
Experimental features could have bugs. They might not be backwards compatible, and could be removed in future releases. Use these features at your own risk, and do not use any experimental features in production. ## Samples Remove all policies from a continuous aggregate named `example_continuous_aggregate`. This includes refresh policies, columnstore policies, and data retention policies. It doesn't include custom jobs:sql SELECT timescaledb_experimental.remove_all_policies('example_continuous_aggregate');
## Required arguments |Name|Type|Description| |-|-|-| |`relation`|`REGCLASS`|The continuous aggregate to remove all policies from| ## Optional arguments |Name|Type|Description| |-|-|-| |`if_exists`|`BOOL`|When true, prints a warning instead of erroring if any policies are missing. Defaults to false.| ## Returns Returns true if successful. ===== PAGE: https://docs.tigerdata.com/api/continuous-aggregates/hypertable_detailed_size/ ===== # hypertable_detailed_size() # hypertable_detailed_size() Get detailed information about disk space used by a hypertable or continuous aggregate, returning size information for the table itself, any indexes on the table, any toast tables, and the total size of all. All sizes are reported in bytes. If the function is executed on a distributed hypertable, it returns size information as a separate row per node, including the access node. When a continuous aggregate name is provided, the function transparently looks up the backing hypertable and returns its statistics instead. For more information about using hypertables, including chunk size partitioning, see the [hypertable section][hypertable-docs]. ## Samples Get the size information for a hypertable.sql -- disttable is a distributed hypertable -- SELECT * FROM hypertable_detailed_size('disttable') ORDER BY node_name;
table_bytes | index_bytes | toast_bytes | total_bytes | node_name -------------+-------------+-------------+-------------+-------------
16384 | 40960 | 0 | 57344 | data_node_1 8192 | 24576 | 0 | 32768 | data_node_2 0 | 8192 | 0 | 8192 |The access node is listed without a user-given node name. Normally, the access node holds no data, but still maintains, for example, index information that occupies a small amount of disk space. ## Required arguments |Name|Type|Description| |---|---|---| | `hypertable` | REGCLASS | Hypertable or continuous aggregate to show detailed size of. | ## Returns |Column|Type|Description| |-|-|-| |table_bytes|BIGINT|Disk space used by main_table (like `pg_relation_size(main_table)`)| |index_bytes|BIGINT|Disk space used by indexes| |toast_bytes|BIGINT|Disk space of toast tables| |total_bytes|BIGINT|Total disk space used by the specified table, including all indexes and TOAST data| |node_name|TEXT|For distributed hypertables, this is the user-given name of the node for which the size is reported. `NULL` is returned for the access node and non-distributed hypertables.| If executed on a relation that is not a hypertable, the function returns `NULL`. ===== PAGE: https://docs.tigerdata.com/api/continuous-aggregates/show_policies/ ===== # show_policies() <!-- markdownlint-disable-next-line line-length --> Show all policies that are currently set on a continuous aggregate.sql timescaledb_experimental.show_policies(
relation REGCLASS) RETURNS SETOF JSONB
Experimental features could have bugs. They might not be backwards compatible, and could be removed in future releases. Use these features at your own risk, and do not use any experimental features in production. ## Samples Given a continuous aggregate named `example_continuous_aggregate`, show all the policies set on it:sql SELECT timescaledb_experimental.show_policies('example_continuous_aggregate');
Example of returned data:bash
show_policies
{"policy_name": "policy_compression", "compress_after": 11, "compress_interval": "@ 1 day"} {"policy_name": "policy_refresh_continuous_aggregate", "refresh_interval": "@ 1 hour", "refresh_end_offset": 1, "refresh_start_offset": 10} {"drop_after": 20, "policy_name": "policy_retention", "retention_interval": "@ 1 day"}
## Required arguments |Name|Type|Description| |-|-|-| |`relation`|`REGCLASS`|The continuous aggregate to display policies for| ## Returns |Column|Type|Description| |-|-|-| |`show_policies`|`JSONB`|Details for each policy set on the continuous aggregate| ===== PAGE: https://docs.tigerdata.com/api/hypercore/alter_table/ ===== # ALTER TABLE (hypercore) Enable the columnstore or change the columnstore settings for a hypertable. The settings are applied on a per-chunk basis. You do not need to convert the entire hypertable back to the rowstore before changing the settings. The new settings apply only to the chunks that have not yet been converted to columnstore, the existing chunks in the columnstore do not change. This means that chunks with different columnstore settings can co-exist in the same hypertable. TimescaleDB calculates default columnstore settings for each chunk when it is created. These settings apply to each chunk, and not the entire hypertable. To explicitly disable the defaults, set a setting to an empty string. To remove the current configuration and re-enable the defaults, call `ALTER TABLE <your_table_name> RESET (<columnstore_setting>);`. After you have enabled the columnstore, either: - [add_columnstore_policy][add_columnstore_policy]: create a [job][job] that automatically moves chunks in a hypertable to the columnstore at a specific time interval. - [convert_to_columnstore][convert_to_columnstore]: manually add a specific chunk in a hypertable to the columnstore. Since [TimescaleDB v2.18.0](https://github.com/timescale/timescaledb/releases/tag/2.18.0) ## Samples To enable the columnstore: - **Configure a hypertable that ingests device data to use the columnstore**: In this example, the `metrics` hypertable is often queried about a specific device or set of devices. Segment the hypertable by `device_id` to improve query performance.sql
ALTER TABLE metrics SET( timescaledb.enable_columnstore, timescaledb.orderby = 'time DESC', timescaledb.segmentby = 'device_id');- **Specify the chunk interval without changing other columnstore settings**: - Set the time interval when chunks are added to the columnstore: ```sql ALTER TABLE metrics SET (timescaledb.compress_chunk_time_interval = '24 hours'); ``` - To disable the option you set previously, set the interval to 0: ```sql ALTER TABLE metrics SET (timescaledb.compress_chunk_time_interval = '0'); ``` ## Arguments The syntax is:sql ALTER TABLE SET (timescaledb.enable_columnstore, timescaledb.compress_orderby = ' [ASC | DESC] [ NULLS { FIRST | LAST } ] [, ...]', timescaledb.compress_segmentby = ' [, ...]', timescaledb.sparse_index = '(), ()' timescaledb.compress_chunk_time_interval='interval', SET ACCESS METHOD { new_access_method | DEFAULT }, ALTER SET NOT NULL, ADD CONSTRAINT UNIQUE (, ... ) );
| Name | Type | Default | Required | Description | |-------|---------|-----------------------------------------------------------------------------------------------------------------------------------------------------------------------------------------------------------------------------------|----------|--------------| | `table_name` | TEXT | - | ✖ | The hypertable to enable columstore for. | | `timescaledb.enable_columnstore` | BOOLEAN | `true` | ✖ | Set to `false` to disable columnstore. | | `timescaledb.compress_orderby` | TEXT | Descending order on the time column in `table_name`. | ✖ | The order in which items are used in the columnstore. Specified in the same way as an `ORDER BY` clause in a `SELECT` query. Setting `timescaledb.compress_orderby` automatically creates an implicit min/max sparse index on the `orderby` column. | | `timescaledb.compress_segmentby` | TEXT | TimescaleDB looks at [`pg_stats`](https://www.postgresql.org/docs/current/view-pg-stats.html) and determines an appropriate column based on the data cardinality and distribution. If `pg_stats` is not available, TimescaleDB looks for an appropriate column from the existing indexes. | ✖ | Set the list of columns used to segment data in the columnstore for `table`. An identifier representing the source of the data such as `device_id` or `tags_id` is usually a good candidate. | | `column_name` | TEXT | - | ✖ | The name of the column to `orderby` or `segmentby`. | |`timescaledb.sparse_index`| TEXT | TimescaleDB evaluates the columns you already have indexed, checks which data types are a good fit for sparse indexing, then creates a sparse index as an optimization. | ✖ | Configure the sparse indexes for compressed chunks. Requires setting `timescaledb.compress_orderby`. Supported index types include: <li> `bloom(<column_name>)`: a probabilistic index, effective for `=` filters. Cannot be applied to `timescaledb.compress_orderby` columns.</li> <li> `minmax(<column_name>)`: stores min/max values for each compressed chunk. Setting `timescaledb.compress_orderby` automatically creates an implicit min/max sparse index on the `orderby` column. </li> Define multiple indexes using a comma-separated list. You can set only one index per column. Set to an empty string to avoid using sparse indexes and explicitly disable the default behavior. To remove the current sparse index configuration and re-enable default sparse index selection, call `ALTER TABLE your_table_name RESET (timescaledb.sparse_index);`. | | `timescaledb.compress_chunk_time_interval` | TEXT | - | ✖ | EXPERIMENTAL: reduce the total number of chunks in the columnstore for `table`. If you set `compress_chunk_time_interval`, chunks added to the columnstore are merged with the previous adjacent chunk within `chunk_time_interval` whenever possible. These chunks are irreversibly merged. If you call [convert_to_rowstore][convert_to_rowstore], merged chunks are not split up. You can call `compress_chunk_time_interval` independently of other compression settings; `timescaledb.enable_columnstore` is not required. | | `interval` | TEXT | - | ✖ | Set to a multiple of the [chunk_time_interval][chunk_time_interval] for `table`. | | `ALTER` | TEXT | | ✖ | Set a specific column in the columnstore to be `NOT NULL`. | | `ADD CONSTRAINT` | TEXT | | ✖ | Add `UNIQUE` constraints to data in the columnstore. | ===== PAGE: https://docs.tigerdata.com/api/hypercore/chunk_columnstore_stats/ ===== # chunk_columnstore_stats() Retrieve statistics about the chunks in the columnstore `chunk_columnstore_stats` returns the size of chunks in the columnstore, these values are computed when you call either: - [add_columnstore_policy][add_columnstore_policy]: create a [job][job] that automatically moves chunks in a hypertable to the columnstore at a specific time interval. - [convert_to_columnstore][convert_to_columnstore]: manually add a specific chunk in a hypertable to the columnstore. Inserting into a chunk in the columnstore does not change the chunk size. For more information about how to compute chunk sizes, see [chunks_detailed_size][chunks_detailed_size]. Since [TimescaleDB v2.18.0](https://github.com/timescale/timescaledb/releases/tag/2.18.0) ## Samples To retrieve statistics about chunks: - **Show the status of the first two chunks in the `conditions` hypertable**:sql SELECT * FROM chunk_columnstore_stats('conditions')
ORDER BY chunk_name LIMIT 2;Returns:sql -[ RECORD 1 ]------------------+---------------------- chunk_schema | _timescaledb_internal chunk_name | _hyper_1_1_chunk compression_status | Uncompressed before_compression_table_bytes | before_compression_index_bytes | before_compression_toast_bytes | before_compression_total_bytes | after_compression_table_bytes | after_compression_index_bytes | after_compression_toast_bytes | after_compression_total_bytes | node_name | -[ RECORD 2 ]------------------+---------------------- chunk_schema | _timescaledb_internal chunk_name | _hyper_1_2_chunk compression_status | Compressed before_compression_table_bytes | 8192 before_compression_index_bytes | 32768 before_compression_toast_bytes | 0 before_compression_total_bytes | 40960 after_compression_table_bytes | 8192 after_compression_index_bytes | 32768 after_compression_toast_bytes | 8192 after_compression_total_bytes | 49152 node_name |
- **Use `pg_size_pretty` to return a more human friendly format**:sql SELECT pg_size_pretty(after_compression_total_bytes) AS total
FROM chunk_columnstore_stats('conditions') WHERE compression_status = 'Compressed';Returns:sql -[ RECORD 1 ]--+------ total | 48 kB
## Arguments | Name | Type | Default | Required | Description | |--|--|--|--|--| |`hypertable`|`REGCLASS`|-|✖| The name of a hypertable | ## Returns |Column|Type| Description | |-|-|------------------------------------------------------------------------------------------------------------------------------------------------------------------------------------------------------------------| |`chunk_schema`|TEXT| Schema name of the chunk. | |`chunk_name`|TEXT| Name of the chunk. | |`compression_status`|TEXT| Current compression status of the chunk. | |`before_compression_table_bytes`|BIGINT| Size of the heap before compression. Returns `NULL` if `compression_status` == `Uncompressed`. | |`before_compression_index_bytes`|BIGINT| Size of all the indexes before compression. Returns `NULL` if `compression_status` == `Uncompressed`. | |`before_compression_toast_bytes`|BIGINT| Size the TOAST table before compression. Returns `NULL` if `compression_status` == `Uncompressed`. | |`before_compression_total_bytes`|BIGINT| Size of the entire chunk table (`before_compression_table_bytes` + `before_compression_index_bytes` + `before_compression_toast_bytes`) before compression. Returns `NULL` if `compression_status` == `Uncompressed`.| |`after_compression_table_bytes`|BIGINT| Size of the heap after compression. Returns `NULL` if `compression_status` == `Uncompressed`. | |`after_compression_index_bytes`|BIGINT| Size of all the indexes after compression. Returns `NULL` if `compression_status` == `Uncompressed`. | |`after_compression_toast_bytes`|BIGINT| Size the TOAST table after compression. Returns `NULL` if `compression_status` == `Uncompressed`. | |`after_compression_total_bytes`|BIGINT| Size of the entire chunk table (`after_compression_table_bytes` + `after_compression_index_bytes `+ `after_compression_toast_bytes`) after compression. Returns `NULL` if `compression_status` == `Uncompressed`. | |`node_name`|TEXT| **DEPRECATED**: nodes the chunk is located on, applicable only to distributed hypertables. | ===== PAGE: https://docs.tigerdata.com/api/hypercore/convert_to_rowstore/ ===== # convert_to_rowstore() Manually convert a specific chunk in the hypertable columnstore to the rowstore. If you need to modify or add a lot of data to a chunk in the columnstore, best practice is to stop any [jobs][job] moving chunks to the columnstore, convert the chunk back to the rowstore, then modify the data. After the update, [convert the chunk to the columnstore][convert_to_columnstore] and restart the jobs. This workflow is especially useful if you need to backfill old data. Since [TimescaleDB v2.18.0](https://github.com/timescale/timescaledb/releases/tag/2.18.0) ## Samples To modify or add a lot of data to a chunk: 1. **Stop the jobs that are automatically adding chunks to the columnstore** Retrieve the list of jobs from the [timescaledb_information.jobs][informational-views] view to find the job you need to [alter_job][alter_job].sql SELECT alter_job(JOB_ID, scheduled => false);
1. **Convert a chunk to update back to the rowstore** ``` sql CALL convert_to_rowstore('_timescaledb_internal._hyper_2_2_chunk'); ``` 1. **Update the data in the chunk you added to the rowstore** Best practice is to structure your [INSERT][insert] statement to include appropriate partition key values, such as the timestamp. TimescaleDB adds the data to the correct chunk:sql INSERT INTO metrics (time, value) VALUES ('2025-01-01T00:00:00', 42);
1. **Convert the updated chunks back to the columnstore**sql CALL convert_to_columnstore('_timescaledb_internal._hyper_1_2_chunk');
1. **Restart the jobs that are automatically converting chunks to the columnstore**sql SELECT alter_job(JOB_ID, scheduled => true);
## Arguments | Name | Type | Default | Required | Description| |--|----------|---------|----------|-| |`chunk`| REGCLASS | - | ✖ | Name of the chunk to be moved to the rowstore. | |`if_compressed`| BOOLEAN | `true` | ✔ | Set to `false` so this job fails with an error rather than an warning if `chunk` is not in the columnstore | ===== PAGE: https://docs.tigerdata.com/api/hypercore/hypertable_columnstore_stats/ ===== # hypertable_columnstore_stats() Retrieve compression statistics for the columnstore. For more information about using hypertables, including chunk size partitioning, see [hypertables][hypertable-docs]. Since [TimescaleDB v2.18.0](https://github.com/timescale/timescaledb/releases/tag/2.18.0) ## Samples To retrieve compression statistics: - **Show the compression status of the `conditions` hypertable**:sql SELECT * FROM hypertable_columnstore_stats('conditions');
Returns:sql -[ RECORD 1 ]------------------+------ total_chunks | 4 number_compressed_chunks | 1 before_compression_table_bytes | 8192 before_compression_index_bytes | 32768 before_compression_toast_bytes | 0 before_compression_total_bytes | 40960 after_compression_table_bytes | 8192 after_compression_index_bytes | 32768 after_compression_toast_bytes | 8192 after_compression_total_bytes | 49152 node_name |
- **Use `pg_size_pretty` get the output in a more human friendly format**:sql SELECT pg_size_pretty(after_compression_total_bytes) as total
FROM hypertable_columnstore_stats('conditions');Returns:sql -[ RECORD 1 ]--+------ total | 48 kB
## Arguments |Name|Type|Description| |-|-|-| |`hypertable`|REGCLASS|Hypertable to show statistics for| ## Returns |Column|Type|Description| |-|-|-| |`total_chunks`|BIGINT|The number of chunks used by the hypertable. Returns `NULL` if `compression_status` == `Uncompressed`. | |`number_compressed_chunks`|INTEGER|The number of chunks used by the hypertable that are currently compressed. Returns `NULL` if `compression_status` == `Uncompressed`. | |`before_compression_table_bytes`|BIGINT|Size of the heap before compression. Returns `NULL` if `compression_status` == `Uncompressed`. | |`before_compression_index_bytes`|BIGINT|Size of all the indexes before compression. Returns `NULL` if `compression_status` == `Uncompressed`. | |`before_compression_toast_bytes`|BIGINT|Size the TOAST table before compression. Returns `NULL` if `compression_status` == `Uncompressed`. | |`before_compression_total_bytes`|BIGINT|Size of the entire table (`before_compression_table_bytes` + `before_compression_index_bytes` + `before_compression_toast_bytes`) before compression. Returns `NULL` if `compression_status` == `Uncompressed`.| |`after_compression_table_bytes`|BIGINT|Size of the heap after compression. Returns `NULL` if `compression_status` == `Uncompressed`. | |`after_compression_index_bytes`|BIGINT|Size of all the indexes after compression. Returns `NULL` if `compression_status` == `Uncompressed`. | |`after_compression_toast_bytes`|BIGINT|Size the TOAST table after compression. Returns `NULL` if `compression_status` == `Uncompressed`. | |`after_compression_total_bytes`|BIGINT|Size of the entire table (`after_compression_table_bytes` + `after_compression_index_bytes `+ `after_compression_toast_bytes`) after compression. Returns `NULL` if `compression_status` == `Uncompressed`. | |`node_name`|TEXT|nodes on which the hypertable is located, applicable only to distributed hypertables. Returns `NULL` if `compression_status` == `Uncompressed`. | ===== PAGE: https://docs.tigerdata.com/api/hypercore/remove_columnstore_policy/ ===== # remove_columnstore_policy() Remove a columnstore policy from a hypertable or continuous aggregate. To restart automatic chunk migration to the columnstore, you need to call [add_columnstore_policy][add_columnstore_policy] again. Since [TimescaleDB v2.18.0](https://github.com/timescale/timescaledb/releases/tag/2.18.0) ## Samples You see the columnstore policies in the [informational views][informational-views]. - **Remove the columnstore policy from the `cpu` table**:sql CALL remove_columnstore_policy('cpu');
- **Remove the columnstore policy from the `cpu_weekly` continuous aggregate**:sql CALL remove_columnstore_policy('cpu_weekly');
## Arguments | Name | Type | Default | Required | Description | |--|--|--|--|-| |`hypertable`|REGCLASS|-|✔| Name of the hypertable or continuous aggregate to remove the policy from| | `if_exists` | BOOLEAN | `false` |✖| Set to `true` so this job fails with a warning rather than an error if a columnstore policy does not exist on `hypertable` | ===== PAGE: https://docs.tigerdata.com/api/hypercore/chunk_columnstore_settings/ ===== # timescaledb_information.chunk_columnstore_settings Retrieve the compression settings for each chunk in the columnstore. Since [TimescaleDB v2.18.0](https://github.com/timescale/timescaledb/releases/tag/2.18.0) ## Samples To retrieve information about settings: - **Show settings for all chunks in the columnstore**:sql SELECT * FROM timescaledb_information.chunk_columnstore_settings
Returns:sql hypertable | chunk | segmentby | orderby ------------+-------+-----------+--------- measurements | _timescaledb_internal._hyper_1_1_chunk| | "time" DESC
* **Find all chunk columnstore settings for a specific hypertable**:sql SELECT * FROM timescaledb_information.chunk_columnstore_settings WHERE hypertable::TEXT LIKE 'metrics';
Returns:sql hypertable | chunk | segmentby | orderby ------------+-------+-----------+--------- metrics | _timescaledb_internal._hyper_2_3_chunk | metric_id | "time"
## Returns | Name | Type | Description | |--|--|--|--|--| |`hypertable`|`REGCLASS`| The name of the hypertable in the columnstore. | |`chunk`|`REGCLASS`| The name of the chunk in the `hypertable`. | |`segmentby`|`TEXT`| The list of columns used to segment the `hypertable`. | |`orderby`|`TEXT`| The list of columns used to order the data in the `hypertable`, along with the ordering and `NULL` ordering information. | |`index`| `TEXT` | The sparse index details. | ===== PAGE: https://docs.tigerdata.com/api/hypercore/add_columnstore_policy/ ===== # add_columnstore_policy() Create a [job][job] that automatically moves chunks in a hypertable to the columnstore after a specific time interval. You enable the columnstore a hypertable or continuous aggregate before you create a columnstore policy. You do this by calling `CREATE TABLE` for hypertables and `ALTER MATERIALIZED VIEW` for continuous aggregates. When columnstore is enabled, [bloom filters][bloom-filters] are enabled by default, and every new chunk has a bloom index. If you converted chunks to columnstore using TimescaleDB v2.19.3 or below, to enable bloom filters on that data you have to convert those chunks to the rowstore, then convert them back to the columnstore. Bloom indexes are not retrofitted, meaning that the existing chunks need to be fully recompressed to have the bloom indexes present. Please check out the PR description for more in-depth explanations of how bloom filters in TimescaleDB work. To view the policies that you set or the policies that already exist, see [informational views][informational-views], to remove a policy, see [remove_columnstore_policy][remove_columnstore_policy]. A columnstore policy is applied on a per-chunk basis. If you remove an existing policy and then add a new one, the new policy applies only to the chunks that have not yet been converted to columnstore. The existing chunks in the columnstore remain unchanged. This means that chunks with different columnstore settings can co-exist in the same hypertable. Since [TimescaleDB v2.18.0](https://github.com/timescale/timescaledb/releases/tag/2.18.0) ## Samples To create a columnstore job: 1. **Enable columnstore** Create a [hypertable][hypertables-section] for your time-series data using [CREATE TABLE][hypertable-create-table]. For [efficient queries][secondary-indexes] on data in the columnstore, remember to `segmentby` the column you will use most often to filter your data. For example: * [Use `CREATE TABLE` for a hypertable][hypertable-create-table] ```sql CREATE TABLE crypto_ticks ( "time" TIMESTAMPTZ, symbol TEXT, price DOUBLE PRECISION, day_volume NUMERIC ) WITH ( tsdb.hypertable, tsdb.partition_column='time', tsdb.segmentby='symbol', tsdb.orderby='time DESC' ); ``` If you are self-hosting TimescaleDB v2.19.3 and below, create a [Postgres relational table][pg-create-table], then convert it using [create_hypertable][create_hypertable]. You then enable hypercore with a call to [ALTER TABLE][alter_table_hypercore]. * [Use `ALTER MATERIALIZED VIEW` for a continuous aggregate][compression_continuous-aggregate] ```sql ALTER MATERIALIZED VIEW assets_candlestick_daily set ( timescaledb.enable_columnstore = true, timescaledb.segmentby = 'symbol' ); ``` 1. **Add a policy to move chunks to the columnstore at a specific time interval** For example: * 60 days after the data was added to the table: ``` sql CALL add_columnstore_policy('crypto_ticks', after => INTERVAL '60d'); ``` * 3 months prior to the moment you run the query: ``` sql CALL add_columnstore_policy('crypto_ticks', created_before => INTERVAL '3 months'); ``` * With an integer-based time column: ``` sql CALL add_columnstore_policy('table_with_bigint_time', BIGINT '600000'); ``` * Older than eight weeks: ``` sql CALL add_columnstore_policy('cpu_weekly', INTERVAL '8 weeks'); ``` * Control the time your policy runs: When you use a policy with a fixed schedule, TimescaleDB uses the `initial_start` time to compute the next start time. When TimescaleDB finishes executing a policy, it picks the next available time on the schedule, skipping any candidate start times that have already passed. When you set the `next_start` time, it only changes the start time of the next immediate execution. It does not change the computation of the next scheduled execution after that next execution. To change the schedule so a policy starts at a specific time, you need to set `initial_start`. To change the next immediate execution, you need to set `next_start`. For example, to modify a policy to execute on a fixed schedule 15 minutes past the hour, and every hour, you need to set both `initial_start` and `next_start` using `alter_job`: ``` sql select * from alter_job(1000, fixed_schedule => true, initial_start => '2025-07-11 10:15:00', next_start => '2025-07-11 11:15:00'); ``` 1. **View the policies that you set or the policies that already exist**sql SELECT * FROM timescaledb_information.jobs WHERE proc_name='policy_compression';
See [timescaledb_information.jobs][informational-views]. ## Arguments Calls to `add_columnstore_policy` require either `after` or `created_before`, but cannot have both. <!-- vale Google.Acronyms = NO --> <!-- vale Vale.Spelling = NO --> | Name | Type | Default | Required | Description | |-------------------------------|--|------------------------------------------------------------------------------------------------------------------------------|----------|----------------------------------------------------------------------------------------------------------------------------------------------------------------------------------------------------------------------------------------------------------------------------------------------------------------------------------------------------------------------------------------------------------------------------------------------------------------------------| | `hypertable` |REGCLASS| - | ✔ | Name of the hypertable or continuous aggregate to run this [job][job] on. | | `after` |INTERVAL or INTEGER| - | ✖ | Add chunks containing data older than `now - {after}::interval` to the columnstore. <br/> Use an object type that matchs the time column type in `hypertable`: <ul><li><b><code>TIMESTAMP</code>, <code>TIMESTAMPTZ</code>, or <code>DATE</code></b>: use an <code>INTERVAL</code> type.</li><li><b> Integer-based timestamps </b>: set an integer type using the [integer_now_func][set_integer_now_func].</li></ul> `after` is mutually exclusive with `created_before`. | | `created_before` |INTERVAL| NULL | ✖ | Add chunks with a creation time of `now() - created_before` to the columnstore. <br/> `created_before` is <ul><li>Not supported for continuous aggregates.</li><li>Mutually exclusive with `after`.</li></ul> | | `schedule_interval` |INTERVAL| 12 hours when [chunk_time_interval][chunk_time_interval] >= `1 day` for `hypertable`. Otherwise `chunk_time_interval` / `2`. | ✖ | Set the interval between the finish time of the last execution of this policy and the next start. | | `initial_start` |TIMESTAMPTZ| The interval from the finish time of the last execution to the [next_start][next-start]. | ✖ | Set the time this job is first run. This is also the time that `next_start` is calculated from. | | `next_start` |TIMESTAMPTZ| -| ✖ | Set the start time of the next immediate execution. It does not change the computation of the next scheduled time after the next execution. | | `timezone` |TEXT| UTC. However, daylight savings time(DST) changes may shift this alignment. | ✖ | Set to a valid time zone to mitigate DST shifting. If `initial_start` is set, subsequent executions of this policy are aligned on `initial_start`. | | `if_not_exists` |BOOLEAN| `false` | ✖ | Set to `true` so this job fails with a warning rather than an error if a columnstore policy already exists on `hypertable` | <!-- vale Google.Acronyms = YES --> <!-- vale Vale.Spelling = YES --> ===== PAGE: https://docs.tigerdata.com/api/hypercore/hypertable_columnstore_settings/ ===== # timescaledb_information.hypertable_columnstore_settings Retrieve information about the settings for all hypertables in the columnstore. Since [TimescaleDB v2.18.0](https://github.com/timescale/timescaledb/releases/tag/2.18.0) ## Samples To retrieve information about settings: - **Show columnstore settings for all hypertables**:sql SELECT * FROM timescaledb_information.hypertable_columnstore_settings;
Returns:sql hypertable | measurements segmentby | orderby | "time" DESC compress_interval_length |
- **Retrieve columnstore settings for a specific hypertable**:sql SELECT * FROM timescaledb_information.hypertable_columnstore_settings WHERE hypertable::TEXT LIKE 'metrics';
Returns:sql hypertable | metrics segmentby | metric_id orderby | "time" compress_interval_length |
## Returns |Name|Type| Description | |-|-|-------------------------------------------------------------------------------------------| |`hypertable`|`REGCLASS`| A hypertable which has the [columnstore enabled][compression_alter-table].| |`segmentby`|`TEXT`| The list of columns used to segment data. | |`orderby`|`TEXT`| List of columns used to order the data, along with ordering and NULL ordering information. | |`compress_interval_length`|`TEXT`| Interval used for [rolling up chunks during compression][rollup-compression]. | |`index`| `TEXT` | The sparse index details. | ===== PAGE: https://docs.tigerdata.com/api/hypercore/convert_to_columnstore/ ===== # convert_to_columnstore() Manually convert a specific chunk in the hypertable rowstore to the columnstore. Although `convert_to_columnstore` gives you more fine-grained control, best practice is to use [`add_columnstore_policy`][add_columnstore_policy]. You can also add chunks to the columnstore at a specific time [running the job associated with your columnstore policy][run-job] manually. To move a chunk from the columnstore back to the rowstore, use [`convert_to_rowstore`][convert_to_rowstore]. Since [TimescaleDB v2.18.0](https://github.com/timescale/timescaledb/releases/tag/2.18.0) ## Samples To convert a single chunk to columnstore:sql CALL convert_to_columnstore('_timescaledb_internal._hyper_1_2_chunk');
## Arguments | Name | Type | Default | Required | Description | |----------------------|--|---------|--|----------------------------------------------------------------------------------------------------------------------------------------------------| | `chunk` | REGCLASS | - |✔| Name of the chunk to add to the columnstore. | | `if_not_columnstore` | BOOLEAN | `true` |✖| Set to `false` so this job fails with an error rather than a warning if `chunk` is already in the columnstore. | | `recompress` | BOOLEAN | `false` |✖| Set to `true` to add a chunk that had more data inserted after being added to the columnstore. | ## Returns Calls to `convert_to_columnstore` return: | Column | Type | Description | |-------------------|--------------------|----------------------------------------------------------------------------------------------------| | `chunk name` or `table` | REGCLASS or String | The name of the chunk added to the columnstore, or a table-like result set with zero or more rows. | ===== PAGE: https://docs.tigerdata.com/api/compression/decompress_chunk/ ===== # decompress_chunk() Old API since [TimescaleDB v2.18.0](https://github.com/timescale/timescaledb/releases/tag/2.18.0) Replaced by <a href="https://docs.tigerdata.com/api/latest/hypercore/convert_to_rowstore/">convert_to_rowstore()</a>. Before decompressing chunks, stop any compression policy on the hypertable you are decompressing. You can use `SELECT alter_job(JOB_ID, scheduled => false);` to prevent scheduled execution. ## Samples Decompress a single chunk:sql SELECT decompress_chunk('_timescaledb_internal._hyper_2_2_chunk');
Decompress all compressed chunks in a hypertable named `metrics`:sql SELECT decompress_chunk(c, true) FROM show_chunks('metrics') c;
## Required arguments |Name|Type|Description| |---|---|---| |`chunk_name`|`REGCLASS`|Name of the chunk to be decompressed.| ## Optional arguments |Name|Type|Description| |---|---|---| |`if_compressed`|`BOOLEAN`|Disabling this will make the function error out on chunks that are not compressed. Defaults to true.| ## Returns |Column|Type|Description| |---|---|---| |`decompress_chunk`|`REGCLASS`|Name of the chunk that was decompressed.| ===== PAGE: https://docs.tigerdata.com/api/compression/remove_compression_policy/ ===== # remove_compression_policy() Old API since [TimescaleDB v2.18.0](https://github.com/timescale/timescaledb/releases/tag/2.18.0) Replaced by <a href="https://docs.tigerdata.com/api/latest/hypercore/remove_columnstore_policy/">remove_columnstore_policy()</a>. If you need to remove the compression policy. To restart policy-based compression you need to add the policy again. To view the policies that already exist, see [informational views][informational-views]. ## Samples Remove the compression policy from the 'cpu' table:sql SELECT remove_compression_policy('cpu');
Remove the compression policy from the 'cpu_weekly' continuous aggregate:sql SELECT remove_compression_policy('cpu_weekly');
## Required arguments |Name|Type|Description| |-|-|-| |`hypertable`|REGCLASS|Name of the hypertable or continuous aggregate the policy should be removed from| ## Optional arguments |Name|Type|Description| |---|---|---| | `if_exists` | BOOLEAN | Setting to true causes the command to fail with a notice instead of an error if a compression policy does not exist on the hypertable. Defaults to false.| ===== PAGE: https://docs.tigerdata.com/api/compression/alter_table_compression/ ===== # ALTER TABLE (Compression) Old API since [TimescaleDB v2.18.0](https://github.com/timescale/timescaledb/releases/tag/2.18.0) Replaced by <a href="https://docs.tigerdata.com/api/latest/hypercore/alter_table/">ALTER TABLE (Hypercore)</a>. 'ALTER TABLE' statement is used to turn on compression and set compression options. By itself, this `ALTER` statement alone does not compress a hypertable. To do so, either create a compression policy using the [add_compression_policy][add_compression_policy] function or manually compress a specific hypertable chunk using the [compress_chunk][compress_chunk] function. The syntax is:sql ALTER TABLE SET (timescaledb.compress, timescaledb.compress_orderby = ' [ASC | DESC] [ NULLS { FIRST | LAST } ] [, ...]', timescaledb.compress_segmentby = ' [, ...]', timescaledb.compress_chunk_time_interval='interval' );
## Samples Configure a hypertable that ingests device data to use compression. Here, if the hypertable is often queried about a specific device or set of devices, the compression should be segmented using the `device_id` for greater performance.sql ALTER TABLE metrics SET (timescaledb.compress, timescaledb.compress_orderby = 'time DESC', timescaledb.compress_segmentby = 'device_id');
You can also specify compressed chunk interval without changing other compression settings:sql ALTER TABLE metrics SET (timescaledb.compress_chunk_time_interval = '24 hours');
To disable the previously set option, set the interval to 0:sql ALTER TABLE metrics SET (timescaledb.compress_chunk_time_interval = '0');
## Required arguments |Name|Type|Description| |-|-|-| |`timescaledb.compress`|BOOLEAN|Enable or disable compression| ## Optional arguments |Name|Type| Description | |-|-|-----------------------------------------------------------------------------------------------------------------------------------------------------------------------------------------------------------------------------------------------------------------------------------------------------------------------------------------------------------------------------------------------------------------------------------------------------------------------------------------------------------------| |`timescaledb.compress_orderby`|TEXT| Order used by compression, specified in the same way as the ORDER BY clause in a SELECT query. The default is the descending order of the hypertable's time column. | |`timescaledb.compress_segmentby`|TEXT| Column list on which to key the compressed segments. An identifier representing the source of the data such as `device_id` or `tags_id` is usually a good candidate. The default is no `segment by` columns. | |`timescaledb.compress_chunk_time_interval`|TEXT| EXPERIMENTAL: Set compressed chunk time interval used to roll chunks into. This parameter compresses every chunk, and then irreversibly merges it into a previous adjacent chunk if possible, to reduce the total number of chunks in the hypertable. Note that chunks will not be split up during decompression. It should be set to a multiple of the current chunk interval. This option can be changed independently of other compression settings and does not require the `timescaledb.compress` argument. | ## Parameters |Name|Type|Description| |-|-|-| |`table_name`|TEXT|Hypertable that supports compression| |`column_name`|TEXT|Column used to order by or segment by| |`interval`|TEXT|Time interval used to roll compressed chunks into| ===== PAGE: https://docs.tigerdata.com/api/compression/hypertable_compression_stats/ ===== # hypertable_compression_stats() Old API since [TimescaleDB v2.18.0](https://github.com/timescale/timescaledb/releases/tag/2.18.0) Replaced by <a href="https://docs.tigerdata.com/api/latest/hypercore/hypertable_columnstore_stats/">hypertable_columnstore_stats()</a>. Get statistics related to hypertable compression. All sizes are in bytes. For more information about using hypertables, including chunk size partitioning, see the [hypertable section][hypertable-docs]. For more information about compression, see the [compression section][compression-docs]. ## Samplessql SELECT * FROM hypertable_compression_stats('conditions');
-[ RECORD 1 ]------------------+------ total_chunks | 4 number_compressed_chunks | 1 before_compression_table_bytes | 8192 before_compression_index_bytes | 32768 before_compression_toast_bytes | 0 before_compression_total_bytes | 40960 after_compression_table_bytes | 8192 after_compression_index_bytes | 32768 after_compression_toast_bytes | 8192 after_compression_total_bytes | 49152 node_name |
Use `pg_size_pretty` get the output in a more human friendly format.sql SELECT pg_size_pretty(after_compression_total_bytes) as total FROM hypertable_compression_stats('conditions');
-[ RECORD 1 ]--+------ total | 48 kB
## Required arguments |Name|Type|Description| |-|-|-| |`hypertable`|REGCLASS|Hypertable to show statistics for| ## Returns |Column|Type|Description| |-|-|-| |`total_chunks`|BIGINT|The number of chunks used by the hypertable| |`number_compressed_chunks`|BIGINT|The number of chunks used by the hypertable that are currently compressed| |`before_compression_table_bytes`|BIGINT|Size of the heap before compression| |`before_compression_index_bytes`|BIGINT|Size of all the indexes before compression| |`before_compression_toast_bytes`|BIGINT|Size the TOAST table before compression| |`before_compression_total_bytes`|BIGINT|Size of the entire table (table+indexes+toast) before compression| |`after_compression_table_bytes`|BIGINT|Size of the heap after compression| |`after_compression_index_bytes`|BIGINT|Size of all the indexes after compression| |`after_compression_toast_bytes`|BIGINT|Size the TOAST table after compression| |`after_compression_total_bytes`|BIGINT|Size of the entire table (table+indexes+toast) after compression| |`node_name`|TEXT|nodes on which the hypertable is located, applicable only to distributed hypertables| Returns show `NULL` if the data is currently uncompressed. ===== PAGE: https://docs.tigerdata.com/api/compression/compress_chunk/ ===== # compress_chunk() Old API since [TimescaleDB v2.18.0](https://github.com/timescale/timescaledb/releases/tag/2.18.0) Replaced by <a href="https://docs.tigerdata.com/api/latest/hypercore/convert_to_columnstore/">convert_to_columnstore()</a>. The `compress_chunk` function is used for synchronous compression (or recompression, if necessary) of a specific chunk. This is most often used instead of the [`add_compression_policy`][add_compression_policy] function, when a user wants more control over the scheduling of compression. For most users, we suggest using the policy framework instead. You can also compress chunks by [running the job associated with your compression policy][run-job]. `compress_chunk` gives you more fine-grained control by allowing you to target a specific chunk that needs compressing. You can get a list of chunks belonging to a hypertable using the [`show_chunks` function](https://docs.tigerdata.com/api/latest/hypertable/show_chunks/). ## Samples Compress a single chunk.sql SELECT compress_chunk('_timescaledb_internal._hyper_1_2_chunk');
## Required arguments |Name|Type|Description| |---|---|---| | `chunk_name` | REGCLASS | Name of the chunk to be compressed| ## Optional arguments |Name|Type|Description| |---|---|---| | `if_not_compressed` | BOOLEAN | Disabling this will make the function error out on chunks that are already compressed. Defaults to true.| ## Returns |Column|Type|Description| |---|---|---| | `compress_chunk` | REGCLASS | Name of the chunk that was compressed| ===== PAGE: https://docs.tigerdata.com/api/compression/chunk_compression_stats/ ===== # chunk_compression_stats() Old API since [TimescaleDB v2.18.0](https://github.com/timescale/timescaledb/releases/tag/2.18.0) Replaced by <a href="https://docs.tigerdata.com/api/latest/hypercore/chunk_columnstore_stats/">chunk_columnstore_stats()</a>. Get chunk-specific statistics related to hypertable compression. All sizes are in bytes. This function shows the compressed size of chunks, computed when the `compress_chunk` is manually executed, or when a compression policy processes the chunk. An insert into a compressed chunk does not update the compressed sizes. For more information about how to compute chunk sizes, see the `chunks_detailed_size` section. ## Samplessql SELECT * FROM chunk_compression_stats('conditions') ORDER BY chunk_name LIMIT 2;
-[ RECORD 1 ]------------------+---------------------- chunk_schema | _timescaledb_internal chunk_name | _hyper_1_1_chunk compression_status | Uncompressed before_compression_table_bytes | before_compression_index_bytes | before_compression_toast_bytes | before_compression_total_bytes | after_compression_table_bytes | after_compression_index_bytes | after_compression_toast_bytes | after_compression_total_bytes | node_name | -[ RECORD 2 ]------------------+---------------------- chunk_schema | _timescaledb_internal chunk_name | _hyper_1_2_chunk compression_status | Compressed before_compression_table_bytes | 8192 before_compression_index_bytes | 32768 before_compression_toast_bytes | 0 before_compression_total_bytes | 40960 after_compression_table_bytes | 8192 after_compression_index_bytes | 32768 after_compression_toast_bytes | 8192 after_compression_total_bytes | 49152 node_name |
Use `pg_size_pretty` get the output in a more human friendly format.sql SELECT pg_size_pretty(after_compression_total_bytes) AS total FROM chunk_compression_stats('conditions') WHERE compression_status = 'Compressed';
-[ RECORD 1 ]--+------ total | 48 kB
## Required arguments |Name|Type|Description| |-|-|-| |`hypertable`|REGCLASS|Name of the hypertable| ## Returns |Column|Type|Description| |-|-|-| |`chunk_schema`|TEXT|Schema name of the chunk| |`chunk_name`|TEXT|Name of the chunk| |`compression_status`|TEXT|the current compression status of the chunk| |`before_compression_table_bytes`|BIGINT|Size of the heap before compression (NULL if currently uncompressed)| |`before_compression_index_bytes`|BIGINT|Size of all the indexes before compression (NULL if currently uncompressed)| |`before_compression_toast_bytes`|BIGINT|Size the TOAST table before compression (NULL if currently uncompressed)| |`before_compression_total_bytes`|BIGINT|Size of the entire chunk table (table+indexes+toast) before compression (NULL if currently uncompressed)| |`after_compression_table_bytes`|BIGINT|Size of the heap after compression (NULL if currently uncompressed)| |`after_compression_index_bytes`|BIGINT|Size of all the indexes after compression (NULL if currently uncompressed)| |`after_compression_toast_bytes`|BIGINT|Size the TOAST table after compression (NULL if currently uncompressed)| |`after_compression_total_bytes`|BIGINT|Size of the entire chunk table (table+indexes+toast) after compression (NULL if currently uncompressed)| |`node_name`|TEXT|nodes on which the chunk is located, applicable only to distributed hypertables| ===== PAGE: https://docs.tigerdata.com/api/compression/add_compression_policy/ ===== # add_compression_policy() Old API since [TimescaleDB v2.18.0](https://github.com/timescale/timescaledb/releases/tag/2.18.0) Replaced by <a href="https://docs.tigerdata.com/api/latest/hypercore/add_columnstore_policy/">add_columnstore_policy()</a>. Allows you to set a policy by which the system compresses a chunk automatically in the background after it reaches a given age. Compression policies can only be created on hypertables or continuous aggregates that already have compression enabled. To set `timescaledb.compress` and other configuration parameters for hypertables, use the [`ALTER TABLE`][compression_alter-table] command. To enable compression on continuous aggregates, use the [`ALTER MATERIALIZED VIEW`][compression_continuous-aggregate] command. To view the policies that you set or the policies that already exist, see [informational views][informational-views]. ## Samples Add a policy to compress chunks older than 60 days on the `cpu` hypertable.sql SELECT add_compression_policy('cpu', compress_after => INTERVAL '60d');
Add a policy to compress chunks created 3 months before on the 'cpu' hypertable.sql SELECT add_compression_policy('cpu', compress_created_before => INTERVAL '3 months');
Note above that when `compress_after` is used then the time data range present in the partitioning time column is used to select the target chunks. Whereas, when `compress_created_before` is used then the chunks which were created 3 months ago are selected. Add a compress chunks policy to a hypertable with an integer-based time column:sql SELECT add_compression_policy('table_with_bigint_time', BIGINT '600000');
Add a policy to compress chunks of a continuous aggregate called `cpu_weekly`, that are older than eight weeks:sql SELECT add_compression_policy('cpu_weekly', INTERVAL '8 weeks');
## Required arguments |Name|Type|Description| |-|-|-| |`hypertable`|REGCLASS|Name of the hypertable or continuous aggregate| |`compress_after`|INTERVAL or INTEGER|The age after which the policy job compresses chunks. `compress_after` is calculated relative to the current time, so chunks containing data older than `now - {compress_after}::interval` are compressed. This argument is mutually exclusive with `compress_created_before`.| |`compress_created_before`|INTERVAL|Chunks with creation time older than this cut-off point are compressed. The cut-off point is computed as `now() - compress_created_before`. Defaults to `NULL`. Not supported for continuous aggregates yet. This argument is mutually exclusive with `compress_after`. | The `compress_after` parameter should be specified differently depending on the type of the time column of the hypertable or continuous aggregate: * For hypertables with TIMESTAMP, TIMESTAMPTZ, and DATE time columns: the time interval should be an INTERVAL type. * For hypertables with integer-based timestamps: the time interval should be an integer type (this requires the [integer_now_func][set_integer_now_func] to be set). ## Optional arguments <!-- vale Google.Acronyms = NO --> <!-- vale Vale.Spelling = NO --> |Name|Type|Description| |-|-|-| |`schedule_interval`|INTERVAL|The interval between the finish time of the last execution and the next start. Defaults to 12 hours for hyper tables with a `chunk_interval` >= 1 day and `chunk_interval / 2` for all other hypertables.| |`initial_start`|TIMESTAMPTZ|Time the policy is first run. Defaults to NULL. If omitted, then the schedule interval is the interval from the finish time of the last execution to the next start. If provided, it serves as the origin with respect to which the next_start is calculated | |`timezone`|TEXT|A valid time zone. If `initial_start` is also specified, subsequent executions of the compression policy are aligned on its initial start. However, daylight savings time (DST) changes may shift this alignment. Set to a valid time zone if this is an issue you want to mitigate. If omitted, UTC bucketing is performed. Defaults to `NULL`.| |`if_not_exists`|BOOLEAN|Setting to `true` causes the command to fail with a warning instead of an error if a compression policy already exists on the hypertable. Defaults to false.| <!-- vale Google.Acronyms = YES --> <!-- vale Vale.Spelling = YES --> ===== PAGE: https://docs.tigerdata.com/api/compression/recompress_chunk/ ===== # recompress_chunk() Old API since [TimescaleDB v2.18.0](https://github.com/timescale/timescaledb/releases/tag/2.18.0) Replaced by <a href="https://docs.tigerdata.com/api/latest/hypercore/convert_to_columnstore/">convert_to_columnstore()</a>. Recompresses a compressed chunk that had more data inserted after compression.sql recompress_chunk(
chunk REGCLASS, if_not_compressed BOOLEAN = false)
You can also recompress chunks by [running the job associated with your compression policy][run-job]. `recompress_chunk` gives you more fine-grained control by allowing you to target a specific chunk. `recompress_chunk` is deprecated since TimescaleDB v2.14 and will be removed in the future. The procedure is now a wrapper which calls [`compress_chunk`](https://docs.tigerdata.com/api/latest/compression/compress_chunk/) instead of it. `recompress_chunk` is implemented as an SQL procedure and not a function. Call the procedure with `CALL`. Don't use a `SELECT` statement. `recompress_chunk` only works on chunks that have previously been compressed. To compress a chunk for the first time, use [`compress_chunk`](https://docs.tigerdata.com/api/latest/compression/compress_chunk/). ## Samples Recompress the chunk `timescaledb_internal._hyper_1_2_chunk`:sql CALL recompress_chunk('_timescaledb_internal._hyper_1_2_chunk');
## Required arguments |Name|Type|Description| |-|-|-| |`chunk`|`REGCLASS`|The chunk to be recompressed. Must include the schema, for example `_timescaledb_internal`, if it is not in the search path.| ## Optional arguments |Name|Type|Description| |-|-|-| |`if_not_compressed`|`BOOLEAN`|If `true`, prints a notice instead of erroring if the chunk is already compressed. Defaults to `false`.| ## Troubleshooting In TimescaleDB 2.6.0 and above, `recompress_chunk` is implemented as a procedure. Previously, it was implemented as a function. If you are upgrading to TimescaleDB 2.6.0 or above, the`recompress_chunk` function could cause an error. For example, trying to run `SELECT recompress_chunk(i.show_chunks, true) FROM...` gives the following error:sql ERROR: recompress_chunk(regclass, boolean) is a procedure
To fix the error, use `CALL` instead of `SELECT`. You might also need to write a procedure to replace the full functionality in your `SELECT` statement. For example:sql DO $$ DECLARE chunk regclass; BEGIN FOR chunk IN SELECT format('%I.%I', chunk_schema, chunk_name)::regclass FROM timescaledb_information.chunks WHERE is_compressed = true LOOP
RAISE NOTICE 'Recompressing %', chunk::text; CALL recompress_chunk(chunk, true);END LOOP; END $$;
===== PAGE: https://docs.tigerdata.com/api/_hyperfunctions/saturating_add_pos/ ===== # saturating_add_pos() ===== PAGE: https://docs.tigerdata.com/api/_hyperfunctions/saturating_multiply/ ===== # saturating_mul() ===== PAGE: https://docs.tigerdata.com/api/_hyperfunctions/downsampling-intro/ ===== Downsample your data to visualize trends while preserving fewer data points. Downsampling replaces a set of values with a much smaller set that is highly representative of the original data. This is particularly useful for graphing applications. ===== PAGE: https://docs.tigerdata.com/api/_hyperfunctions/saturating_sub/ ===== # saturating_sub() ===== PAGE: https://docs.tigerdata.com/api/_hyperfunctions/gp_lttb/ ===== # gp_lttb() ===== PAGE: https://docs.tigerdata.com/api/_hyperfunctions/saturating-math-intro/ ===== The saturating math hyperfunctions help you perform saturating math on integers. In saturating math, the final result is bounded. If the result of a normal mathematical operation exceeds either the minimum or maximum bound, the result of the corresponding saturating math operation is capped at the bound. For example, `2 + (-3) = -1`. But in a saturating math function with a lower bound of `0`, such as [`saturating_add_pos`](#saturating_add_pos), the result is `0`. You can use saturating math to make sure your results don't overflow the allowed range of integers, or to force a result to be greater than or equal to zero. ===== PAGE: https://docs.tigerdata.com/api/_hyperfunctions/lttb/ ===== # lttb() ===== PAGE: https://docs.tigerdata.com/api/_hyperfunctions/saturating_add/ ===== # saturating_add() ===== PAGE: https://docs.tigerdata.com/api/_hyperfunctions/asap_smooth/ ===== # asap_smooth() ===== PAGE: https://docs.tigerdata.com/api/_hyperfunctions/saturating_sub_pos/ ===== # saturating_sub_pos() ===== PAGE: https://docs.tigerdata.com/api/_hyperfunctions/state_agg/timeline_agg/ ===== # state_agg() ===== PAGE: https://docs.tigerdata.com/api/_hyperfunctions/state_agg/state_timeline/ ===== # state_timeline() ===== PAGE: https://docs.tigerdata.com/api/_hyperfunctions/state_agg/interpolated_state_timeline/ ===== # interpolated_state_timeline() ===== PAGE: https://docs.tigerdata.com/api/_hyperfunctions/state_agg/interpolated_duration_in/ ===== # interpolated_duration_in() ===== PAGE: https://docs.tigerdata.com/api/_hyperfunctions/state_agg/duration_in/ ===== # duration_in() ===== PAGE: https://docs.tigerdata.com/api/_hyperfunctions/state_agg/intro/ ===== Given a system or value that switches between discrete states, track transitions between the states. For example, you can use `state_agg` to create a state of state transitions, or to calculate the durations of states. `state_agg` extends the capabilities of [`compact_state_agg`][compact_state_agg]. `state_agg` is designed to work with a relatively small number of states. It might not perform well on datasets where states are mostly distinct between rows. Because `state_agg` tracks more information, it uses more memory than `compact_state_agg`. If you want to minimize memory use and don't need to query the timestamps of state transitions, consider using [`compact_state_agg`][compact_state_agg] instead. ===== PAGE: https://docs.tigerdata.com/api/_hyperfunctions/state_agg/into_values/ ===== # into_values() ===== PAGE: https://docs.tigerdata.com/api/_hyperfunctions/state_agg/rollup/ ===== # API Reference ===== PAGE: https://docs.tigerdata.com/api/_hyperfunctions/state_agg/state_at/ ===== # state_at() ===== PAGE: https://docs.tigerdata.com/api/_hyperfunctions/state_agg/interpolated_state_periods/ ===== # interpolated_state_periods() ===== PAGE: https://docs.tigerdata.com/api/_hyperfunctions/state_agg/state_periods/ ===== # state_periods() ===== PAGE: https://docs.tigerdata.com/api/_hyperfunctions/time_bucket_gapfill/interpolate/ ===== # interpolate() ===== PAGE: https://docs.tigerdata.com/api/_hyperfunctions/time_bucket_gapfill/time_bucket_gapfill/ ===== # time_bucket_gapfill() ===== PAGE: https://docs.tigerdata.com/api/_hyperfunctions/time_bucket_gapfill/intro/ ===== Aggregate data by time interval, while filling in gaps of missing data. `time_bucket_gapfill` works similarly to [`time_bucket`][time_bucket], but adds gapfilling capabilities. The other functions in this group must be used in the same query as `time_bucket_gapfill`. They control how missing values are treated. `time_bucket_gapfill` must be used as a top-level expression in a query or subquery. You cannot, for example, nest `time_bucket_gapfill` in another function (such as `round(time_bucket_gapfill(...))`), or cast the result of the gapfilling call. If you need to cast, you can use `time_bucket_gapfill` in a subquery, and let the outer query do the type cast. ===== PAGE: https://docs.tigerdata.com/api/_hyperfunctions/time_bucket_gapfill/locf/ ===== # locf() ===== PAGE: https://docs.tigerdata.com/api/_hyperfunctions/tdigest/tdigest/ ===== # tdigest() ===== PAGE: https://docs.tigerdata.com/api/_hyperfunctions/tdigest/mean/ ===== # mean() ===== PAGE: https://docs.tigerdata.com/api/_hyperfunctions/tdigest/approx_percentile/ ===== # approx_percentile() ===== PAGE: https://docs.tigerdata.com/api/_hyperfunctions/tdigest/num_vals/ ===== # num_vals() ===== PAGE: https://docs.tigerdata.com/api/_hyperfunctions/tdigest/intro/ ===== Estimate the value at a given percentile, or the percentile rank of a given value, using the t-digest algorithm. This estimation is more memory- and CPU-efficient than an exact calculation using Postgres's `percentile_cont` and `percentile_disc` functions. `tdigest` is one of two advanced percentile approximation aggregates provided in TimescaleDB Toolkit. It is a space-efficient aggregation, and it provides more accurate estimates at extreme quantiles than traditional methods. `tdigest` is somewhat dependent on input order. If `tdigest` is run on the same data arranged in different order, the results should be nearly equal, but they are unlikely to be exact. The other advanced percentile approximation aggregate is [`uddsketch`][uddsketch], which produces stable estimates within a guaranteed relative error. If you aren't sure which to use, try the default percentile estimation method, [`percentile_agg`][percentile_agg]. It uses the `uddsketch` algorithm with some sensible defaults. For more information about percentile approximation algorithms, see the [algorithms overview][algorithms]. ===== PAGE: https://docs.tigerdata.com/api/_hyperfunctions/tdigest/approx_percentile_rank/ ===== # approx_percentile_rank() ===== PAGE: https://docs.tigerdata.com/api/_hyperfunctions/tdigest/rollup/ ===== # rollup() ===== PAGE: https://docs.tigerdata.com/api/_hyperfunctions/min_n_by/min_n_by/ ===== # API Reference ===== PAGE: https://docs.tigerdata.com/api/_hyperfunctions/min_n_by/intro/ ===== Get the N smallest values from a column, with an associated piece of data per value. For example, you can return an accompanying column, or the full row. The `min_n_by()` functions give the same results as the regular SQL query `SELECT ... ORDER BY ... LIMIT n`. But unlike the SQL query, they can be composed and combined like other aggregate hyperfunctions. To get the N largest values with accompanying data, use [`max_n_by()`][max_n_by]. To get the N smallest values without accompanying data, use [`min_n()`][min_n]. ===== PAGE: https://docs.tigerdata.com/api/_hyperfunctions/min_n_by/into_values/ ===== # into_values() ===== PAGE: https://docs.tigerdata.com/api/_hyperfunctions/min_n_by/rollup/ ===== # rollup() ===== PAGE: https://docs.tigerdata.com/api/_hyperfunctions/heartbeat_agg/live_ranges/ ===== # live_ranges() ===== PAGE: https://docs.tigerdata.com/api/_hyperfunctions/heartbeat_agg/interpolate/ ===== # interpolate() ===== PAGE: https://docs.tigerdata.com/api/_hyperfunctions/heartbeat_agg/downtime/ ===== # downtime() ===== PAGE: https://docs.tigerdata.com/api/_hyperfunctions/heartbeat_agg/interpolated_uptime/ ===== # interpolated_uptime() ===== PAGE: https://docs.tigerdata.com/api/_hyperfunctions/heartbeat_agg/uptime/ ===== # uptime() ===== PAGE: https://docs.tigerdata.com/api/_hyperfunctions/heartbeat_agg/num_gaps/ ===== # num_gaps() ===== PAGE: https://docs.tigerdata.com/api/_hyperfunctions/heartbeat_agg/trim_to/ ===== # trim_to() ===== PAGE: https://docs.tigerdata.com/api/_hyperfunctions/heartbeat_agg/intro/ ===== Given a series of timestamped heartbeats and a liveness interval, determine the overall liveness of a system. This aggregate can be used to report total uptime or downtime as well as report the time ranges where the system was live or dead. It's also possible to combine multiple heartbeat aggregates to determine the overall health of a service. For example, the heartbeat aggregates from a primary and standby server could be combined to see if there was ever a window where both machines were down at the same time. ===== PAGE: https://docs.tigerdata.com/api/_hyperfunctions/heartbeat_agg/dead_ranges/ ===== # dead_ranges() ===== PAGE: https://docs.tigerdata.com/api/_hyperfunctions/heartbeat_agg/live_at/ ===== # live_at() ===== PAGE: https://docs.tigerdata.com/api/_hyperfunctions/heartbeat_agg/heartbeat_agg/ ===== # heartbeat_agg() ===== PAGE: https://docs.tigerdata.com/api/_hyperfunctions/heartbeat_agg/rollup/ ===== # API Reference ===== PAGE: https://docs.tigerdata.com/api/_hyperfunctions/heartbeat_agg/num_live_ranges/ ===== # num_live_ranges() ===== PAGE: https://docs.tigerdata.com/api/_hyperfunctions/heartbeat_agg/interpolated_downtime/ ===== # interpolated_downtime() ===== PAGE: https://docs.tigerdata.com/api/_hyperfunctions/min_n/min_n/ ===== # min_n() ===== PAGE: https://docs.tigerdata.com/api/_hyperfunctions/min_n/intro/ ===== Get the N smallest values from a column. The `min_n()` functions give the same results as the regular SQL query `SELECT ... ORDER BY ... LIMIT n`. But unlike the SQL query, they can be composed and combined like other aggregate hyperfunctions. To get the N largest values, use [`max_n()`][max_n]. To get the N smallest values with accompanying data, use [`min_n_by()`][min_n_by]. ===== PAGE: https://docs.tigerdata.com/api/_hyperfunctions/min_n/into_array/ ===== # into_array() ===== PAGE: https://docs.tigerdata.com/api/_hyperfunctions/min_n/into_values/ ===== # into_values() ===== PAGE: https://docs.tigerdata.com/api/_hyperfunctions/min_n/rollup/ ===== # rollup() ===== PAGE: https://docs.tigerdata.com/api/_hyperfunctions/max_n_by/intro/ ===== Get the N largest values from a column, with an associated piece of data per value. For example, you can return an accompanying column, or the full row. The `max_n_by()` functions give the same results as the regular SQL query `SELECT ... ORDER BY ... LIMIT n`. But unlike the SQL query, they can be composed and combined like other aggregate hyperfunctions. To get the N smallest values with accompanying data, use [`min_n_by()`][min_n_by]. To get the N largest values without accompanying data, use [`max_n()`][max_n]. ===== PAGE: https://docs.tigerdata.com/api/_hyperfunctions/max_n_by/into_values/ ===== # into_values() ===== PAGE: https://docs.tigerdata.com/api/_hyperfunctions/max_n_by/rollup/ ===== # rollup() ===== PAGE: https://docs.tigerdata.com/api/_hyperfunctions/max_n_by/max_n_by/ ===== # API Reference ===== PAGE: https://docs.tigerdata.com/api/_hyperfunctions/stats_agg-one-variable/kurtosis/ ===== # kurtosis() ===== PAGE: https://docs.tigerdata.com/api/_hyperfunctions/stats_agg-one-variable/num_vals/ ===== # num_vals() ===== PAGE: https://docs.tigerdata.com/api/_hyperfunctions/stats_agg-one-variable/intro/ ===== Perform common statistical analyses, such as calculating averages and standard deviations, using this group of functions. These functions are similar to the [Postgres statistical aggregates][pg-stats-aggs], but they include more features and are easier to use in [continuous aggregates][caggs] and window functions. These functions work on one-dimensional data. To work with two-dimensional data, for example to perform linear regression, see [the two-dimensional `stats_agg` functions][stats_agg-2d]. ===== PAGE: https://docs.tigerdata.com/api/_hyperfunctions/stats_agg-one-variable/sum/ ===== # sum() ===== PAGE: https://docs.tigerdata.com/api/_hyperfunctions/stats_agg-one-variable/stats_agg/ ===== # stats_agg() (one variable) ===== PAGE: https://docs.tigerdata.com/api/_hyperfunctions/stats_agg-one-variable/average/ ===== # average() ===== PAGE: https://docs.tigerdata.com/api/_hyperfunctions/stats_agg-one-variable/stddev/ ===== # stddev() ===== PAGE: https://docs.tigerdata.com/api/_hyperfunctions/stats_agg-one-variable/rollup/ ===== # rollup() ===== PAGE: https://docs.tigerdata.com/api/_hyperfunctions/stats_agg-one-variable/skewness/ ===== # skewness() ===== PAGE: https://docs.tigerdata.com/api/_hyperfunctions/stats_agg-one-variable/rolling/ ===== # rolling() ===== PAGE: https://docs.tigerdata.com/api/_hyperfunctions/stats_agg-one-variable/variance/ ===== # variance() ===== PAGE: https://docs.tigerdata.com/api/_hyperfunctions/gauge_agg/delta/ ===== # delta() ===== PAGE: https://docs.tigerdata.com/api/_hyperfunctions/gauge_agg/idelta_left/ ===== # idelta_left() ===== PAGE: https://docs.tigerdata.com/api/_hyperfunctions/gauge_agg/intro/ ===== Analyze data coming from gauges. Unlike counters, gauges can decrease as well as increase. If your value can only increase, use [`counter_agg`][counter_agg] instead to appropriately account for resets. ===== PAGE: https://docs.tigerdata.com/api/_hyperfunctions/gauge_agg/irate_right/ ===== # irate_right() ===== PAGE: https://docs.tigerdata.com/api/_hyperfunctions/gauge_agg/extrapolated_delta/ ===== # extrapolated_delta() ===== PAGE: https://docs.tigerdata.com/api/_hyperfunctions/gauge_agg/interpolated_delta/ ===== # interpolated_delta() ===== PAGE: https://docs.tigerdata.com/api/_hyperfunctions/gauge_agg/irate_left/ ===== # irate_left() ===== PAGE: https://docs.tigerdata.com/api/_hyperfunctions/gauge_agg/num_changes/ ===== # num_changes() ===== PAGE: https://docs.tigerdata.com/api/_hyperfunctions/gauge_agg/interpolated_rate/ ===== # interpolated_rate() ===== PAGE: https://docs.tigerdata.com/api/_hyperfunctions/gauge_agg/intercept/ ===== # intercept() ===== PAGE: https://docs.tigerdata.com/api/_hyperfunctions/gauge_agg/extrapolated_rate/ ===== # extrapolated_rate() ===== PAGE: https://docs.tigerdata.com/api/_hyperfunctions/gauge_agg/rollup/ ===== # API Reference ===== PAGE: https://docs.tigerdata.com/api/_hyperfunctions/gauge_agg/gauge_zero_time/ ===== # gauge_zero_time() ===== PAGE: https://docs.tigerdata.com/api/_hyperfunctions/gauge_agg/corr/ ===== # corr() ===== PAGE: https://docs.tigerdata.com/api/_hyperfunctions/gauge_agg/idelta_right/ ===== # idelta_right() ===== PAGE: https://docs.tigerdata.com/api/_hyperfunctions/gauge_agg/gauge_agg/ ===== # gauge_agg() ===== PAGE: https://docs.tigerdata.com/api/_hyperfunctions/gauge_agg/rate/ ===== # rate() ===== PAGE: https://docs.tigerdata.com/api/_hyperfunctions/gauge_agg/with_bounds/ ===== # API Reference ===== PAGE: https://docs.tigerdata.com/api/_hyperfunctions/gauge_agg/time_delta/ ===== # time_delta() ===== PAGE: https://docs.tigerdata.com/api/_hyperfunctions/gauge_agg/slope/ ===== # slope() ===== PAGE: https://docs.tigerdata.com/api/_hyperfunctions/gauge_agg/num_elements/ ===== # num_elements() ===== PAGE: https://docs.tigerdata.com/api/_hyperfunctions/candlestick_agg/open/ ===== # open() ===== PAGE: https://docs.tigerdata.com/api/_hyperfunctions/candlestick_agg/low/ ===== # low() ===== PAGE: https://docs.tigerdata.com/api/_hyperfunctions/candlestick_agg/candlestick/ ===== # candlestick() ===== PAGE: https://docs.tigerdata.com/api/_hyperfunctions/candlestick_agg/volume/ ===== # volume() ===== PAGE: https://docs.tigerdata.com/api/_hyperfunctions/candlestick_agg/candlestick_agg/ ===== # candlestick_agg() ===== PAGE: https://docs.tigerdata.com/api/_hyperfunctions/candlestick_agg/low_time/ ===== # low_time() ===== PAGE: https://docs.tigerdata.com/api/_hyperfunctions/candlestick_agg/intro/ ===== Perform analysis of financial asset data. These specialized hyperfunctions make it easier to write financial analysis queries that involve candlestick data. They help you answer questions such as: * What are the opening and closing prices of these stocks? * When did the highest price occur for this stock? This function group uses the [two-step aggregation][two-step-aggregation] pattern. In addition to the usual aggregate function, [`candlestick_agg`][candlestick_agg], it also includes the pseudo-aggregate function `candlestick`. `candlestick_agg` produces a candlestick aggregate from raw tick data, which can then be used with the accessor and rollup functions in this group. `candlestick` takes pre-aggregated data and transforms it into the same format that `candlestick_agg` produces. This allows you to use the accessors and rollups with existing candlestick data. ===== PAGE: https://docs.tigerdata.com/api/_hyperfunctions/candlestick_agg/close_time/ ===== # close_time() ===== PAGE: https://docs.tigerdata.com/api/_hyperfunctions/candlestick_agg/close/ ===== # close() ===== PAGE: https://docs.tigerdata.com/api/_hyperfunctions/candlestick_agg/open_time/ ===== # open_time() ===== PAGE: https://docs.tigerdata.com/api/_hyperfunctions/candlestick_agg/vwap/ ===== # vwap() ===== PAGE: https://docs.tigerdata.com/api/_hyperfunctions/candlestick_agg/rollup/ ===== # API Reference ===== PAGE: https://docs.tigerdata.com/api/_hyperfunctions/candlestick_agg/high/ ===== # high() ===== PAGE: https://docs.tigerdata.com/api/_hyperfunctions/candlestick_agg/high_time/ ===== # high_time() ===== PAGE: https://docs.tigerdata.com/api/_hyperfunctions/count_min_sketch/approx_count/ ===== # approx_count() ===== PAGE: https://docs.tigerdata.com/api/_hyperfunctions/count_min_sketch/intro/ ===== Count the number of times a value appears in a column, using the probabilistic [`count-min sketch`][count-min-sketch] data structure and its associated algorithms. For applications where a small error rate is tolerable, this can result in huge savings in both CPU time and memory, especially for large datasets. ===== PAGE: https://docs.tigerdata.com/api/_hyperfunctions/count_min_sketch/count_min_sketch/ ===== # count_min_sketch() ===== PAGE: https://docs.tigerdata.com/api/_hyperfunctions/freq_agg/topn/ ===== # topn() ===== PAGE: https://docs.tigerdata.com/api/_hyperfunctions/freq_agg/intro/ ===== Get the most common elements of a set and their relative frequency. The estimation uses the [SpaceSaving][spacingsaving-algorithm] algorithm. This group of functions contains two aggregate functions, which let you set the cutoff for keeping track of a value in different ways. [`freq_agg`](#freq_agg) allows you to specify a minimum frequency, and [`mcv_agg`](#mcv_agg) allows you to specify the target number of values to keep. To estimate the absolute number of times a value appears, use [`count_min_sketch`][count_min_sketch]. ===== PAGE: https://docs.tigerdata.com/api/_hyperfunctions/freq_agg/min_frequency/ ===== # min_frequency() ===== PAGE: https://docs.tigerdata.com/api/_hyperfunctions/freq_agg/freq_agg/ ===== # freq_agg() ===== PAGE: https://docs.tigerdata.com/api/_hyperfunctions/freq_agg/max_frequency/ ===== # max_frequency() ===== PAGE: https://docs.tigerdata.com/api/_hyperfunctions/freq_agg/into_values/ ===== # into_values() ===== PAGE: https://docs.tigerdata.com/api/_hyperfunctions/freq_agg/rollup/ ===== # API Reference ===== PAGE: https://docs.tigerdata.com/api/_hyperfunctions/freq_agg/mcv_agg/ ===== # mcv_agg() ===== PAGE: https://docs.tigerdata.com/api/_hyperfunctions/compact_state_agg/interpolated_duration_in/ ===== # interpolated_duration_in() ===== PAGE: https://docs.tigerdata.com/api/_hyperfunctions/compact_state_agg/duration_in/ ===== # duration_in() ===== PAGE: https://docs.tigerdata.com/api/_hyperfunctions/compact_state_agg/intro/ ===== Given a system or value that switches between discrete states, aggregate the amount of time spent in each state. For example, you can use the `compact_state_agg` functions to track how much time a system spends in `error`, `running`, or `starting` states. `compact_state_agg` is designed to work with a relatively small number of states. It might not perform well on datasets where states are mostly distinct between rows. If you need to track when each state is entered and exited, use the [`state_agg`][state_agg] functions. If you need to track the liveness of a system based on a heartbeat signal, consider using the [`heartbeat_agg`][heartbeat_agg] functions. ===== PAGE: https://docs.tigerdata.com/api/_hyperfunctions/compact_state_agg/compact_state_agg/ ===== # compact_state_agg() ===== PAGE: https://docs.tigerdata.com/api/_hyperfunctions/compact_state_agg/into_values/ ===== # into_values() ===== PAGE: https://docs.tigerdata.com/api/_hyperfunctions/compact_state_agg/rollup/ ===== # API Reference ===== PAGE: https://docs.tigerdata.com/api/_hyperfunctions/hyperloglog/intro/ ===== Estimate the number of distinct values in a dataset. This is also known as cardinality estimation. For large datasets and datasets with high cardinality (many distinct values), this can be much more efficient in both CPU and memory than an exact count using `count(DISTINCT)`. The estimation uses the [`hyperloglog++`][hyperloglog] algorithm. If you aren't sure what parameters to set for the `hyperloglog`, try using the [`approx_count_distinct`][approx_count_distinct] aggregate, which sets some reasonable default values. ===== PAGE: https://docs.tigerdata.com/api/_hyperfunctions/hyperloglog/distinct_count/ ===== # distinct_count() ===== PAGE: https://docs.tigerdata.com/api/_hyperfunctions/hyperloglog/hyperloglog/ ===== # hyperloglog() ===== PAGE: https://docs.tigerdata.com/api/_hyperfunctions/hyperloglog/rollup/ ===== # rollup() ===== PAGE: https://docs.tigerdata.com/api/_hyperfunctions/hyperloglog/stderror/ ===== # stderror() ===== PAGE: https://docs.tigerdata.com/api/_hyperfunctions/hyperloglog/approx_count_distinct/ ===== # approx_count_distinct() ===== PAGE: https://docs.tigerdata.com/api/_hyperfunctions/max_n/max_n/ ===== # API Reference ===== PAGE: https://docs.tigerdata.com/api/_hyperfunctions/max_n/intro/ ===== Get the N largest values from a column. The `max_n()` functions give the same results as the regular SQL query `SELECT ... ORDER BY ... LIMIT n`. But unlike the SQL query, they can be composed and combined like other aggregate hyperfunctions. To get the N smallest values, use [`min_n()`][min_n]. To get the N largest values with accompanying data, use [`max_n_by()`][max_n_by]. ===== PAGE: https://docs.tigerdata.com/api/_hyperfunctions/max_n/into_array/ ===== # into_array() ===== PAGE: https://docs.tigerdata.com/api/_hyperfunctions/max_n/into_values/ ===== # into_values() ===== PAGE: https://docs.tigerdata.com/api/_hyperfunctions/max_n/rollup/ ===== # rollup() ===== PAGE: https://docs.tigerdata.com/api/_hyperfunctions/time_weight/interpolated_integral/ ===== # interpolated_integral() ===== PAGE: https://docs.tigerdata.com/api/_hyperfunctions/time_weight/first_time/ ===== # first_time() ===== PAGE: https://docs.tigerdata.com/api/_hyperfunctions/time_weight/intro/ ===== Calculate time-weighted summary statistics, such as averages (means) and integrals. Time weighting is used when data is unevenly sampled over time. In that case, a straight average gives misleading results, as it biases towards more frequently sampled values. For example, a sensor might silently spend long periods of time in a steady state, and send data only when a significant change occurs. The regular mean counts the steady-state reading as only a single point, whereas a time-weighted mean accounts for the long period of time spent in the steady state. In essence, the time-weighted mean takes an integral over time, then divides by the elapsed time. ===== PAGE: https://docs.tigerdata.com/api/_hyperfunctions/time_weight/last_val/ ===== # last_val() ===== PAGE: https://docs.tigerdata.com/api/_hyperfunctions/time_weight/interpolated_average/ ===== # interpolated_average() ===== PAGE: https://docs.tigerdata.com/api/_hyperfunctions/time_weight/average/ ===== # average() ===== PAGE: https://docs.tigerdata.com/api/_hyperfunctions/time_weight/rollup/ ===== # rollup() ===== PAGE: https://docs.tigerdata.com/api/_hyperfunctions/time_weight/first_val/ ===== # first_val() ===== PAGE: https://docs.tigerdata.com/api/_hyperfunctions/time_weight/time_weight/ ===== # time_weight() ===== PAGE: https://docs.tigerdata.com/api/_hyperfunctions/time_weight/integral/ ===== # integral() ===== PAGE: https://docs.tigerdata.com/api/_hyperfunctions/time_weight/last_time/ ===== # last_time() ===== PAGE: https://docs.tigerdata.com/api/_hyperfunctions/stats_agg-two-variables/sum_y_x/ ===== # sum_y() | sum_x() ===== PAGE: https://docs.tigerdata.com/api/_hyperfunctions/stats_agg-two-variables/kurtosis_y_x/ ===== # kurtosis_y() | kurtosis_x() ===== PAGE: https://docs.tigerdata.com/api/_hyperfunctions/stats_agg-two-variables/x_intercept/ ===== # x_intercept() ===== PAGE: https://docs.tigerdata.com/api/_hyperfunctions/stats_agg-two-variables/determination_coeff/ ===== # determination_coeff() ===== PAGE: https://docs.tigerdata.com/api/_hyperfunctions/stats_agg-two-variables/variance_y_x/ ===== # variance_y() | variance_x() ===== PAGE: https://docs.tigerdata.com/api/_hyperfunctions/stats_agg-two-variables/skewness_y_x/ ===== # skewness_y() | skewness_x() ===== PAGE: https://docs.tigerdata.com/api/_hyperfunctions/stats_agg-two-variables/num_vals/ ===== # num_vals() ===== PAGE: https://docs.tigerdata.com/api/_hyperfunctions/stats_agg-two-variables/intro/ ===== Perform linear regression analysis, for example to calculate correlation coefficient and covariance, on two-dimensional data. You can also calculate common statistics, such as average and standard deviation, on each dimension separately. These functions are similar to the [Postgres statistical aggregates][pg-stats-aggs], but they include more features and are easier to use in [continuous aggregates][caggs] and window functions. The linear regressions are based on the standard least-squares fitting method. These functions work on two-dimensional data. To work with one-dimensional data, for example to calculate the average and standard deviation of a single variable, see [the one-dimensional `stats_agg` functions][stats_agg-1d]. ===== PAGE: https://docs.tigerdata.com/api/_hyperfunctions/stats_agg-two-variables/stats_agg/ ===== # stats_agg() (two variables) ===== PAGE: https://docs.tigerdata.com/api/_hyperfunctions/stats_agg-two-variables/average_y_x/ ===== # average_y() | average_x() ===== PAGE: https://docs.tigerdata.com/api/_hyperfunctions/stats_agg-two-variables/intercept/ ===== # intercept() ===== PAGE: https://docs.tigerdata.com/api/_hyperfunctions/stats_agg-two-variables/rollup/ ===== # rollup() ===== PAGE: https://docs.tigerdata.com/api/_hyperfunctions/stats_agg-two-variables/stddev_y_x/ ===== # stddev_y() | stddev_x() ===== PAGE: https://docs.tigerdata.com/api/_hyperfunctions/stats_agg-two-variables/corr/ ===== # corr() ===== PAGE: https://docs.tigerdata.com/api/_hyperfunctions/stats_agg-two-variables/covariance/ ===== # covariance() ===== PAGE: https://docs.tigerdata.com/api/_hyperfunctions/stats_agg-two-variables/rolling/ ===== # rolling() ===== PAGE: https://docs.tigerdata.com/api/_hyperfunctions/stats_agg-two-variables/slope/ ===== # slope() ===== PAGE: https://docs.tigerdata.com/api/_hyperfunctions/uddsketch/uddsketch/ ===== # uddsketch() ===== PAGE: https://docs.tigerdata.com/api/_hyperfunctions/uddsketch/percentile_agg/ ===== # percentile_agg() ===== PAGE: https://docs.tigerdata.com/api/_hyperfunctions/uddsketch/mean/ ===== # mean() ===== PAGE: https://docs.tigerdata.com/api/_hyperfunctions/uddsketch/approx_percentile/ ===== # approx_percentile() ===== PAGE: https://docs.tigerdata.com/api/_hyperfunctions/uddsketch/num_vals/ ===== # num_vals() ===== PAGE: https://docs.tigerdata.com/api/_hyperfunctions/uddsketch/intro/ ===== Estimate the value at a given percentile, or the percentile rank of a given value, using the UddSketch algorithm. This estimation is more memory- and CPU-efficient than an exact calculation using Postgres's `percentile_cont` and `percentile_disc` functions. `uddsketch` is one of two advanced percentile approximation aggregates provided in TimescaleDB Toolkit. It produces stable estimates within a guaranteed relative error. The other advanced percentile approximation aggregate is [`tdigest`][tdigest], which is more accurate at extreme quantiles, but is somewhat dependent on input order. If you aren't sure which aggregate to use, try the default percentile estimation method, [`percentile_agg`][percentile_agg]. It uses the `uddsketch` algorithm with some sensible defaults. For more information about percentile approximation algorithms, see the [algorithms overview][algorithms]. ===== PAGE: https://docs.tigerdata.com/api/_hyperfunctions/uddsketch/approx_percentile_rank/ ===== # approx_percentile_rank() ===== PAGE: https://docs.tigerdata.com/api/_hyperfunctions/uddsketch/error/ ===== # error() ===== PAGE: https://docs.tigerdata.com/api/_hyperfunctions/uddsketch/rollup/ ===== # rollup() ===== PAGE: https://docs.tigerdata.com/api/_hyperfunctions/uddsketch/approx_percentile_array/ ===== # approx_percentile_array() ===== PAGE: https://docs.tigerdata.com/api/_hyperfunctions/counter_agg/delta/ ===== # delta() ===== PAGE: https://docs.tigerdata.com/api/_hyperfunctions/counter_agg/idelta_left/ ===== # idelta_left() ===== PAGE: https://docs.tigerdata.com/api/_hyperfunctions/counter_agg/first_time/ ===== # first_time() ===== PAGE: https://docs.tigerdata.com/api/_hyperfunctions/counter_agg/intro/ ===== Analyze data whose values are designed to monotonically increase, and where any decreases are treated as resets. The `counter_agg` functions simplify this task, which can be difficult to do in pure SQL. If it's possible for your readings to decrease as well as increase, use [`gauge_agg`][gauge_agg] instead. ===== PAGE: https://docs.tigerdata.com/api/_hyperfunctions/counter_agg/irate_right/ ===== # irate_right() ===== PAGE: https://docs.tigerdata.com/api/_hyperfunctions/counter_agg/last_val/ ===== # last_val() ===== PAGE: https://docs.tigerdata.com/api/_hyperfunctions/counter_agg/extrapolated_delta/ ===== # extrapolated_delta() ===== PAGE: https://docs.tigerdata.com/api/_hyperfunctions/counter_agg/interpolated_delta/ ===== # interpolated_delta() ===== PAGE: https://docs.tigerdata.com/api/_hyperfunctions/counter_agg/counter_zero_time/ ===== # counter_zero_time() ===== PAGE: https://docs.tigerdata.com/api/_hyperfunctions/counter_agg/irate_left/ ===== # irate_left() ===== PAGE: https://docs.tigerdata.com/api/_hyperfunctions/counter_agg/num_changes/ ===== # num_changes() ===== PAGE: https://docs.tigerdata.com/api/_hyperfunctions/counter_agg/interpolated_rate/ ===== # interpolated_rate() ===== PAGE: https://docs.tigerdata.com/api/_hyperfunctions/counter_agg/intercept/ ===== # intercept() ===== PAGE: https://docs.tigerdata.com/api/_hyperfunctions/counter_agg/extrapolated_rate/ ===== # extrapolated_rate() ===== PAGE: https://docs.tigerdata.com/api/_hyperfunctions/counter_agg/rollup/ ===== # API Reference ===== PAGE: https://docs.tigerdata.com/api/_hyperfunctions/counter_agg/corr/ ===== # corr() ===== PAGE: https://docs.tigerdata.com/api/_hyperfunctions/counter_agg/idelta_right/ ===== # idelta_right() ===== PAGE: https://docs.tigerdata.com/api/_hyperfunctions/counter_agg/first_val/ ===== # first_val() ===== PAGE: https://docs.tigerdata.com/api/_hyperfunctions/counter_agg/num_resets/ ===== # num_resets() ===== PAGE: https://docs.tigerdata.com/api/_hyperfunctions/counter_agg/last_time/ ===== # last_time() ===== PAGE: https://docs.tigerdata.com/api/_hyperfunctions/counter_agg/counter_agg/ ===== # counter_agg() ===== PAGE: https://docs.tigerdata.com/api/_hyperfunctions/counter_agg/rate/ ===== # rate() ===== PAGE: https://docs.tigerdata.com/api/_hyperfunctions/counter_agg/with_bounds/ ===== # API Reference ===== PAGE: https://docs.tigerdata.com/api/_hyperfunctions/counter_agg/time_delta/ ===== # time_delta() ===== PAGE: https://docs.tigerdata.com/api/_hyperfunctions/counter_agg/slope/ ===== # slope() ===== PAGE: https://docs.tigerdata.com/api/_hyperfunctions/counter_agg/num_elements/ ===== # num_elements() ===== PAGE: https://docs.tigerdata.com/migrate/dual-write-and-backfill/dual-write-from-timescaledb/ ===== # Migrate from TimescaleDB using dual-write and backfill This document provides detailed step-by-step instructions to migrate data using the [dual-write and backfill][dual-write-and-backfill] migration method from a source database which is using TimescaleDB to Tiger Cloud. In the context of migrations, your existing production database is referred to as the SOURCE database, the Tiger Cloud service that you are migrating your data to is the TARGET. In detail, the migration process consists of the following steps: 1. Set up a target Tiger Cloud service. 1. Modify the application to write to a secondary database. 1. Migrate schema and relational data from source to target. 1. Start the application in dual-write mode. 1. Determine the completion point `T`. 1. Backfill time-series data from source to target. 1. Enable background jobs (policies) in the target database. 1. Validate that all data is present in target database. 1. Validate that target database can handle production load. 1. Switch application to treat target database as primary (potentially continuing to write into source database, as a backup). If you get stuck, you can get help by either opening a support request, or take your issue to the `#migration` channel in the [community slack](https://slack.timescale.com/), where the developers of this migration method are there to help. You can open a support request directly from [Tiger Cloud Console][support-link], or by email to [support@tigerdata.com](mailto:support@tigerdata.com). ## 1. Set up a target database instance in Tiger Cloud [Create a Tiger Cloud service][create-service]. If you intend on migrating more than 400 GB, open a support request to ensure that enough disk is pre-provisioned on your Tiger Cloud service. You can open a support request directly from [Tiger Cloud Console][support-link], or by email to [support@tigerdata.com](mailto:support@tigerdata.com). ## 2. Modify the application to write to the target database How exactly to do this is dependent on the language that your application is written in, and on how exactly your ingestion and application function. In the simplest case, you simply execute two inserts in parallel. In the general case, you must think about how to handle the failure to write to either the source or target database, and what mechanism you want to or can build to recover from such a failure. Should your time-series data have foreign-key references into a plain table, you must ensure that your application correctly maintains the foreign key relations. If the referenced column is a `*SERIAL` type, the same row inserted into the source and target _may not_ obtain the same autogenerated id. If this happens, the data backfilled from the source to the target is internally inconsistent. In the best case it causes a foreign key violation, in the worst case, the foreign key constraint is maintained, but the data references the wrong foreign key. To avoid these issues, best practice is to follow [live migration]. You may also want to execute the same read queries on the source and target database to evaluate the correctness and performance of the results which the queries deliver. Bear in mind that the target database spends a certain amount of time without all data being present, so you should expect that the results are not the same for some period (potentially a number of days). ## 3. Set up schema and migrate relational data to target database This section leverages `pg_dumpall` and `pg_dump` to migrate the roles and relational schema that you are using in the source database to the target database. The PostgresSQL versions of the source and target databases can be of different versions, as long as the target version is greater than that of the source. The version of TimescaleDB used in both databases must be exactly the same. For the sake of convenience, connection strings to the source and target databases are referred to as `source` and `target` throughout this guide. This can be set in your shell, for example:bash export SOURCE="postgres://:@:/" export TARGET="postgres://:@:/"
### 3a. Dump the database roles from the source databasebash pg_dumpall -d "source" \ -l database name \ --quote-all-identifiers \ --roles-only \ --file=roles.sql
Tiger Cloud services do not support roles with superuser access. If your SQL dump includes roles that have such permissions, you'll need to modify the file to be compliant with the security model. You can use the following `sed` command to remove unsupported statements and permissions from your roles.sql file:bash sed -i -E \ -e '/CREATE ROLE "postgres";/d' \ -e '/ALTER ROLE "postgres"/d' \ -e '/CREATE ROLE "tsdbadmin";/d' \ -e '/ALTER ROLE "tsdbadmin"/d' \ -e 's/(NO)*SUPERUSER//g' \ -e 's/(NO)*REPLICATION//g' \ -e 's/(NO)BYPASSRLS//g' \ -e 's/GRANTED BY "[^"]"//g' \ roles.sql
This command works only with the GNU implementation of sed (sometimes referred to as gsed). For the BSD implementation (the default on macOS), you need to add an extra argument to change the `-i` flag to `-i ''`. To check the sed version, you can use the command `sed --version`. While the GNU version explicitly identifies itself as GNU, the BSD version of sed generally doesn't provide a straightforward --version flag and simply outputs an "illegal option" error. A brief explanation of this script is: - `CREATE ROLE "postgres"`; and `ALTER ROLE "postgres"`: These statements are removed because they require superuser access, which is not supported by Timescale. - `(NO)SUPERUSER` | `(NO)REPLICATION` | `(NO)BYPASSRLS`: These are permissions that require superuser access. - `GRANTED BY role_specification`: The GRANTED BY clause can also have permissions that require superuser access and should therefore be removed. Note: according to the TimescaleDB documentation, the GRANTOR in the GRANTED BY clause must be the current user, and this clause mainly serves the purpose of SQL compatibility. Therefore, it's safe to remove it. ### 3b. Dump all plain tables and the TimescaleDB catalog from the source databasebash pg_dump -d "source" \ --format=plain \ --quote-all-identifiers \ --no-tablespaces \ --no-owner \ --no-privileges \ --exclude-table-data='_timescaledb_internal.*' \ --file=dump.sql
- `--exclude-table-data='_timescaledb_internal.*'` dumps the structure of the hypertable chunks, but not the data. This creates empty chunks on the target, ready for the backfill process. - `--no-tablespaces` is required because Tiger Cloud does not support tablespaces other than the default. This is a known limitation. - `--no-owner` is required because Tiger Cloud's `tsdbadmin` user is not a superuser and cannot assign ownership in all cases. This flag means that everything is owned by the user used to connect to the target, regardless of ownership in the source. This is a known limitation. - `--no-privileges` is required because the `tsdbadmin` user for your Tiger Cloud service is not a superuser and cannot assign privileges in all cases. This flag means that privileges assigned to other users must be reassigned in the target database as a manual clean-up task. This is a known limitation. If the source database has the TimescaleDB extension installed in a schema other than "public" it causes issues on Tiger Cloud. Edit the dump file to remove any references to the non-public schema. The extension must be in the "public" schema on Tiger Cloud. This is a known limitation. ### 3c. Ensure that the correct TimescaleDB version is installed It is very important that the version of the TimescaleDB extension is the same in the source and target databases. This requires upgrading the TimescaleDB extension in the source database before migrating. You can determine the version of TimescaleDB in the target database with the following command:bash psql target -c "SELECT extversion FROM pg_extension WHERE extname = 'timescaledb';"
To update the TimescaleDB extension in your source database, first ensure that the desired version is installed from your package repository. Then you can upgrade the extension with the following query:bash psql source -c "ALTER EXTENSION timescaledb UPDATE TO '';"
For more information and guidance, consult the [Upgrade TimescaleDB] page. ### 3d. Load the roles and schema into the target database, and turn off all background jobsbash psql -X -d "target" \ -v ON_ERROR_STOP=1 \ --echo-errors \ -f roles.sql \ -c 'select public.timescaledb_pre_restore();' \ -f dump.sql \ -f - <<'EOF' begin; select public.timescaledb_post_restore();
-- disable all background jobs select public.alter_job(id::integer, scheduled=>false) from _timescaledb_config.bgw_job where id >= 1000 ; commit; EOF
Background jobs are turned off to prevent continuous aggregate refresh jobs from updating the continuous aggregate with incomplete/missing data. The continuous aggregates must be manually updated in the required range once the migration is complete. ## 4. Start application in dual-write mode With the target database set up, your application can now be started in dual-write mode. ## 5. Determine the completion point `T` After dual-writes have been executing for a while, the target hypertable contains data in three time ranges: missing writes, late-arriving data, and the "consistency" range <img class="main-content__illustration" width={1375} height={944} src="https://assets.timescale.com/docs/images/hypertable_backfill_consistency.png" alt="Hypertable dual-write ranges" /> ### Missing writes If the application is made up of multiple writers, and these writers did not all simultaneously start writing into the target hypertable, there is a period of time in which not all writes have made it into the target hypertable. This period starts when the first writer begins dual-writing, and ends when the last writer begins dual-writing. ### Late-arriving data Some applications have late-arriving data: measurements which have a timestamp in the past, but which weren't written yet (for example from devices which had intermittent connectivity issues). The window of late-arriving data is between the present moment, and the maximum lateness. ### Consistency range The consistency range is the range in which there are no missing writes, and in which all data has arrived, that is between the end of the missing writes range and the beginning of the late-arriving data range. The length of these ranges is defined by the properties of the application, there is no one-size-fits-all way to determine what they are. ### Completion point The completion point `T` is an arbitrarily chosen time in the consistency range. It is the point in time to which data can safely be backfilled, ensuring that there is no data loss. The completion point should be expressed as the type of the `time` column of the hypertables to be backfilled. For instance, if you're using a `TIMESTAMPTZ` `time` column, then the completion point may be `2023-08-10T12:00:00.00Z`. If you're using a `BIGINT` column it may be `1695036737000`. If you are using a mix of types for the `time` columns of your hypertables, you must determine the completion point for each type individually, and backfill each set of hypertables with the same type independently from those of other types. ## 6. Backfill data from source to target The simplest way to backfill from TimescaleDB, is to use the [timescaledb-backfill][timescaledb-backfill] backfill tool. It efficiently copies hypertables with the columnstore or compression enabled, and data stored in continuous aggregates from one database to another. `timescaledb-backfill` performs best when executed from a machine located close to the target database. The ideal scenario is an EC2 instance located in the same region as the Tiger Cloud service. Use a Linux-based distribution on x86_64. With the instance that will run the timescaledb-backfill ready, log in and download timescaledb-backfill:bash wget https://assets.timescale.com/releases/timescaledb-backfill-x86_64-linux.tar.gz tar xf timescaledb-backfill-x86_64-linux.tar.gz sudo mv timescaledb-backfill /usr/local/bin/
Running timescaledb-backfill is a four-phase process: 1. Stage: This step prepares metadata about the data to be copied in the target database. On completion, it outputs the number of chunks to be copied.bash timescaledb-backfill stage --source source --target target --until
1. Copy: This step copies data on a chunk-by-chunk basis from the source to the target. If it fails or is interrupted, it can safely be resumed. You should be aware of the `--parallelism` parameter, which dictates how many connections are used to copy data. The default is 8, which, depending on the size of your source and target databases, may be too high or too low. You should closely observe the performance of your source database and tune this parameter accordingly.bash timescaledb-backfill copy --source source --target target
1. Verify (optional): This step verifies that the data in the source and target is the same. It reads all the data on a chunk-by-chunk basis from both the source and target databases, so may also impact the performance of your source database.bash timescaledb-backfill verify --source source --target target
1. Clean: This step removes the metadata which was created in the target database by the `stage` command.bash timescaledb-backfill clean --target target
## 7. Enable background jobs in target database Before enabling the jobs, verify if any continuous aggregate refresh policies exist.bash psql -d target \ -c "select count(*) from _timescaledb_config.bgw_job where proc_name = 'policy_refresh_continuous_aggregate'"
If they do exist, refresh the continuous aggregates before re-enabling the jobs. The timescaledb-backfill tool provides a utility to do this:bash timescaledb-backfill refresh-caggs --source source --target target
Once the continuous aggregates are updated, you can re-enable all background jobs:bash psql -d target -f - <true) from _timescaledb_config.bgw_job where id >= 1000; EOF
If the backfill process took long enough for there to be significant retention/compression work to be done, it may be preferable to run the jobs manually to have control over the pacing of the work until it is caught up before re-enabling. ## 8. Validate that all data is present in target database Now that all data has been backfilled, and the application is writing data to both databases, the contents of both databases should be the same. How exactly this should best be validated is dependent on your application. If you are reading from both databases in parallel for every production query, you could consider adding an application-level validation that both databases are returning the same data. Another option is to compare the number of rows in the source and target tables, although this reads all data in the table which may have an impact on your production workload. `timescaledb-backfill`'s `verify` subcommand performs this check. Another option is to run `ANALYZE` on both the source and target tables and then look at the `reltuples` column of the `pg_class` table on a chunk-by-chunk basis. The result is not exact, but doesn't require reading all rows from the table. ## 9. Validate that target database can handle production load Now that dual-writes have been in place for a while, the target database should be holding up to production write traffic. Now would be the right time to determine if the target database can serve all production traffic (both reads _and_ writes). How exactly this is done is application-specific and up to you to determine. ## 10. Switch production workload to target database Once you've validated that all the data is present, and that the target database can handle the production workload, the final step is to switch to the target database as your primary. You may want to continue writing to the source database for a period, until you are certain that the target database is holding up to all production traffic. ===== PAGE: https://docs.tigerdata.com/migrate/dual-write-and-backfill/dual-write-from-other/ ===== # Migrate from non-Postgres using dual-write and backfill This document provides detailed step-by-step instructions to migrate data using the [dual-write and backfill][dual-write-and-backfill] migration method from a source database which is not using Postgres to Tiger Cloud. In the context of migrations, your existing production database is referred to as the SOURCE database, the Tiger Cloud service that you are migrating your data to is the TARGET. In detail, the migration process consists of the following steps: 1. Set up a target Tiger Cloud service. 1. Modify the application to write to a secondary database. 1. Set up schema and migrate relational data to target database. 1. Start the application in dual-write mode. 1. Determine the completion point `T`. 1. Backfill time-series data from source to target. 1. Enable background jobs (policies) in the target database. 1. Validate that all data is present in target database. 1. Validate that target database can handle production load. 1. Switch application to treat target database as primary (potentially continuing to write into source database, as a backup). If you get stuck, you can get help by either opening a support request, or take your issue to the `#migration` channel in the [community slack](https://slack.timescale.com/), where the developers of this migration method are there to help. You can open a support request directly from [Tiger Cloud Console][support-link], or by email to [support@tigerdata.com](mailto:support@tigerdata.com). ## 1. Set up a target database instance in Tiger Cloud [Create a Tiger Cloud service][create-service]. If you intend on migrating more than 400 GB, open a support request to ensure that enough disk is pre-provisioned on your Tiger Cloud service. You can open a support request directly from [Tiger Cloud Console][support-link], or by email to [support@tigerdata.com](mailto:support@tigerdata.com). ## 2. Modify the application to write to the target database How exactly to do this is dependent on the language that your application is written in, and on how exactly your ingestion and application function. In the simplest case, you simply execute two inserts in parallel. In the general case, you must think about how to handle the failure to write to either the source or target database, and what mechanism you want to or can build to recover from such a failure. Should your time-series data have foreign-key references into a plain table, you must ensure that your application correctly maintains the foreign key relations. If the referenced column is a `*SERIAL` type, the same row inserted into the source and target _may not_ obtain the same autogenerated id. If this happens, the data backfilled from the source to the target is internally inconsistent. In the best case it causes a foreign key violation, in the worst case, the foreign key constraint is maintained, but the data references the wrong foreign key. To avoid these issues, best practice is to follow [live migration]. You may also want to execute the same read queries on the source and target database to evaluate the correctness and performance of the results which the queries deliver. Bear in mind that the target database spends a certain amount of time without all data being present, so you should expect that the results are not the same for some period (potentially a number of days). ## 3. Set up schema and migrate relational data to target database Describing exactly how to migrate your data from every possible source is not feasible, instead we tell you what needs to be done, and hope that you find resources to support you. In this step, you need to prepare the database to receive time-series data which is dual-written from your application. If you're migrating from another time-series database then you only need to worry about setting up the schema for the hypertables which will contain time-series data. For some background on what hypertables are, consult the [tables and hypertables] section of the getting started guide. If you're migrating from a relational database containing both relational and time-series data, you also need to set up the schema for the relational data, and copy it over in this step, excluding any of the time-series data. The time-series data is backfilled in a subsequent step. Our assumption in the dual-write and backfill scenario is that the volume of relational data is either very small in relation to the time-series data, so that it is not problematic to briefly stop your production application while you copy the relational data, or that it changes infrequently, so you can get a snapshot of the relational metadata without stopping your application. If this is not the case for your application, you should reconsider using the dual-write and backfill method. If you're planning on experimenting with continuous aggregates, we recommend that you first complete the dual-write and backfill migration, and only then create continuous aggregates on the data. If you create continuous aggregates on a hypertable before backfilling data into it, you must refresh the continuous aggregate over the whole time range to ensure that there are no holes in the aggregated data. ## 4. Start application in dual-write mode With the target database set up, your application can now be started in dual-write mode. ## 5. Determine the completion point `T` After dual-writes have been executing for a while, the target hypertable contains data in three time ranges: missing writes, late-arriving data, and the "consistency" range <img class="main-content__illustration" width={1375} height={944} src="https://assets.timescale.com/docs/images/hypertable_backfill_consistency.png" alt="Hypertable dual-write ranges" /> ### Missing writes If the application is made up of multiple writers, and these writers did not all simultaneously start writing into the target hypertable, there is a period of time in which not all writes have made it into the target hypertable. This period starts when the first writer begins dual-writing, and ends when the last writer begins dual-writing. ### Late-arriving data Some applications have late-arriving data: measurements which have a timestamp in the past, but which weren't written yet (for example from devices which had intermittent connectivity issues). The window of late-arriving data is between the present moment, and the maximum lateness. ### Consistency range The consistency range is the range in which there are no missing writes, and in which all data has arrived, that is between the end of the missing writes range and the beginning of the late-arriving data range. The length of these ranges is defined by the properties of the application, there is no one-size-fits-all way to determine what they are. ### Completion point The completion point `T` is an arbitrarily chosen time in the consistency range. It is the point in time to which data can safely be backfilled, ensuring that there is no data loss. The completion point should be expressed as the type of the `time` column of the hypertables to be backfilled. For instance, if you're using a `TIMESTAMPTZ` `time` column, then the completion point may be `2023-08-10T12:00:00.00Z`. If you're using a `BIGINT` column it may be `1695036737000`. If you are using a mix of types for the `time` columns of your hypertables, you must determine the completion point for each type individually, and backfill each set of hypertables with the same type independently from those of other types. ## 6. Backfill data from source to target Dump the data from your source database on a per-table basis into CSV format, and restore those CSVs into the target database using the `timescaledb-parallel-copy` tool. ### 6a. Determine the time range of data to be copied Determine the window of data that to be copied from the source database to the target. Depending on the volume of data in the source table, it may be sensible to split the source table into multiple chunks of data to move independently. In the following steps, this time range is called `<start>` and `<end>`. Usually the `time` column is of type `timestamp with time zone`, so the values of `<start>` and `<end>` must be something like `2023-08-01T00:00:00Z`. If the `time` column is not a `timestamp with time zone` then the values of `<start>` and `<end>` must be the correct type for the column. If you intend to copy all historic data from the source table, then the value of `<start>` can be `'-infinity'`, and the `<end>` value is the value of the completion point `T` that you determined. ### 6b. Remove overlapping data in the target The dual-write process may have already written data into the target database in the time range that you want to move. In this case, the dual-written data must be removed. This can be achieved with a `DELETE` statement, as follows:bash psql target -c "DELETE FROM WHERE time >= AND time < );"
The BETWEEN operator is inclusive of both the start and end ranges, so it is not recommended to use it. ### 6d. Copy the data Refer to the documentation for your source database in order to determine how to dump a table into a CSV. You must ensure the CSV contains only data before the completion point. You should apply this filter when dumping the data from the source database. You can load a CSV file into a hypertable using `timescaledb-parallel-copy` as follows. Set the number of workers equal to the number of CPU cores in your target database:timescaledb-parallel-copy \ --connection target \ --table \ --workers 8 \ --file
The above command is not transactional. If there is a connection issue, or some other issue which causes it to stop copying, the partially copied rows must be removed from the target (using the instructions in step 6b above), and then the copy can be restarted. ### 6e. Enable policies that compress data in the target hypertable In the following command, replace `<hypertable>` with the fully qualified table name of the target hypertable, for example `public.metrics`:bash psql -d target -f -v hypertable= - <<'EOF' SELECT public.alter_job(j.id, scheduled=>true) FROM _timescaledb_config.bgw_job j JOIN _timescaledb_catalog.hypertable h ON h.id = j.hypertable_id WHERE j.proc_schema IN ('_timescaledb_internal', '_timescaledb_functions') AND j.proc_name = 'policy_compression' AND j.id >= 1000 AND format('%I.%I', h.schema_name, h.table_name)::text::regclass = :'hypertable'::text::regclass; EOF
## 7. Validate that all data is present in target database Now that all data has been backfilled, and the application is writing data to both databases, the contents of both databases should be the same. How exactly this should best be validated is dependent on your application. If you are reading from both databases in parallel for every production query, you could consider adding an application-level validation that both databases are returning the same data. Another option is to compare the number of rows in the source and target tables, although this reads all data in the table which may have an impact on your production workload. ## 8. Validate that target database can handle production load Now that dual-writes have been in place for a while, the target database should be holding up to production write traffic. Now would be the right time to determine if the target database can serve all production traffic (both reads _and_ writes). How exactly this is done is application-specific and up to you to determine. ## 9. Switch production workload to target database Once you've validated that all the data is present, and that the target database can handle the production workload, the final step is to switch to the target database as your primary. You may want to continue writing to the source database for a period, until you are certain that the target database is holding up to all production traffic. ===== PAGE: https://docs.tigerdata.com/migrate/dual-write-and-backfill/dual-write-from-postgres/ ===== # Migrate from Postgres using dual-write and backfill This document provides detailed step-by-step instructions to migrate data using the [dual-write and backfill][dual-write-and-backfill] migration method from a source database which is using Postgres to Tiger Cloud. In the context of migrations, your existing production database is referred to as the SOURCE database, the Tiger Cloud service that you are migrating your data to is the TARGET. In detail, the migration process consists of the following steps: 1. Set up a target Tiger Cloud service. 1. Modify the application to write to the target database. 1. Migrate schema and relational data from source to target. 1. Start the application in dual-write mode. 1. Determine the completion point `T`. 1. Backfill time-series data from source to target. 1. Validate that all data is present in target database. 1. Validate that target database can handle production load. 1. Switch application to treat target database as primary (potentially continuing to write into source database, as a backup). If you get stuck, you can get help by either opening a support request, or take your issue to the `#migration` channel in the [community slack](https://slack.timescale.com/), where the developers of this migration method are there to help. You can open a support request directly from [Tiger Cloud Console][support-link], or by email to [support@tigerdata.com](mailto:support@tigerdata.com). ## 1. Set up a target database instance in Tiger Cloud [Create a Tiger Cloud service][create-service]. If you intend on migrating more than 400 GB, open a support request to ensure that enough disk is pre-provisioned on your Tiger Cloud service. You can open a support request directly from [Tiger Cloud Console][support-link], or by email to [support@tigerdata.com](mailto:support@tigerdata.com). ## 2. Modify the application to write to the target database How exactly to do this is dependent on the language that your application is written in, and on how exactly your ingestion and application function. In the simplest case, you simply execute two inserts in parallel. In the general case, you must think about how to handle the failure to write to either the source or target database, and what mechanism you want to or can build to recover from such a failure. Should your time-series data have foreign-key references into a plain table, you must ensure that your application correctly maintains the foreign key relations. If the referenced column is a `*SERIAL` type, the same row inserted into the source and target _may not_ obtain the same autogenerated id. If this happens, the data backfilled from the source to the target is internally inconsistent. In the best case it causes a foreign key violation, in the worst case, the foreign key constraint is maintained, but the data references the wrong foreign key. To avoid these issues, best practice is to follow [live migration]. You may also want to execute the same read queries on the source and target database to evaluate the correctness and performance of the results which the queries deliver. Bear in mind that the target database spends a certain amount of time without all data being present, so you should expect that the results are not the same for some period (potentially a number of days). ## 3. Set up schema and migrate relational data to target database You would probably like to convert some of your large tables which contain time-series data into hypertables. This step consists of identifying those tables, excluding their data from the database dump, copying the database schema and tables, and setting up the time-series tables as hypertables. The data is backfilled into these hypertables in a subsequent step. For the sake of convenience, connection strings to the source and target databases are referred to as `source` and `target` throughout this guide. This can be set in your shell, for example:bash export SOURCE="postgres://:@:/" export TARGET="postgres://:@:/"
### 3a. Dump the database roles from the source databasebash pg_dumpall -d "source" \ -l database name \ --quote-all-identifiers \ --roles-only \ --file=roles.sql
Tiger Cloud services do not support roles with superuser access. If your SQL dump includes roles that have such permissions, you'll need to modify the file to be compliant with the security model. You can use the following `sed` command to remove unsupported statements and permissions from your roles.sql file:bash sed -i -E \ -e '/CREATE ROLE "postgres";/d' \ -e '/ALTER ROLE "postgres"/d' \ -e '/CREATE ROLE "tsdbadmin";/d' \ -e '/ALTER ROLE "tsdbadmin"/d' \ -e 's/(NO)*SUPERUSER//g' \ -e 's/(NO)*REPLICATION//g' \ -e 's/(NO)BYPASSRLS//g' \ -e 's/GRANTED BY "[^"]"//g' \ roles.sql
This command works only with the GNU implementation of sed (sometimes referred to as gsed). For the BSD implementation (the default on macOS), you need to add an extra argument to change the `-i` flag to `-i ''`. To check the sed version, you can use the command `sed --version`. While the GNU version explicitly identifies itself as GNU, the BSD version of sed generally doesn't provide a straightforward --version flag and simply outputs an "illegal option" error. A brief explanation of this script is: - `CREATE ROLE "postgres"`; and `ALTER ROLE "postgres"`: These statements are removed because they require superuser access, which is not supported by Timescale. - `(NO)SUPERUSER` | `(NO)REPLICATION` | `(NO)BYPASSRLS`: These are permissions that require superuser access. - `GRANTED BY role_specification`: The GRANTED BY clause can also have permissions that require superuser access and should therefore be removed. Note: according to the TimescaleDB documentation, the GRANTOR in the GRANTED BY clause must be the current user, and this clause mainly serves the purpose of SQL compatibility. Therefore, it's safe to remove it. ### 3b. Determine which tables to convert to hypertables Ideal candidates for hypertables are large tables containing [time-series data]. This is usually data with some form of timestamp value (`TIMESTAMPTZ`, `TIMESTAMP`, `BIGINT`, `INT` etc.) as the primary dimension, and some other measurement values. ### 3c. Dump all tables from the source database, excluding data from hypertable candidatespg_dump -d "source" \ --format=plain \ --quote-all-identifiers \ --no-tablespaces \ --no-owner \ --no-privileges \ --exclude-table-data= \ --file=dump.sql
- `--exclude-table-data` is used to exclude all data from hypertable candidates. You can either specify a table pattern, or specify `--exclude-table-data` multiple times, once for each table to be converted. - `--no-tablespaces` is required because Tiger Cloud does not support tablespaces other than the default. This is a known limitation. - `--no-owner` is required because Tiger Cloud's `tsdbadmin` user is not a superuser and cannot assign ownership in all cases. This flag means that everything is owned by the user used to connect to the target, regardless of ownership in the source. This is a known limitation. - `--no-privileges` is required because the `tsdbadmin` user for your Tiger Cloud service is not a superuser and cannot assign privileges in all cases. This flag means that privileges assigned to other users must be reassigned in the target database as a manual clean-up task. This is a known limitation. ### 3d. Load the roles and schema into the target databasepsql -X -d "target" \ -v ON_ERROR_STOP=1 \ --echo-errors \ -f roles.sql \ -f dump.sql
### 3e. Convert the plain tables to hypertables, optionally compress data in the columnstore For each table which should be converted to a hypertable in the target database, execute:sql SELECT create_hypertable('', by_range('
The `by_range` dimension builder is an addition to TimescaleDB 2.13. For simpler cases, like this one, you can also create the hypertable using the old syntax:sql SELECT create_hypertable('', '
For more information about the options which you can pass to `create_hypertable`, consult the [create_table API reference]. For more information about hypertables in general, consult the [hypertable documentation]. You may also wish to consider taking advantage of some of Tiger Cloud's killer features, such as: - [retention policies] to automatically drop unneeded data - [tiered storage] to automatically move data to Tiger Cloud's low-cost bottomless object storage tier - [hypercore] to reduce the size of your hypertables by compressing data in the columnstore - [continuous aggregates] to write blisteringly fast aggregate queries on your data ## 4. Start application in dual-write mode With the target database set up, your application can now be started in dual-write mode. ## 5. Determine the completion point `T` After dual-writes have been executing for a while, the target hypertable contains data in three time ranges: missing writes, late-arriving data, and the "consistency" range <img class="main-content__illustration" width={1375} height={944} src="https://assets.timescale.com/docs/images/hypertable_backfill_consistency.png" alt="Hypertable dual-write ranges" /> ### Missing writes If the application is made up of multiple writers, and these writers did not all simultaneously start writing into the target hypertable, there is a period of time in which not all writes have made it into the target hypertable. This period starts when the first writer begins dual-writing, and ends when the last writer begins dual-writing. ### Late-arriving data Some applications have late-arriving data: measurements which have a timestamp in the past, but which weren't written yet (for example from devices which had intermittent connectivity issues). The window of late-arriving data is between the present moment, and the maximum lateness. ### Consistency range The consistency range is the range in which there are no missing writes, and in which all data has arrived, that is between the end of the missing writes range and the beginning of the late-arriving data range. The length of these ranges is defined by the properties of the application, there is no one-size-fits-all way to determine what they are. ### Completion point The completion point `T` is an arbitrarily chosen time in the consistency range. It is the point in time to which data can safely be backfilled, ensuring that there is no data loss. The completion point should be expressed as the type of the `time` column of the hypertables to be backfilled. For instance, if you're using a `TIMESTAMPTZ` `time` column, then the completion point may be `2023-08-10T12:00:00.00Z`. If you're using a `BIGINT` column it may be `1695036737000`. If you are using a mix of types for the `time` columns of your hypertables, you must determine the completion point for each type individually, and backfill each set of hypertables with the same type independently from those of other types. ## 6. Backfill data from source to target Dump the data from your source database on a per-table basis into CSV format, and restore those CSVs into the target database using the `timescaledb-parallel-copy` tool. ### 6a. Determine the time range of data to be copied Determine the window of data that to be copied from the source database to the target. Depending on the volume of data in the source table, it may be sensible to split the source table into multiple chunks of data to move independently. In the following steps, this time range is called `<start>` and `<end>`. Usually the `time` column is of type `timestamp with time zone`, so the values of `<start>` and `<end>` must be something like `2023-08-01T00:00:00Z`. If the `time` column is not a `timestamp with time zone` then the values of `<start>` and `<end>` must be the correct type for the column. If you intend to copy all historic data from the source table, then the value of `<start>` can be `'-infinity'`, and the `<end>` value is the value of the completion point `T` that you determined. ### 6b. Remove overlapping data in the target The dual-write process may have already written data into the target database in the time range that you want to move. In this case, the dual-written data must be removed. This can be achieved with a `DELETE` statement, as follows:bash psql target -c "DELETE FROM WHERE time >= AND time < );"
The BETWEEN operator is inclusive of both the start and end ranges, so it is not recommended to use it. ### 6d. Copy the data with a streaming copy Execute the following command, replacing `<source table>` and `<hypertable>` with the fully qualified names of the source table and target hypertable respectively:bash psql source -f - <<EOF \copy (
SELECT * FROM <source table> WHERE time >= <start> AND time < <end> \ ) TO stdout WITH (format CSV);" | timescaledb-parallel-copy \--connection target \ --table \ --log-batches \ --batch-size=1000 \ --workers=4 EOF
The above command is not transactional. If there is a connection issue, or some other issue which causes it to stop copying, the partially copied rows must be removed from the target (using the instructions in step 6b above), and then the copy can be restarted. ### 6e. Enable policies that compress data in the target hypertable In the following command, replace `<hypertable>` with the fully qualified table name of the target hypertable, for example `public.metrics`:bash psql -d target -f -v hypertable= - <<'EOF' SELECT public.alter_job(j.id, scheduled=>true) FROM _timescaledb_config.bgw_job j JOIN _timescaledb_catalog.hypertable h ON h.id = j.hypertable_id WHERE j.proc_schema IN ('_timescaledb_internal', '_timescaledb_functions') AND j.proc_name = 'policy_compression' AND j.id >= 1000 AND format('%I.%I', h.schema_name, h.table_name)::text::regclass = :'hypertable'::text::regclass; EOF
## 7. Validate that all data is present in target database Now that all data has been backfilled, and the application is writing data to both databases, the contents of both databases should be the same. How exactly this should best be validated is dependent on your application. If you are reading from both databases in parallel for every production query, you could consider adding an application-level validation that both databases are returning the same data. Another option is to compare the number of rows in the source and target tables, although this reads all data in the table which may have an impact on your production workload. Another option is to run `ANALYZE` on both the source and target tables and then look at the `reltuples` column of the `pg_class` table. This is not exact, but doesn't require reading all rows from the table. Note: for hypertables, the reltuples value belongs to the chunk table, so you must take the sum of `reltuples` for all chunks belonging to the hypertable. If the chunk is compressed in one database, but not the other, then this check cannot be used. ## 8. Validate that target database can handle production load Now that dual-writes have been in place for a while, the target database should be holding up to production write traffic. Now would be the right time to determine if the target database can serve all production traffic (both reads _and_ writes). How exactly this is done is application-specific and up to you to determine. ## 9. Switch production workload to target database Once you've validated that all the data is present, and that the target database can handle the production workload, the final step is to switch to the target database as your primary. You may want to continue writing to the source database for a period, until you are certain that the target database is holding up to all production traffic. ===== PAGE: https://docs.tigerdata.com/migrate/dual-write-and-backfill/timescaledb-backfill/ ===== # Migrate with timescaledb-backfill Dual-write and backfill is a method to write from your application to two databases at once, and gives tooling and guidance to move your existing data from the one database to the other. It is specifically catered for, and relies on, your data being predominantly append-only time-series data. As such, it comes with some caveats and prerequisites which live migration does not (dual-write and backfill does not support executing `UPDATE` or `DELETE` statements on your data). Additionally, it requires you to make changes to the ingest pipeline of your application. The `timescaledb-backfill` tool is a command-line utility designed to support migrations from Tiger Cloud services by copying historic data from one database to another ("backfilling"). `timescaledb-backfill` efficiently copies hypertable and continuous aggregates chunks directly, without the need for intermediate storage, or converting chunks from the columnstore to the rowstore. It operates transactionally, ensuring data integrity throughout the migration process. It is designed to be used in the [dual-write and backfill][dual-write-backfill] migration procedure. ## Limitations - The tool only supports backfilling of hypertables. Schema migrations and non-hypertable migrations should be handled separately before using this tool. - The tool is optimized for append-only workloads. Other scenarios may not be fully supported. - To prevent continuous aggregates from refreshing with incomplete data, any refresh and retention policies targeting the tables that are going to be backfilled should be turned off. ## Installation The tool performs best when executed in an instance located close to the target database. The ideal scenario is an EC2 instance located in the same region as the Tiger Cloud service. Use a Linux-based distribution on x86_64. With the instance that will run the timescaledb-backfill ready, log in and download the tool's binary:sh wget https://assets.timescale.com/releases/timescaledb-backfill-x86_64-linux.tar.gz tar xf timescaledb-backfill-x86_64-linux.tar.gz sudo mv timescaledb-backfill /usr/local/bin/
## How to use The timescaledb-backfill tool offers four main commands: `stage`, `copy`, `verify` and `clean`. The workflow involves creating tasks, copying chunks, verifying data integrity and cleaning up the administrative schema after the migration. In the context of migrations, your existing production database is referred to as the SOURCE database, the Tiger Cloud service that you are migrating your data to is the TARGET. - **Stage Command:** is used to create copy tasks for hypertable chunks based on the specified completion point (`--until`). If a starting point (`--from`) is not specified, data will be copied from the beginning of time up to the completion point (`--until`). An optional filter (`--filter`) can be used to refine the hypertables and continuous aggregates targeted for staging.sh timescaledb-backfill stage --source source --target target --until '2016-01-02T00:00:00'
The tables to be included in the stage can be controlled by providing filtering options: `--filter`: this option accepts a POSIX regular expression to match schema-qualified hypertable names or continuous aggregate view names. Only hypertables and/or continuous aggregates matching the filter are staged. By default, the filter includes only the matching objects, and does not concern itself with dependencies between objects. Depending on what is intended, this could be problematic for continuous aggregates, as they form a dependency hierarchy. This behaviour can be modified through cascade options. For example, assuming a hierarchy of continuous aggregates for hourly, daily, and weekly rollups of data in an underlying hypertable called `raw_data` (all in the `public` schema). This could look as follows:raw_data -> hourly_agg -> daily_agg -> monthly_agg
If the filter `--filter='^public\.raw_data$'` is applied, then no data from the continuous aggregates is staged. If the filter `--filter='^public\.daily_agg$'` is applied, then only materialized data in the continuous aggregate `daily_agg` is staged. `--cascade-up`: when activated, this option ensures that any continuous aggregates which depend on the filtered object are included in the staging process. It is called "cascade up" because it cascades up the hierarchy. Using the example from before, if the filter `--filter='^public\.raw_data$' --cascade up` is applied, the data in `raw_data`, `hourly_agg`, `daily_agg`, and `monthly_agg` is staged. `--cascade-down`: when activated, this option ensures that any objects which the filtered object depends on are included in the staging process. It is called "cascade down" because it cascades down the hierarchy. Using the example from before, if the filter `--filter='^public\.daily_agg$' --cascade-down` is applied, the data in `daily_agg`, `hourly_agg`, and `raw_data` is staged. The `--cascade-up` and `--cascade-down` options can be combined. Using the example from before, if the filter `--filter='^public\.daily_agg$' --cascade-up --cascade-down` is applied, data in all objects in the example scenario is staged.sh timescaledb-backfill stage --source source --target target
--until '2016-01-02T00:00:00' \ --filter '^public\.daily_agg$' \ --cascade-up \ --cascade-down- **Copy Command:** processes the tasks created during the staging phase and copies the corresponding hypertable chunks to the target Tiger Cloud service.sh timescaledb-backfill copy --source source --target target
In addition to the `--source` and `--target` parameters, the `copy` command takes one optional parameter: `--parallelism` specifies the number of `COPY` jobs which will be run in parallel, the default is 8. It should ideally be set to the number of cores that the source and target database have, and is the most important parameter in dictating both how much load the source database experiences, and how quickly data is transferred from the source to the target database. - **Verify Command:** checks for discrepancies between the source and target chunks' data. It compares the results of the count for each chunk's table, as well as per-column count, max, min, and sum values (when applicable, depending on the column data type).sh timescaledb-backfill verify --source source --target target
In addition to the `--source` and `--target` parameters, the `verify` command takes one optional parameter: `--parallelism` specifies the number of verification jobs which will be run in parallel, the default is 8. It should ideally be set to the number of cores that the source and target database have, and is the most important parameter in dictating both how much load the source and target databases experience during verification, and how long it takes for verification to complete. - **Refresh Continuous Aggregates Command:** refreshes the continuous aggregates of the target system. It covers the period from the last refresh in the target to the last refresh in the source, solving the problem of continuous aggregates being outdated beyond the coverage of the refresh policies.sh timescaledb-backfill refresh-caggs --source source --target target
To refresh the continuous aggregates, the command executes the following SQL statement for all the matched continuous aggregates:sql CALL refresh_continuous_aggregate({CAGG NAME}, {TARGET_WATERMARK}, {SOURCE_WATERMARK})
The continuous aggregates to be refreshed can be controlled by providing filtering options: `--filter`: this option accepts a POSIX regular expression to match schema-qualified hypertable continuous aggregate view names. By default, the filter includes only the matching objects, and does not concern itself with dependencies between objects. Depending on what is intended, this could be problematic as continuous aggregates form a dependency hierarchy. This behaviour can be modified through cascade options. For example, assuming a hierarchy of continuous aggregates for hourly, daily, and weekly rollups of data in an underlying hypertable called `raw_data` (all in the `public` schema). This could look as follows:raw_data -> hourly_agg -> daily_agg -> monthly_agg
If the filter `--filter='^public\.daily_agg$'` is applied, only materialized data in the continuous aggregate `daily_agg` will be updated. However, this approach can lead to potential issues. For example, if `hourly_agg` is not up to date, then `daily_agg` won't be either, as it requires the missing data from `hourly_agg`. Additionally, it's important to remember to refresh `monthly_agg` at some point to ensure its data remains current. In both cases, relying solely on refresh policies may result in data gaps if the policy doesn't cover the entire required period. `--cascade-up`: when activated, this option ensures that any continuous aggregates which depend on the filtered object are refreshed. It is called "cascade up" because it cascades up the hierarchy. Using the example from before, if the filter `--filter='^public\.daily_agg$' --cascade up` is applied, the `hourly_agg`, `daily_agg`, and `monthly_agg` will be refreshed. `--cascade-down`: when activated, this option ensures that any continuous aggregates which the filtered object depends on are refreshed. It is called "cascade down" because it cascades down the hierarchy. Using the example from before, if the filter `--filter='^public\.daily_agg$' --cascade-down` is applied, the data in `daily_agg` and `hourly_agg` will be refreshed. The `--cascade-up` and `--cascade-down` options can be combined. Using the example from before, if the filter `--filter='^public\.daily_agg$' --cascade-up --cascade-down` is applied, then all the continuous aggregates will be refreshed. - **Clean Command:** removes the administrative schema (`__backfill`) that was used to store the tasks once the migration is completed successfully.sh timescaledb-backfill clean --target target
### Usage examples - Backfilling with a filter and until date:sh timescaledb-backfill stage --source $SOURCE_DB --target $TARGET_DB
--filter '.*\.my_table.*' \ --until '2016-01-02T00:00:00'timescaledb-backfill copy --source source --target target
timescaledb-backfill refresh-caggs --source source --target target
timescaledb-backfill verify --source source --target target
timescaledb-backfill clean --target target
- Running multiple stages with different filters and until dates:sh timescaledb-backfill stage --source source --target target
--filter '^schema1\.table_with_time_as_timestampz$' \ --until '2015-01-01T00:00:00'timescaledb-backfill stage --source source --target target
--filter '^schema1\.table_with_time_as_bigint$' \ --until '91827364'timescaledb-backfill stage --source source --target target
--filter '^schema2\..*' \ --until '2017-01-01T00:00:00'timescaledb-backfill copy --source source --target target
timescaledb-backfill refresh-caggs --source source --target target
timescaledb-backfill verify --source source --target target
timescaledb-backfill clean --target target
- Backfilling a specific period of time with from and until:sh timescaledb-backfill stage --source $SOURCE_DB --target $TARGET_DB
--from '2015-01-02T00:00:00' \ --until '2016-01-02T00:00:00'timescaledb-backfill copy --source source --target target
timescaledb-backfill clean --target target
- Refreshing a continuous aggregates hierarchysh timescaledb-backfill refresh-caggs --source source --target target
--filter='^public\.daily_agg$' --cascade-up --cascade-down### Stop and resume The `copy` command can be safely stopped by sending an interrupt signal (SIGINT) to the process. This can be achieved by using the Ctrl-C keyboard shortcut from the terminal where the tool is currently running. When the tool receives the first signal, it interprets it as a request for a graceful shutdown. It then notifies the copy workers that they should exit once they finish copying the chunk they are currently processing. Depending on the chunk size, this could take many minutes to complete. When a second signal is received, it forces the tool to shut down immediately, interrupting all ongoing work. Due to the tool's usage of transactions, there is no risk of data inconsistency when using forced shutdown. While a graceful shutdown waits for in-progress chunks to finish copying, a force shutdown rolls back the in-progress copy transactions. Any data copied into those chunks is lost, but the database is left in a transactional consistent state, and the backfill process can be safely resumed. ### Inspect tasks progress Each hypertable chunk that's going to be backfilled has a corresponding task stored in the target's database `__backfill.task` table. You can use this information to inspect the backfill's progress:sql select
hypertable_schema, hypertable_name, count(*) as total_chunks, count(worked) as finished_chunks, count(worked is null) pending_chunksfrom __backfill.task group by
1, 2===== PAGE: https://docs.tigerdata.com/use-timescale/query-data/about-query-data/ ===== # About querying data Querying data in TimescaleDB works just like querying data in Postgres. You can reuse your existing queries if you're moving from another Postgres database. TimescaleDB also provides some additional features to help with data analysis: * Use [PopSQL][popsql] to work on data with centralized SQL queries, interactive visuals and real-time collaboration * The [`SkipScan`][skipscan] feature speeds up `DISTINCT` queries * [Hyperfunctions][hyperfunctions] improve the experience of writing many data analysis queries * [Function pipelines][pipelines] bring functional programming to SQL queries, making it easier to perform consecutive transformations of data ===== PAGE: https://docs.tigerdata.com/use-timescale/query-data/select/ ===== # SELECT data You can query data from a hypertable using a standard [`SELECT`][postgres-select] command. All SQL clauses and features are supported. ## Basic query examples Here are some examples of basic `SELECT` queries. Return the 100 most-recent entries in the table `conditions`. Order the rows from newest to oldest:sql SELECT * FROM conditions ORDER BY time DESC LIMIT 100;
Return the number of entries written to the table `conditions` in the last 12 hours:sql SELECT COUNT(*) FROM conditions WHERE time > NOW() - INTERVAL '12 hours';
### Advanced query examples Here are some examples of more advanced `SELECT` queries. Get information about the weather conditions at each location, for each 15-minute period within the last 3 hours. Calculate the number of measurements taken, the maximum temperature, and the maximum humidity. Order the results by maximum temperature. This examples uses the [`time_bucket`][time_bucket] function to aggregate data into 15-minute buckets:sql SELECT time_bucket('15 minutes', time) AS fifteen_min,
location, COUNT(*), MAX(temperature) AS max_temp, MAX(humidity) AS max_humFROM conditions WHERE time > NOW() - INTERVAL '3 hours' GROUP BY fifteen_min, location ORDER BY fifteen_min DESC, max_temp DESC;
Count the number of distinct locations with air conditioning that have reported data in the last day:sql SELECT COUNT(DISTINCT location) FROM conditions JOIN locations
ON conditions.location = locations.locationWHERE locations.air_conditioning = True
AND time > NOW() - INTERVAL '1 day';===== PAGE: https://docs.tigerdata.com/use-timescale/query-data/advanced-analytic-queries/ ===== # Perform advanced analytic queries You can use TimescaleDB for a variety of analytical queries. Some of these queries are native Postgres, and some are additional functions provided by TimescaleDB and TimescaleDB Toolkit. This section contains the most common and useful analytic queries. ## Calculate the median and percentile Use [`percentile_cont`][percentile_cont] to calculate percentiles. You can also use this function to look for the fiftieth percentile, or median. For example, to find the median temperature:sql SELECT percentile_cont(0.5) WITHIN GROUP (ORDER BY temperature) FROM conditions;
You can also use TimescaleDB Toolkit to find the [approximate percentile][toolkit-approx-percentile]. ## Calculate the cumulative sum Use `sum(sum(column)) OVER(ORDER BY group)` to find the cumulative sum. For example:sql SELECT location, sum(sum(temperature)) OVER(ORDER BY location) FROM conditions GROUP BY location;
## Calculate the moving average For a simple moving average, use the `OVER` windowing function over a number of rows, then compute an aggregation function over those rows. For example, to find the smoothed temperature of a device by averaging the ten most recent readings:sql SELECT time, AVG(temperature) OVER(ORDER BY time
ROWS BETWEEN 9 PRECEDING AND CURRENT ROW) AS smooth_tempFROM conditions WHERE location = 'garage' and time > NOW() - INTERVAL '1 day' ORDER BY time DESC;
## Calculate the increase in a value To calculate the increase in a value, you need to account for counter resets. Counter resets can occur if a host reboots or container restarts. This example finds the number of bytes sent, and takes counter resets into account:sql SELECT time, (
CASE WHEN bytes_sent >= lag(bytes_sent) OVER w THEN bytes_sent - lag(bytes_sent) OVER w WHEN lag(bytes_sent) OVER w IS NULL THEN NULL ELSE bytes_sent END) AS "bytes" FROM net WHERE interface = 'eth0' AND time > NOW() - INTERVAL '1 day' WINDOW w AS (ORDER BY time) ORDER BY time
## Calculate the rate of change Like [increase](#calculate-the-increase-in-a-value), rate applies to a situation with monotonically increasing counters. If your sample interval is variable or you use different sampling intervals between different series, it is helpful to normalize the values to a common time interval to make the calculated values comparable. This example finds bytes per second sent, and takes counter resets into account:sql SELECT time, (
CASE WHEN bytes_sent >= lag(bytes_sent) OVER w THEN bytes_sent - lag(bytes_sent) OVER w WHEN lag(bytes_sent) OVER w IS NULL THEN NULL ELSE bytes_sent END) / extract(epoch from time - lag(time) OVER w) AS "bytes_per_second" FROM net WHERE interface = 'eth0' AND time > NOW() - INTERVAL '1 day' WINDOW w AS (ORDER BY time) ORDER BY time
## Calculate the delta In many monitoring and IoT use cases, devices or sensors report metrics that do not change frequently, and any changes are considered anomalies. When you query for these changes in values over time, you usually do not want to transmit all the values, but only the values where changes were observed. This helps to minimize the amount of data sent. You can use a combination of window functions and subselects to achieve this. This example uses diffs to filter rows where values have not changed and only transmits rows where values have changed:sql SELECT time, value FROM ( SELECT time,
value, value - LAG(value) OVER (ORDER BY time) AS diffFROM hypertable) ht WHERE diff IS NULL OR diff != 0;
## Calculate the change in a metric within a group To group your data by some field, and calculate the change in a metric within each group, use `LAG ... OVER (PARTITION BY ...)`. For example, given some weather data, calculate the change in temperature for each city:sql SELECT ts, city_name, temp_delta FROM ( SELECT
ts, city_name, avg_temp - LAG(avg_temp) OVER (PARTITION BY city_name ORDER BY ts) as temp_deltaFROM weather_metrics_daily ) AS temp_change WHERE temp_delta IS NOT NULL ORDER BY bucket;
## Group data into time buckets The [`time_bucket`][time_bucket] function in TimescaleDB extends the Postgres [`date_bin`][date_bin] function. Time bucket accepts arbitrary time intervals, as well as optional offsets, and returns the bucket start time. For example:sql SELECT time_bucket('5 minutes', time) AS five_min, avg(cpu) FROM metrics GROUP BY five_min ORDER BY five_min DESC LIMIT 12;
## Get the first or last value in a column The [`first`][first] and [`last`][last] functions allow you to get the value of one column as ordered by another. This is commonly used in an aggregation. These examples find the last element of a group:sql SELECT location, last(temperature, time) FROM conditions GROUP BY location;
sql SELECT time_bucket('5 minutes', time) five_min, location, last(temperature, time) FROM conditions GROUP BY five_min, location ORDER BY five_min DESC LIMIT 12;
## Generate a histogram The [`histogram`][histogram] function allows you to generate a histogram of your data. This example defines a histogram with five buckets defined over the range 60 to 85. The generated histogram has seven bins; the first is for values below the minimum threshold of 60, the middle five bins are for values in the stated range and the last is for values above 85:sql SELECT location, COUNT(*),
histogram(temperature, 60.0, 85.0, 5)FROM conditions WHERE time > NOW() - INTERVAL '7 days' GROUP BY location;
This query outputs data like this:bash location | count | histogram ------------+-------+------------------------- office | 10080 | {0,0,3860,6220,0,0,0} basement | 10080 | {0,6056,4024,0,0,0,0} garage | 10080 | {0,2679,957,2420,2150,1874,0}
## Fill gaps in time-series data You can display records for a selected time range, even if no data exists for part of the range. This is often called gap filling, and usually involves an operation to record a null value for any missing data. In this example, the trading data that includes a `time` timestamp, the `asset_code` being traded, the `price` of the asset, and the `volume` of the asset being traded is used. Create a query for the volume of the asset 'TIMS' being traded every day for the month of September:sql SELECT
time_bucket('1 day', time) AS date, sum(volume) AS volumeFROM trades WHERE asset_code = 'TIMS'
AND time >= '2021-09-01' AND time < '2021-10-01'GROUP BY date ORDER BY date DESC;
This query outputs data like this:bash
date | volume------------------------+-------- 2021-09-29 00:00:00+00 | 11315 2021-09-28 00:00:00+00 | 8216 2021-09-27 00:00:00+00 | 5591 2021-09-26 00:00:00+00 | 9182 2021-09-25 00:00:00+00 | 14359 2021-09-22 00:00:00+00 | 9855
You can see from the output that no records are included for 09-23, 09-24, or 09-30, because no trade data was recorded for those days. To include time records for each missing day, you can use the `time_bucket_gapfill` function, which generates a series of time buckets according to a given interval across a time range. In this example, the interval is one day, across the month of September:sql SELECT time_bucket_gapfill('1 day', time) AS date, sum(volume) AS volume FROM trades WHERE asset_code = 'TIMS' AND time >= '2021-09-01' AND time < '2021-10-01' GROUP BY date ORDER BY date DESC;
This query outputs data like this:bash
date | volume------------------------+-------- 2021-09-30 00:00:00+00 | 2021-09-29 00:00:00+00 | 11315 2021-09-28 00:00:00+00 | 8216 2021-09-27 00:00:00+00 | 5591 2021-09-26 00:00:00+00 | 9182 2021-09-25 00:00:00+00 | 14359 2021-09-24 00:00:00+00 | 2021-09-23 00:00:00+00 | 2021-09-22 00:00:00+00 | 9855
You can also use the `time_bucket_gapfill` function to generate data points that also include timestamps. This can be useful for graphic libraries that require even null values to have a timestamp so that they can accurately draw gaps in a graph. In this example, you generate 1080 data points across the last two weeks, fill in the gaps with null values, and give each null value a timestamp:sql SELECT time_bucket_gapfill(INTERVAL '2 weeks' / 1080, time, now() - INTERVAL '2 weeks', now()) AS btime, sum(volume) AS volume FROM trades WHERE asset_code = 'TIMS' AND time >= now() - INTERVAL '2 weeks' AND time < now() GROUP BY btime ORDER BY btime;
This query outputs data like this:bash
btime | volume------------------------+---------- 2021-03-09 17:28:00+00 | 1085.25 2021-03-09 17:46:40+00 | 1020.42 2021-03-09 18:05:20+00 | 2021-03-09 18:24:00+00 | 1031.25 2021-03-09 18:42:40+00 | 1049.09 2021-03-09 19:01:20+00 | 1083.80 2021-03-09 19:20:00+00 | 1092.66 2021-03-09 19:38:40+00 | 2021-03-09 19:57:20+00 | 1048.42 2021-03-09 20:16:00+00 | 1063.17 2021-03-09 20:34:40+00 | 1054.10 2021-03-09 20:53:20+00 | 1037.78
### Fill gaps by carrying the last observation forward If your data collections only record rows when the actual value changes, your visualizations might still need all data points to properly display your results. In this situation, you can carry forward the last observed value to fill the gap. For example:sql SELECT time_bucket_gapfill(INTERVAL '5 min', time, now() - INTERVAL '2 weeks', now()) as 5min, meter_id, locf(avg(data_value)) AS data_value FROM my_hypertable WHERE time > now() - INTERVAL '2 weeks' AND meter_id IN (1,2,3,4) GROUP BY 5min, meter_id
## Find the last point for each unique item You can find the last point for each unique item in your database. For example, the last recorded measurement from each IoT device, the last location of each item in asset tracking, or the last price of a security. The standard approach to minimize the amount of data to be searched for the last point is to use a time predicate to tightly bound the amount of time, or the number of chunks, to traverse. This method does not work unless all items have at least one record within the time range. A more robust method is to use a last point query to determine the last record for each unique item. In this example, useful for asset tracking or fleet management, you create a metadata table for each vehicle being tracked, and a second time-series table containing the vehicle's location at a given time:sql CREATE TABLE vehicles ( vehicle_id INTEGER PRIMARY KEY, vin_number CHAR(17), last_checkup TIMESTAMP );
CREATE TABLE location ( time TIMESTAMP NOT NULL, vehicle_id INTEGER REFERENCES vehicles (vehicle_id), latitude FLOAT, longitude FLOAT ) WITH ( tsdb.hypertable, tsdb.partition_column='time' );
If you are self-hosting TimescaleDB v2.19.3 and below, create a [Postgres relational table][pg-create-table], then convert it using [create_hypertable][create_hypertable]. You then enable hypercore with a call to [ALTER TABLE][alter_table_hypercore]. You can use the first table, which gives a distinct set of vehicles, to perform a `LATERAL JOIN` against the location table:sql SELECT data.* FROM vehicles v INNER JOIN LATERAL (
SELECT * FROM location l WHERE l.vehicle_id = v.vehicle_id ORDER BY time DESC LIMIT 1) AS data ON true ORDER BY v.vehicle_id, data.time DESC;
time | vehicle_id | latitude | longitude----------------------------+------------+-----------+------------- 2017-12-19 20:58:20.071784 | 72 | 40.753690 | -73.980340 2017-12-20 11:19:30.837041 | 156 | 40.729265 | -73.993611 2017-12-15 18:54:01.185027 | 231 | 40.350437 | -74.651954
This approach requires keeping a separate table of distinct item identifiers or names. You can do this by using a foreign key from the hypertable to the metadata table, as shown in the `REFERENCES` definition in the example. The metadata table can be populated through business logic, for example when a vehicle is first registered with the system. Alternatively, you can dynamically populate it using a trigger when inserts or updates are performed against the hypertable. For example:sql CREATE OR REPLACE FUNCTION create_vehicle_trigger_fn() RETURNS TRIGGER LANGUAGE PLPGSQL AS body$ BEGIN INSERT INTO vehicles VALUES(NEW.vehicle_id, NULL, NULL) ON CONFLICT DO NOTHING; RETURN NEW; END body$;
CREATE TRIGGER create_vehicle_trigger BEFORE INSERT OR UPDATE ON location FOR EACH ROW EXECUTE PROCEDURE create_vehicle_trigger_fn();
You could also implement this functionality without a separate metadata table by performing a [loose index scan][loose-index-scan] over the `location` hypertable, although this requires more compute resources. Alternatively, you speed up your `SELECT DISTINCT` queries by structuring them so that TimescaleDB can use its [SkipScan][skipscan] feature. ===== PAGE: https://docs.tigerdata.com/use-timescale/query-data/skipscan/ ===== # Get faster DISTINCT queries with SkipScan Tiger Data SkipScan dramatically speeds up `DISTINCT` queries. It jumps directly to the first row of each distinct value in an index instead of scanning all rows. First introduced for the rowstore hypertables and relational tables, SkipScan now extends to columnstore hypertables, distinct aggregates like `COUNT(DISTINCT)`, and even multiple columns. Since [TimescaleDB v2.2.0](https://github.com/timescale/timescaledb/releases/tag/2.2.0) ## Speed up `DISTINCT` queries You use `DISTINCT` queries to get only the unique values in your data. For example, the IDs of customers who placed orders, the countries where your users are located, or the devices reporting into an IoT system. You might also have graphs and alarms that repeatedly query the most recent values for every device or service. As your tables get larger, `DISTINCT` queries tend to get slower. Even when your index matches the exact order and columns for these kinds of queries, Postgres (without SkipScan) has to scan the entire index and then run deduplication. As the table grows, this operation keeps getting slower. SkipScan is an optimization for `DISTINCT` and `DISTINCT ON` queries, including multi-column `DISTINCT`. SkipScan allows queries to incrementally jump from one ordered value to the next, without reading the rows in between. Conceptually, SkipScan is a regular IndexScan that skips across an index looking for the next value that is greater than the current value. When you issue a query that uses SkipScan, the `EXPLAIN` output includes a new `Custom Scan (SkipScan)` operator, or node, that can quickly return distinct items from a properly ordered index. As it locates one item, the SkipScan node quickly restarts the search for the next item. This is a much more efficient way of finding distinct items in an ordered index. SkipScan cost is based on the ratio of distinct tuples to total tuples. If the number of distinct tuples is close to the total number of tuples, SkipScan is unlikely to be used due to its higher estimated cost. Multi-column SkipScan is supported for queries that do not produce NULL distinct values. For example:sql CREATE INDEX ON metrics(region, device, metric_type); -- All distinct columns have filters which don't allow NULLs: can use SkipScan SELECT DISTINCT ON (region, device, metric_type) * FROM metrics WHERE region IN ('UK','EU','JP') AND device > 1 AND metric_type IS NOT NULL ORDER BY region, device, metric_type, time DESC; -- Distinct columns are declared NOT NULL: can use SkipScan with index on (region, device) CREATE TABLE metrics(region TEXT NOT NULL, device INT NOT NULL, ...); SELECT DISTINCT ON (region, device) * FROM metrics ORDER BY region, device, time DESC;
For benchmarking information on how SkipScan compares to regular `DISTINCT` queries, see the [SkipScan blog post][blog-skipscan]. ## Use SkipScan queries Design your layout: - Rowstore: create an index starting with the `DISTINCT` columns, followed by your time sort. If the `DISTINCT` columns are not the first in your index, ensure any leading columns are used as constraints in your query. This means that if you are asking a question such as "retrieve a list of unique IDs in order" and "retrieve the last reading of each ID," you need at least one index like this: ```sql CREATE INDEX "cpu_customer_tags_id_time_idx" \ ON readings (customer_id, tags_id, time DESC) ``` - Columnstore: set `timescaledb.compress_segmentby` to the distinct columns and `compress_orderby` to match your query’s sort. Compress your historical chunks. With your index set up correctly, you should start to see immediate benefit for `DISTINCT` queries. When SkipScan is chosen for your query, the `EXPLAIN ANALYZE` output shows one or more `Custom Scan (SkipScan)` nodes, like this:sql -> Unique -> Merge Append
Sort Key: _hyper_8_79_chunk.tags_id, _hyper_8_79_chunk."time" DESC -> Custom Scan (SkipScan) on _hyper_8_79_chunk -> Index Only Scan using _hyper_8_79_chunk_cpu_tags_id_time_idx on _hyper_8_79_chunk Index Cond: (tags_id > NULL::integer) -> Custom Scan (SkipScan) on _hyper_8_80_chunk -> Index Only Scan using _hyper_8_80_chunk_cpu_tags_id_time_idx on _hyper_8_80_chunk Index Cond: (tags_id > NULL::integer)===== PAGE: https://docs.tigerdata.com/use-timescale/configuration/about-configuration/ ===== # About configuration in Tiger Cloud By default, Tiger Cloud uses the default Postgres server configuration settings. Most configuration values for a Tiger Cloud service are initially set in accordance with best practices given the compute and storage settings of the service. Any time you increase or decrease the compute for a service, the most essential values are set to reflect the size of the new service. There are times, however, when your specific workload could require tuning some of the many available Tiger Cloud-specific and Postgres parameters. By providing the ability to tune various runtime settings, Tiger Cloud provides the balance and flexibility you need when running your workloads in a hosted environment. You can use [service settings][settings] and [service operations][operations] to customize Tiger Cloud configurations. ===== PAGE: https://docs.tigerdata.com/use-timescale/configuration/customize-configuration/ ===== # Configure database parameters Tiger Cloud allows you to customize many Tiger Cloud-specific and Postgres configuration options for each service individually. Most configuration values for a service are initially set in accordance with best practices given the compute and storage settings of the service. Any time you increase or decrease the compute for a service, the most essential values are set to reflect the size of the new service. You can modify most parameters without restarting the service. However, some changes do require a restart, resulting in some brief downtime that is usually about 30 seconds. An example of a change that needs a restart is modifying the compute resources of a running service. ## View service operation details To modify configuration parameters, first select the service that you want to modify. This displays the service details, with these tabs across the top: `Overview`, `Actions`, `Explorer`, `Monitoring`, `Connections`, `SQL Editor`, `Operations`, and `AI`. Select `Operations`, then `Database parameters`. 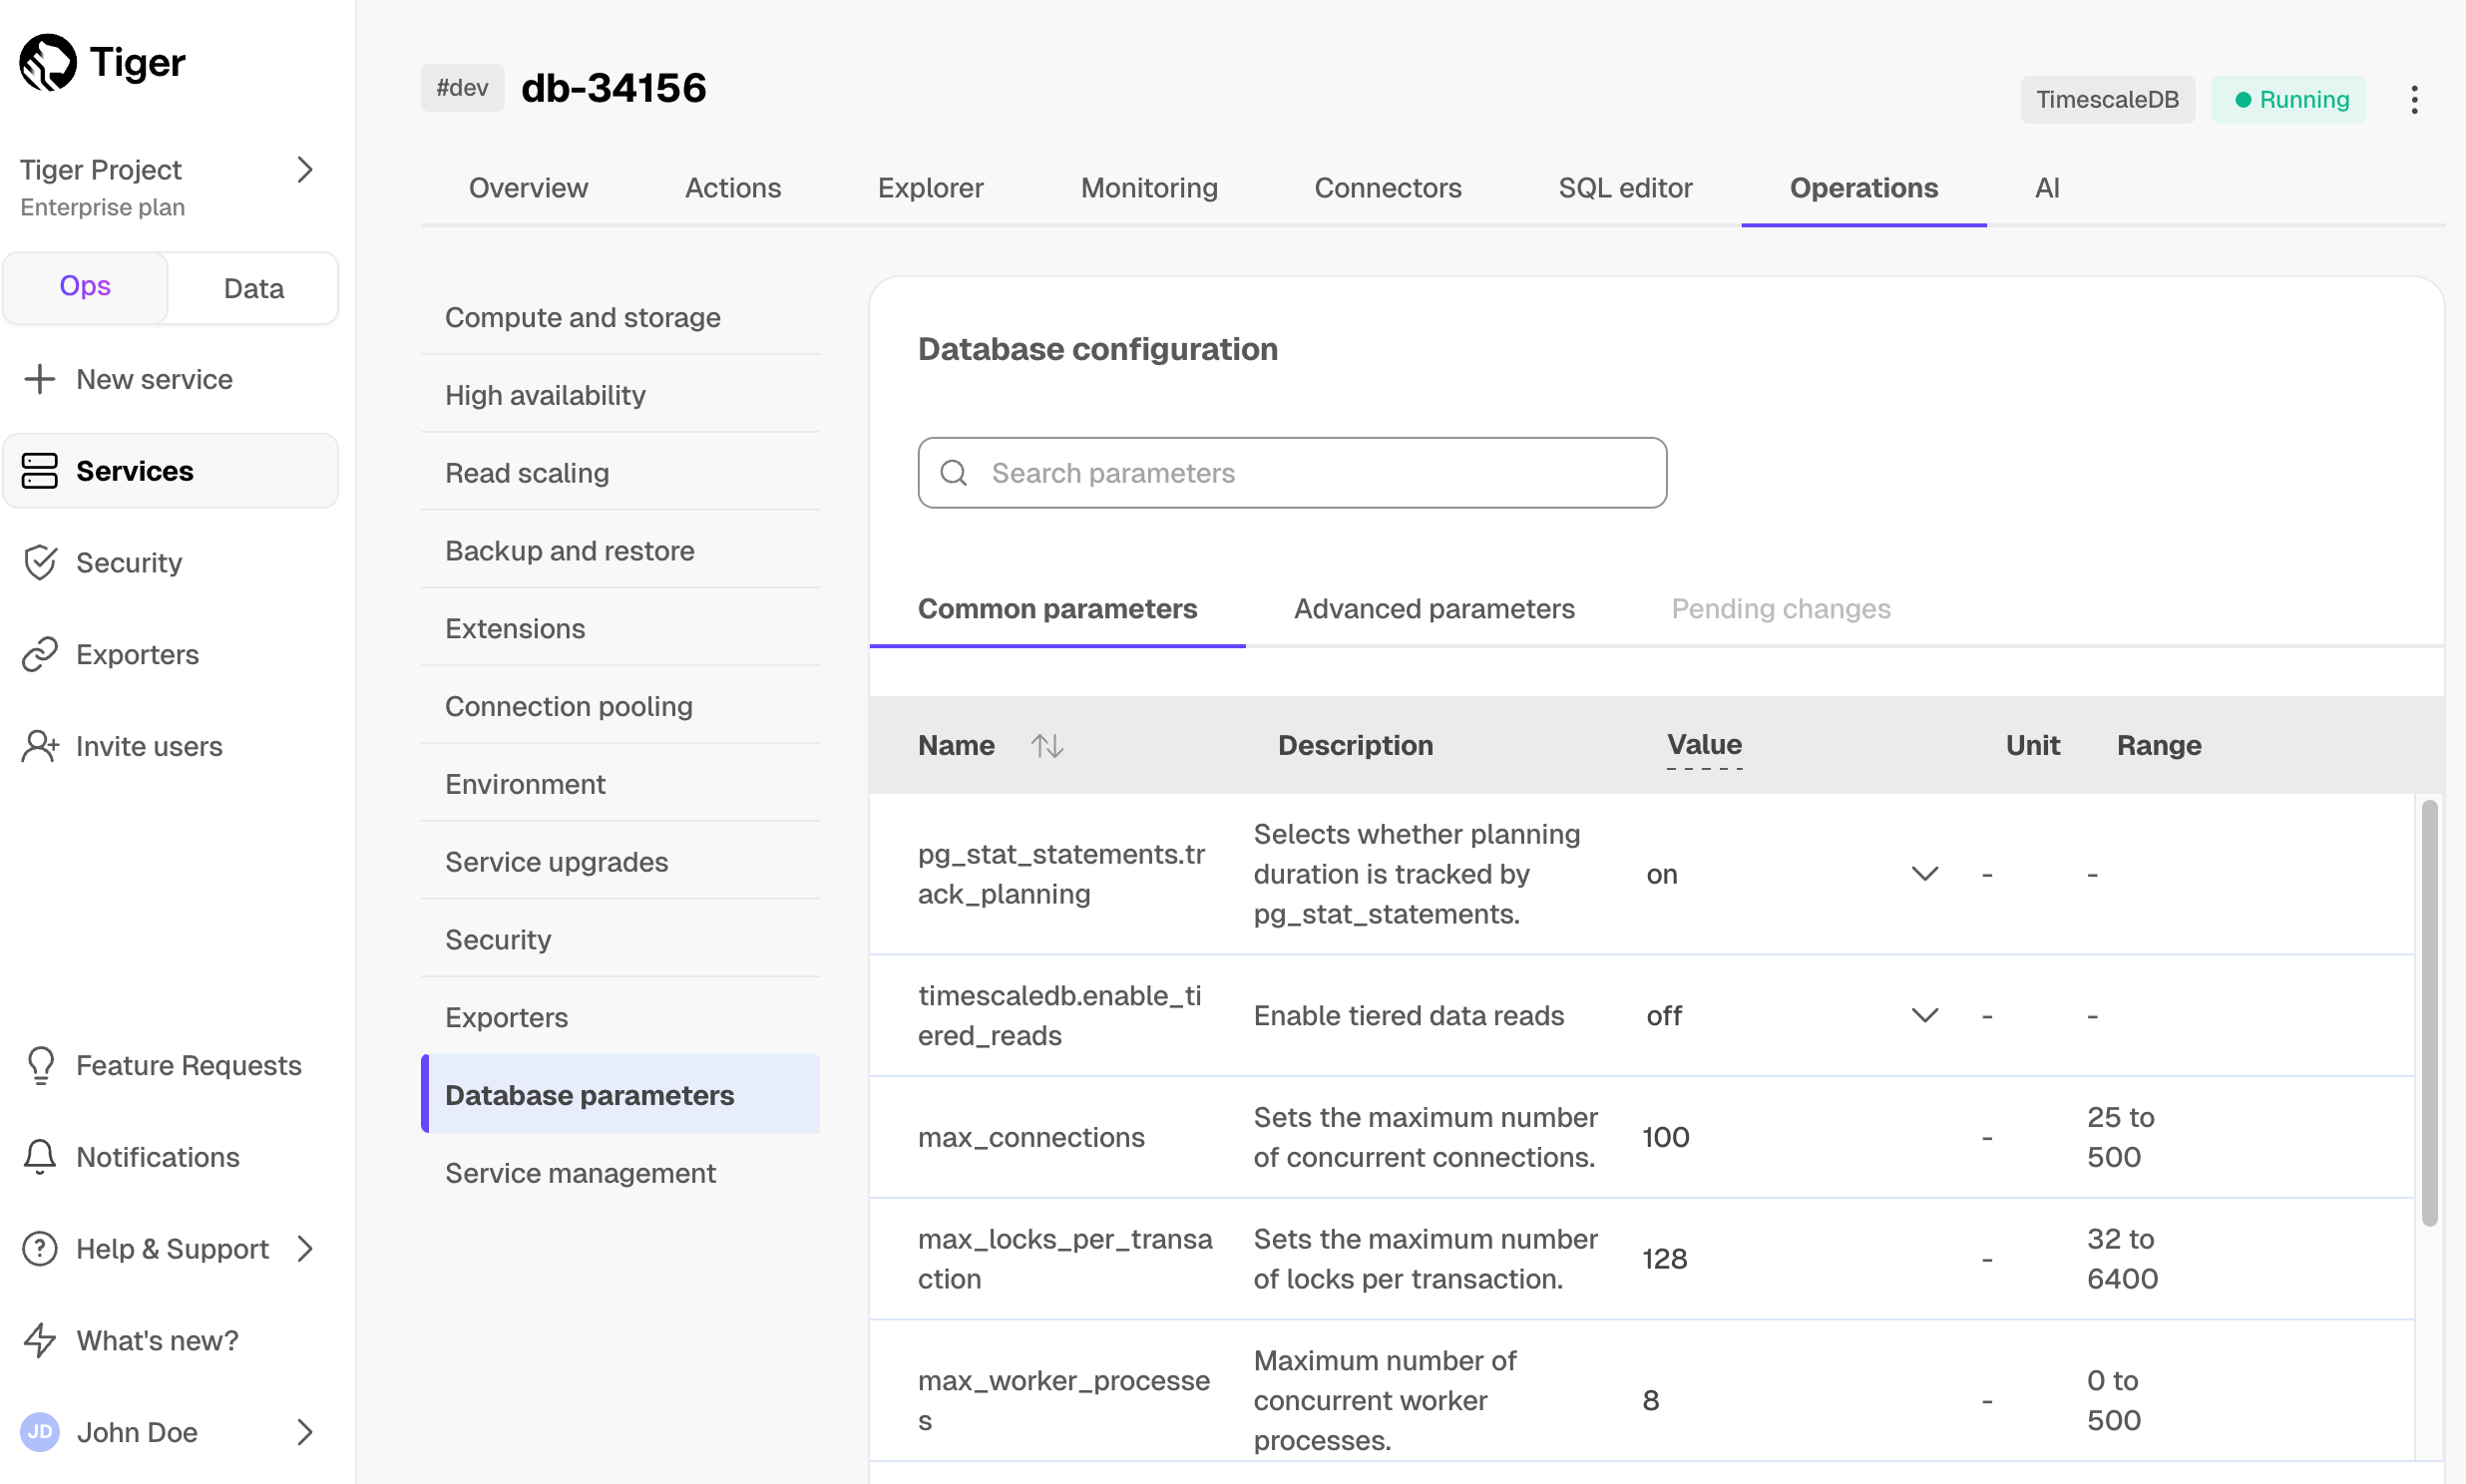 ### Modify basic parameters Under the `Common parameters` tab, you can modify a limited set of the parameters that are most often modified in a Tiger Cloud or Postgres instance. To modify a configured value, hover over the value and click the revealed pencil icon. This reveals an editable field to apply your change. Clicking anywhere outside of that field saves the value to be applied. <img class="main-content__illustration" width={1375} height={944} src="https://assets.timescale.com/docs/images/tsc-settings-change.webp" alt="Change Tiger Cloud configuration parameters"/> ### Apply configuration changes When you have modified the configuration parameters that you would like to change, click `Apply changes`. For some changes, such as `timescaledb.max_background_workers`, the service needs to be restarted. In this case, the button reads `Apply changes and restart`. A confirmation dialog is displayed which indicates whether a restart is required. Click `Confirm` to apply the changes, and restart if necessary. <img class="main-content__illustration" width={1375} height={944} src="https://assets.timescale.com/docs/images/tsc-settings-confirm.webp" alt="Confirm Tiger Cloud configuration changes"/> ===== PAGE: https://docs.tigerdata.com/use-timescale/configuration/advanced-parameters/ ===== # Advanced parameters It is possible to configure a wide variety of Tiger Cloud service database parameters by navigating to the `Advanced parameters` tab under the `Database configuration` heading. The advanced parameters are displayed in a scrollable and searchable list. 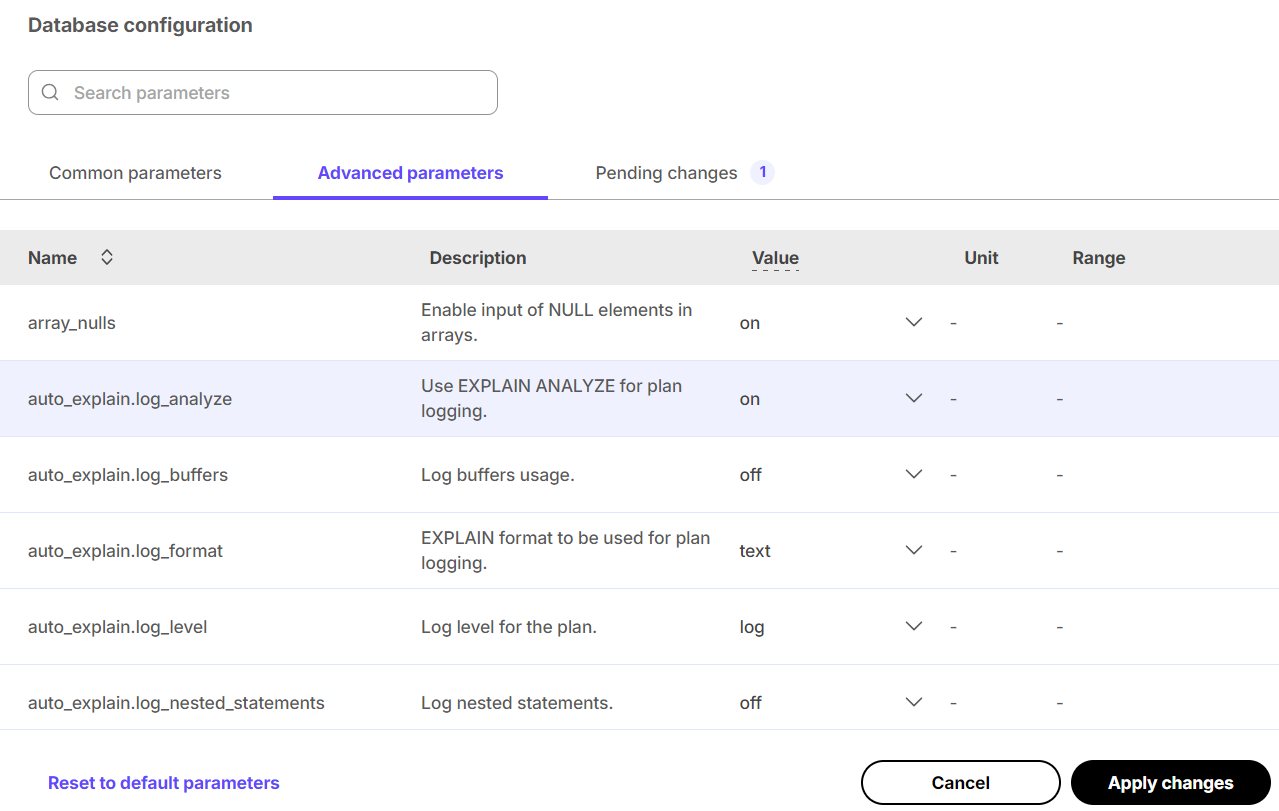 As with the basic database configuration parameters, any changes are highlighted and the `Apply changes`, or `Apply changes and restart`, button is available, prompting you to confirm changes before the service is modified. ## Multiple databases To create more than one database, you need to create a new service for each database. Tiger Cloud does not support multiple databases within the same service. Having a separate service for each database affords each database its own isolated resources. You can also use [schemas][schemas] to organize tables into logical groups. A single database can contain multiple schemas, which in turn contain tables. The main difference between isolating with databases versus schemas is that a user can access objects in any of the schemas in the database they are connected to, so long as they have the corresponding privileges. Schemas can help isolate smaller use cases that do not warrant their own service. Please refer to the [Grand Unified Configuration (GUC) parameters][gucs] for a complete list. ## Policies ### `timescaledb.max_background_workers (int)` Max background worker processes allocated to TimescaleDB. Set to at least 1 + the number of databases loaded with the TimescaleDB extension in a Postgres instance. Default value is 16. ## Tiger Cloud service tuning ### `timescaledb.disable_load (bool)` Disable the loading of the actual extension ===== PAGE: https://docs.tigerdata.com/use-timescale/ha-replicas/read-scaling/ ===== # Read scaling When read-intensive workloads compete with high ingest rates, your primary data instance can become a bottleneck. Spiky query traffic, analytical dashboards, and business intelligence tools risk slowing down ingest performance and disrupting critical write operations. With read replica sets in Tiger Cloud, you can scale reads horizontally and keep your applications responsive. By offloading queries to replicas, your service maintains high ingest throughput while serving large or unpredictable read traffic with ease. This approach not only protects write performance but also gives you confidence that your read-heavy apps and BI workloads will run smoothly—even under pressure. 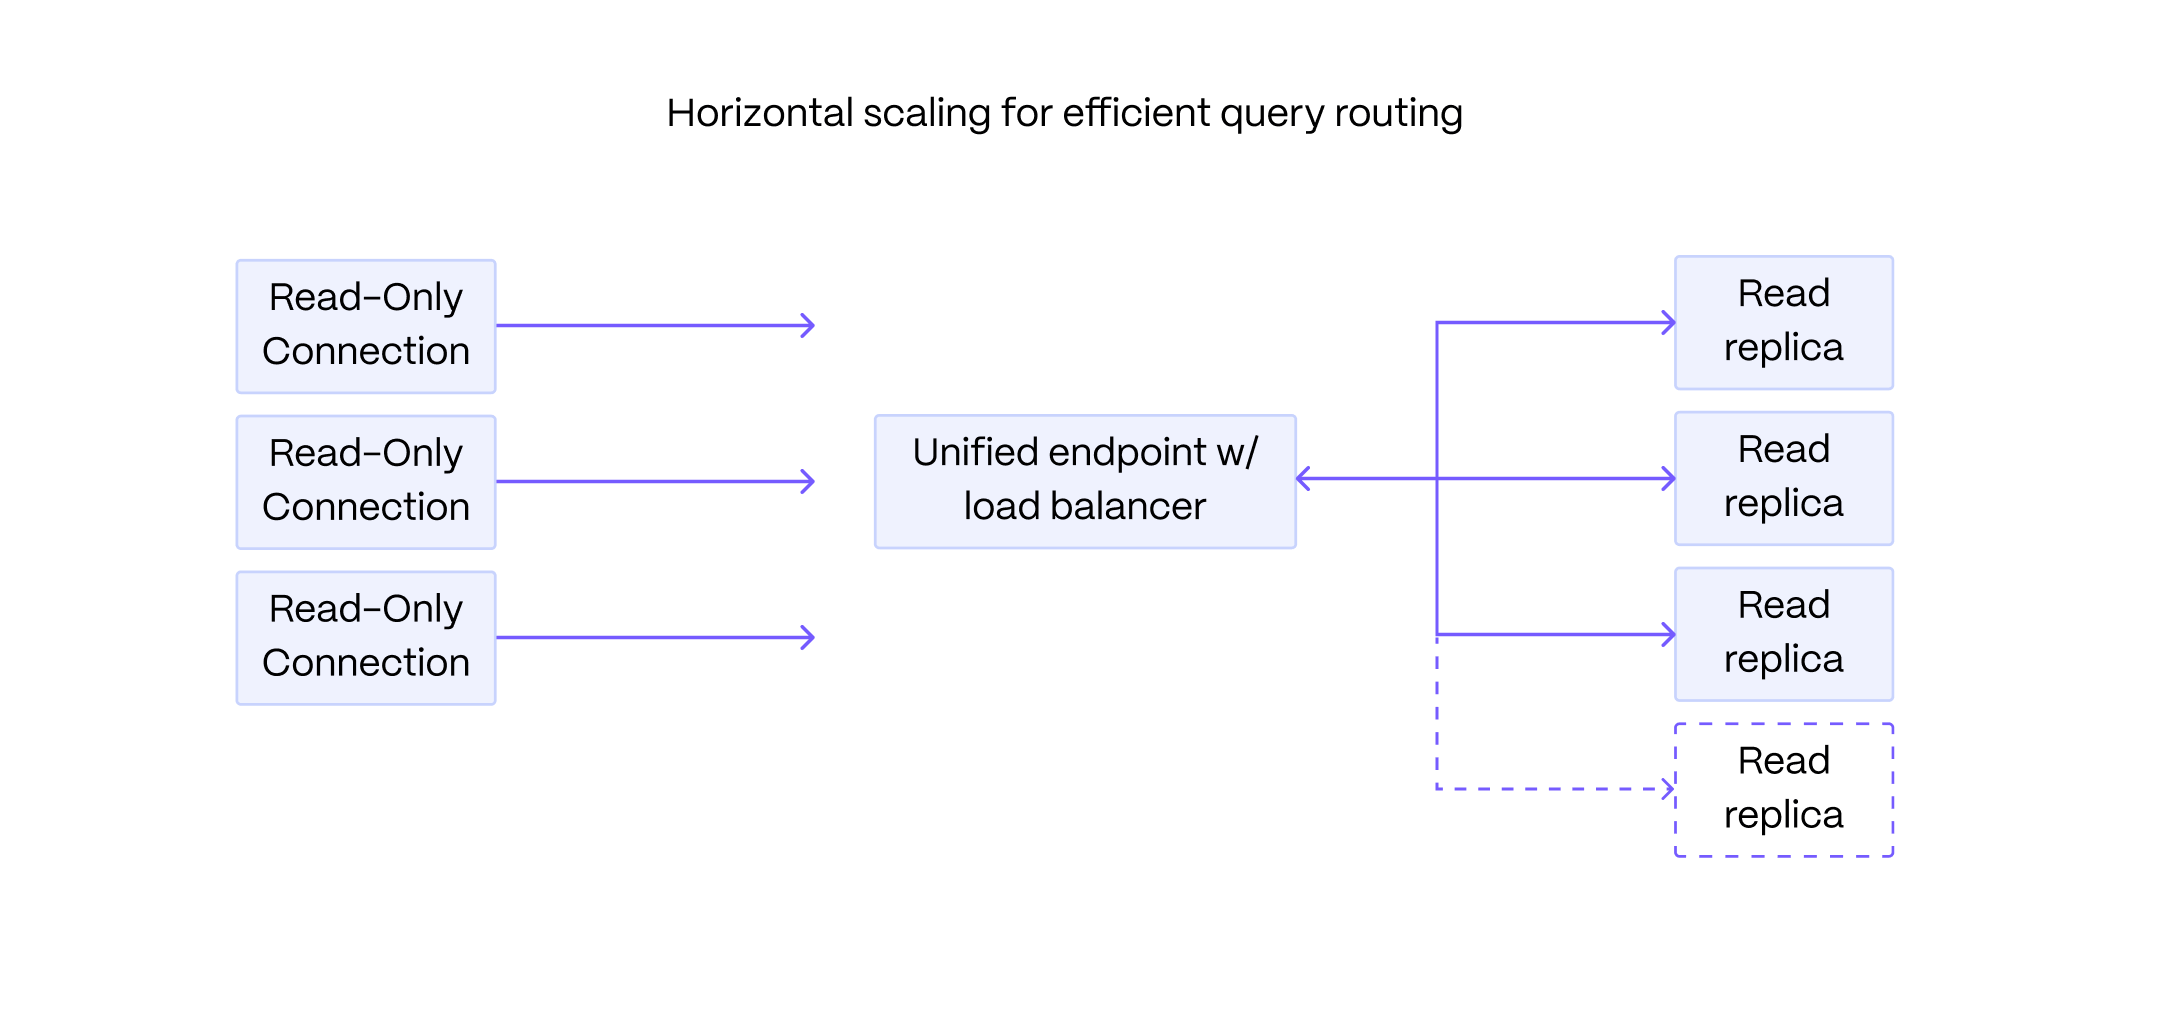 This page shows you how to create and manage read replica sets in Tiger Cloud Console. ## What is read replication? A read replica is a read-only copy of your primary database instance. Queries on read replicas have minimal impact on the performance of the primary instance. This enables you to interact with up-to-date production data for analysis, or to scale out reads beyond the limits of your primary instance. Read replicas can be short-lived and deleted when a session of data analysis is complete, or long-running to power an application or a business intelligence tool. A read replica set in Tiger Cloud is a group of one or more read replica nodes that are accessed through the same endpoint. You query each set as a single replica. Tiger Cloud balances the load between the nodes in the set for you. You can create as many read replica sets as you need. For security and resource isolation, each read replica set has unique connection details. You use read replica sets for horizontal **read** scaling. To limit data loss for your Tiger Cloud services, use [high-availability replicas][ha]. ## Prerequisites To follow this procedure: - Create a target Tiger Cloud service. - Create a [read-only user][read-only-role] on the primary data instance. A user with read-only permissions cannot make changes in the primary database. This user is propagated to the read replica set when you create it. ## Create a read replica set To create a secure read replica set for your read-intensive apps: 1. **In [Tiger Cloud Console][timescale-console-services], select your target service** 1. **Click `Operations` > `Read scaling` > `Add a read replica set`** 1. **Configure your replica set** Configure the number of nodes, compute size, connection pooling, and the name for your replica, then click `Create read replica set`. 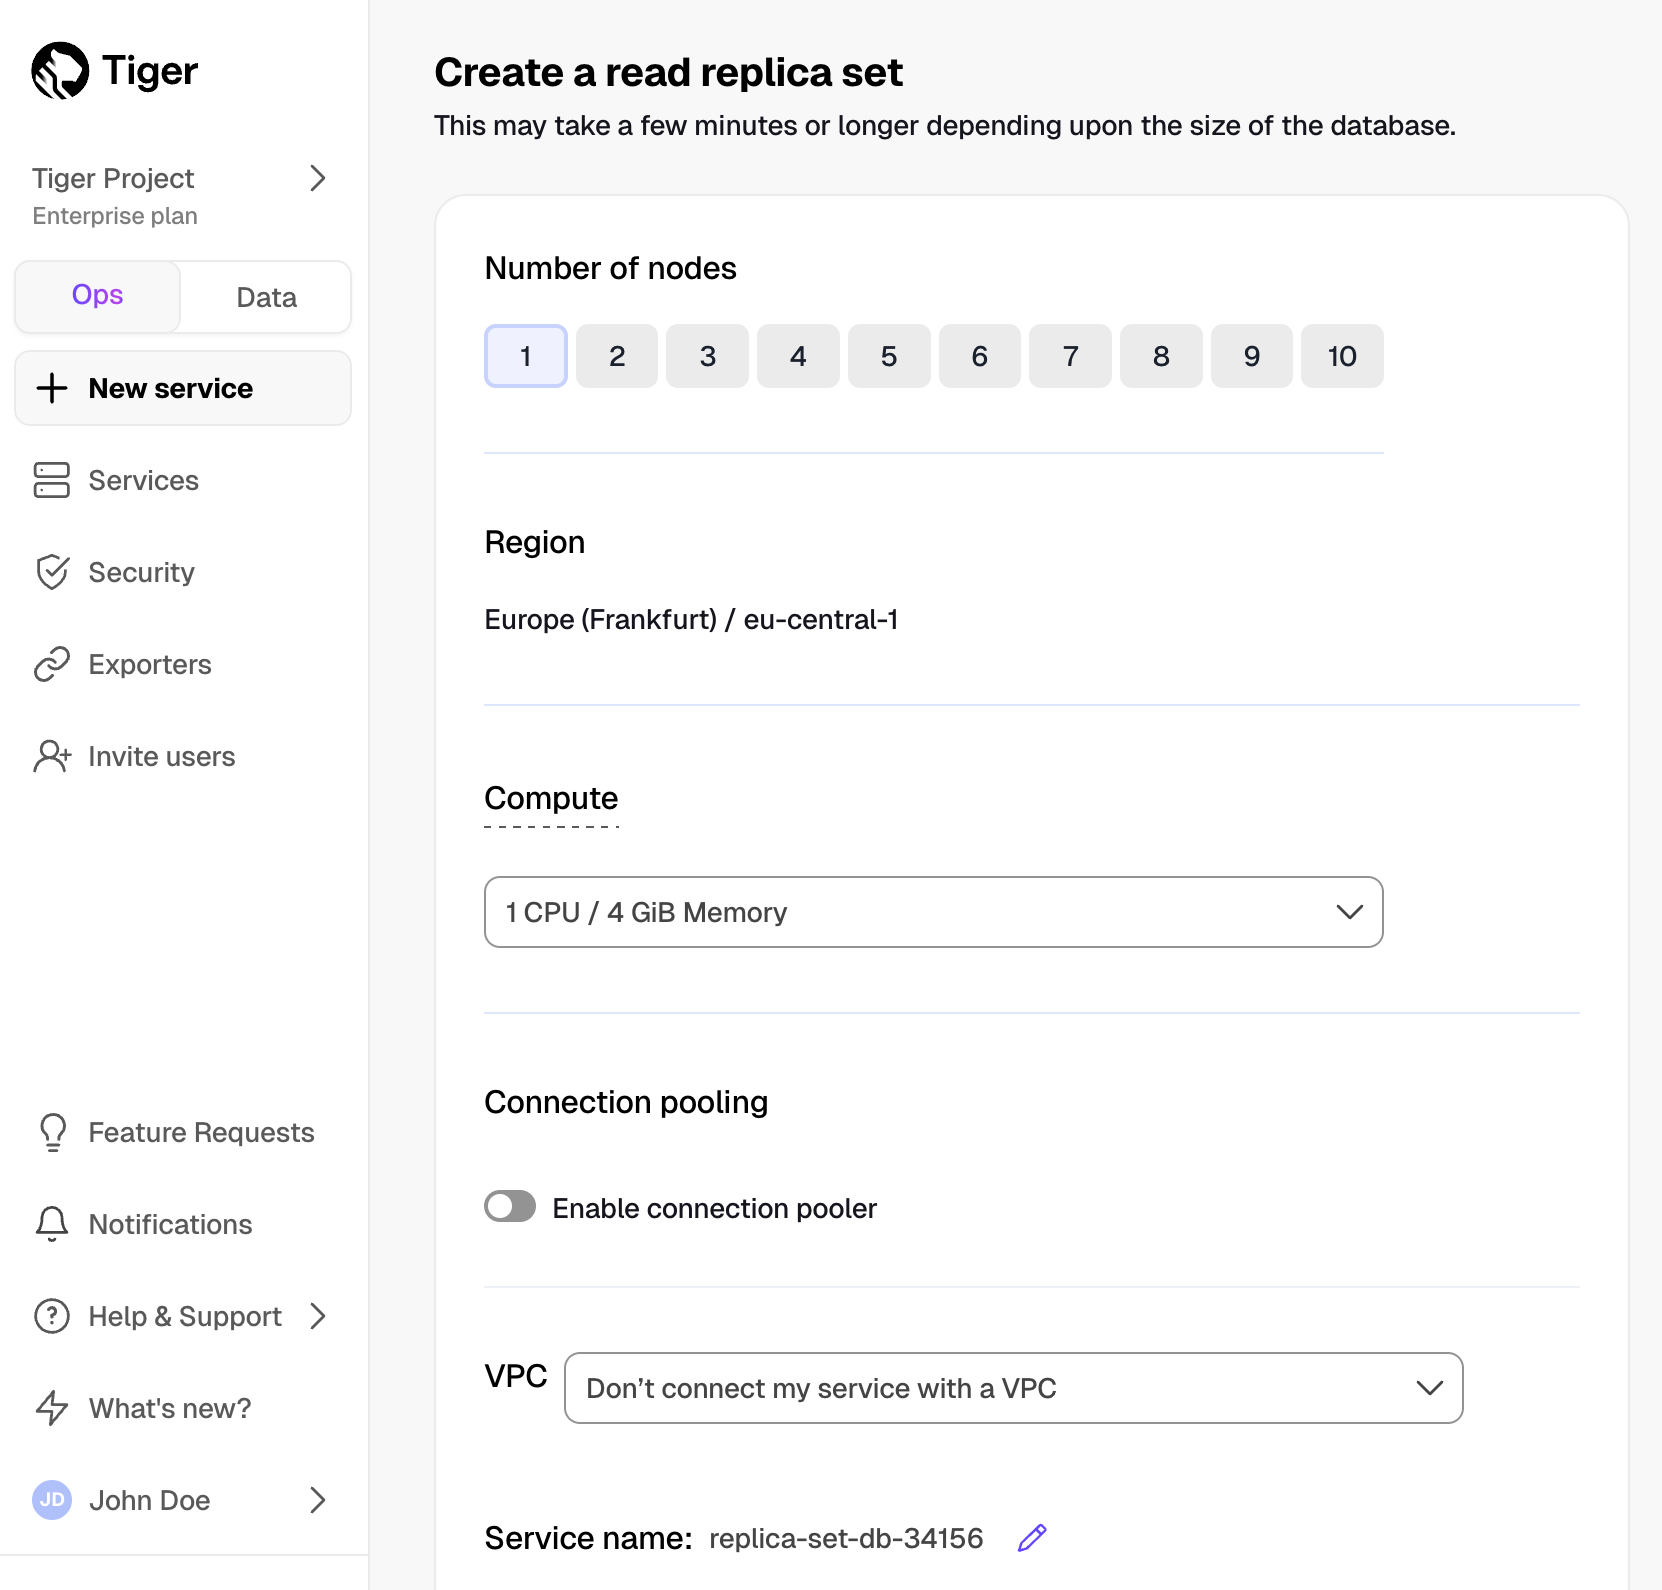 1. **Save the connection information** The username and password of a read replica set are the same as the primary service. They cannot be changed independently. The connection information for each read replica set is unique. You can add or remove nodes from an existing set and the connection information of that set will remain the same. To find the connection information for an existing read replica set: 1. Select the primary service in Tiger Cloud Console. 1. Click `Operations` > `Read scaling`. 1. Click the 🔗 icon next to the replica set in the list. ## Edit a read replica set You can edit an existing read replica set to better handle your reads. This includes changing the number of nodes, compute size, storage, and IOPS, as well as configuring VPC and other features. To change the compute and storage configuration of your read replica set: 1. **In [Tiger Cloud Console][timescale-console-services], expand and click the read replica set under your primary service** 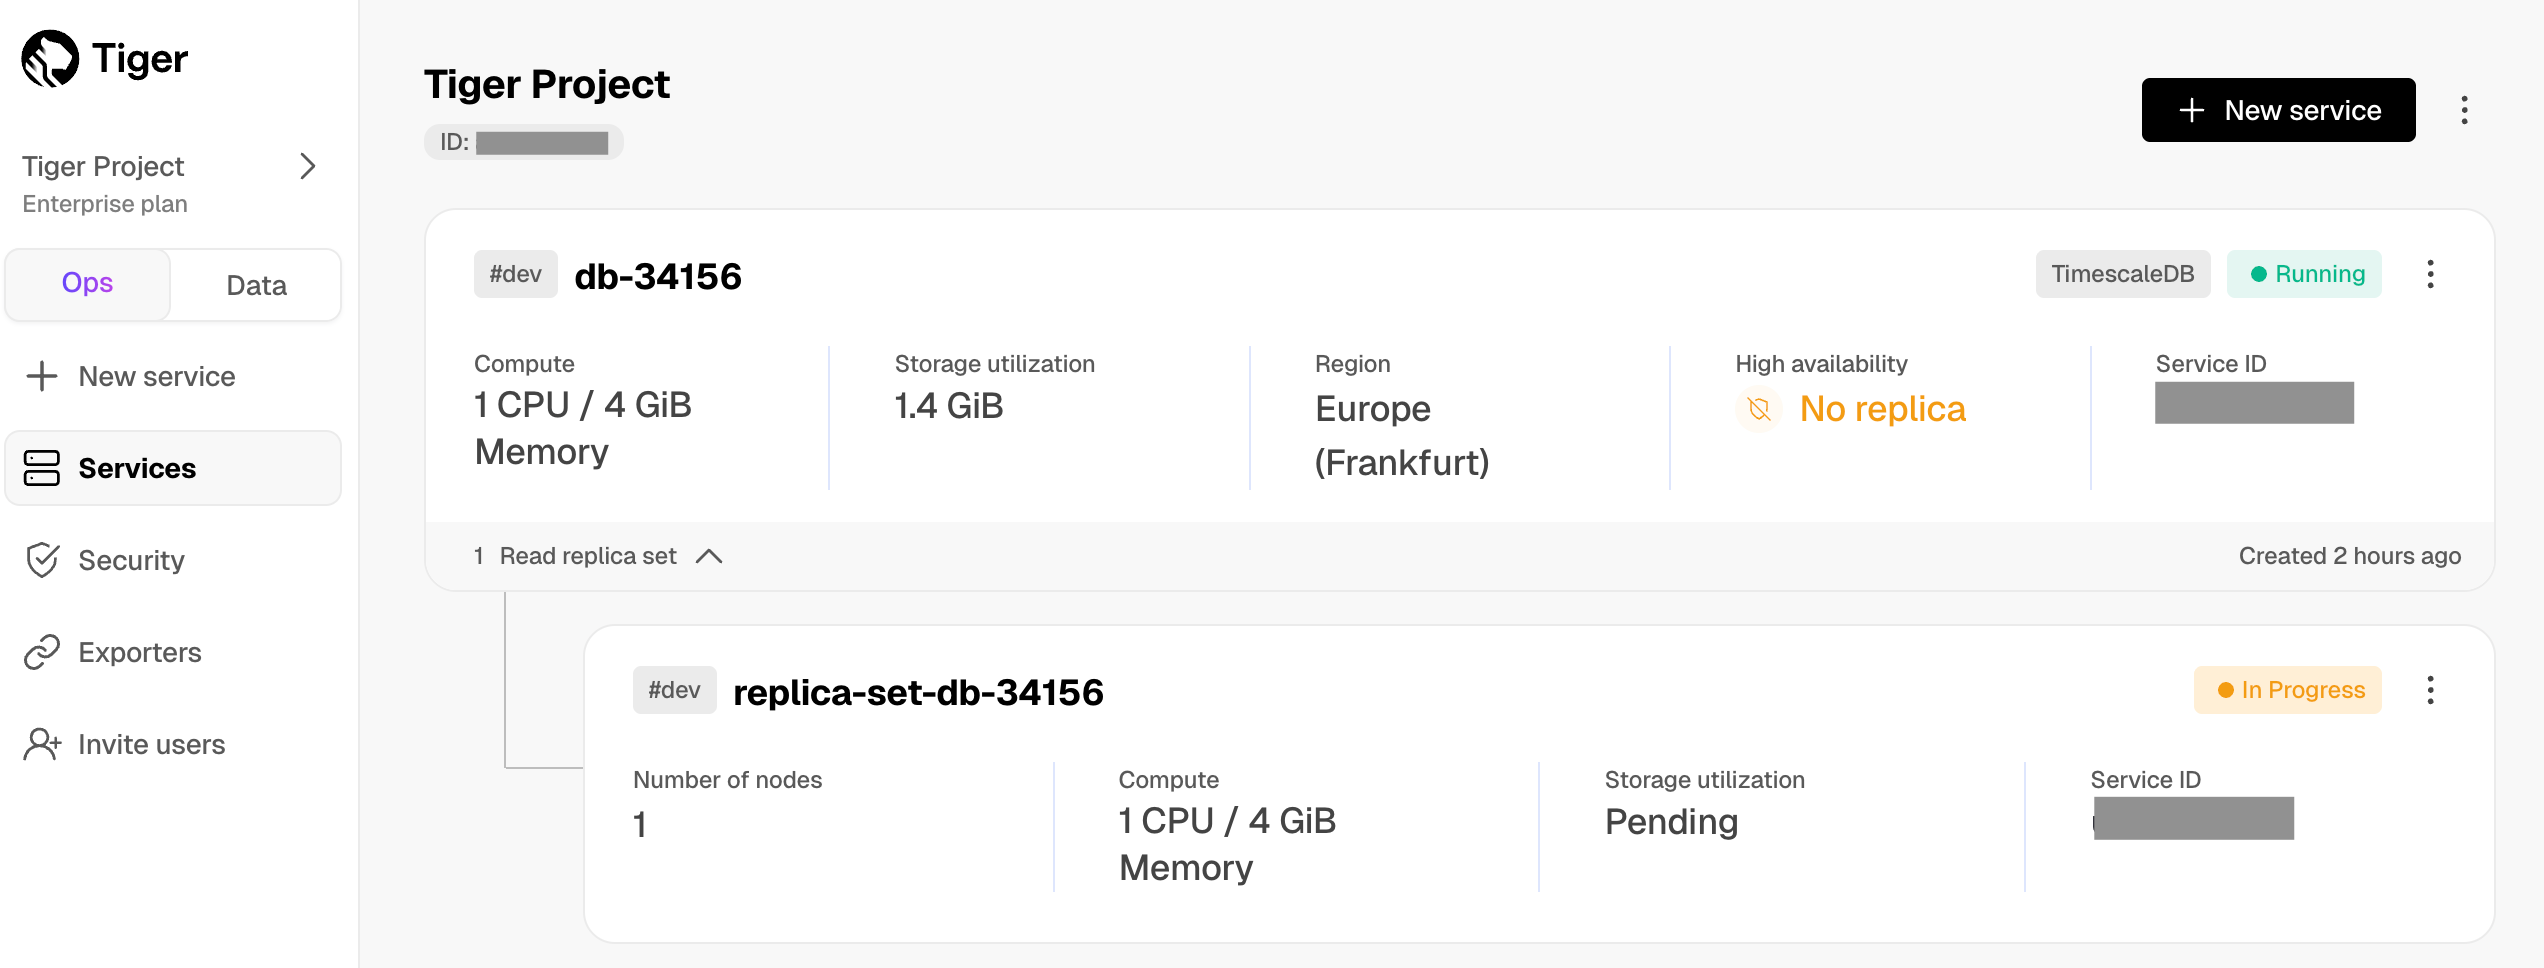 1. **Click `Operations` > `Compute and storage`** 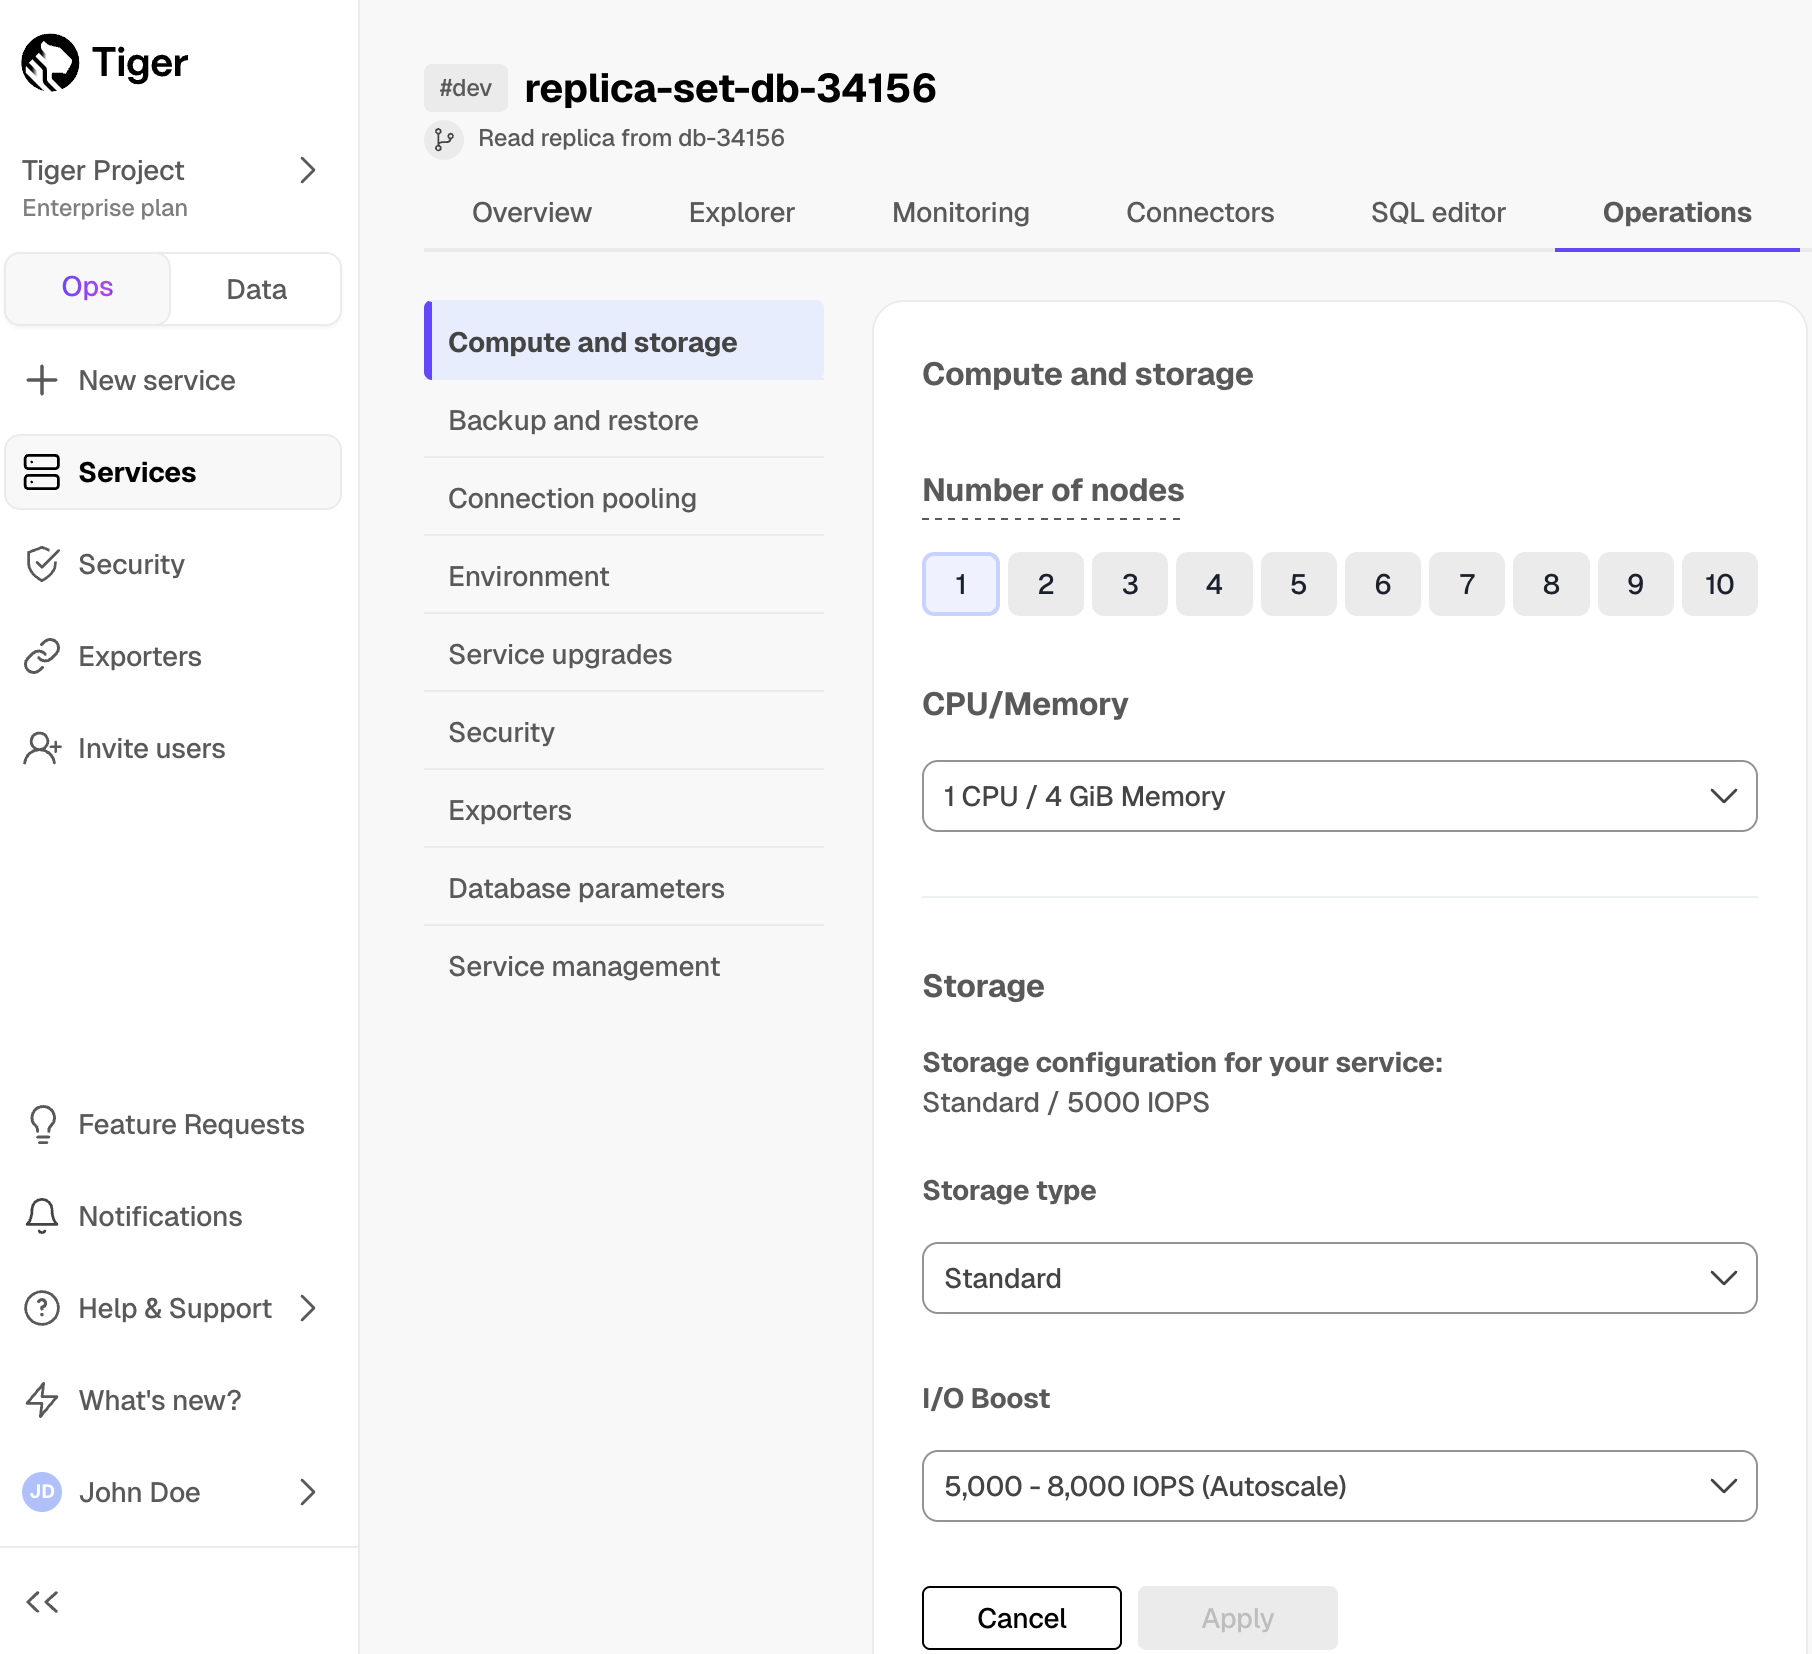 1. **Change the replica configuration and click `Apply`** ## Manage data lag for your read replica sets Read replica sets use asynchronous replication. This can cause a slight lag in data to the primary database instance. The lag is measured in bytes, against the current state of the primary instance. To check the status and lag for your read replica set: 1. **In [Tiger Cloud Console][timescale-console-services], select your primary service** 1. **Click `Operations` > `Read scaling`** You see a list of configured read replica sets for this service, including their status and lag: 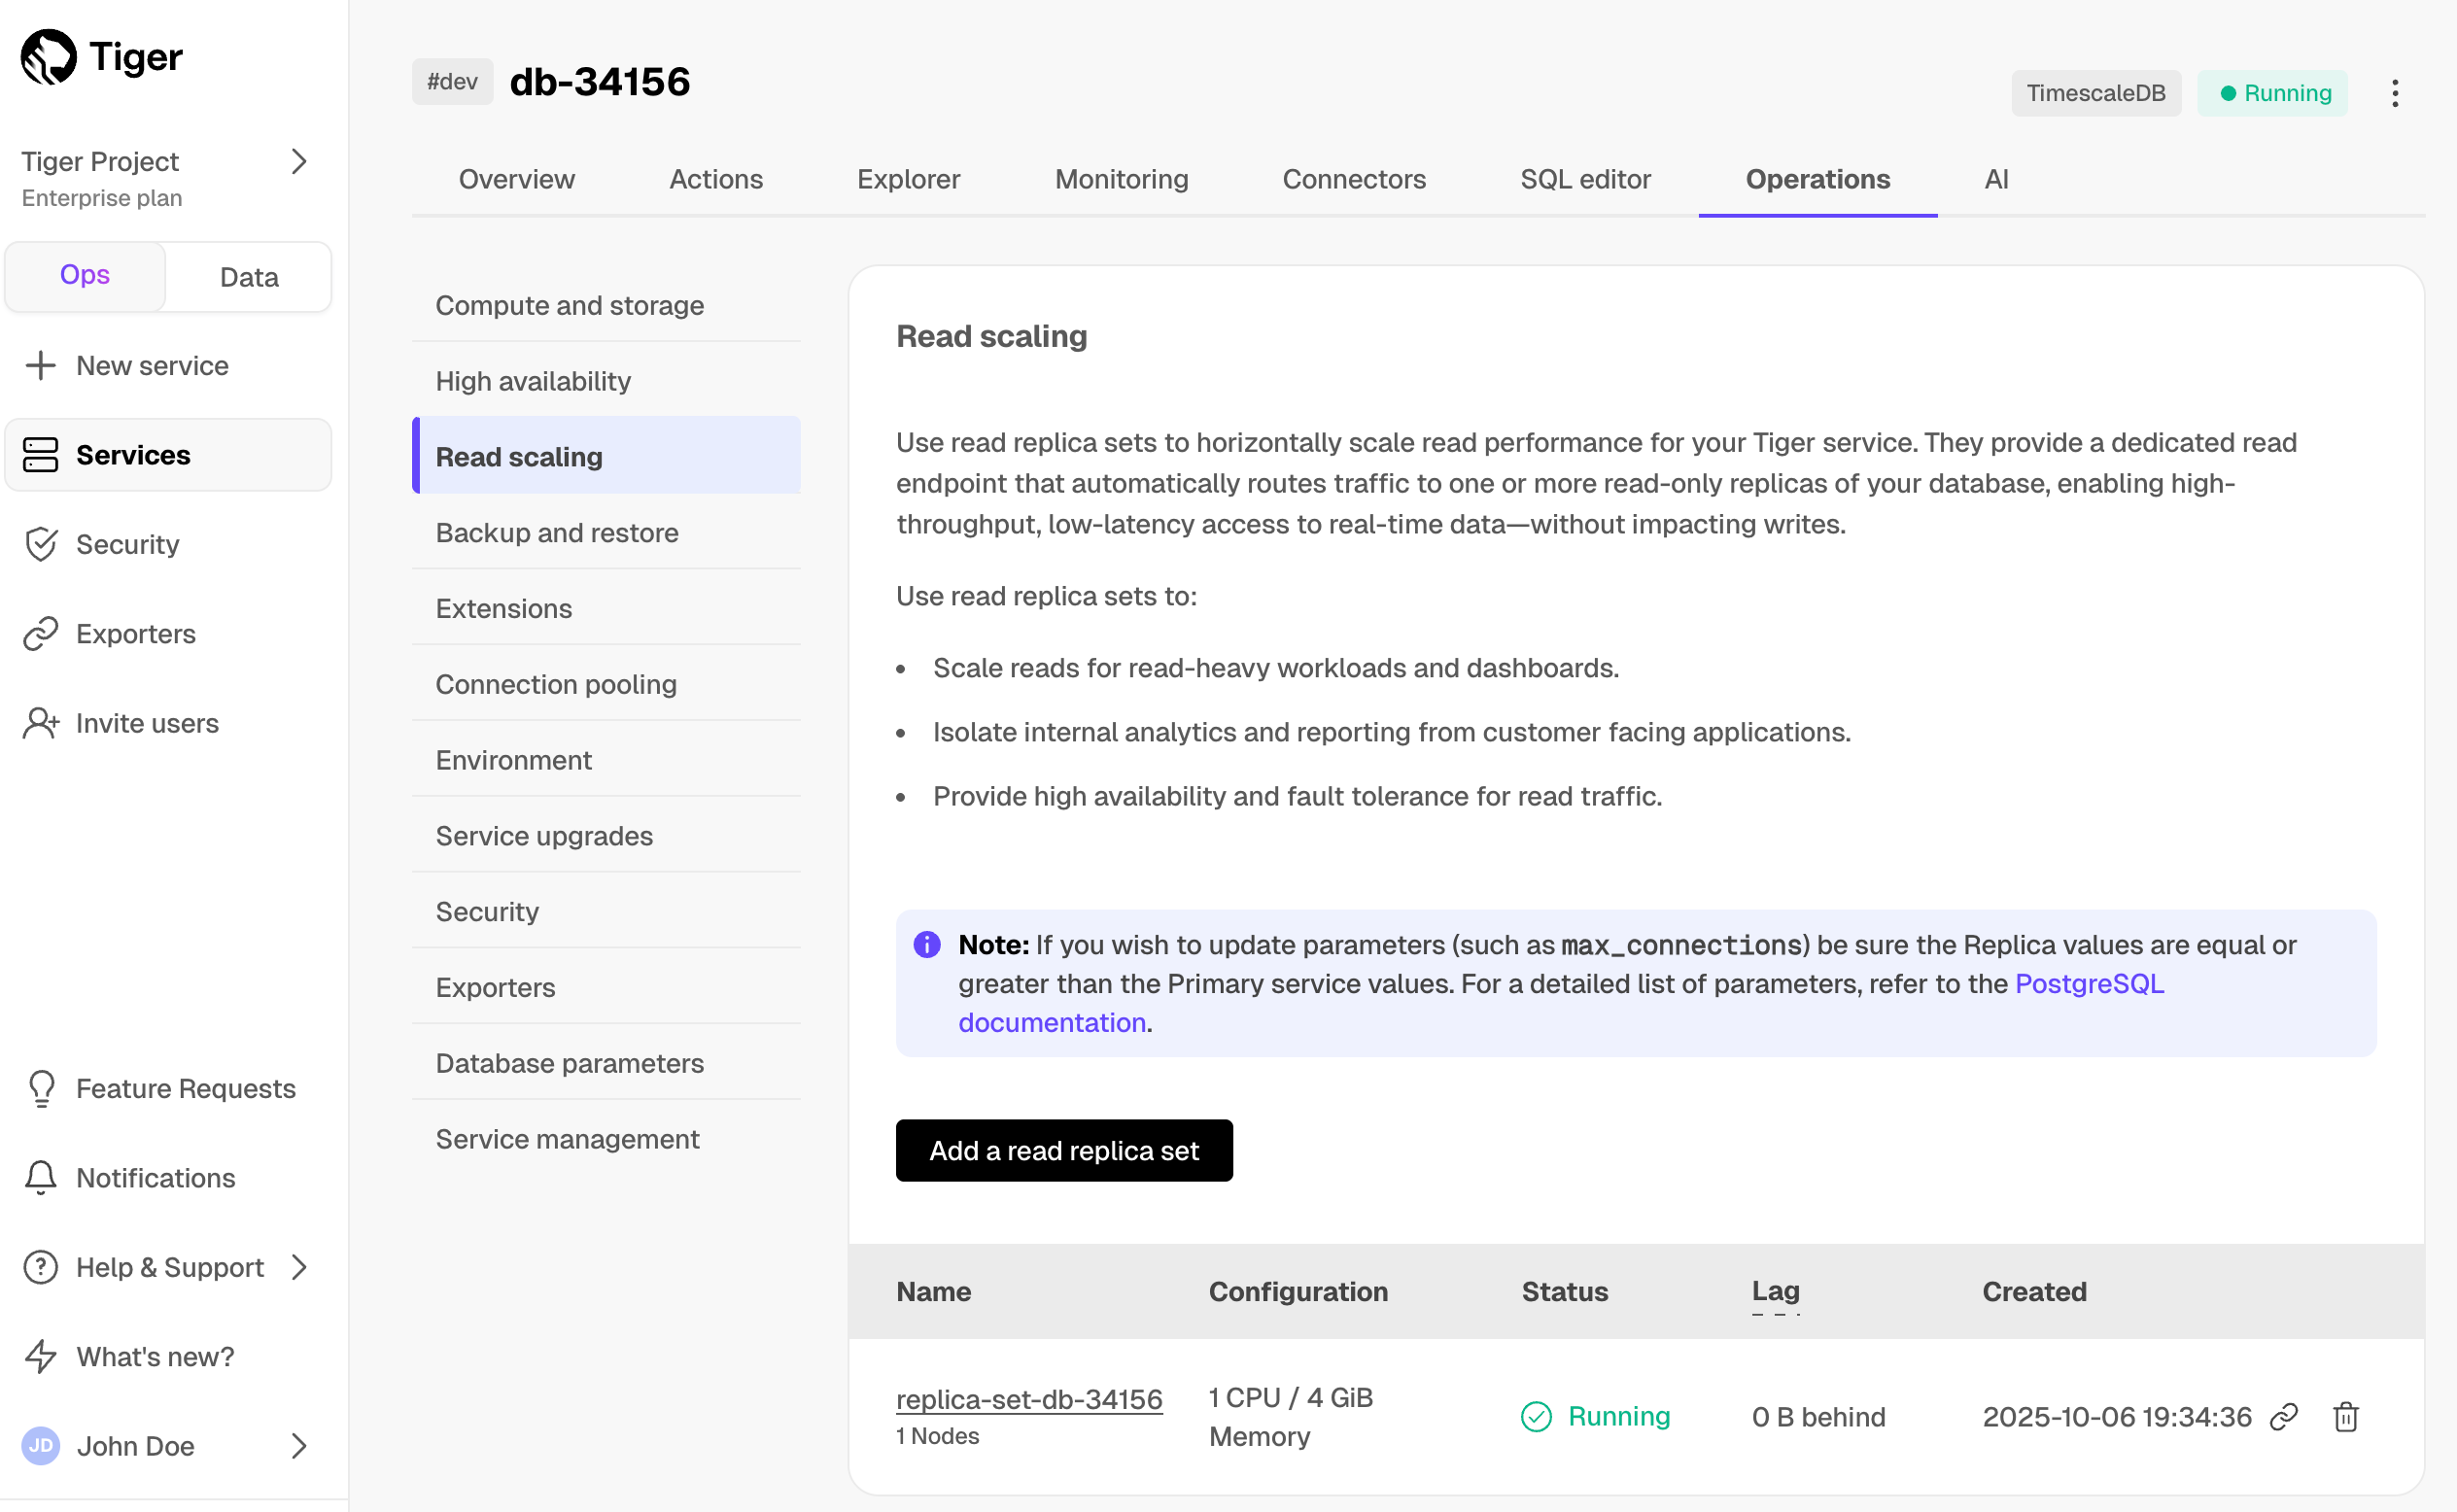 1. **Configure the allowable lag** 1. Select the replica set in the list. 1. Click `Operations` > `Database parameters`. 1. Adjust `max_standby_streaming_delay` and `max_standby_archive_delay`. This is not recommended for cases where changes must be immediately represented, for example, for user credentials. ## Delete a read replica set To delete a replica set: 1. **In [Tiger Cloud Console][timescale-console-services], select your primary service** 1. **Click `Operations` > `Read scaling`** 1. **Click the trash icon next to a replica set** Confirm the deletion when prompted. ===== PAGE: https://docs.tigerdata.com/use-timescale/ha-replicas/high-availability/ ===== # Manage high availability For Tiger Cloud services where every second of uptime matters, Tiger Cloud delivers High Availability (HA) replicas. These replicas safeguard your data and keep your service running smoothly, even in the face of unexpected failures. By minimizing downtime and protecting against data loss, HA replicas ensure business continuity and give you the confidence to operate without interruption, including during routine maintenance.  This page shows you how to choose the best high availability option for your service. ## What is HA replication? HA replicas are exact, up-to-date copies of your database hosted in multiple AWS availability zones (AZ) within the same region as your primary node. They automatically take over operations if the original primary data node becomes unavailable. The primary node streams its write-ahead log (WAL) to the replicas to minimize the chances of data loss during failover. HA replicas can be synchronous and asynchronous. - Synchronous: the primary commits its next write once the replica confirms that the previous write is complete. There is no lag between the primary and the replica. They are in the same state at all times. This is preferable if you need the highest level of data integrity. However, this affects the primary ingestion time. - Asynchronous: the primary commits its next write without the confirmation of the previous write completion. The asynchronous HA replicas often have a lag, in both time and data, compared to the primary. This is preferable if you need the shortest primary ingest time. 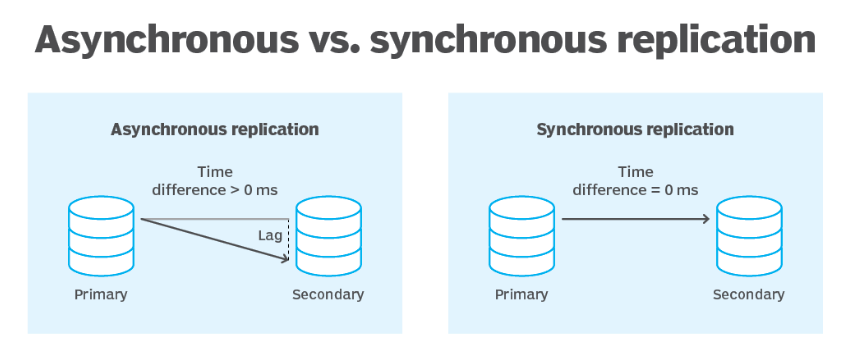 HA replicas have separate unique addresses that you can use to serve read-only requests in parallel to your primary data node. When your primary data node fails, Tiger Cloud automatically fails over to an HA replica within 30 seconds. During failover, the read-only address is unavailable while Tiger Cloud automatically creates a new HA replica. The time to make this replica depends on several factors, including the size of your data. Operations such as upgrading your service to a new major or minor version may necessitate a service restart. Restarts are run during the [maintenance window][upgrade]. To avoid any downtime, each data node is updated in turn. That is, while the primary data node is updated, a replica is promoted to primary. After the primary is updated and online, the same maintenance is performed on the HA replicas. To ensure that all services have minimum downtime and data loss in the most common failure scenarios and during maintenance, [rapid recovery][rapid-recovery] is enabled by default for all services. ## Choose an HA strategy The following HA configurations are available in Tiger Cloud: - **Non-production**: no replica, best for developer environments. - **High availability**: a single async replica in a different AWS availability zone from your primary. Provides high availability with cost efficiency. Best for production apps. - **Highest availability**: two replicas in different AWS availability zones from your primary. Available replication modes are: - **High performance** - two async replicas. Provides the highest level of availability with two AZs and the ability to query the HA system. Best for apps where service availability is most critical. - **High data integrity** - one sync replica and one async replica. The sync replica is identical to the primary at all times. Best for apps that can tolerate no data loss. The following table summarizes the differences between these HA configurations: || High availability <br/> (1 async) | High performance <br/> (2 async) | High data integrity <br/> (1 sync + 1 async) | |-------|----------|------------|-----| |Write flow |The primary streams its WAL to the async replica, which may have a slight lag compared to the primary, providing 99.9% uptime SLA. |The primary streams its writes to both async replicas, providing 99.9+% uptime SLA.|The primary streams its writes to the sync and async replicas. The async replica is never ahead of the sync one.| |Additional read replica|Recommended. Reads from the HA replica may cause availability and lag issues. |Not needed. You can still read from the HA replica even if one of them is down. Configure an additional read replica only if your read use case is significantly different from your write use case.|Highly recommended. If you run heavy queries on a sync replica, it may fall behind the primary. Specifically, if it takes too long for the replica to confirm a transaction, the next transaction is canceled.| |Choosing the replica to read from manually| Not applicable. |Not available. Queries are load-balanced against all available HA replicas. |Not available. Queries are load-balanced against all available HA replicas.| | Sync replication | Only async replicas are supported in this configuration. |Only async replicas are supported in this configuration. | Supported.| | Failover flow | <ul><li>If the primary fails, the replica becomes the primary while a new node is created, with only seconds of downtime.</li><li>If the replica fails, a new async replica is created without impacting the primary. If you read from the async HA replica, those reads fail until the new replica is available.</li></ul> |<ul><li>If the primary fails, one of the replicas becomes the primary while a new node is created, with the other one still available for reads.</li><li>If the replica fails, a new async replica is created in another AZ, without impacting the primary. The newly created replica is behind the primary and the original replica while it catches up.</li></ul>|<ul><li>If the primary fails, the sync replica becomes the primary while a new node is created, with the async one still available for reads.</li><li>If the async replica fails, a new async replica is created. Heavy reads on the sync replica may delay the ingest time of the primary while a new async replica is created. Data integrity remains high but primary ingest performance may degrade.</li><li>If the sync replica fails, the async replica becomes the sync one, and a new async replica is created. The primary may experience some ingest performance degradation during this time.</li></ul>| | Cost composition | Primary + async (2x) |Primary + 2 async (3x)|Primary + 1 async + 1 sync (3x)| | Tier | Performance, Scale, and Enterprise |Scale and Enterprise|Scale and Enterprise| The `High` and `Highest` HA strategies are available with the [Scale and the Enterprise][pricing-plans] pricing plans. To enable HA for a service: 1. In [Tiger Cloud Console][cloud-login], select the service to enable replication for. 1. Click `Operations`, then select `High availability`. 1. Choose your replication strategy, then click `Change configuration`.  1. In `Change high availability configuration`, click `Change config`. To change your HA replica strategy, click `Change configuration`, choose a strategy and click `Change configuration`. To download the connection information for the HA replica, either click the link next to the replica `Active configuration`, or find the information in the `Overview` tab for this service. ## Test failover for your HA replicas To test the failover mechanism, you can trigger a switchover. A switchover is a safe operation that attempts a failover, and throws an error if the replica or primary is not in a state to safely switch. 1. Connect to your primary node as `tsdbadmin` or another user that is part of the `tsdbowner` group. You can also connect to the HA replica and check its node using this procedure. 1. At the `psql` prompt, connect to the `postgres` database: ```sql \c postgres ``` You should see `postgres=>` prompt. 1. Check if your node is currently in recovery: ```sql select pg_is_in_recovery(); ``` 1. Check which node is currently your primary: ```sql select * from pg_stat_replication; ``` Note the `application_name`. This is your service ID followed by the node. The important part is the `-an-0` or `-an-1`. 1. Schedule a switchover: ```sql CALL tscloud.cluster_switchover(); ``` By default, the switchover occurs in 30 secs. You can change the time by passing an interval, like this: ```sql CALL tscloud.cluster_switchover('15 seconds'::INTERVAL); ``` 1. Wait for the switchover to occur, then check which node is your primary: ```sql SELECT * FROM pg_stat_replication; ``` You should see a notice that your connection has been reset, like this: ```sql FATAL: terminating connection due to administrator command SSL connection has been closed unexpectedly The connection to the server was lost. Attempting reset: Succeeded. ``` 1. Check the `application_name`. If your primary was `-an-1` before, it should now be `-an-0`. If it was `-an-0`, it should now be `-an-1`. ===== PAGE: https://docs.tigerdata.com/use-timescale/data-tiering/tiered-data-replicas-forks/ ===== # Replicas and forks with tiered data There is one more thing that makes Tiered Storage even more amazing: when you keep data in the low-cost object storage tier, you pay for this data only once, regardless of whether you have a [high-availability replica][ha-replica] or [read replicas][read-replica] running in your service. We call this the savings multiplication effect of Tiered Storage. The same applies to [forks][operations-forking], which you can use, for example, for running tests or creating dev environments. When creating one (or more) forks, you won't be billed for data shared with the primary in the low-cost storage. If you decide to tier more data that's not in the primary, you will pay to store it in the low-cost tier, but you will still see substantial savings by moving that data from the high-performance tier of the fork to the cheaper object storage tier. ## How this works behind the scenes Once you tier data to the low-cost object storage tier, we keep a reference to that data on your Database's catalog. Creating a replica or forking a primary server only copies the references and the metadata we keep on the catalog for all tiered data. On the billing side, we only count and bill once for the data tiered, not for each reference there may exist towards that data. ## What happens when a chunk is dropped or untiered on a fork Dropping or untiering a chunk from a fork does not delete it from any other servers that reference the same chunk. You can have one, multiple or 0 servers referencing the same chunk of data: * That means that deleting data from a fork does not affect the other servers (including the primary); it just removes the reference to that data, which is for all intends and purposes equal to deleting that data from the point of view of that fork * The primary and other servers are unaffected, as they still have their references and the metadata on their catalogs intact * We never delete anything on the object storage tier if at least one server references it: The data is only permanently deleted (or hard deleted as we internally call this operation) once the references drop to 0 As described above, tiered chunks are only counted once for billing purposes, so dropping or untiering a chunk that is shared with other servers from a fork will not affect billing as it was never counted for billing purposes. Droping or untiering a chunk that was only tiered on that fork works as expected and is covered in more detail in the following section. ## What happens when a chunk is modified on a fork As a reminder, tiered data is immutable - there is no such thing as updating the data. You can untier or drop a chunk, in which case what is described in the previous section covers what happens. And you can tier new data, at which point a fork deviates from the primary in a similar way as all forks do. New data tiered are not shared with parent or sibling servers, this is new data tiered for that server and we count them as a new object for the purposes of billing. If you decide to tier more data that's not in the primary, you will pay to store it in the low-cost tier, but you will still see substantial savings by moving that data from the high-performance tier of the fork to the cheaper object storage tier. Similar to other types of storage tiers, this type of deviation can not happen for replicas as they have to be identical with the primary server, that's why we don't mention replicas when discussing about droping chunks or tiering additional data. ## What happens with backups and PITR As discussed above, we never delete anything on the object storage tier if at least one server references it. The data is only permanently deleted (or hard deleted as we internally call this operation) once the references drop to 0. In addition to that, we delay hard deleting the data by 14 days, so that in case of a restore or PITR, all tiered data will be available. In the case of such a restore, new references are added to the deleted tiered chunks, so they are not any more candidates for a hard deletion. Once 14 days pass after soft deleting the data,that is the number of references to the tiered data drop to 0, we hard delete the tiered data. ===== PAGE: https://docs.tigerdata.com/use-timescale/data-tiering/enabling-data-tiering/ ===== # Manage storage and tiering The tiered storage architecture in Tiger Cloud includes a high-performance storage tier and a low-cost object storage tier: - You use [high-performance storage][high-performance-storage] to store and query frequently accessed data. - You use [low-cost object storage][low-cost-storage] to cut costs by migrating rarely used data from the high-performance storage. After you enable tiered storage, you then either [create automated tiering policies][tiering-policies] or [manually tier and untier data][manual-tier]. You can query the data on the object storage tier, but you cannot modify it. Make sure that you are not tiering data that needs to be **actively modified**. For low-cost storage, Tiger Data charges only for the size of your data in S3 in the Apache Parquet format, regardless of whether it was compressed in Tiger Cloud before tiering. There are no additional expenses, such as data transfer or compute. ## High-performance storage tier By default, Tiger Cloud stores your service data in the standard high-performance storage. This storage tier comes in the standard and enhanced types. Enhanced storage is available under the [Enterprise pricing plan][pricing-plans] only. ### Standard high-performance storage This storage type gives you up to 16 TB of storage and is available under [all pricing plans][pricing-plans]. You change the IOPS value to better suit your needs in Tiger Cloud Console: 1. **In [Tiger Cloud Console][console], select your service, then click `Operations` > `Compute and storage`** By default, the type of high-performance storage is set to `Standard`. 1. **Select the IOPS value in the `I/O boost` dropdown** - Under the [Performance pricing plan][pricing-plans], IOPS is set to 3,000 - 5,000 autoscale and cannot be changed. - Under the [Scale and Enterprise pricing plans][pricing-plans], IOPS is set to 5,000 - 8,000 autoscale and can be upgraded to 16,000 IOPS. 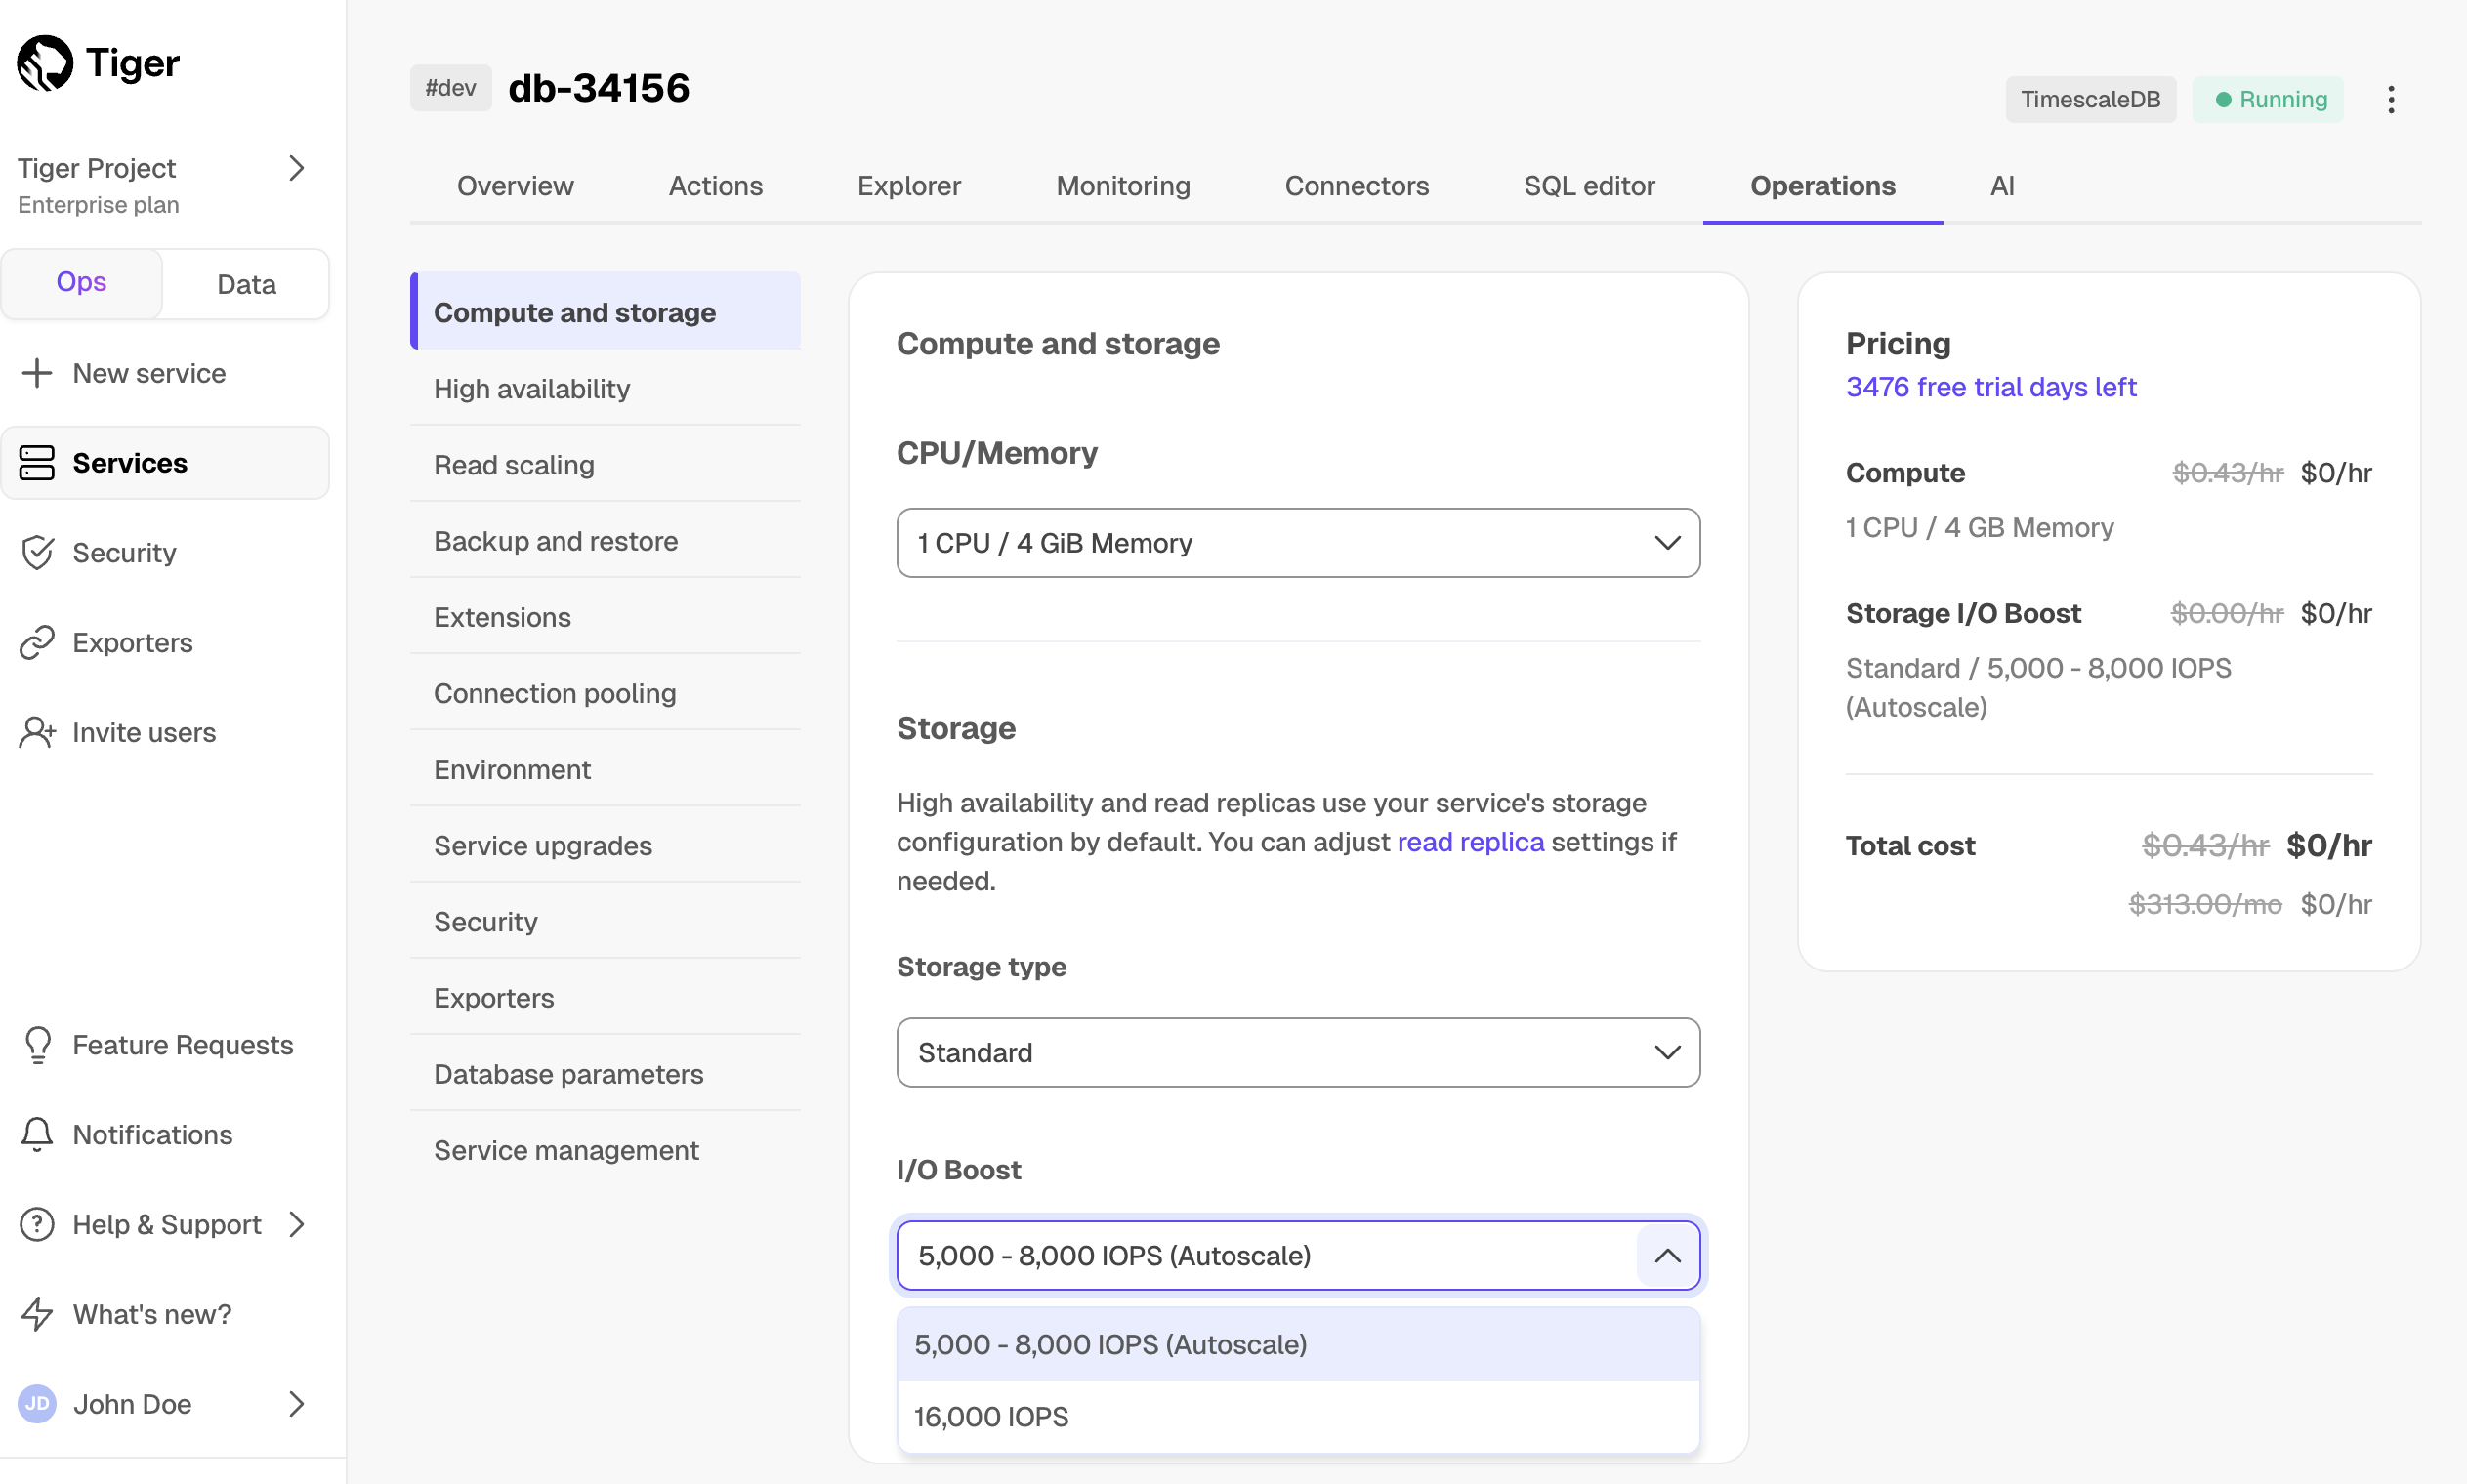 1. **Click `Apply`** ### Enhanced high-performance storage <Availability products={['cloud']} price_plans={['enterprise']} /> This storage type gives you up to 64 TB and 32,000 IOPS, and is available under the [Enterprise pricing plan][pricing-plans]. To get enhanced storage: 1. **In [Tiger Cloud Console][console], select your service, then click `Operations` > `Compute and storage`** 1. **Select `Enhanced` in the `Storage type` dropdown** 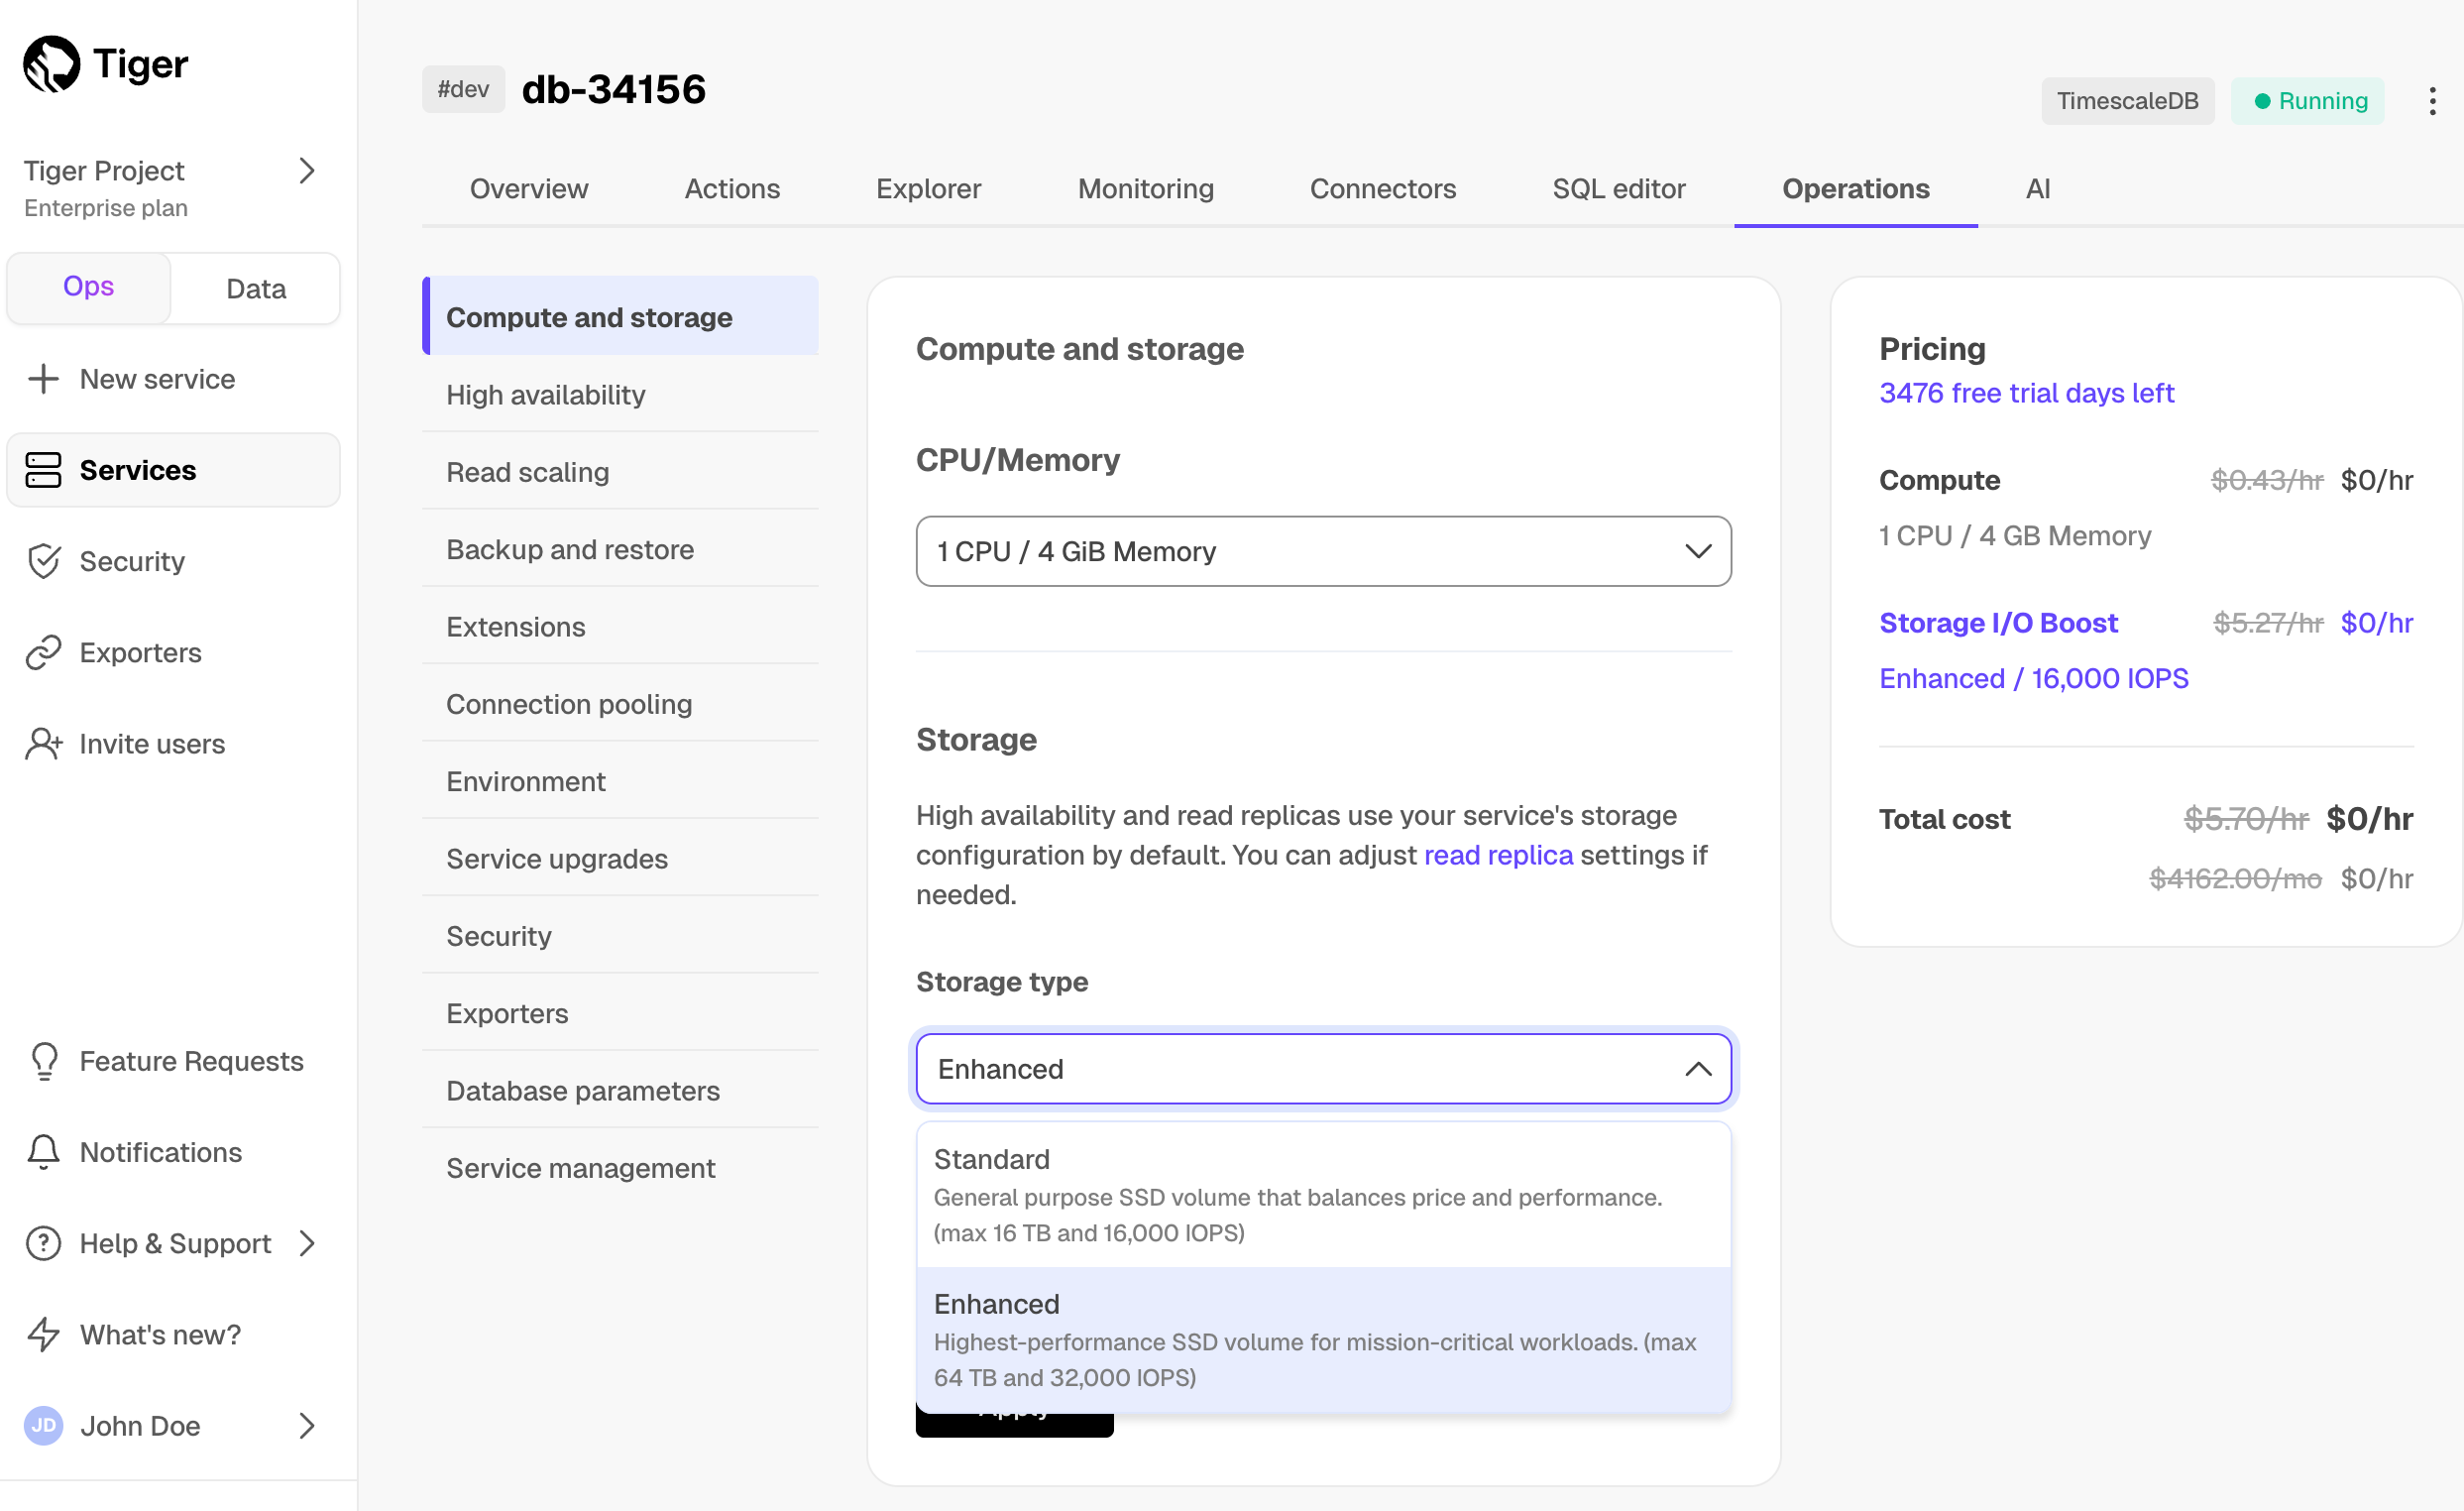 The enhanced storage is currently not available in `sa-east-1`. 1. **Select the IOPS value in the `I/O boost` dropdown** Select between 8,000, 16,000, 24,000, and 32,0000 IOPS. The value that you can apply depends on the number of CPUs in your service. Tiger Cloud Console notifies you if your selected IOPS requires increasing the number of CPUs. To increase IOPS to 64,000, click `Contact us` and we will be in touch to confirm the details. 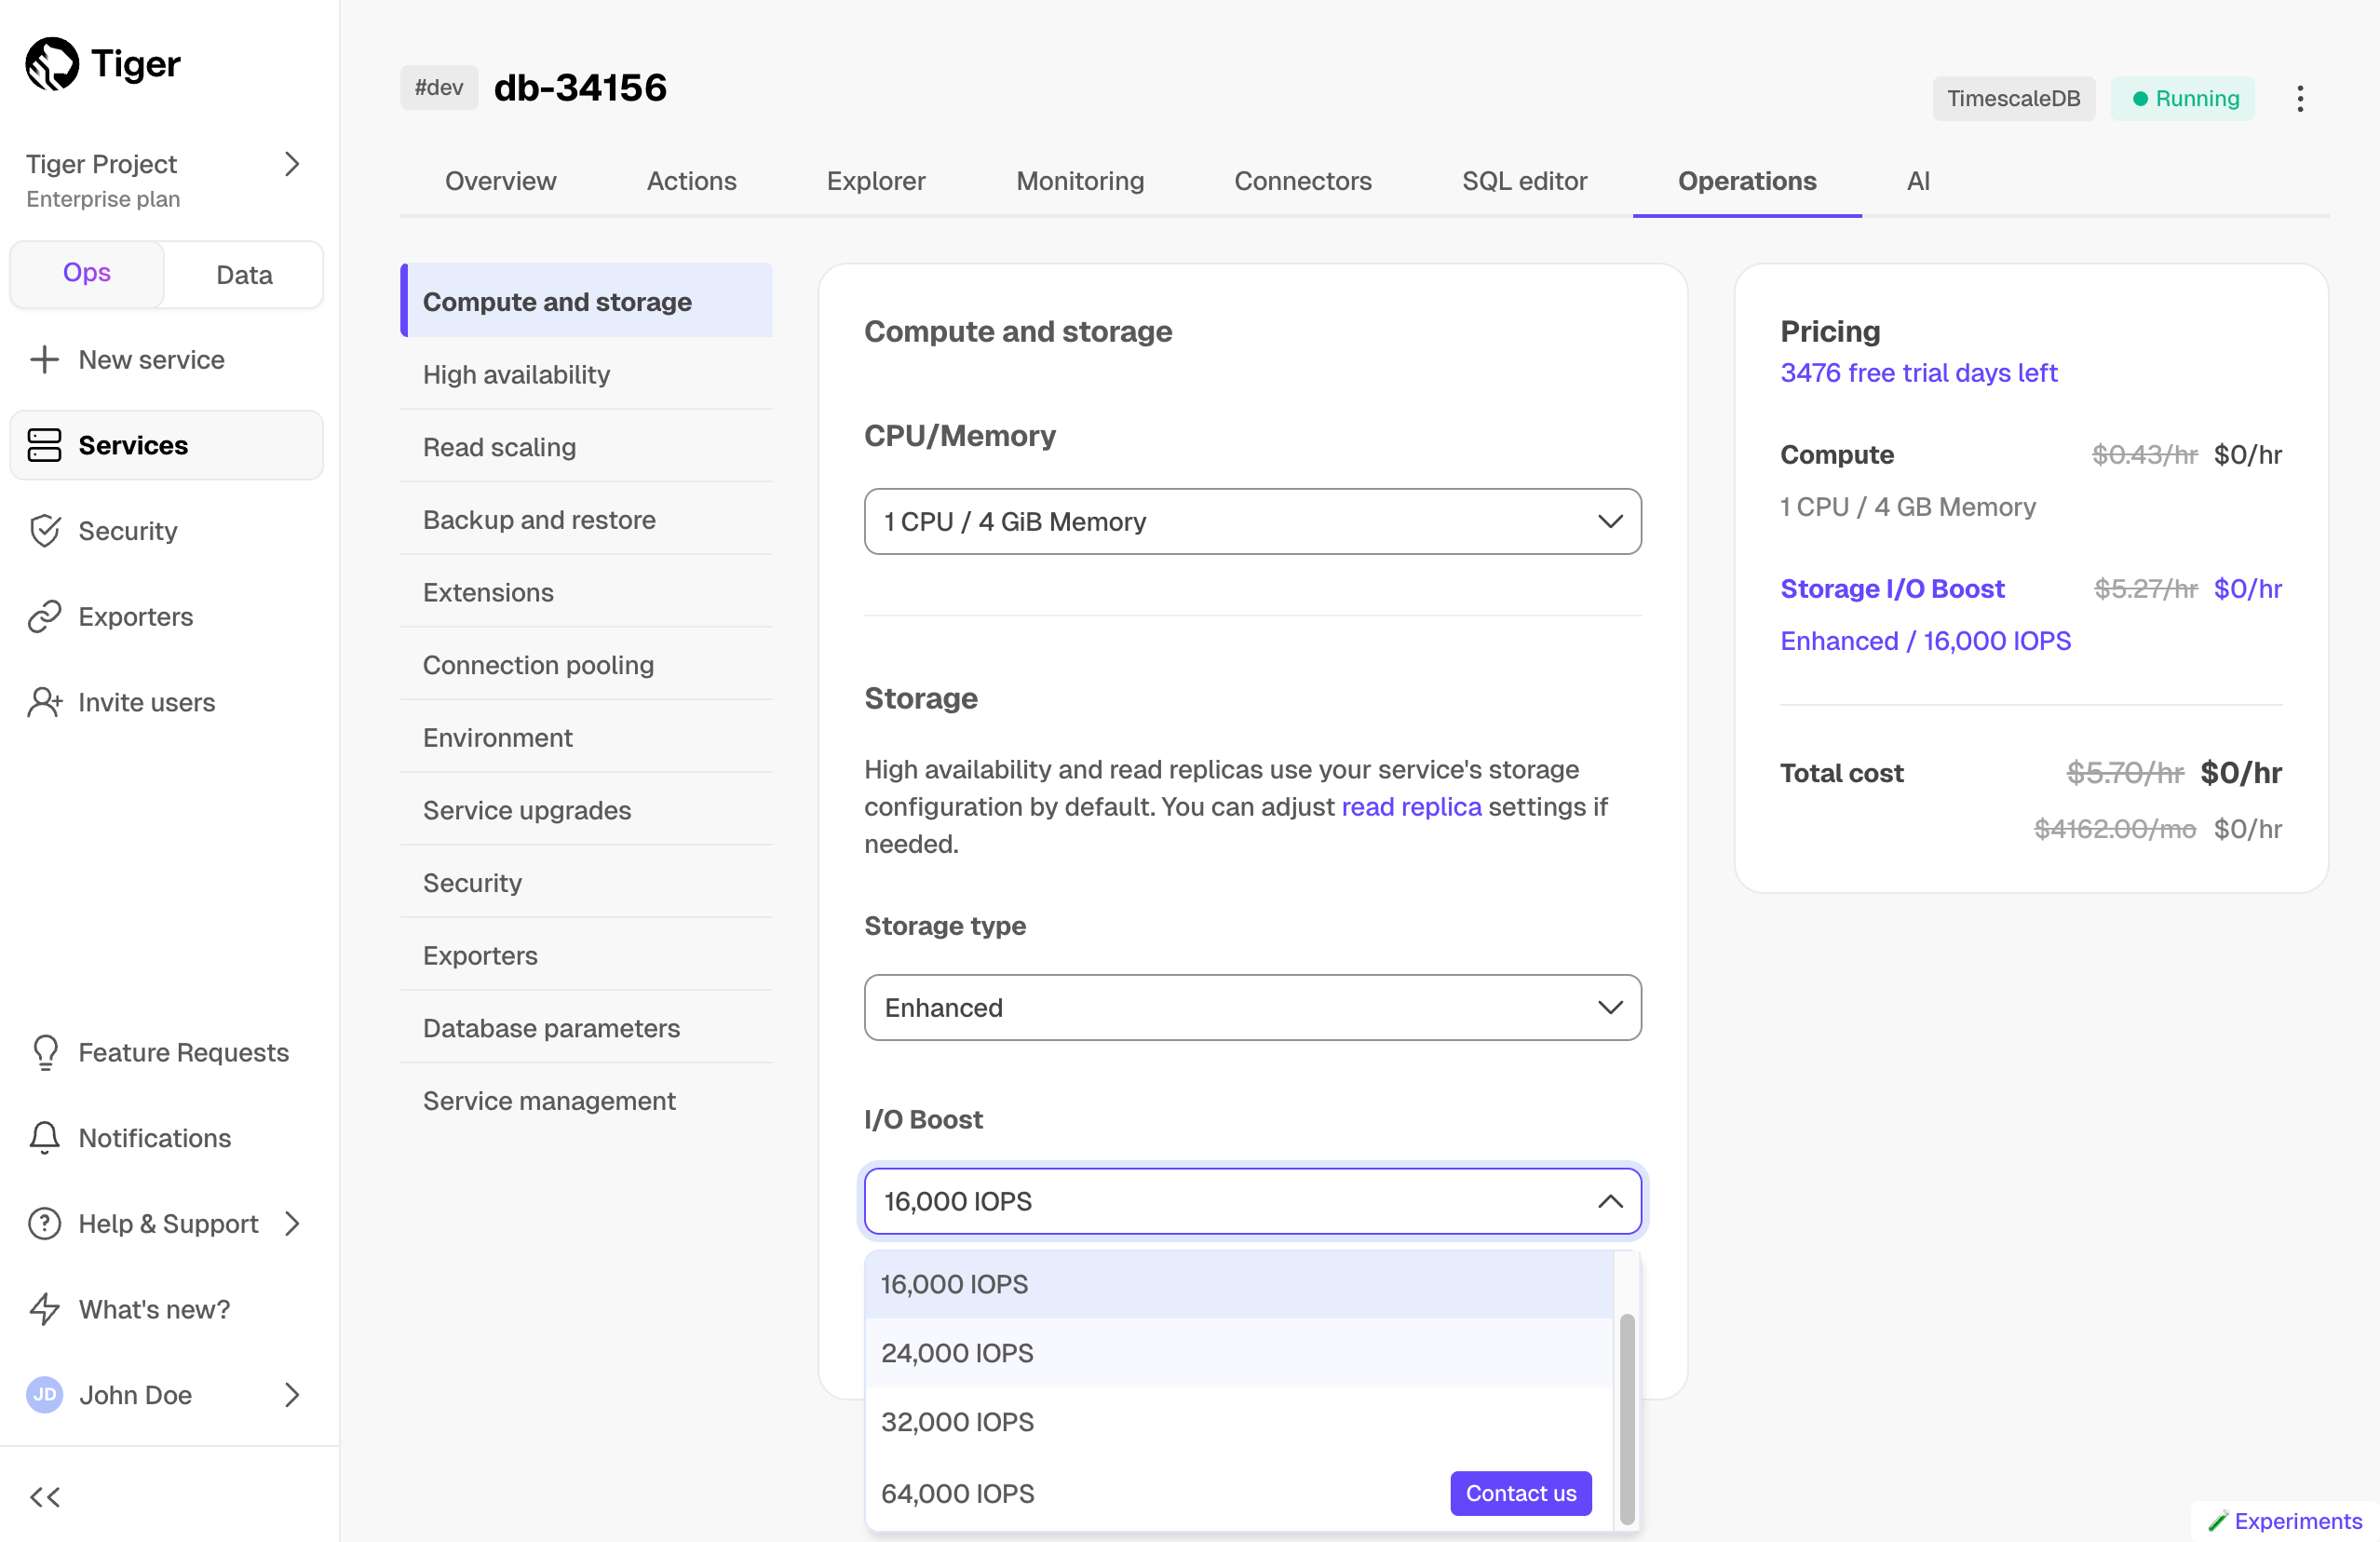 1. **Click `Apply`** You change from enhanced storage to standard in the same way. If you are using over 16 TB of enhanced storage, changing back to standard is not available until you shrink your data to be under 16 TB. You can make changes to the storage type and I/O boost settings without any downtime. Wait at least 6 hours to attempt another change. ## Low-cost object storage tier <Availability products={['cloud']} price_plans={['enterprise', 'scale']} /> You enable the low-cost object storage tier in Tiger Cloud Console and then tier the data with policies or manually. ### Enable tiered storage You enable tiered storage from the `Overview` tab in Tiger Cloud Console. 1. **In [Tiger Cloud Console][console], select the service to modify** 1. **In `Explorer`, click `Storage configuration` > `Tiering storage`, then click `Enable tiered storage`**  Once enabled, you can proceed to [tier data manually][manual-tier] or [set up tiering policies][tiering-policies]. When tiered storage is enabled, you see the amount of data in the tiered object storage. ### Automate tiering with policies A tiering policy automatically moves any chunks that only contain data older than the `move_after` threshold to the object storage tier. This works similarly to a [data retention policy][data-retention], but chunks are moved rather than deleted. A tiering policy schedules a job that runs periodically to asynchronously migrate eligible chunks to object storage. Chunks are considered tiered once they appear in the `timescaledb_osm.tiered_chunks` view. You can add tiering policies to [hypertables][hypertable], including [continuous aggregates][caggs]. To manage tiering policies, [connect to your service][connect-to-service] and run the queries below in the data mode, the SQL editor, or using `psql`. #### Add a tiering policy To add a tiering policy, call `add_tiering_policy`:sql SELECT add_tiering_policy(hypertable REGCLASS, move_after INTERVAL, if_not_exists BOOL = false);
For example, to tier chunks that are more than three days old in the `example` [hypertable][hypertable]:sql SELECT add_tiering_policy('example', INTERVAL '3 days');
By default, a tiering policy runs hourly on your database. To change this interval, call `alter_job`. #### Remove a tiering policy To remove an existing tiering policy, call `remove_tiering_policy`:sql SELECT remove_tiering_policy(hypertable REGCLASS, if_exists BOOL = false);
For example, to remove the tiering policy from the `example` hypertable:sql SELECT remove_tiering_policy('example');
If you remove a tiering policy, the remaining scheduled chunks are not tiered. However, chunks in tiered storage are not untiered. You [untier chunks manually][manual-tier] to local storage. ### Manually tier and untier chunks If tiering policies do not meet your current needs, you can tier and untier chunks manually. To do so, [connect to your service][connect-to-service] and run the queries below in the data mode, the SQL editor, or using `psql`. #### Tier chunks Tiering a chunk is an asynchronous process that schedules the chunk to be tiered. In the following example, you tier chunks older than three days in the `example` hypertable. You then list the tiered chunks. 1. **Select all chunks in `example` that are older than three days:**sql SELECT show_chunks('example', older_than => INTERVAL '3 days');
This returns a list of chunks. Take a note of the chunk names:sql _timescaledb_internal._hyper_1_1_chunk _timescaledb_internal._hyper_1_2_chunk
1. **Call `tier_chunk` to manually tier each chunk:**sql SELECT tier_chunk('_timescaledb_internal._hyper_1_1_chunk');
1. **Repeat for all chunks you want to tier.** Tiering a chunk schedules it for migration to the object storage tier, but the migration won't happen immediately. Chunks are tiered one at a time in order to minimize database resource consumption. A chunk is marked as migrated and deleted from the standard storage only after it has been durably stored in the object storage tier. You can continue to query a chunk during migration. 1. **To see which chunks are tiered into the object storage tier, use the `tiered_chunks` informational view:** ```sql SELECT * FROM timescaledb_osm.tiered_chunks; ``` To see which chunks are scheduled for tiering either by policy or by a manual call, but have not yet been tiered, use this view:sql SELECT * FROM timescaledb_osm.chunks_queued_for_tiering ;
#### Untier chunks To update data in a tiered chunk, move it back to the standard high-performance storage tier in Tiger Cloud. Untiering chunks is a synchronous process. Chunks are renamed when the data is untiered. To untier a chunk, call the `untier_chunk` stored procedure. 1. **Check which chunks are currently tiered:** ```sql SELECT * FROM timescaledb_osm.tiered_chunks ; ``` Sample output: ```sql hypertable_schema | hypertable_name | chunk_name | range_start | range_end -------------------+-----------------+------------------+------------------------+------------------------ public | sample | _hyper_1_1_chunk | 2023-02-16 00:00:00+00 | 2023-02-23 00:00:00+00 (1 row) ``` 1. **Call `untier_chunk`**: ```sql CALL untier_chunk('_hyper_1_1_chunk'); ``` 1. **See the details of the chunk with `timescaledb_information.chunks`**: ```sql SELECT * FROM timescaledb_information.chunks; ``` Sample output: ```sql -[ RECORD 1 ]----------+------------------------- hypertable_schema | public hypertable_name | sample chunk_schema | _timescaledb_internal chunk_name | _hyper_1_4_chunk primary_dimension | ts primary_dimension_type | timestamp with time zone range_start | 2023-02-16 00:00:00+00 range_end | 2020-03-23 00:00:00+00 range_start_integer | range_end_integer | is_compressed | f chunk_tablespace | data_nodes | ``` ### Disable tiering If you no longer want to use tiered storage for a particular hypertable, drop the associated metadata by calling `disable_tiering`. 1. **To drop all tiering policies associated with a table, call `remove_tiering_policy`**. 1. **Make sure that there is no tiered data associated with this hypertable**: 1. List the tiered chunks associated with this hypertable: ```sql select * from timescaledb_osm.tiered_chunks ``` 1. If you have any tiered chunks, either untier this data, or drop these chunks from tiered storage. 1. **Use `disable_tiering` to drop all tiering-related metadata for the hypertable**:sql select disable_tiering('my_hypertable_name');
1. **Verify that tiering has been disabled by listing the hypertables that have tiering enabled**:sql select * from timescaledb_osm.tiered_hypertables;
===== PAGE: https://docs.tigerdata.com/use-timescale/data-tiering/querying-tiered-data/ ===== # Querying Tiered Data Once rarely used data is tiered and migrated to the object storage tier, it can still be queried with standard SQL by enabling the `timescaledb.enable_tiered_reads` GUC. By default, the GUC is set to `false`, so that queries do not touch tiered data. The `timescaledb.enable_tiered_reads` GUC, or Grand Unified Configuration variable, is a setting that controls if tiered data is queried. The configuration variable can be set at different levels, including globally for the entire database server, for individual databases, and for individual sessions. With tiered reads enabled, you can query your data normally even when it's distributed across different storage tiers. Your hypertable is spread across the tiers, so queries and `JOIN`s work and fetch the same data as usual. By default, tiered data is not accessed by queries. Querying tiered data may slow down query performance as the data is not stored locally on the high-performance storage tier. See [Performance considerations](#performance-considerations). ## Enable querying tiered data for a single query 1. Enable `timescaledb.enable_tiered_reads` before querying the hypertable with tiered data and reset it after it is complete:sql set timescaledb.enable_tiered_reads = true; SELECT count(*) FROM example; set timescaledb.enable_tiered_reads = false;
This queries data from all chunks including tiered chunks and non tiered chunks: ```sql ||count| |---| |1000| ``` ## Enable querying tiered data for a single session All future queries within a session can be enabled to use the object storage tier by enabling `timescaledb.enable_tiered_reads` within a session. 1. Enable `timescaledb.enable_tiered_reads` for an entire session: ```sql set timescaledb.enable_tiered_reads = true; ``` All future queries in that session are configured to read from tiered data and locally stored data. ## Enable querying tiered data in all future sessions You can also enable queries to read from tiered data always by following these steps: 1. Enable `timescaledb.enable_tiered_reads` for all future sessions:sql alter database tsdb set timescaledb.enable_tiered_reads = true;
In all future created sessions, `timescaledb.enable_tiered_reads` initializes with `enabled`. ## Query data in the object storage tier This section illustrates how querying tiered storage works. Consider a simple database with a standard `devices` table and a `metrics` hypertable. After enabling tiered storage, you can see which chunks are tiered to the object storage tier:sql
chunk_name | range_start | range_end------------------+------------------------+------------------------ _hyper_2_4_chunk | 2015-12-31 00:00:00+00 | 2016-01-07 00:00:00+00 _hyper_2_3_chunk | 2017-08-17 00:00:00+00 | 2017-08-24 00:00:00+00 (2 rows)
The following query fetches data only from the object storage tier. This makes sense based on the `WHERE` clause specified by the query and the chunk ranges listed above for this hypertable.sql EXPLAIN SELECT * FROM metrics where ts < '2017-01-01 00:00+00';
QUERY PLAN
Foreign Scan on osm_chunk_2 (cost=0.00..0.00 rows=2 width=20) Filter: (ts < '2017-01-01 00:00:00'::timestamp without time zone) Match tiered objects: 1 Row Groups:
_timescaledb_internal._hyper_2_4_chunk: 0(5 rows)
If your query does not need to touch the object storage tier, it will only process the chunks in the standard storage. The following query refers to newer data that is not yet tiered to the object storage tier. `Match tiered objects :0 ` in the plan indicates that no tiered data matches the query constraint. So data in the object storage is not touched at all.sql EXPLAIN SELECT * FROM metrics where ts > '2022-01-01 00:00+00';
QUERY PLAN
Append (cost=0.15..25.02 rows=568 width=20) -> Index Scan using _hyper_2_5_chunk_metrics_ts_idx on _hyper_2_5_chunk (co st=0.15..22.18 rows=567 width=20)
Index Cond: (ts > '2022-01-01 00:00:00'::timestamp without time zone)-> Foreign Scan on osm_chunk_2 (cost=0.00..0.00 rows=1 width=20)
Filter: (ts > '2022-01-01 00:00:00'::timestamp without time zone) Match tiered objects: 0 Row Groups:(7 rows)
Here is another example with a `JOIN` that does not touch tiered data:sql EXPLAIN SELECT ts, device_id, description FROM metrics JOIN devices ON metrics.device_id = devices.id WHERE metrics.ts > '2023-08-01';
QUERY PLAN
Hash Join (cost=32.12..184.55 rows=3607 width=44) Hash Cond: (devices.id = _hyper_4_9_chunk.device_id) -> Seq Scan on devices (cost=0.00..22.70 rows=1270 width=36) -> Hash (cost=25.02..25.02 rows=568 width=12)
-> Append (cost=0.15..25.02 rows=568 width=12) -> Index Scan using _hyper_4_9_chunk_metrics_ts_idx on _hyper_4_9_chunk (cost=0.15..22.18 rows=567 width=12)
Index Cond: (ts > '2023-08-01 00:00:00+00'::timestamp withtime zone)
-> Foreign Scan on osm_chunk_3 (cost=0.00..0.00 rows=1 width=12)
Filter: (ts > '2023-08-01 00:00:00+00'::timestamp with timezone)
Match tiered objects: 0 Row Groups:(11 rows)
## Performance considerations Queries over tiered data are expected to be slower than over local data. However, in a limited number of scenarios tiered reads can impact query planning time over local data as well. In order to prevent any unexpected performance degradation for application queries, we keep the GUC `timescaledb.enable_tiered_reads` set to `false`. * Queries without time boundaries specified are expected to perform slower when querying tiered data, both during query planning and during query execution. TimescaleDBs chunk exclusion algorithms cannot be applied for this case.sql SELECT * FROM device_readings WHERE id = 10;
* Queries with predicates computed at runtime (such as `NOW()`) are not always optimized at planning time and as a result might perform slower than statically assigned values when querying against the object storage tier. For example, this query is optimized at planning time:sql SELECT * FROM metrics WHERE ts > '2023-01-01' AND ts < '2023-02-01'
The following query does not do chunk pruning at query planning time:sql SELECT * FROM metrics WHERE ts < now() - '10 days':: interval
At the moment, queries against tiered data work best when the query optimizer can apply planning time optimizations. * Text and non-native types (JSON, JSONB, GIS) filtering is slower when querying tiered data. ===== PAGE: https://docs.tigerdata.com/use-timescale/data-tiering/about-data-tiering/ ===== # About Tiger Cloud storage tiers The tiered storage architecture in Tiger Cloud includes a high-performance storage tier and a low-cost object storage tier. You use the high-performance tier for data that requires quick access, and the object tier for rarely used historical data. Tiering policies move older data asynchronously and periodically from high-performance to low-cost storage, sparing you the need to do it manually. Chunks from a single hypertable, including compressed chunks, can stretch across these two storage tiers.  ## High-performance storage High-performance storage is where your data is stored by default, until you [enable tiered storage][manage-tiering] and [move older data to the low-cost tier][move-data]. In the high-performance storage, your data is stored in the block format and optimized for frequent querying. The [hypercore row-columnar storage engine][hypercore] available in this tier is designed specifically for real-time analytics. It enables you to compress the data in the high-performance storage by up to 90%, while improving performance. Coupled with other optimizations, Tiger Cloud high-performance storage makes sure your data is always accessible and your queries run at lightning speed. Tiger Cloud high-performance storage comes in the following types: - **Standard** (default): based on [AWS EBS gp3][aws-gp3] and designed for general workloads. Provides up to 16 TB of storage and 16,000 IOPS. - **Enhanced**: based on [EBS io2][ebs-io2] and designed for high-scale, high-throughput workloads. Provides up to 64 TB of storage and 32,000 IOPS. [See the differences][aws-storage-types] in the underlying AWS storage. You [enable enhanced storage][enable-enhanced] as needed in Tiger Cloud Console. ## Low-cost storage <Availability products={['cloud']} price_plans={['enterprise', 'scale']} /> Once you [enable tiered storage][manage-tiering], you can start moving rarely used data to the object tier. The object tier is based on AWS S3 and stores your data in the [Apache Parquet][parquet] format. Within a Parquet file, a set of rows is grouped together to form a row group. Within a row group, values for a single column across multiple rows are stored together. The original size of the data in your service, compressed or uncompressed, does not correspond directly to its size in S3. A compressed hypertable may even take more space in S3 than it does in Tiger Cloud. Apache Parquet allows for more efficient scans across longer time periods, and Tiger Cloud uses other metadata and query optimizations to reduce the amount of data that needs to be fetched to satisfy a query, such as: - **Chunk skipping**: exclude the chunks that fall outside the query time window. - **Row group skipping**: identify the row groups within the Parquet object that satisfy the query. - **Column skipping**: fetch only columns that are requested by the query. The following query is against a tiered dataset and illustrates the optimizations:sql EXPLAIN ANALYZE SELECT count(*) FROM ( SELECT device_uuid, sensor_id FROM public.device_readings WHERE observed_at > '2023-08-28 00:00+00' and observed_at < '2023-08-29 00:00+00' GROUP BY device_uuid, sensor_id ) q;
QUERY PLAN
Aggregate (cost=7277226.78..7277226.79 rows=1 width=8) (actual time=234993.749..234993.750 rows=1 loops=1) -> HashAggregate (cost=4929031.23..7177226.78 rows=8000000 width=68) (actual time=184256.546..234913.067 rows=1651523 loops=1)
Group Key: osm_chunk_1.device_uuid, osm_chunk_1.sensor_id Planned Partitions: 128 Batches: 129 Memory Usage: 20497kB Disk Usage: 4429832kB -> Foreign Scan on osm_chunk_1 (cost=0.00..0.00 rows=92509677 width=68) (actual time=345.890..128688.459 rows=92505457 loops=1) Filter: ((observed_at > '2023-08-28 00:00:00+00'::timestamp with time zone) AND (observed_at < '2023-08-29 00:00:00+00'::timestamp with time zone))
Rows Removed by Filter: 4220 Match tiered objects: 3 Row Groups: _timescaledb_internal._hyper_1_42_chunk: 0-74 _timescaledb_internal._hyper_1_43_chunk: 0-29 _timescaledb_internal._hyper_1_44_chunk: 0-71 S3 requests: 177 S3 data: 224423195 bytesPlanning Time: 6.216 ms Execution Time: 235372.223 ms (16 rows)
`EXPLAIN` illustrates which chunks are being pulled in from the object storage tier: 1. Fetch data from chunks 42, 43, and 44 from the object storage tier. 1. Skip row groups and limit the fetch to a subset of the offsets in the Parquet object that potentially match the query filter. Only fetch the data for `device_uuid`, `sensor_id`, and `observed_at` as the query needs only these 3 columns. The object storage tier is more than an archiving solution. It is also: - **Cost-effective:** store high volumes of data at a lower cost. You pay only for what you store, with no extra cost for queries. - **Scalable:** scale past the restrictions of even the enhanced high-performance storage tier. - **Online:** your data is always there and can be [queried when needed][querying-tiered-data]. By default, tiered data is not included when you query from a Tiger Cloud service. To access tiered data, you [enable tiered reads][querying-tiered-data] for a query, a session, or even for all sessions. After you enable tiered reads, when you run regular SQL queries, a behind-the-scenes process transparently pulls data from wherever it's located: the standard high-performance storage tier, the object storage tier, or both. You can `JOIN` against tiered data, build views, and even define continuous aggregates on it. In fact, because the implementation of continuous aggregates also uses hypertables, they can be tiered to low-cost storage as well. For low-cost storage, Tiger Data charges only for the size of your data in S3 in the Apache Parquet format, regardless of whether it was compressed in Tiger Cloud before tiering. There are no additional expenses, such as data transfer or compute. The low-cost storage tier comes with the following limitations: - **Limited schema modifications**: some schema modifications are not allowed on hypertables with tiered chunks. _Allowed_ modifications include: renaming the hypertable, adding columns with `NULL` defaults, adding indexes, changing or renaming the hypertable schema, and adding `CHECK` constraints. For `CHECK` constraints, only untiered data is verified. Columns can also be deleted, but you cannot subsequently add a new column to a tiered hypertable with the same name as the now-deleted column. _Disallowed_ modifications include: adding a column with non-`NULL` defaults, renaming a column, changing the data type of a column, and adding a `NOT NULL` constraint to the column. - **Limited data changes**: you cannot insert data into, update, or delete a tiered chunk. These limitations take effect as soon as the chunk is scheduled for tiering. - **Inefficient query planner filtering for non-native data types**: the query planner speeds up reads from our object storage tier by using metadata to filter out columns and row groups that don't satisfy the query. This works for all native data types, but not for non-native types, such as `JSON`, `JSONB`, and `GIS`. * **Latency**: S3 has higher access latency than local storage. This can affect the execution time of queries in latency-sensitive environments, especially lighter queries. * **Number of dimensions**: you cannot use tiered storage with hypertables partitioned on more than one dimension. Make sure your hypertables are partitioned on time only, before you enable tiered storage. ===== PAGE: https://docs.tigerdata.com/use-timescale/security/overview/ ===== # About security in Tiger Cloud Protecting data starts with secure software engineering. At Tiger Data, we embed security into every stage of development, from static code analysis and automated dependency scanning to rigorous code security reviews. To go even further, we developed [pgspot](https://github.com/timescale/pgspot), an open-source extension to identify security issues with Postgres extensions, which strengthens the broader ecosystem as well as our own platform. Tiger Data products do not have any identified weaknesses.  This page lists the additional things we do to ensure operational security and to lock down Tiger Cloud services. To see our security features at a glance, see [Tiger Data Security][security-at-timescale]. ## Role-based access Tiger Cloud provides role-based access for you to: * Administer your Tiger Cloud project In Tiger Cloud Console, users with the Owner, Admin, and Viewer roles have different permissions to manage users and services in the project. * Manage data in each service To restrict access to your data on the database level, you can create other roles on top of the default tsdbadmin role. ## Data encryption Your data on Tiger Cloud is encrypted both in transit and at rest. Both active databases and backups are encrypted. Tiger Cloud uses AWS as its cloud provider, with all the security that AWS provides. Data encryption uses the industry-standard AES-256 algorithm. Cryptographic keys are managed by [AWS Key Management Service (AWS KMS)][aws-kms]. Keys are never stored in plaintext. For more information about AWS security, see the AWS documentation on security in [Amazon Elastic Compute Cloud][ec2-security] and [Elastic Block Storage][ebs-security]. ## Networking security Customer access to Tiger Cloud services is only provided over TLS-encrypted connections. There is no option to use unencrypted plaintext connections. ## Networking with Virtual Private Cloud (VPC) peering When using VPC peering, **no public Internet-based access** is provided to the service. Service addresses are published in public DNS, but they can only be connected to from the customer's peered VPC using private network addresses. VPC peering only enables communication to be initiated from your Customer VPC to Tiger Cloud services running in the Tiger Cloud VPC. Tiger Cloud cannot initiate communication with your VPC. To learn how to set up VPC Peering, see [Secure your Tiger Cloud services with VPC Peering and AWS PrivateLink][vpc-peering]. ## IP address allow lists You can allow only trusted IP addresses to access your Tiger Cloud services. You do this by creating [IP address allow lists][ip-allowlist] and attaching them to your services. ## Operator access Normally all the resources required for providing Tiger Cloud services are automatically created, maintained and terminated by the Tiger Cloud infrastructure. No manual operator intervention is required. However, the Tiger Data operations team has the capability to securely log in to the service virtual machines for troubleshooting purposes. These accesses are audit logged. No customer access to the virtual machine level is provided. ## GDPR compliance Tiger Data complies with the European Union's General Data Protection Regulation (GDPR), and all practices are covered by our [Privacy Policy][timescale-privacy-policy] and the [Terms of Service][tsc-tos]. All customer data is processed in accordance with Tiger Data's GDPR-compliant [Data Processor Addendum][tsc-data-processor-addendum], which applies to all Tiger Data customers. Tiger Data operators never access customer data, unless explicitly requested by the customer to troubleshoot a technical issue. The Tiger Data operations team has mandatory recurring training regarding the applicable policies. ## HIPAA compliance The Tiger Cloud [Enterprise plan][pricing-plan-features] is Health Insurance Portability and Accountability Act (HIPAA) compliant. This allows organizations to securely manage and analyze sensitive healthcare data, ensuring they meet regulatory requirements while building compliant applications. ## SOC 2 compliance Tiger Cloud is SOC 2 Type 2 compliant. This ensures that organizations can securely manage customer data in alignment with industry standards for security, availability, processing integrity, confidentiality, and privacy. It helps businesses meet trust requirements while confidently building applications that handle sensitive information. The annual SOC 2 report is available to customers on the Scale or Enterprise pricing plans. Open a [support ticket][open-support-ticket] to get access to it. ===== PAGE: https://docs.tigerdata.com/use-timescale/security/strict-ssl/ ===== # Connect with a stricter SSL mode The default connection string for Tiger Cloud uses the Secure Sockets Layer (SSL) mode `require`. Users can choose not to use Transport Layer Security (TLS) while connecting to their databases, but connecting to production databases without encryption is strongly discouraged. To achieve even stronger security, clients may select to verify the identity of the server. If you want your connection client to verify the server's identity, you can connect with an [SSL mode][ssl-modes] of `verify-ca` or `verify-full`. To do so, you need to store a copy of the certificate chain where your connection tool can find it. This section provides instructions for setting up a stricter SSL connection. ## SSL certificates As part of the secure connection protocol, the server proves its identity by providing clients with a certificate. This certificate should be issued and signed by a well-known and trusted Certificate Authority. Because requesting a certificate from a Certificate Authority takes some time, Tiger Cloud services are initialized with a self-signed certificate. This lets you start up a service immediately. After your service is started, a signed certificate is requested behind the scenes. The new certificate is usually received within 30 minutes. Your certificate is then replaced with almost no interruption. Connections are reset, and most clients reconnect automatically. With the signed certificate, you can switch your connections to a stricter SSL mode, such as `verify-ca` or `verify-full`. For more information on the different SSL modes, see the [Postgres SSL mode descriptions][ssl-modes]. ## Connect to your database with a stricter SSL mode To set up a stricter SSL connection: 1. Generate a copy of your certificate chain and store it in the right location 1. Change your Tiger Cloud connection string ### Connecting to your database with a stricter SSL mode 1. Use the `openssl` tool to connect to your Tiger Cloud service and get the certificate bundle. Store the bundle in a file called `bundle.crt`. Replace `service URL with port` with your Tiger Cloud connection URL: ```shell openssl s_client -showcerts -partial_chain -starttls postgres \ -connect service URL with port < /dev/null 2>/dev/null | \ awk '/BEGIN CERTIFICATE/,/END CERTIFICATE/{ print }' > bundle.crt ``` 1. Copy the bundle to your clipboard: <Terminal> ```shell pbcopy < bundle.crt ``` ```shell xclip -sel clip < bundle.crt ``` ```shell clip.exe < bundle.crt ``` </Terminal> 1. Navigate to <https://whatsmychaincert.com/>. This online tool generates a full certificate chain, including the root Certificate Authority certificate, which is not included in the certificate bundle returned by the database. 1. Paste your certificate bundle in the provided box. Check `Include Root Certificate`. Click `Generate Chain`. 1. Save the downloaded certificate chain to `~/.postgresql/root.crt`. 1. Change your Tiger Cloud connection string from `sslmode=require` to either `sslmode=verify-full` or `sslmode=verify-ca`. For example, to connect to your database with `psql`, run: ```shell psql "postgres://tsdbadmin@service URL with port/tsdb?sslmode=verify-full" ``` ## Verify the certificate type used by your database To check whether the certificate has been replaced yet, connect to your database instance and inspect the returned certificate. We are using two certificate providers - Google and ZeroSSL, that's why chances are you can have a certificate issued by either of those CAs:shell openssl s_client -showcerts -partial_chain -starttls postgres -connect : < /dev/null 2>/dev/null | grep "Google|ZeroSSL"
===== PAGE: https://docs.tigerdata.com/use-timescale/security/transit-gateway/ ===== # Peer your Tiger Cloud services with AWS Transit Gateway [AWS Transit Gateway][aws-transit-gateway] enables you to securely connect to your Tiger Cloud from AWS, Google Cloud, Microsoft Azure, or any other cloud or on-premise environment. You use AWS Transit Gateway as a traffic controller for your network. Instead of setting up multiple direct connections to different clouds, on-premise data centers, and other AWS services, you connect everything to AWS Transit Gateway. This simplifies your network and makes it easier to manage and scale. You can then create a peering connection between your Tiger Cloud services and AWS Transit Gateway in Tiger Cloud. This means that, no matter how big or complex your infrastructure is, you can connect securely to your Tiger Cloud services. For enhanced security, you can add peering connections to multiple Transit Gateways with overlapping CIDRs—Tiger Cloud creates a new isolated connection for every unique Transit Gateway ID. Otherwise, the existing connection is reused for your services in the same project and region. To configure this secure connection, you: 1. Connect your infrastructure to AWS Transit Gateway. 1. Create a Tiger Cloud Peering VPC with a peering connection to AWS Transit Gateway. 1. Accept and configure the peering connection on your side. 1. Attach individual services to the Peering VPC. AWS Transit Gateway enables you to connect from almost any environment, this page provides examples for the most common use cases. 1. **Create a Peering VPC in [Tiger Cloud Console][console-login]** 1. In `Security` > `VPC`, click `Create a VPC`:  1. Choose your region and IP range, name your VPC, then click `Create VPC`:  Your service and Peering VPC must be in the same AWS region. The number of Peering VPCs you can create in your project depends on your [pricing plan][pricing-plans]. If you need another Peering VPC, either contact [support@tigerdata.com](mailto:support@tigerdata.com) or change your plan in [Tiger Cloud Console][console-login]. 1. Add a peering connection: 1. In the `VPC Peering` column, click `Add`. 1. Provide your AWS account ID, Transit Gateway ID, CIDR ranges, and AWS region. Tiger Cloud creates a new isolated connection for every unique Transit Gateway ID.  1. Click `Add connection`. 1. **Accept and configure peering connection in your AWS account** Once your peering connection appears as `Processing`, you can accept and configure it in AWS: 1. Accept the peering request coming from Tiger Cloud. The request can take up to 5 min to arrive. Within 5 more minutes after accepting, the peering should appear as `Connected` in Tiger Cloud Console. 1. Configure at least the following in your AWS account networking: - Your subnet route table to route traffic to your Transit Gateway for the Peering VPC CIDRs. - Your Transit Gateway route table to route traffic to the newly created Transit Gateway peering attachment for the Peering VPC CIDRs. - Security groups to allow outbound TCP 5432. 1. **Attach a Tiger Cloud service to the Peering VPC In [Tiger Cloud Console][console-services]** 1. Select the service you want to connect to the Peering VPC. 1. Click `Operations` > `Security` > `VPC`. 1. Select the VPC, then click `Attach VPC`. You cannot attach a Tiger Cloud service to multiple Tiger Cloud VPCs at the same time. 1. **Connect your infrastructure to AWS Transit Gateway** Establish connectivity between Azure and AWS. See the [AWS architectural documentation][azure-aws] for details. 1. **Create a Peering VPC in [Tiger Cloud Console][console-login]** 1. In `Security` > `VPC`, click `Create a VPC`:  1. Choose your region and IP range, name your VPC, then click `Create VPC`:  Your service and Peering VPC must be in the same AWS region. The number of Peering VPCs you can create in your project depends on your [pricing plan][pricing-plans]. If you need another Peering VPC, either contact [support@tigerdata.com](mailto:support@tigerdata.com) or change your plan in [Tiger Cloud Console][console-login]. 1. Add a peering connection: 1. In the `VPC Peering` column, click `Add`. 1. Provide your AWS account ID, Transit Gateway ID, CIDR ranges, and AWS region. Tiger Cloud creates a new isolated connection for every unique Transit Gateway ID.  1. Click `Add connection`. 1. **Accept and configure peering connection in your AWS account** Once your peering connection appears as `Processing`, you can accept and configure it in AWS: 1. Accept the peering request coming from Tiger Cloud. The request can take up to 5 min to arrive. Within 5 more minutes after accepting, the peering should appear as `Connected` in Tiger Cloud Console. 1. Configure at least the following in your AWS account networking: - Your subnet route table to route traffic to your Transit Gateway for the Peering VPC CIDRs. - Your Transit Gateway route table to route traffic to the newly created Transit Gateway peering attachment for the Peering VPC CIDRs. - Security groups to allow outbound TCP 5432. 1. **Attach a Tiger Cloud service to the Peering VPC In [Tiger Cloud Console][console-services]** 1. Select the service you want to connect to the Peering VPC. 1. Click `Operations` > `Security` > `VPC`. 1. Select the VPC, then click `Attach VPC`. You cannot attach a Tiger Cloud service to multiple Tiger Cloud VPCs at the same time. 1. **Connect your infrastructure to AWS Transit Gateway** Establish connectivity between Google Cloud and AWS. See [Connect HA VPN to AWS peer gateways][gcp-aws]. 1. **Create a Peering VPC in [Tiger Cloud Console][console-login]** 1. In `Security` > `VPC`, click `Create a VPC`:  1. Choose your region and IP range, name your VPC, then click `Create VPC`:  Your service and Peering VPC must be in the same AWS region. The number of Peering VPCs you can create in your project depends on your [pricing plan][pricing-plans]. If you need another Peering VPC, either contact [support@tigerdata.com](mailto:support@tigerdata.com) or change your plan in [Tiger Cloud Console][console-login]. 1. Add a peering connection: 1. In the `VPC Peering` column, click `Add`. 1. Provide your AWS account ID, Transit Gateway ID, CIDR ranges, and AWS region. Tiger Cloud creates a new isolated connection for every unique Transit Gateway ID.  1. Click `Add connection`. 1. **Accept and configure peering connection in your AWS account** Once your peering connection appears as `Processing`, you can accept and configure it in AWS: 1. Accept the peering request coming from Tiger Cloud. The request can take up to 5 min to arrive. Within 5 more minutes after accepting, the peering should appear as `Connected` in Tiger Cloud Console. 1. Configure at least the following in your AWS account networking: - Your subnet route table to route traffic to your Transit Gateway for the Peering VPC CIDRs. - Your Transit Gateway route table to route traffic to the newly created Transit Gateway peering attachment for the Peering VPC CIDRs. - Security groups to allow outbound TCP 5432. 1. **Attach a Tiger Cloud service to the Peering VPC In [Tiger Cloud Console][console-services]** 1. Select the service you want to connect to the Peering VPC. 1. Click `Operations` > `Security` > `VPC`. 1. Select the VPC, then click `Attach VPC`. You cannot attach a Tiger Cloud service to multiple Tiger Cloud VPCs at the same time. 1. **Connect your infrastructure to AWS Transit Gateway** Establish connectivity between your on-premise infrastructure and AWS. See the [Centralize network connectivity using AWS Transit Gateway][aws-onprem]. 1. **Create a Peering VPC in [Tiger Cloud Console][console-login]** 1. In `Security` > `VPC`, click `Create a VPC`:  1. Choose your region and IP range, name your VPC, then click `Create VPC`:  Your service and Peering VPC must be in the same AWS region. The number of Peering VPCs you can create in your project depends on your [pricing plan][pricing-plans]. If you need another Peering VPC, either contact [support@tigerdata.com](mailto:support@tigerdata.com) or change your plan in [Tiger Cloud Console][console-login]. 1. Add a peering connection: 1. In the `VPC Peering` column, click `Add`. 1. Provide your AWS account ID, Transit Gateway ID, CIDR ranges, and AWS region. Tiger Cloud creates a new isolated connection for every unique Transit Gateway ID.  1. Click `Add connection`. 1. **Accept and configure peering connection in your AWS account** Once your peering connection appears as `Processing`, you can accept and configure it in AWS: 1. Accept the peering request coming from Tiger Cloud. The request can take up to 5 min to arrive. Within 5 more minutes after accepting, the peering should appear as `Connected` in Tiger Cloud Console. 1. Configure at least the following in your AWS account networking: - Your subnet route table to route traffic to your Transit Gateway for the Peering VPC CIDRs. - Your Transit Gateway route table to route traffic to the newly created Transit Gateway peering attachment for the Peering VPC CIDRs. - Security groups to allow outbound TCP 5432. 1. **Attach a Tiger Cloud service to the Peering VPC In [Tiger Cloud Console][console-services]** 1. Select the service you want to connect to the Peering VPC. 1. Click `Operations` > `Security` > `VPC`. 1. Select the VPC, then click `Attach VPC`. You cannot attach a Tiger Cloud service to multiple Tiger Cloud VPCs at the same time. You can now securely access your services in Tiger Cloud. ===== PAGE: https://docs.tigerdata.com/use-timescale/security/ip-allow-list/ ===== # IP allow list You can restrict access to your Tiger Cloud services to trusted IP addresses only. This prevents unauthorized connections without the need for a [Virtual Private Cloud][vpc-peering]. Creating IP allow lists helps comply with security standards such as SOC 2 or HIPAA that require IP filtering. This is especially useful in regulated industries like finance, healthcare, and government. For a more fine-grained control, you create separate IP allow lists for [the ops mode and the data mode][modes]. ## Create and attach an IP allow list in the ops mode You create an IP allow list at the [project level][members], then attach your service to it. You attach a service to either one VPC, or one IP allow list. You cannot attach a service to a VPC and an IP allow list at the same time. 1. **In [Tiger Cloud Console][console], select `Security` > `IP Allow List`, then click `Create IP Allow List`** 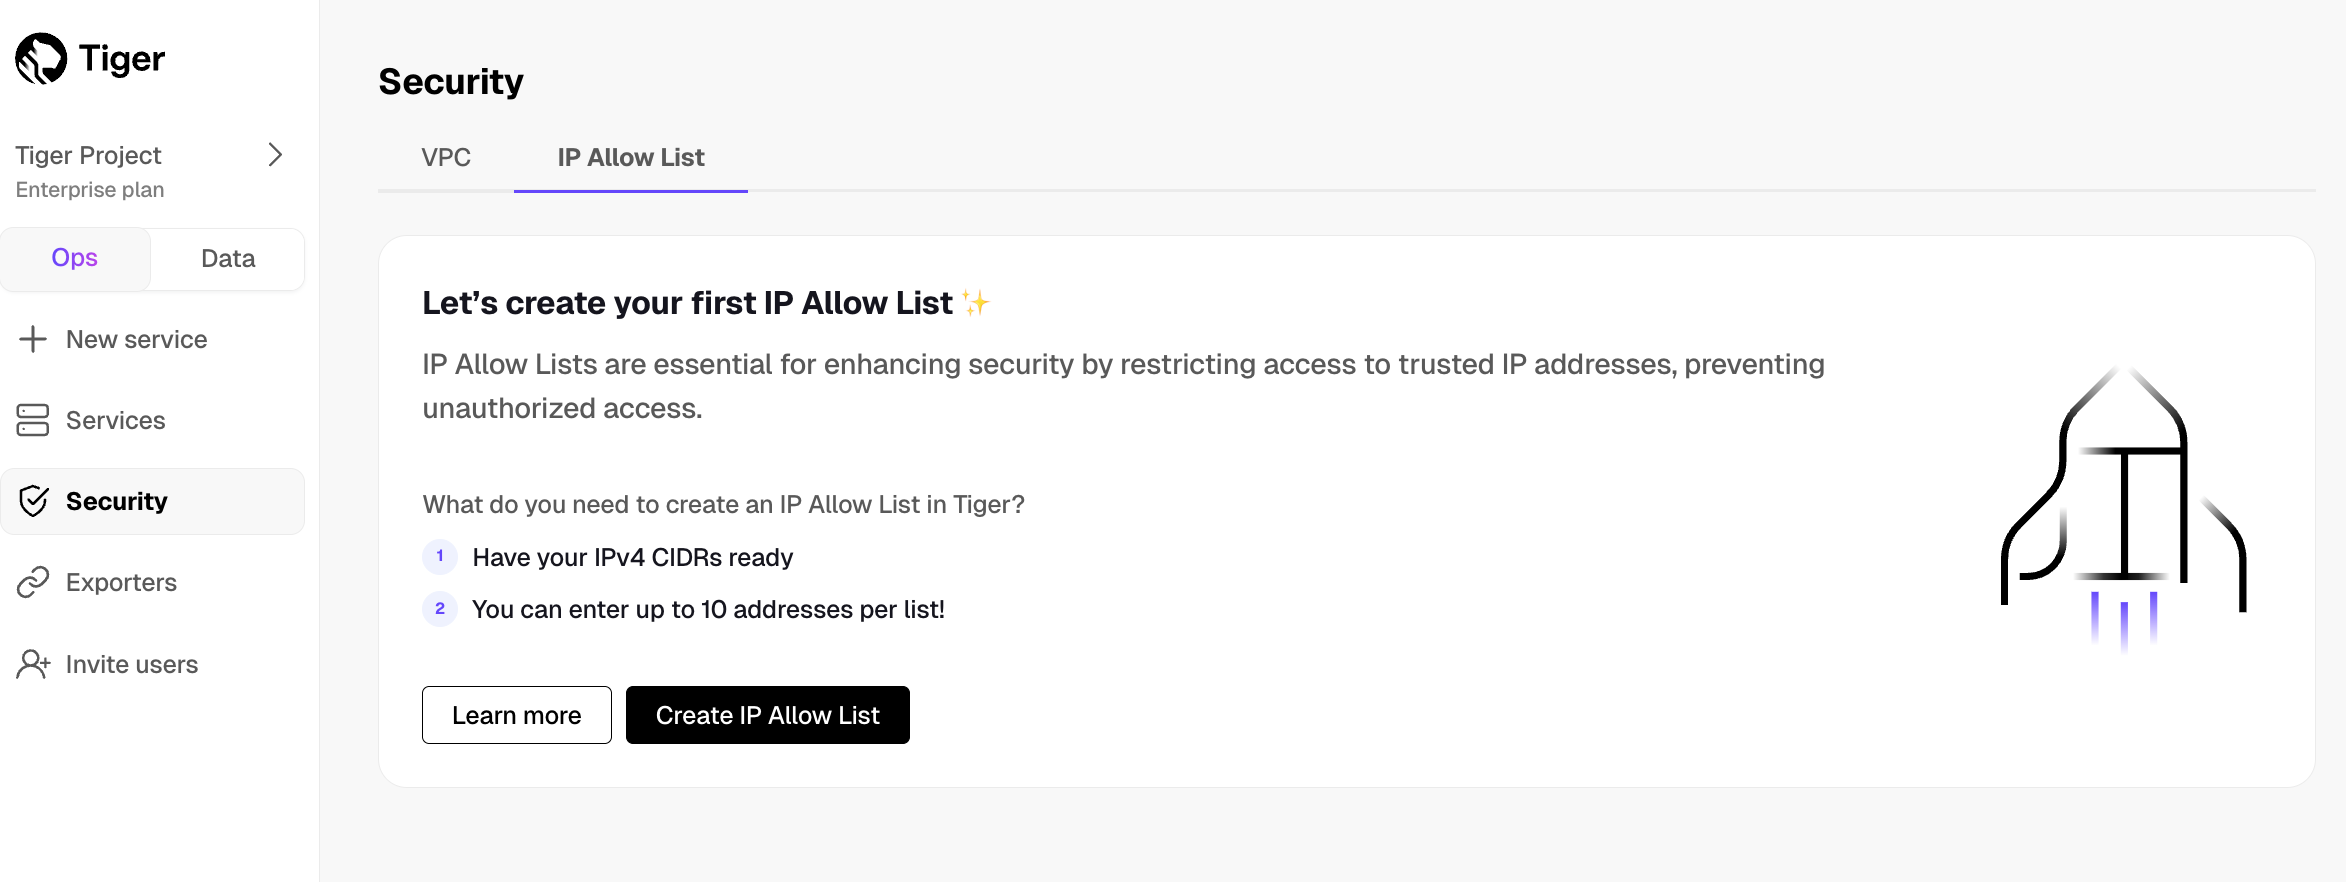 1. **Enter your trusted IP addresses** The number of IP addresses that you can include in one list depends on your [pricing plan][pricing-plans]. 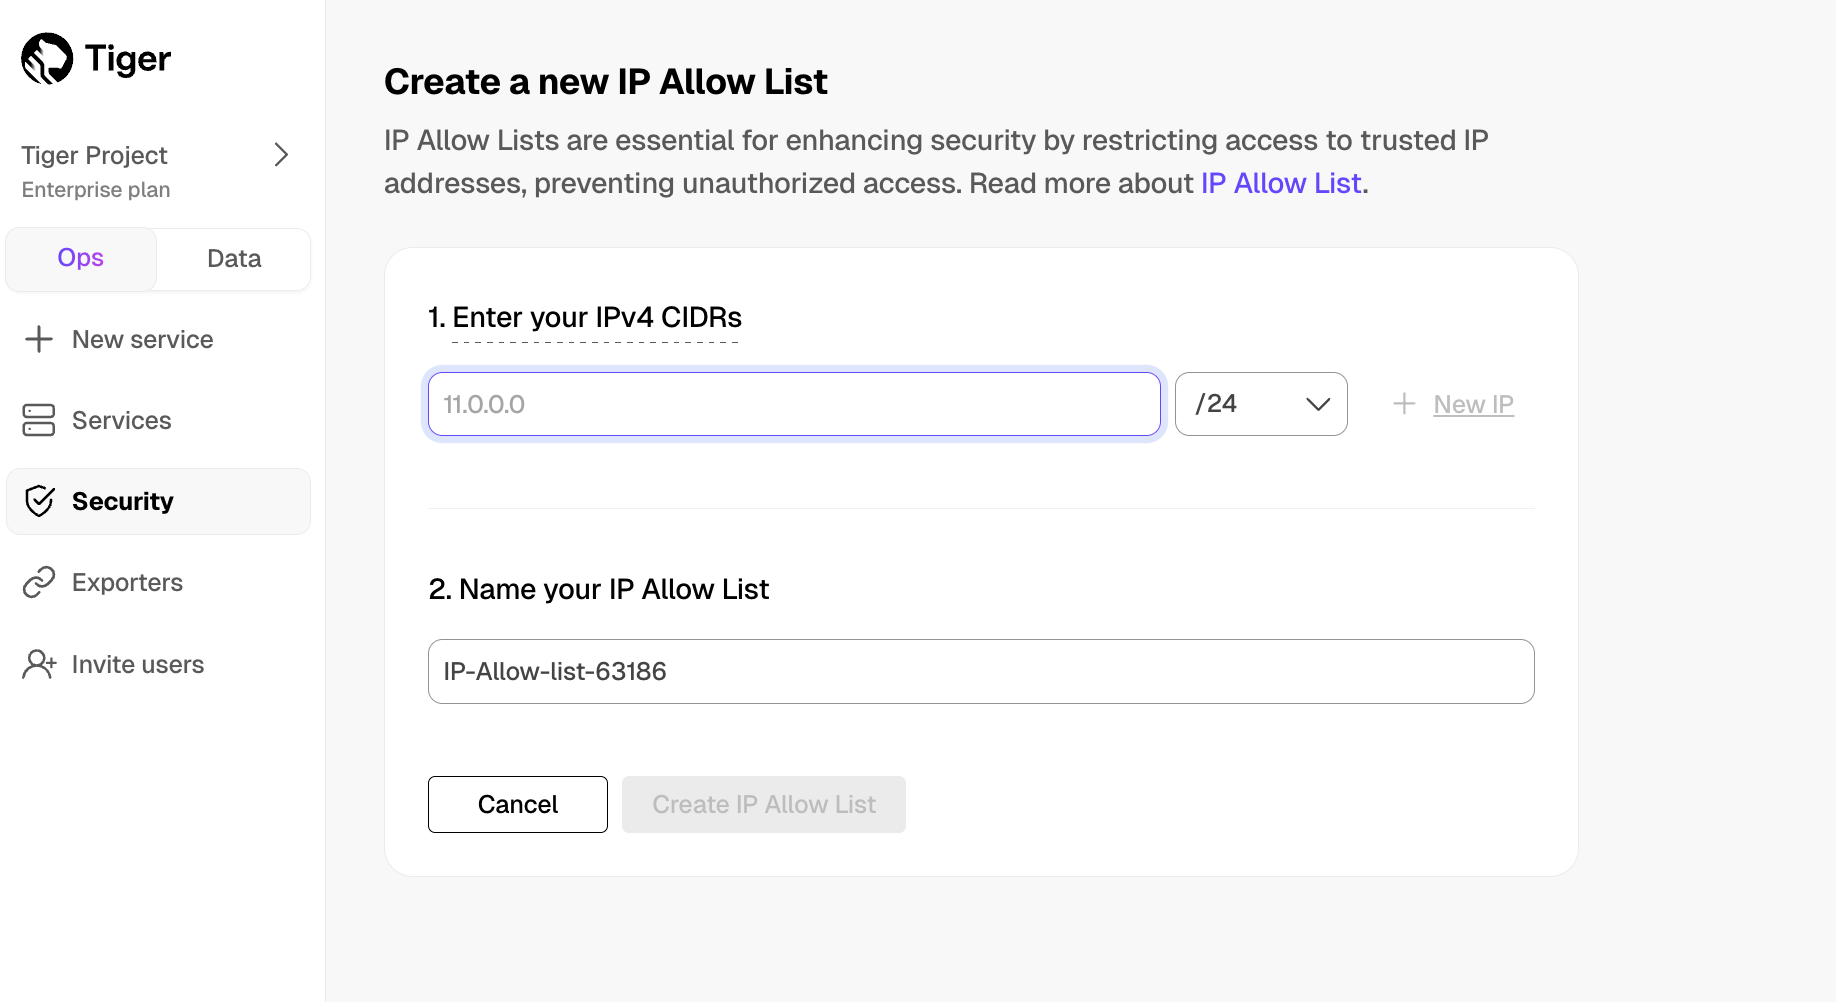 1. **Name your allow list and click `Create IP Allow List`** Click `+ Create IP Allow List` to create another list. The number of IP allow lists you can create depends on your [pricing plan][pricing-plans]. 1. **Select a Tiger Cloud service, then click `Operations` > `Security` > `IP Allow List`** 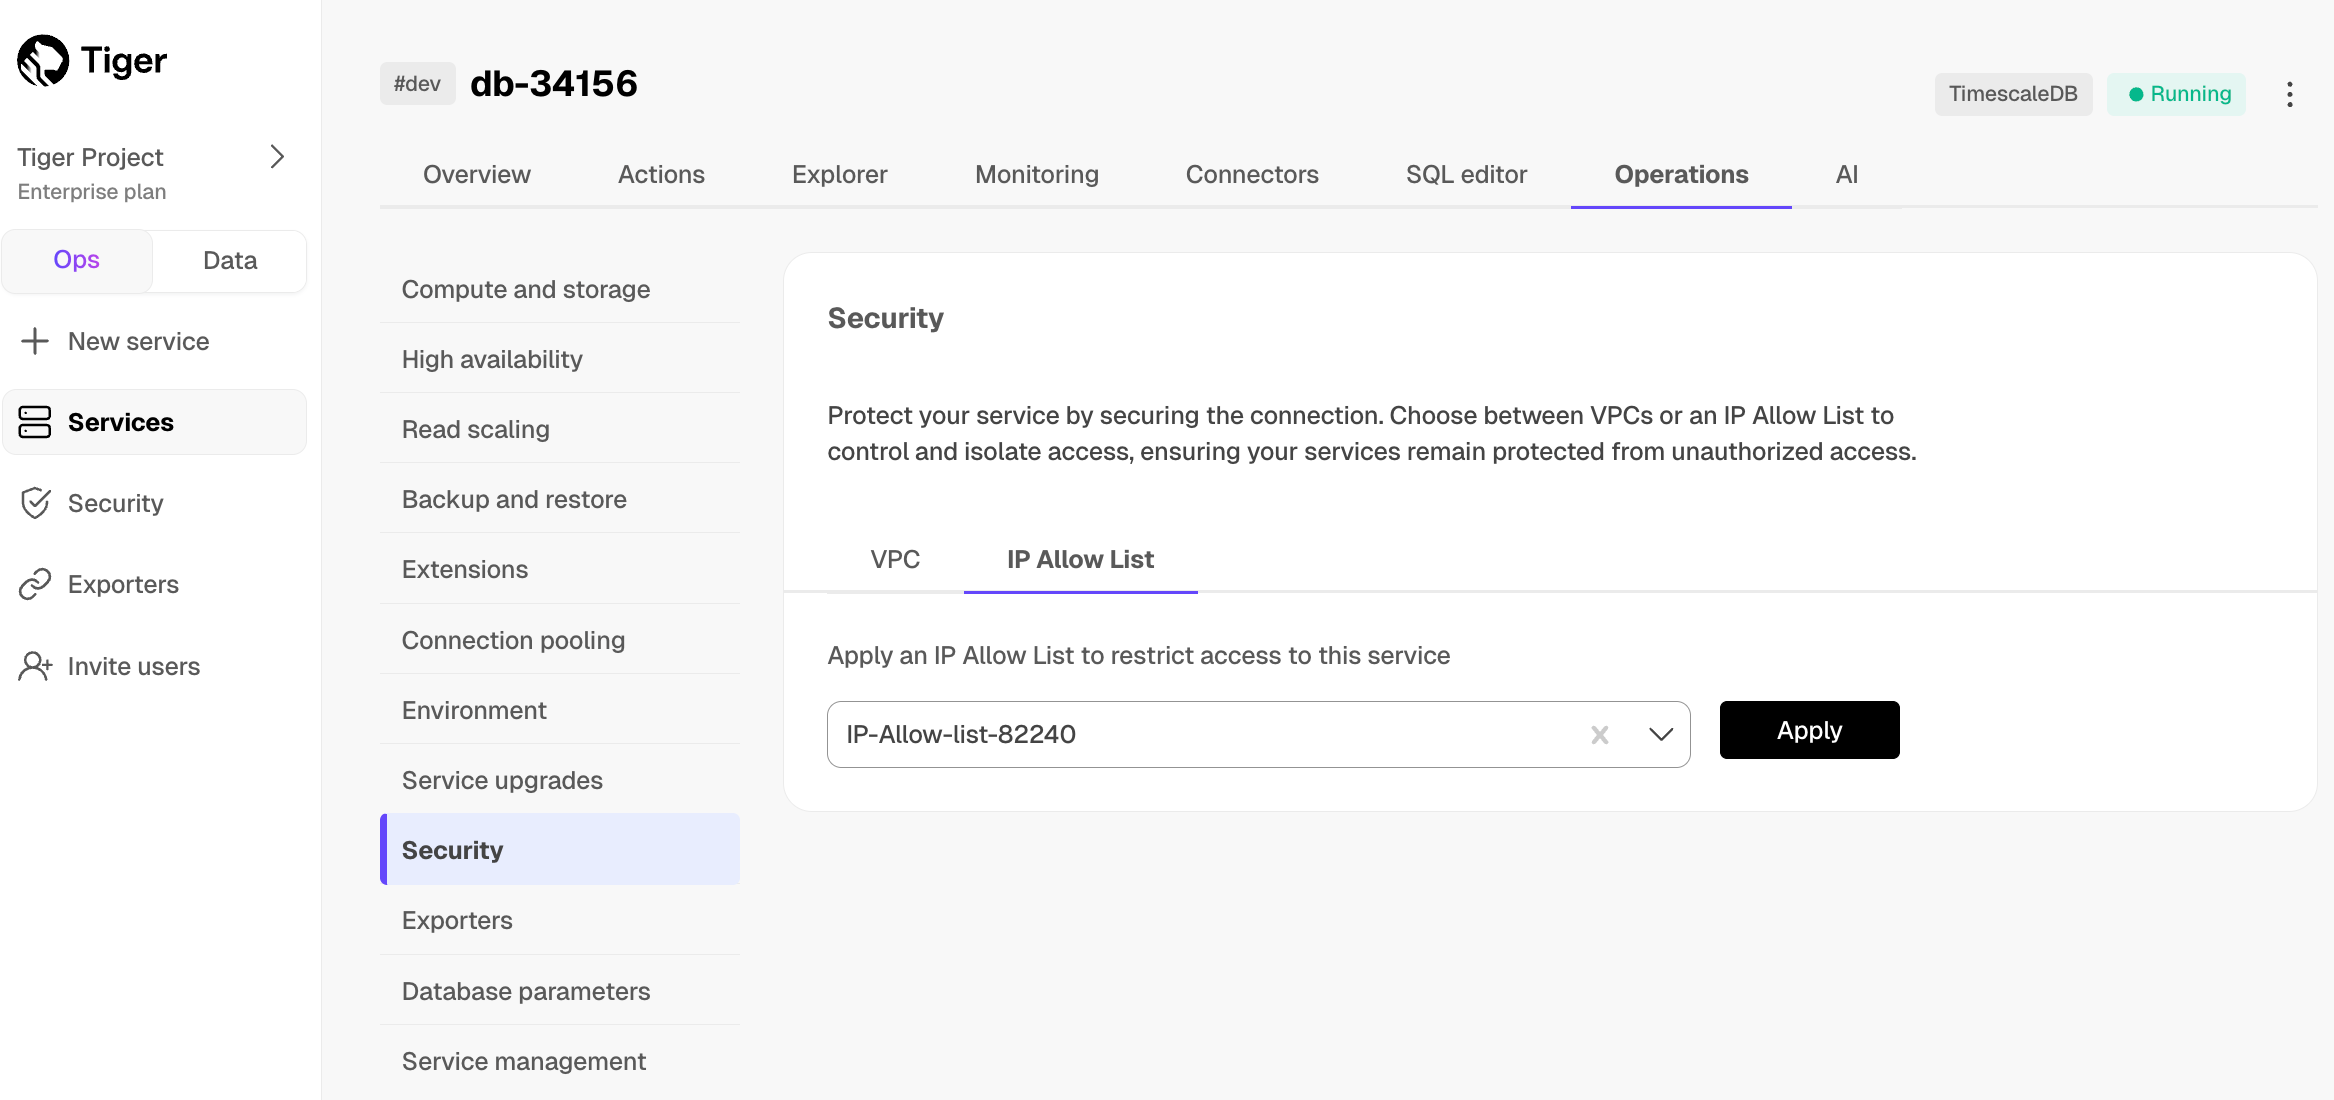 1. **Select the list in the drop-down and click `Apply`** 1. **Type `Apply` in the confirmation popup** You have created and attached an IP allow list for the operations available in the ops mode. You can unattach or change the list attached to a service from the same tab. ## Create an IP allow list in the data mode You create an IP allow list in the data mode settings. 1. **In [Tiger Cloud Console][console], toggle `Data`** 1. **Click the project name in the upper left corner, then select `Settings`** 1. **Scroll down and toggle `IP Allowlist`** 1. **Add IP addresses** 1. Click `Add entry`. 1. Enter an IP address or a range of IP addresses. 1. Click `Add`. 1. When all the IP addresses have been added, click `Apply`. 1. Click `Confirm`. You have successfully added an IP allow list for querying your service in the data mode. ===== PAGE: https://docs.tigerdata.com/use-timescale/security/multi-factor-authentication/ ===== # Multi-factor user authentication You can use two-factor authentication to log in to your Tiger Data account. Two-factor authentication, also known as two-step verification or 2FA, enables secure logins that require an authentication code in addition to your user password. The code is provided by an authenticator app on your mobile device. There are multiple authenticator apps available. 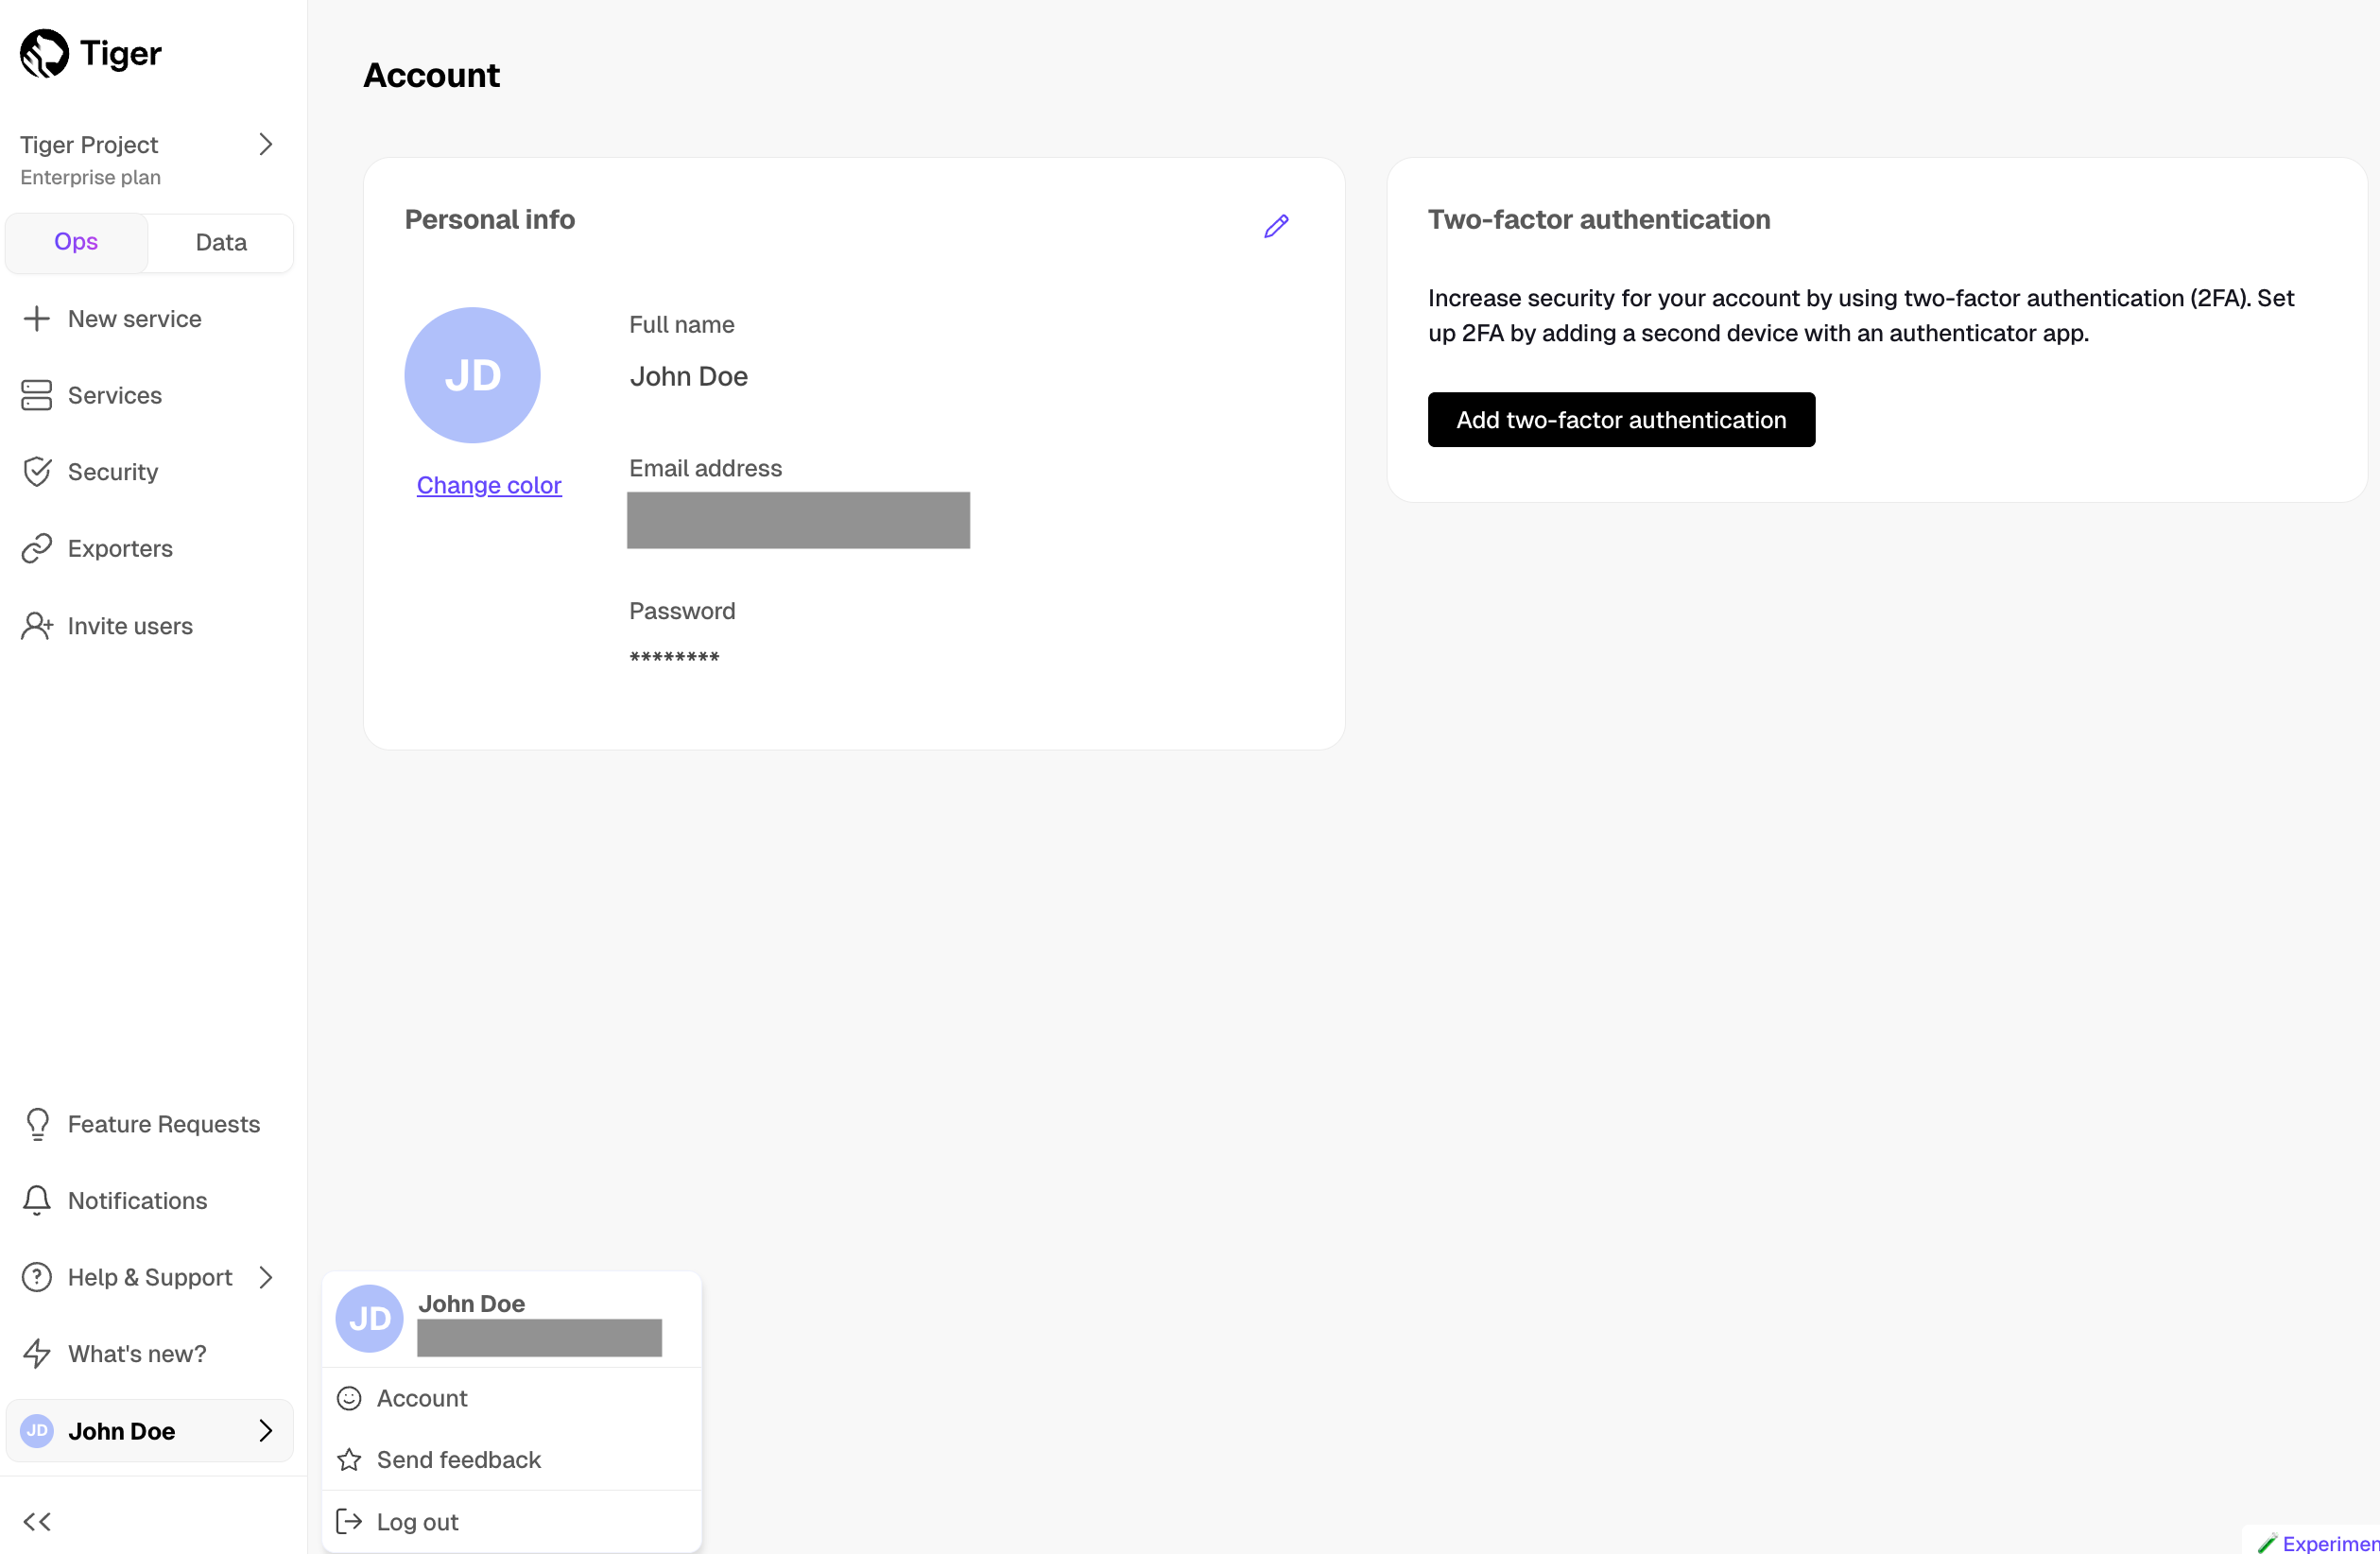 This page describes how to configure two-factor authentication with Google Authenticator. ## Prerequisites Before you begin, make sure you have: * Installed the [Google Authenticator application][install-google-authenticator] on your mobile device. ## Configure two-factor authentication with Google Authenticator Take the following steps to configure two-factor authentication: 1. Log in to [Tiger Cloud Console][cloud-login] with your username and password. 2FA is not available if you log in with Google SSO. 1. Click the `User name` icon in the bottom left of Tiger Cloud Console and select `Account`. 1. In `Account`, click `Add two-factor authentication`. 1. On your mobile device, open Google Authenticator, tap `+`, and select `Scan a QR code`. 1. Scan the QR code provided by Tiger Cloud Console in `Connect to an authenticator app` and click `Next`. 1. In Tiger Cloud Console, enter the verification code provided by Google Authenticator, and click `Next`. 1. In `Save your recovery codes`, copy, download, or print the recovery codes. These are used to recover your account if you lose your device. 1. Verify that you have saved your recovery codes, by clicking `OK, I saved my recovery codes`. 1. If two-factor authentication is enabled correctly, an email notification is sent to you. If you lose access to the mobile device you use for multi-factor authentication, and you do not have access to your recovery codes, you cannot sign in to your Tiger Data account. To regain access to your account, contact [support@tigerdata.com](mailto:support@tigerdata.com). ## Regenerate recovery codes If you do not have access to your authenticator app and need to log in to Tiger Cloud Console, you can use your recovery codes. Recovery codes are single-use. If you've used all 10 recovery codes, or lost access to them, you can generate another list. Generating a new list invalidates all previously generated codes. 1. Log in to [Tiger Cloud Console][cloud-login] with your username and password. 1. Click the `User name` icon in the bottom left and select `Account`. 1. In `Account`, navigate to `Two-factor authentication`. 1. Click `Regenerate recovery codes`. 1. In `Two-factor authentication`, enter the verification code from your authenticator app. Alternatively, if you do not have access to the authenticator app, click `Use recovery code instead` to enter a recovery code. 1. Click `Next`. 1. In `Save your recovery codes`, copy, download, or print the recovery codes. These are used to recover your account if you lose your device. 1. Verify that you have saved your recovery codes, by clicking `OK, I saved my recovery codes`. ## Remove two-factor authentication If you need to enroll a new device for two-factor authentication, you can remove two-factor authentication from your account and then add it again with your new device. 1. Log in to [Tiger Cloud Console][cloud-login] with your username and password. 1. Click the `User name` icon in the bottom left of Tiger Cloud Console and select `Account`. 1. In `Account`, navigate to `Two-factor authentication`. 1. Click `Remove two-factor authentication`. 1. Enter the verification code from your authenticator app to confirm. Alternatively click `Use recovery code instead` to type the recovery code. 1. Click `Remove`. ===== PAGE: https://docs.tigerdata.com/use-timescale/security/client-credentials/ ===== # Client credentials You can use client credentials to programmatically access resources instead of using your username and password. You can generate multiple client credentials for different applications or use cases rather than a single set of user credentials for everything. ## Create client credentials When you create client credentials, a public key and a private key are generated. These keys act as the username and password for programmatic client applications. It is important that you save these keys in a safe place. You can also delete these client credentials when the client applications no longer need access to Tiger Cloud resources. For more information about obtaining an access token programmatically, see the [Tiger Cloud Terraform provider documentation][terraform-provider]. ### Creating client credentials 1. [Log in to your Tiger Data account][cloud-login]. 1. Navigate to the `Project Settings` page to create client credentials for your project. 1. In the `Project Settings` page, click `Create credentials`. 1. In the `New client credentials` dialog, you can view the `Public key` and the `Secret Key`. Copy your secret key and store it in a secure place. You won't be able to view the `Secret Key` again in the console. 1. Click `Done`. You can use these keys in your client applications to access Tiger Cloud resources inside the respective project. Tiger Cloud generates a default `Name` for the client credentials. 1. Click the ⋮ menu and select `Rename credentials`. 1. In the `Edit credential name` dialog, type the new name and click `Accept`. ### Deleting client credentials 1. [Log in to your Tiger Data account][cloud-login]. 1. Navigate to the `Project Settings` page to view client credentials for your project. 1. In the `Project Settings` page, click the ⋮ menu of the client credential, and select `Delete`. 1. In the `Are you sure` dialog, type the name of the client credential, and click `Delete`. ===== PAGE: https://docs.tigerdata.com/use-timescale/security/members/ ===== # Control access to Tiger Cloud projects When you sign up for a [30-day free trial][sign-up], Tiger Cloud creates a project with built-in role-based access. This includes the following roles: - **Owner**: Tiger Cloud assigns this role to you when your project is created. As the Owner, you can add and delete other users, transfer project ownership, administer services, and edit project settings. - **Admin**: the Owner assigns this role to other users in the project. A user with the Admin role has the same scope of rights as the Owner but cannot transfer project ownership. - **Developer**: the Owner and Admins assign this role to other users in the project. A Developer can build, deploy, and operate services across projects, but does not have administrative privileges over users, roles, or billing. A Developer can invite other users to the project, but only with the Viewer role. - **Viewer**: the Owner and Admins assign this role to other users in the project. A Viewer has limited, read-only access to Tiger Cloud Console. This means that a Viewer cannot modify services and their configurations in any way. A Viewer has no access to the data mode and has read-queries-only access to SQL editor. 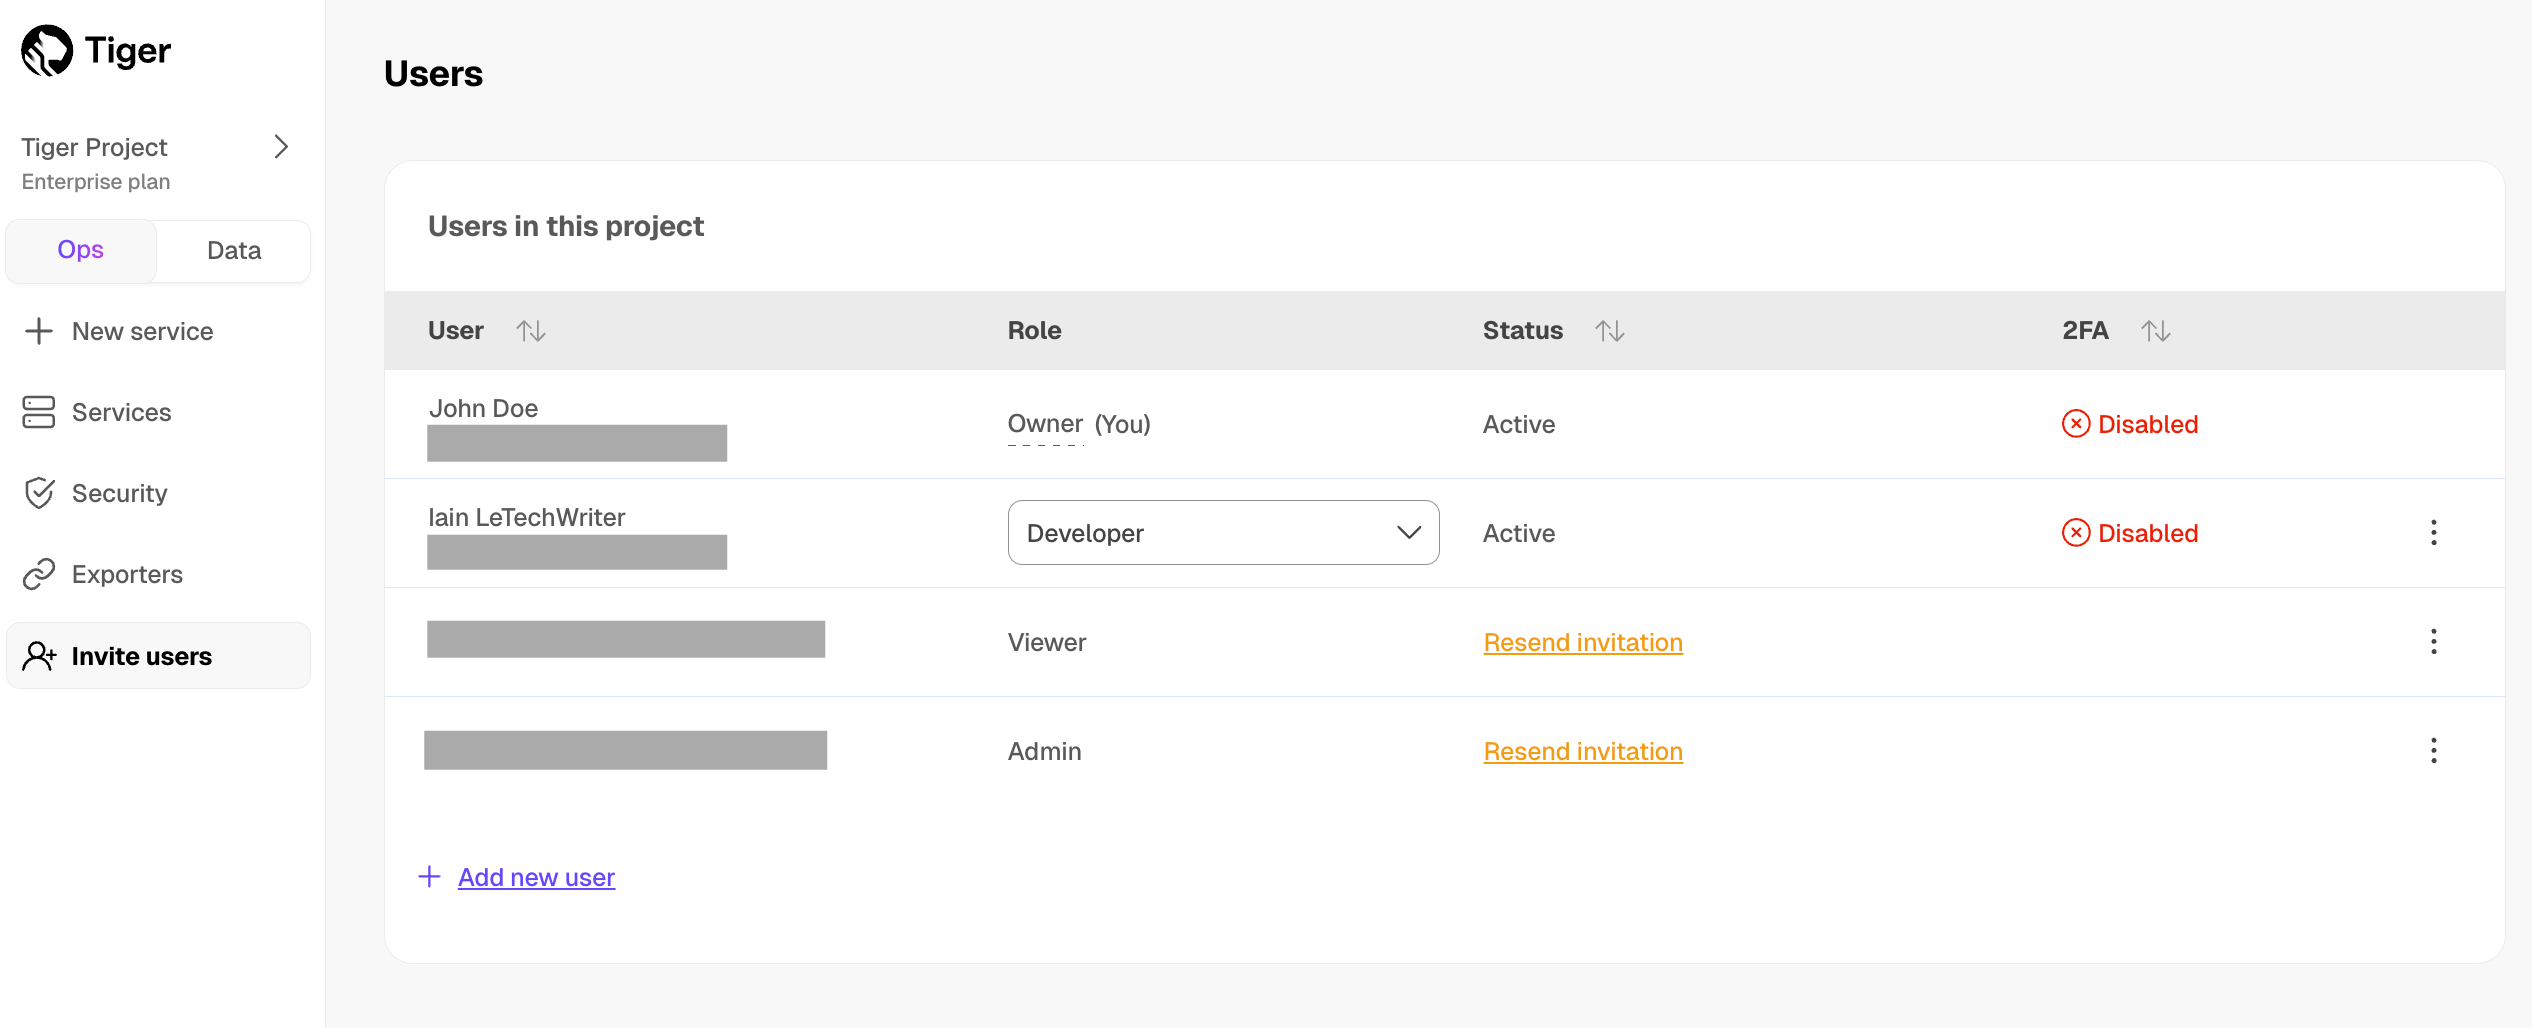 If you have the [Enterprise pricing plan][pricing-plans], you can use your company [SAML][saml] identity provider to log in to Console. User roles in a Tiger Cloud project do not overlap with the database-level roles for the individual services. This page describes the project roles available in Console. For the database-level user roles, see [Manage data security in your Tiger Cloud service][database-rbac]. ## Add a user to your project New users do not need to have a Tiger Data account before you add them, they are prompted to create one when they respond to the confirmation email. Existing users join a project in addition to the other projects they are already members of. To add a user to a project: 1. In [Tiger Cloud Console][cloud-login], click `Invite users`, then click `Add new user`. 1. Type the email address of the person that you want to add, select their role, and click `Invite user`. 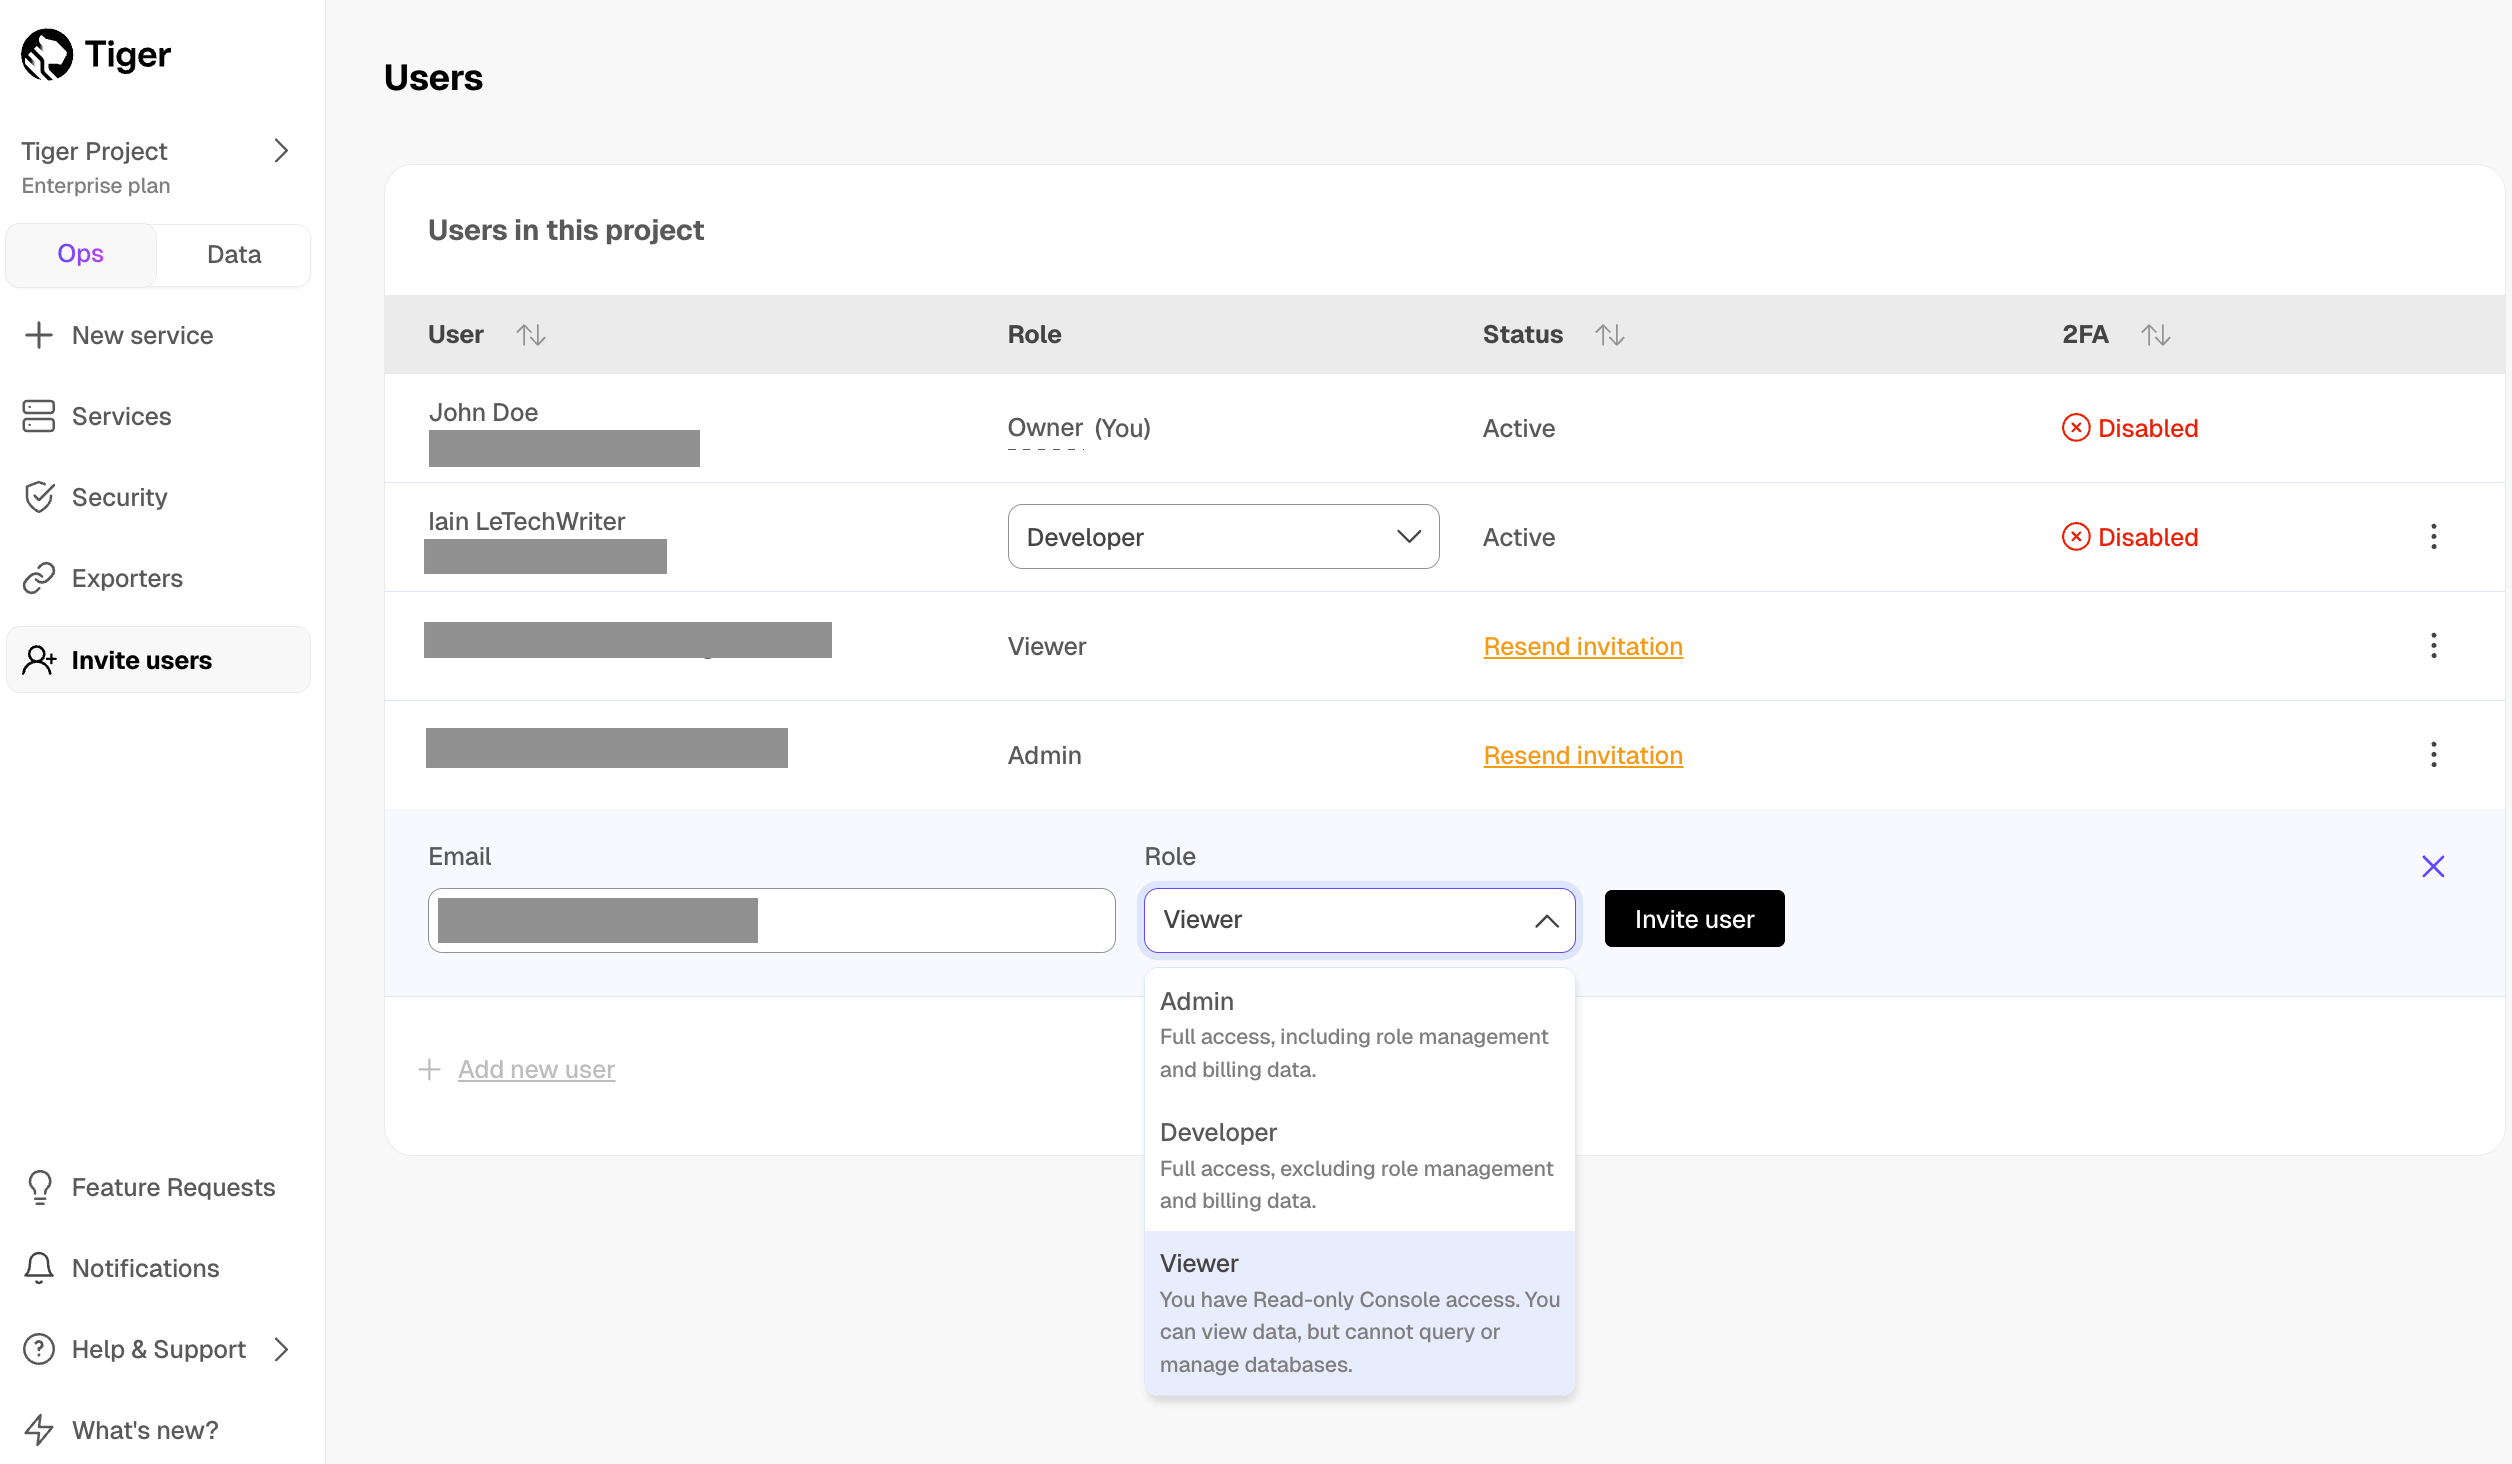 [Enterprise pricing plan][pricing-plans] and SAML users receive a notification in Console. Users in the other pricing plans receive a confirmation email. The new user then [joins the project][join-a-project]. ## Join a project When you are asked to join a project, Tiger Cloud Console sends you an invitation email. Follow the instructions in the invitation email to join the project: 1. **In the invitation email, click `Accept Invite`** Tiger Cloud opens. 1. **Follow the setup wizard and create a new account** You are added to the project you were invited to. 1. **In the invitation email, click `Accept Invite`** Tiger Cloud Console opens, and you are added to the project. 1. **Log in to Console using your company's identity provider** 1. **Click `Notifications`, then accept the invitation** Tiger Cloud Console opens, and you are added to the project. As you are now included in more than one project, you can easily [change projects][change-project]. ## Resend a project invitation Project invitations are valid for 7 days. To resend a project invitation: 1. In [Tiger Cloud Console][cloud-login], click `Invite users`. 1. Next to the person you want to invite to your project, click `Resend invitation`.  ## Change your current project To change the project you are currently working in: 1. In [Tiger Cloud Console][cloud-login], click the project name > `Current project` in the top left. 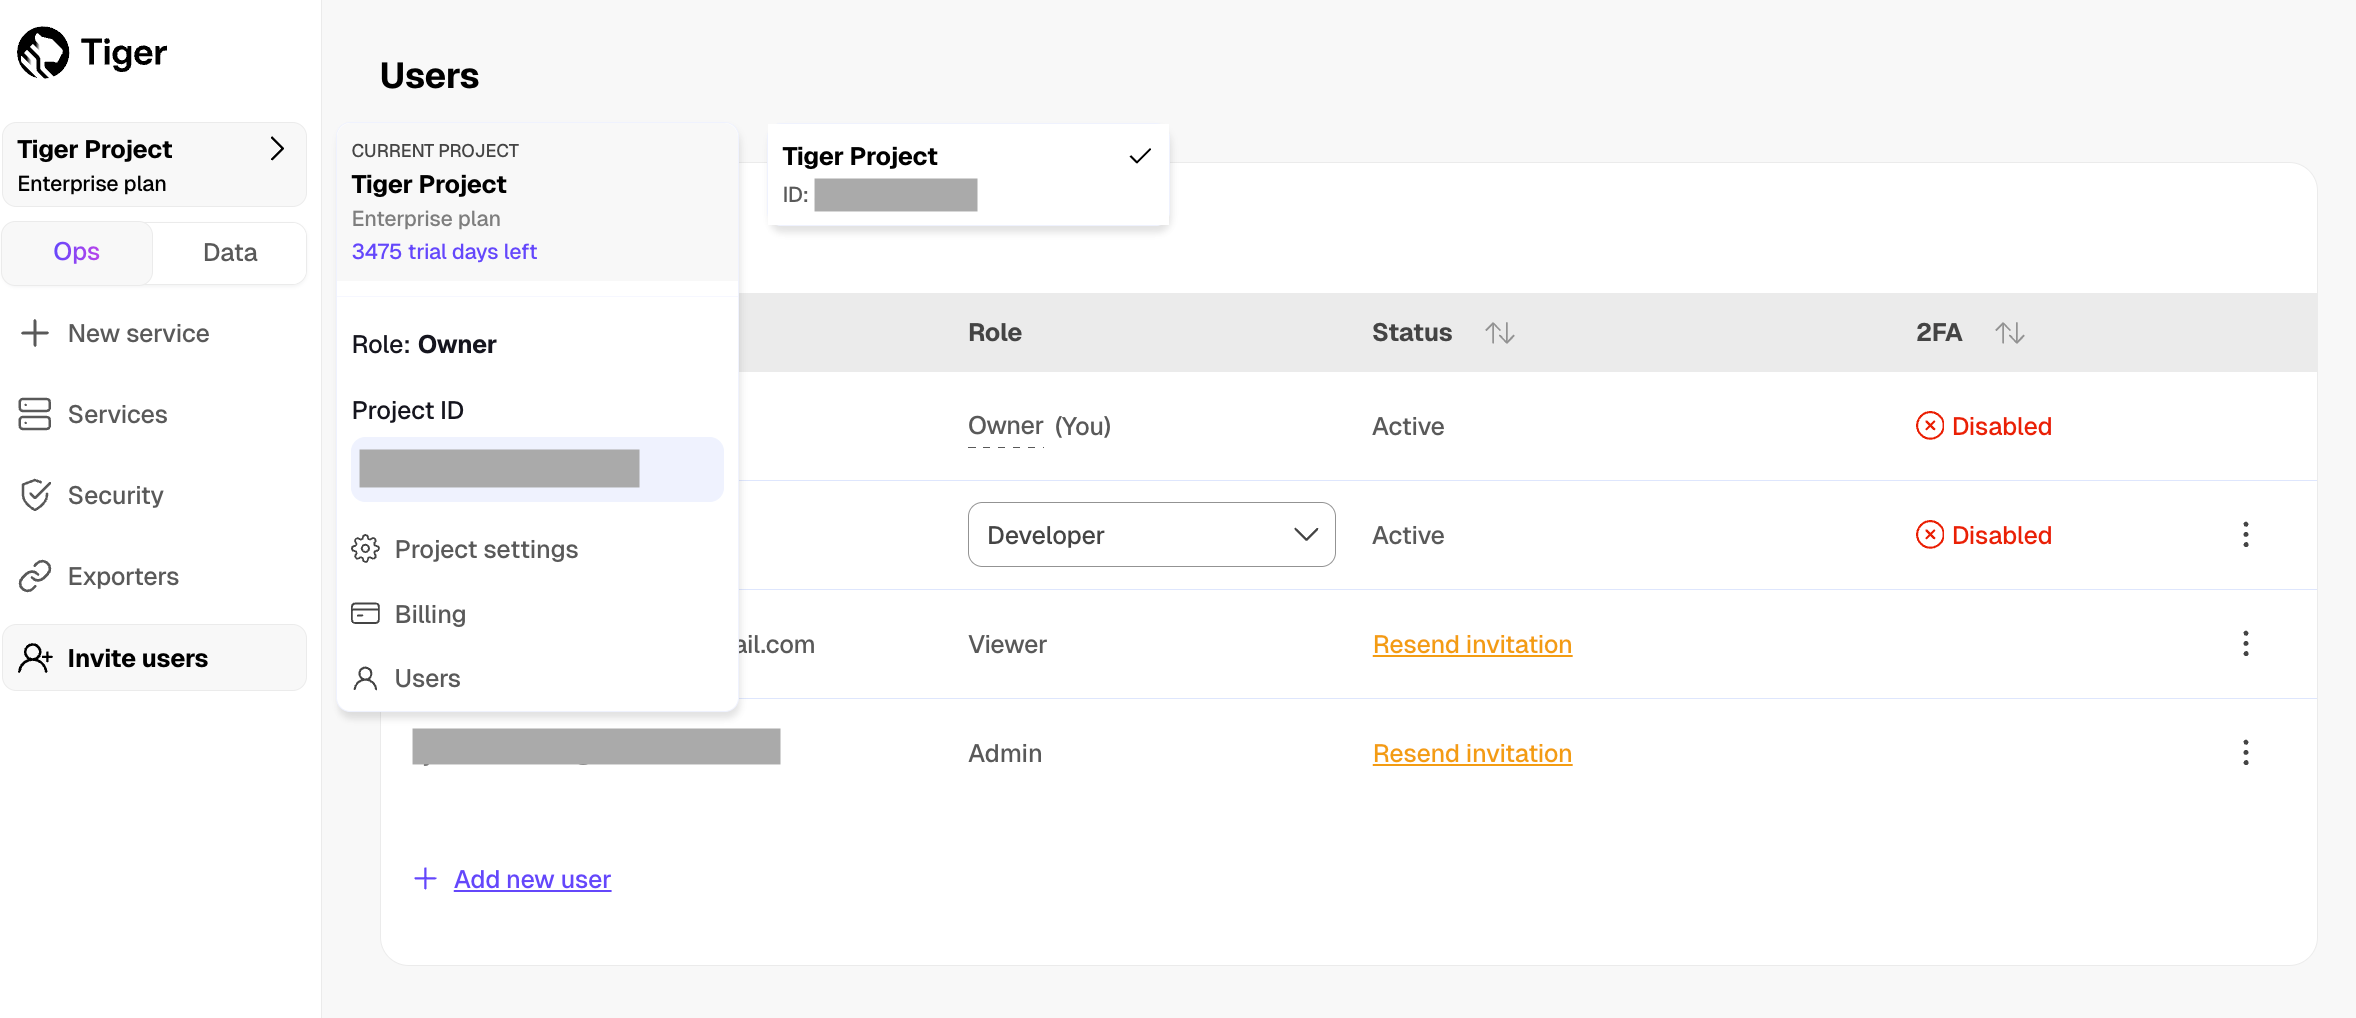 1. Select the project you want to use. ## Transfer project ownership Each Tiger Cloud project has one Owner. As the project Owner, you have rights to add and delete users, edit project settings, and transfer the Owner role to another user. When you transfer ownership to another user, you lose your ownership rights. To transfer project ownership: 1. In [Tiger Cloud Console][cloud-login], click `Invite users`. 1. Next to the person you want to transfer project ownership to, click `⋮` > `Transfer project ownership`. 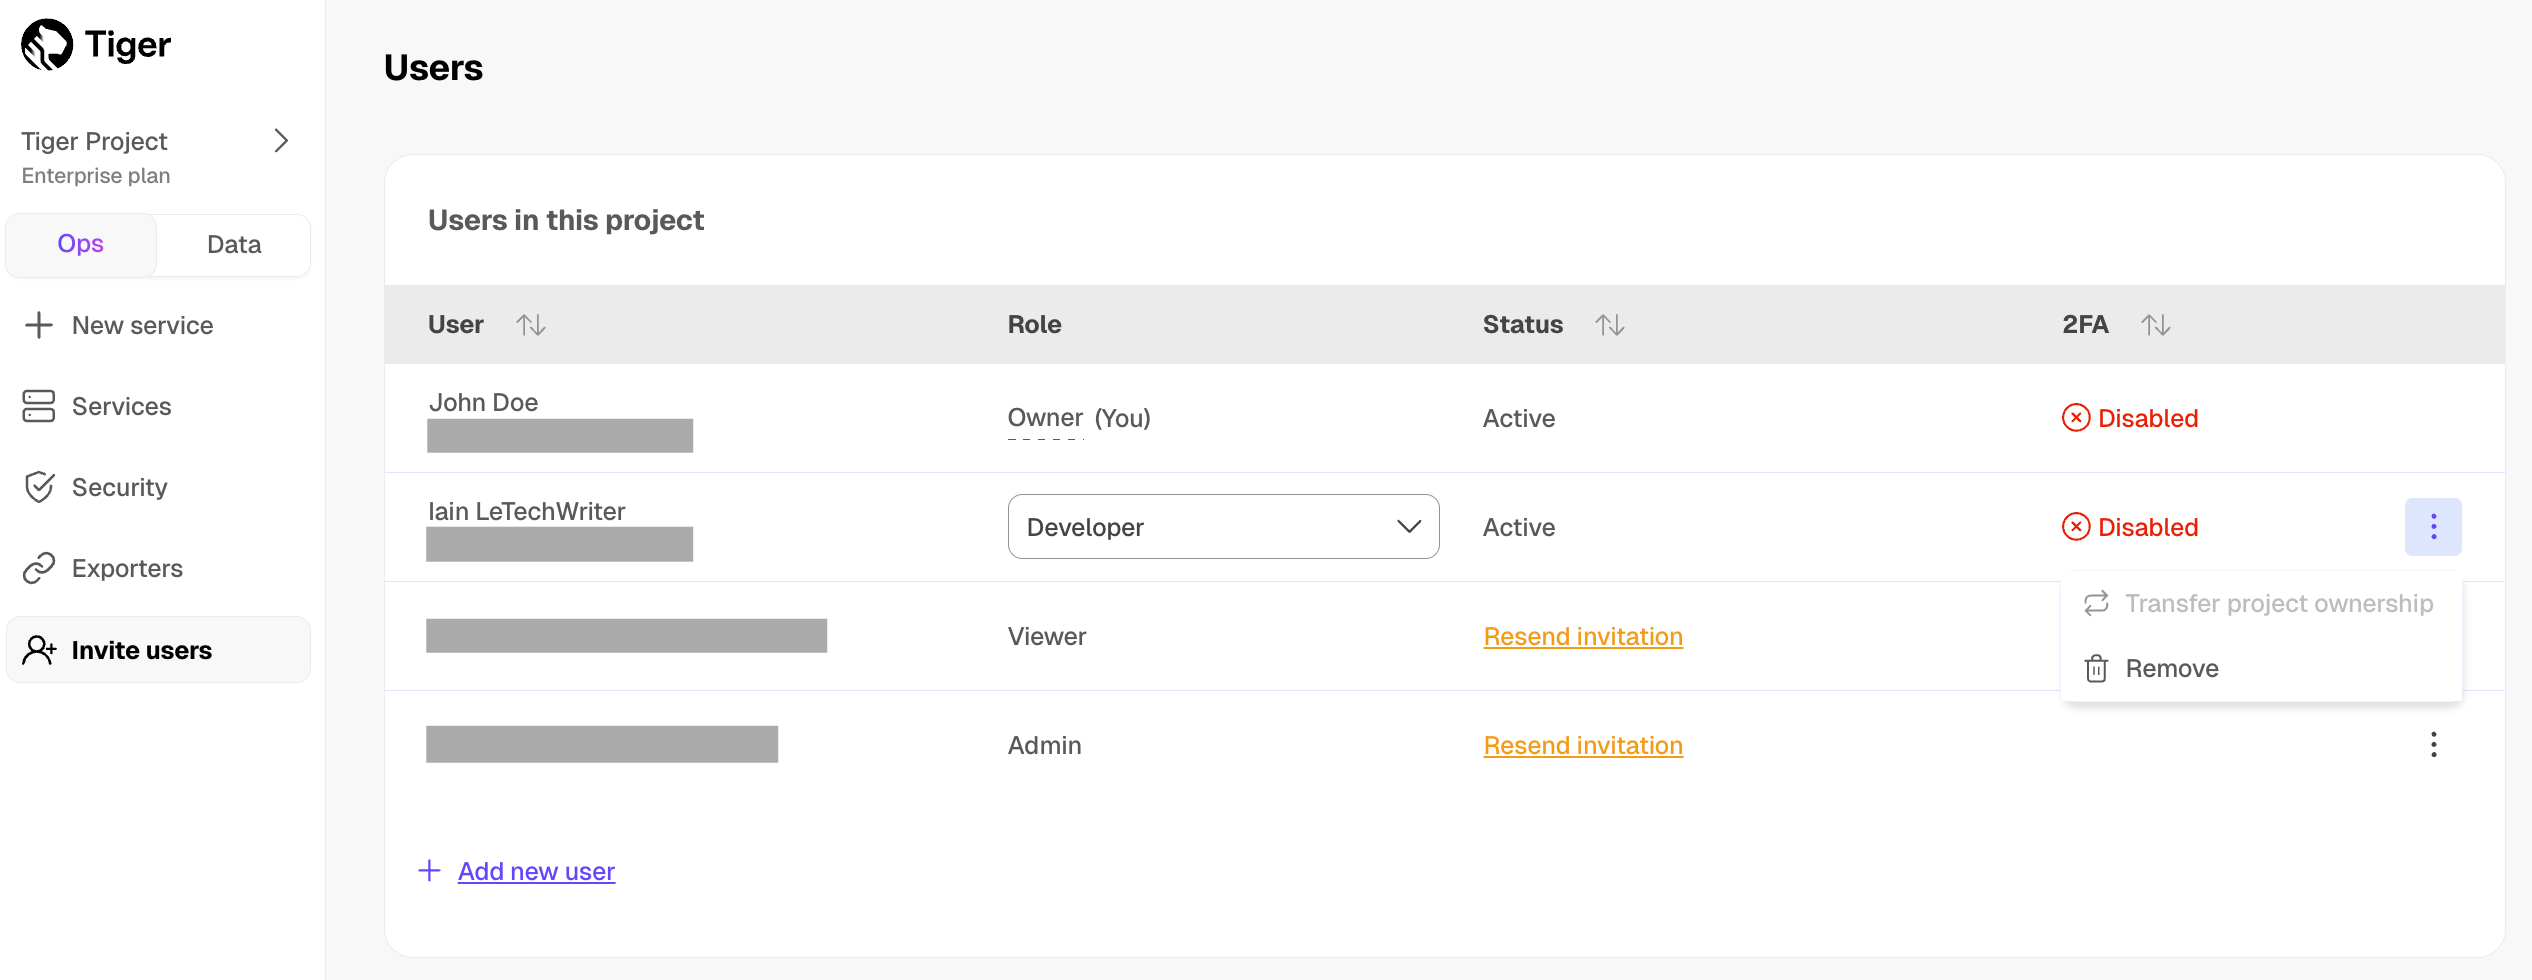 If you are unable to transfer ownership, hover over the greyed out button to see the details. 1. Enter your password, and click `Verify`. 1. Complete the two-factor authentication challenge and click `Confirm`. If you have the [Enterprise pricing plan][pricing-plans], and log in to Tiger Cloud using [SAML authentication][saml] or have not enabled [two-factor authentication][2fa], [contact support](https://www.tigerdata.com/contact) to transfer project ownership. ## Leave a project To stop working in a project: 1. In [Tiger Cloud Console][cloud-login], click `Invite users`. 1. Click `⋮` > `Leave project`, then click `Leave`. Your account is removed from the project immediately, you can no longer access this project. ## Change roles of other users in a project The Owner can change the roles of all users in the project. An Admin can change the roles of all users other than the Owner. Developer and Viewer cannot change the roles of other users. To change the role for another user: 1. In [Tiger Cloud Console][cloud-login], click `Invite users`. 1. Next to the corresponding user, select another role in the dropdown. 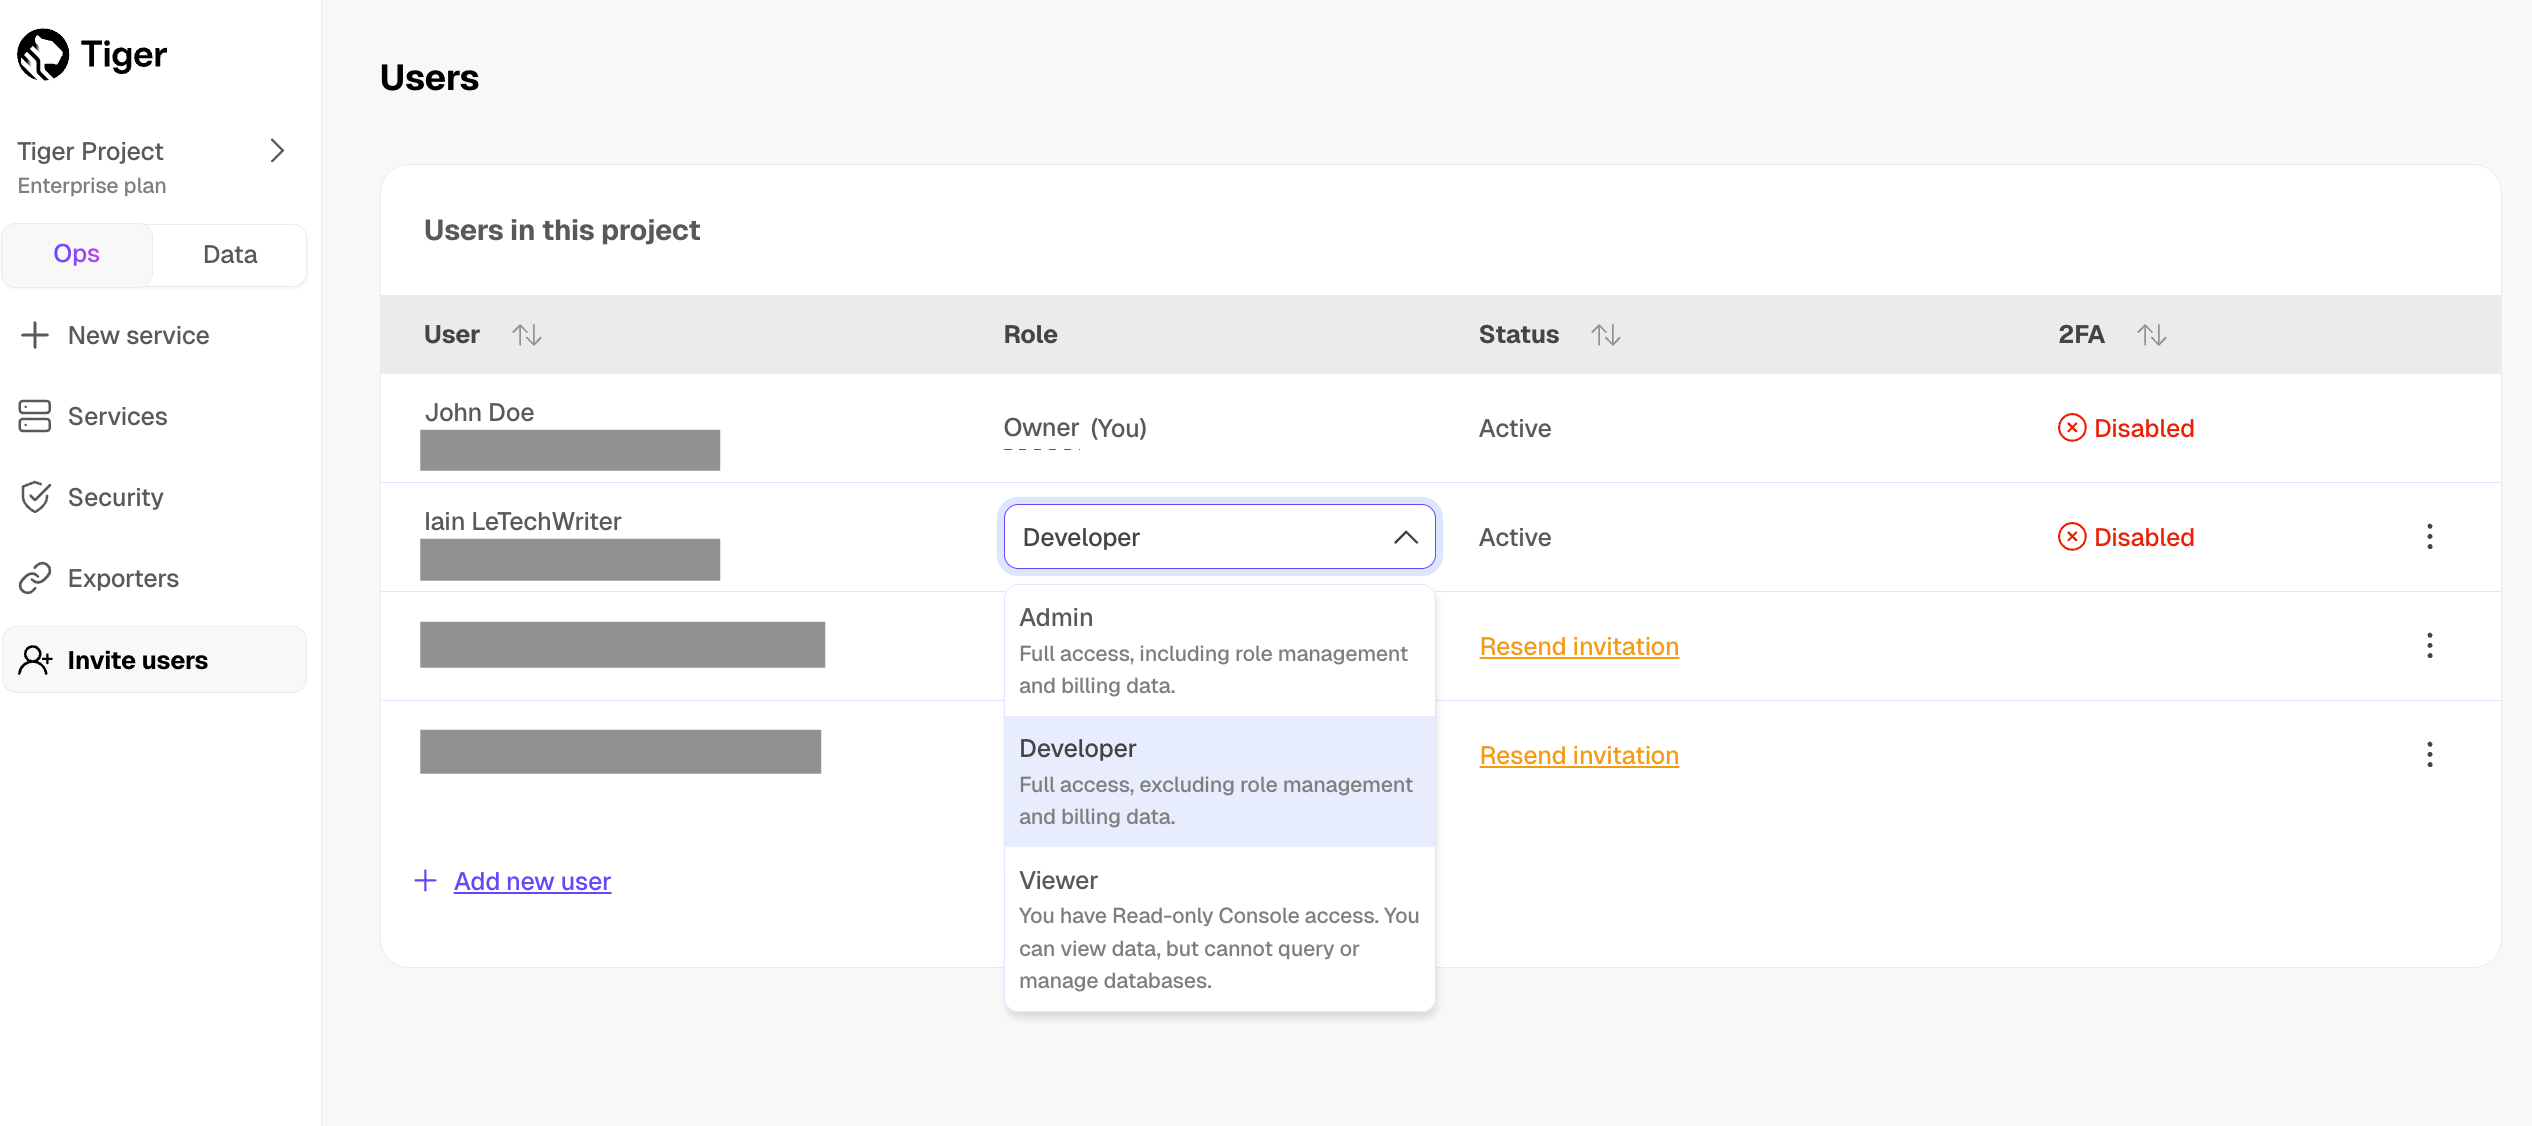 The user role is changed immediately. ## Remove users from a project To remove a user's access to a project: 1. In [Tiger Cloud Console][cloud-login], click `Invite users`. 1. Next to the person you want to remove, click `⋮` > `Remove`.  1. In `Remove user`, click `Remove`. The user is deleted immediately, they can no longer access your project. ===== PAGE: https://docs.tigerdata.com/use-timescale/security/vpc/ ===== # Virtual Private Cloud You use Virtual Private Cloud (VPC) peering to ensure that your Tiger Cloud services are only accessible through your secured AWS infrastructure. This reduces the potential attack vector surface and improves security. The data isolation architecture that ensures a highly secure connection between your apps and Tiger Cloud is: 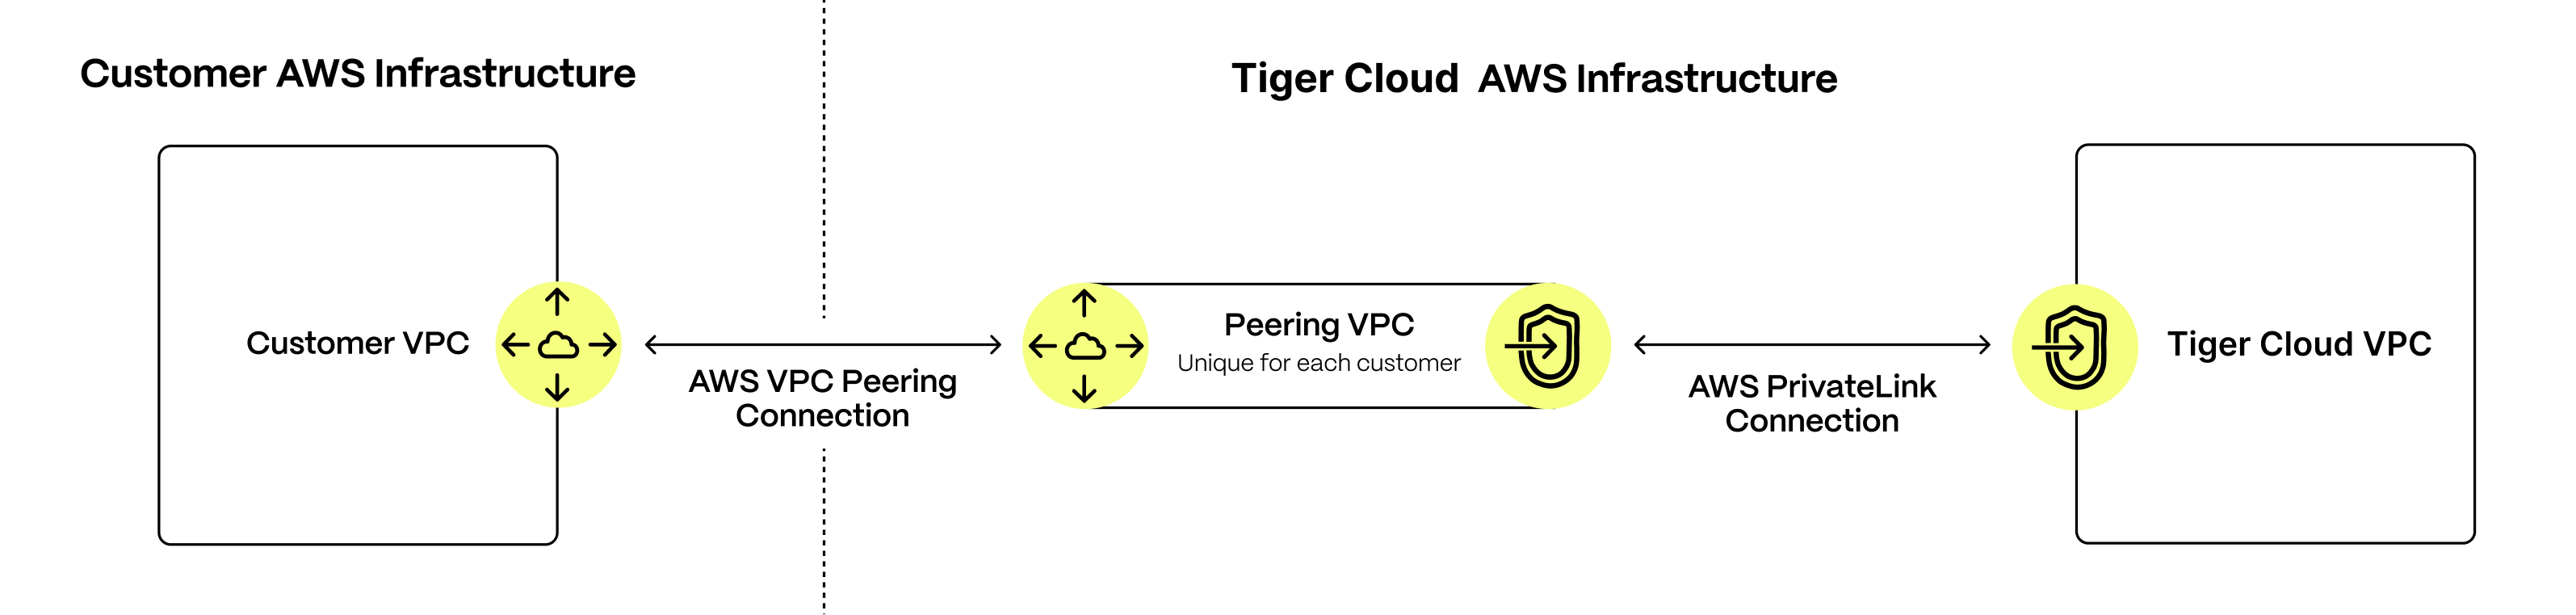 Your customer apps run inside your AWS Customer VPC, your Tiger Cloud services always run inside the secure Tiger Cloud VPC. You control secure communication between apps in your VPC and your services using a dedicated Peering VPC. The AWS PrivateLink connecting Tiger Cloud VPC to the dedicated Peering VPC gives the same level of protection as using a direct AWS PrivateLink connection. It only enables communication to be initiated from your Customer VPC to services running in the Tiger Cloud VPC. Tiger Cloud cannot initiate communication with your Customer VPC. To configure this secure connection, you first create a Peering VPC with AWS PrivateLink in Tiger Cloud Console. After you have accepted and configured the peering connection to your Customer VPC, you use AWS Security Groups to restrict the apps in your Customer VPC that are visible to the Peering VPC. The last step is to attach individual services to the Peering VPC in Tiger Cloud Console. * You create each Peering VPC on a [Tiger Cloud project level][project-members]. * You **can attach**: * Up to 50 Customer VPCs to a Peering VPC. * A Tiger Cloud service to a single Peering VPC at a time. The service and the Peering VPC must be in the same AWS region. However, you can peer a Customer VPC and a Peering VPC that are in different regions. * Multiple Tiger Cloud services to the same Peering VPC. * You **cannot attach** a Tiger Cloud service to multiple Peering VPCs at the same time. The number of Peering VPCs you can create in your project depends on your [pricing plan][pricing-plans]. If you need another Peering VPC, either contact [support@tigerdata.com](mailto:support@tigerdata.com) or change your pricing plan in [Tiger Cloud Console][console-login]. ## Prerequisites To set up VPC peering, you need the following permissions in your AWS account: * Accept VPC peering requests * Configure route table rules * Configure security group and firewall rules ## Set up a secured connection between Tiger Cloud and AWS To connect to a Tiger Cloud service using VPC peering, your apps and infrastructure must be already running in an Amazon Web Services (AWS) VPC. You can peer your VPC from any AWS region. However, your Peering VPC must be within one of the [Cloud-supported regions][tsc-regions]. The stages to create a secured connection between Tiger Cloud services and your AWS infrastructure are: 1. [Create a Peering VPC in Tiger Cloud Console][aws-vpc-setup-vpc] 1. [Complete the VPC connection in your AWS][aws-vpc-complete] 1. [Set up security groups in your AWS][aws-vpc-security-groups] 1. [Attach a Tiger Cloud service to the Peering VPC][aws-vpc-connect-vpcs] ### Create a Peering VPC in Tiger Cloud Console Create the VPC and the peering connection that enables you to securely route traffic between Tiger Cloud and your Customer VPC in a logically isolated virtual network. 1. **In [Tiger Cloud Console > Security > VPC][console-vpc], click `Create a VPC`**  1. **Choose your region and IP range, name your VPC, then click `Create VPC`**  The IP ranges of the Peering VPC and Customer VPC should not overlap. 1. **For as many peering connections as you need**: 1. In the `VPC Peering` column, click `Add`. 2. Enter information about your existing Customer VPC, then click `Add Connection`.  * You **can attach**: * Up to 50 Customer VPCs to a Peering VPC. * A Tiger Cloud service to a single Peering VPC at a time. The service and the Peering VPC must be in the same AWS region. However, you can peer a Customer VPC and a Peering VPC that are in different regions. * Multiple Tiger Cloud services to the same Peering VPC. * You **cannot attach** a Tiger Cloud service to multiple Peering VPCs at the same time. The number of Peering VPCs you can create in your project depends on your [pricing plan][pricing-plans]. If you need another Peering VPC, either contact [support@tigerdata.com](mailto:support@tigerdata.com) or change your pricing plan in [Tiger Cloud Console][console-login]. Tiger Cloud sends a peering request to your AWS account so you can [complete the VPC connection in AWS][aws-vpc-complete]. ### Complete the VPC connection in AWS When you receive the Tiger Cloud peering request in AWS, edit your routing table to match the `IP Range` and `CIDR block` between your Customer and Peering VPCs. When you peer a VPC with multiple CIDRs, all CIDRs are added to the Tiger Cloud rules automatically. After you have finished peering, further changes in your VPC's CIDRs are not detected automatically. If you need to refresh the CIDRs, recreate the peering connection. The request acceptance process is an important safety mechanism. Do not accept a peering request from an unknown account. 1. **In [AWS > VPC Dashboard > Peering connections][aws-dashboard], select the peering connection request from Tiger Cloud** Copy the peering connection ID to the clipboard. The connection request starts with `pcx-`. 1. **In the peering connection, click `Route Tables`, then select the `Route Table ID` that corresponds to your VPC** 1. **In `Routes`, click `Edit routes`** You see the list of existing destinations. . If you do not already have a destination that corresponds to the `IP range / CIDR block` of your Peering VPC: 1. Click `Add route`, and set: * `Destination`: the CIDR block of your Peering VPC. For example: `10.0.0.7/17`. * `Target`: the peering connection ID you copied to your clipboard. 2. Click `Save changes`. Network traffic is secured between your AWS account and Tiger Cloud for this project. ### Set up security groups in AWS Security groups allow specific inbound and outbound traffic at the resource level. You can associate a VPC with one or more security groups, and each instance in your VPC may belong to a different set of security groups. The security group choices for your VPC are: * Create a security group to use for your Tiger Cloud VPC only. * Associate your VPC with an existing security group. * Do nothing, your VPC is automatically associated with the default one. To create a security group specific to your Tiger Cloud Peering VPC: 1. **[AWS > VPC Dashboard > Security Groups][aws-security-groups], click `Create security group`** 1. **Enter the rules for this security group**: <img class="main-content__illustration" src="https://assets.timescale.com/docs/images/aws-vpc-securitygroup.webp" alt="The AWS Security Groups dashboard"/> * `VPC`: select the VPC that is peered with Tiger Cloud. * `Inbound rules`: leave empty. * `Outbound rules`: * `Type`: `Custom TCP` * `Protocol`: `TCP` * `Port range`: `5432` * `Destination`: `Custom` * `Info`: the CIDR block of your Tiger Cloud Peering VPC. 1. **Click `Add rule`, then click `Create security group`** ### Attach a Tiger Cloud service to the Peering VPC Now that Tiger Cloud is communicating securely with your AWS infrastructure, you can attach one or more services to the Peering VPC. After you attach a service to a Peering VPC, you can only access it through the peered AWS VPC. It is no longer accessible using the public internet. 1. **In [Tiger Cloud Console > Services][console-services] select the service you want to connect to the Peering VPC** 1. **Click `Operations` > `Security` > `VPC`** 1. **Select the VPC, then click `Attach VPC`** And that is it, your service is now securely communicating with your AWS account inside a VPC. ## Migrate a Tiger Cloud service between VPCs To ensure that your applications continue to run without interruption, you keep service attached to the Peering VPC. However, you can change the Peering VPC your service is attached to, or disconnect from the Peering VPC and enable access to the service from the public internet. Tiger Cloud uses a different DNS for services that are attached to a Peering VPC. When you migrate a service between public access and a Peering VPC, you need to update your connection string. 1. **In [Tiger Cloud Console > Services][console-services] select the service to migrate** If you don't have a service, [create a new one][create-service]. 1. **Click `Operations` > `Security` > `VPC`** 1. **Select the VPC, then click `Attach VPC`** Migration takes a few minutes to complete and requires a change to DNS settings for the service. The service is not accessible during this time. If you receive a DNS error, allow some time for DNS propagation. ===== PAGE: https://docs.tigerdata.com/use-timescale/security/read-only-role/ ===== # Manage data security in your Tiger Cloud service When you create a service, Tiger Cloud assigns you the tsdmadmin role. This role has full permissions to modify data in your service. However, Tiger Cloud does not provide superuser access. tsdmadmin is not a superuser. As tsdmadmin, you can use standard Postgres means to create other roles or assign individual permissions. This page shows you how to create a read-only role for your database. Adding a read-only role does not provide resource isolation. To restrict the access of a read-only user, as well as isolate resources, create a [read replica][read-scaling] instead. The database-level roles for the individual services in your project do not overlap with the Tiger Cloud project user roles. This page describes the database-level roles. For user roles available in Console, see [Control user access to Tiger Cloud projects][console-rbac]. ## Create a read-only user You can create a read-only user to provide limited access to your database. 1. Connect to your service as the tsdbadmin user. 1. Create the new role: ```sql CREATE ROLE readaccess; ``` 1. Grant the appropriate permissions for the role, as required. For example, to grant `SELECT` permissions to a specific table, use: ```sql GRANT SELECT ON TO readaccess; ``` To grant `SELECT` permissions to all tables in a specific schema, use: ```sql GRANT SELECT ON ALL TABLES IN SCHEMA <SCHEMA_NAME> TO readaccess; ``` 1. Create a new user: ```sql CREATE USER read_user WITH PASSWORD 'read_password'; ``` 1. Assign the role to the new user: ```sql GRANT readaccess TO read_user; ``` ===== PAGE: https://docs.tigerdata.com/use-timescale/security/saml/ ===== # SAML (Security Assertion Markup Language) Tiger Cloud offers SAML authentication as part of its [Enterprise][enterprise-tier] offering. SAML (Security Assertion Markup Language) is an open standard for exchanging authentication and authorization data between parties. With SAML enabled Tiger Cloud customers can log into their Tiger Data account using their existing SSO service provider credentials. Tiger Cloud supports most SAML providers that can handle IDP-initiated login ### SAML offers many benefits for the Enterprise including: - Improved security: SAML centralizes user authentication with an identity provider (IdP). This makes it more difficult for attackers to gain access to user accounts. - Reduced IT costs: SAML can help companies reduce IT costs by eliminating the need to manage multiple user accounts and passwords. - Improved user experience: SAML makes it easier for users to access multiple applications and resources. ### Reach out to your CSM/sales contact to get started. The connection process looks like the following: 1. Configure the IdP to support SAML authentication. This will involve creating a new application and configuring the IdP with the settings provided by your contact. 1. Provide your contact with the requested details about your IdP. 1. Test the SAML authentication process to make sure that it is working correctly. ===== PAGE: https://docs.tigerdata.com/use-timescale/schema-management/alter/ ===== # Altering and updating table schemas To modify the schema of an existing hypertable, you can use the `ALTER TABLE` command. When you change the hypertable schema, the changes are also propagated to each underlying chunk. While you can change the schema of an existing hypertable, you cannot change the schema of a continuous aggregate. For continuous aggregates, the only permissible changes are renaming a view, setting a schema, changing the owner, and adjusting other parameters. For example, to add a new column called `address` to a table called `distributors`:sql ALTER TABLE distributors ADD COLUMN address varchar(30);
This creates the new column, with all existing entries recording `NULL` for the new column. Changing the schema can, in some cases, consume a lot of resources. This is especially true if it requires underlying data to be rewritten. If you want to check your schema change before you apply it, you can use a `CHECK` constraint, like this:sql ALTER TABLE distributors ADD CONSTRAINT zipchk CHECK (char_length(zipcode) = 5);
This scans the table to verify that existing rows meet the constraint, but does not require a table rewrite. For more information, see the [Postgres ALTER TABLE documentation][postgres-alter-table]. ===== PAGE: https://docs.tigerdata.com/use-timescale/schema-management/about-constraints/ ===== # About constraints Constraints are rules that apply to your database columns. This prevents you from entering invalid data into your database. When you create, change, or delete constraints on your hypertables, the constraints are propagated to the underlying chunks, and to any indexes. Hypertables support all standard Postgres constraint types. For foreign keys in particular, the following is supported: - Foreign key constraints from a hypertable referencing a regular table - Foreign key constraints from a regular table referencing a hypertable Foreign keys from a hypertable referencing another hypertable **are not supported**. For example, you can create a table that only allows positive device IDs, and non-null temperature readings. You can also check that time values for all devices are unique. To create this table, with the constraints, use this command:sql CREATE TABLE conditions (
time TIMESTAMPTZ temp FLOAT NOT NULL, device_id INTEGER CHECK (device_id > 0), location INTEGER REFERENCES locations (id), PRIMARY KEY(time, device_id)) WITH (
tsdb.hypertable, tsdb.partition_column='time');
If you are self-hosting TimescaleDB v2.19.3 and below, create a [Postgres relational table][pg-create-table], then convert it using [create_hypertable][create_hypertable]. You then enable hypercore with a call to [ALTER TABLE][alter_table_hypercore]. This example also references values in another `locations` table using a foreign key constraint. Time columns used for partitioning must not allow `NULL` values. A `NOT NULL` constraint is added by default to these columns if it doesn't already exist. For more information on how to manage constraints, see the [Postgres docs][postgres-createconstraint]. ===== PAGE: https://docs.tigerdata.com/use-timescale/schema-management/about-indexing/ ===== # About indexes Because looking up data can take a long time, especially if you have a lot of data in your hypertable, you can use an index to speed up read operations from non-compressed chunks in the rowstore (which use their [own columnar indexes][about-compression]). You can create an index on any combination of columns. To define an index as a `UNIQUE` or `PRIMARY KEY` index, it must include the partitioning column (this is usually the time column). Which column you choose to create your index on depends on what kind of data you have stored. When you create a hypertable, set the datatype for the `time` column as `timestamptz` and not `timestamp`. For more information, see [Postgres timestamp][postgresql-timestamp]. While it is possible to add an index that does not include the `time` column, doing so results in very slow ingest speeds. For time-series data, indexing on the time column allows one index to be created per chunk. Consider a simple example with temperatures collected from two locations named `office` and `garage`: An index on `(location, time DESC)` is organized like this:sql garage-0940 garage-0930 garage-0920 garage-0910 office-0930 office-0920 office-0910
An index on `(time DESC, location)` is organized like this:sql 0940-garage 0930-garage 0930-office 0920-garage 0920-office 0910-garage 0910-office
A good rule of thumb with indexes is to think in layers. Start by choosing the columns that you typically want to run equality operators on, such as `location = garage`. Then finish by choosing columns you want to use range operators on, such as `time > 0930`. As a more complex example, imagine you have a number of devices tracking 1,000 different retail stores. You have 100 devices per store, and 5 different types of devices. All of these devices report metrics as `float` values, and you decide to store all the metrics in the same table, like this:sql CREATE TABLE devices (
time timestamptz, device_id int, device_type int, store_id int, value float);
When you create this table, an index is automatically generated on the time column, making it faster to query your data based on time. If you want to query your data on something other than time, you can create different indexes. For example, you might want to query data from the last month for just a given `device_id`. Or you could query all data for a single `store_id` for the last three months. You want to keep the index on time so that you can quickly filter for a given time range, and add another index on `device_id` and `store_id`. This creates a composite index. A composite index on `(store_id, device_id, time)` orders by `store_id` first. Each unique `store_id`, will then be sorted by `device_id` in order. And each entry with the same `store_id` and `device_id` are then ordered by `time`. To create this index, use this command:sql CREATE INDEX ON devices (store_id, device_id, time DESC);
When you have this composite index on your hypertable, you can run a range of different queries. Here are some examples:sql SELECT * FROM devices WHERE store_id = x
This queries the portion of the list with a specific `store_id`. The index is effective for this query, but could be a bit bloated; an index on just `store_id` would probably be more efficient.sql SELECT * FROM devices WHERE store_id = x, time > 10
This query is not effective, because it would need to scan multiple sections of the list. This is because the part of the list that contains data for `time > 10` for one device would be located in a different section than for a different device. In this case, consider building an index on `(store_id, time)` instead.sql SELECT * FROM devices WHERE device_id = M, time > 10
The index in the example is useless for this query, because the data for `device M` is located in a completely different section of the list for each `store_id`.sql SELECT * FROM devices WHERE store_id = M, device_id = M, time > 10
This is an accurate query for this index. It narrows down the list to a very specific portion. ===== PAGE: https://docs.tigerdata.com/use-timescale/schema-management/json/ ===== # JSONB support for semi-structured data You can use JSON and JSONB to provide semi-structured data. This is most useful for data that contains user-defined fields, such as field names that are defined by individual users and vary from user to user. We recommend using this in a semi-structured way, for example:sql CREATE TABLE metrics ( time TIMESTAMPTZ, user_id INT, device_id INT, data JSONB );
When you are defining a schema using JSON, ensure that common fields, such as `time`, `user_id`, and `device_id`, are pulled outside of the JSONB structure and stored as columns. This is because field accesses are more efficient on table columns than inside JSONB structures. Storage is also more efficient. You should also use the JSONB data type, that is, JSON stored in a binary format, rather than JSON data type. JSONB data types are more efficient in both storage overhead and lookup performance. Use JSONB for user-defined data rather than sparse data. This works best for most data sets. For sparse data, use NULLable fields and, if possible, run on top of a compressed file system like ZFS. This will work better than a JSONB data type, unless the data is extremely sparse, for example, more than 95% of fields for a row are empty. ## Index the JSONB structure When you index JSONB data across all fields, it is usually best to use a GIN (generalized inverted) index. In most cases, you can use the default GIN operator, like this:sql CREATE INDEX idxgin ON metrics USING GIN (data);
For more information about GIN indexes, see the [Postgres documentation][json-indexing]. This index only optimizes queries where the `WHERE` clause uses the `?`, `?&`, `?|`, or `@>` operator. For more information about these operators, see the [Postgres documentation][json-operators]. ## Index individual fields JSONB columns sometimes have common fields containing values that are useful to index individually. Indexes like this can be useful for ordering operations on field values, [multicolumn indexes][multicolumn-index], and indexes on specialized types, such as a postGIS geography type. Another advantage of indexes on individual field values is that they are often smaller than GIN indexes on the entire JSONB field. To create an index like this, it is usually best to use a [partial index][partial-index] on an [expression][expression-index] accessing the field. For example:sql CREATE INDEX idxcpu ON metrics(((data->>'cpu')::double precision)) WHERE data ? 'cpu';
In this example, the expression being indexed is the `cpu` field inside the `data` JSONB object, cast to a double. The cast reduces the size of the index by storing the much smaller double, instead of a string. The `WHERE` clause ensures that the only rows included in the index are those that contain a `cpu` field, because the `data ? 'cpu'` returns `true`. This also serves to reduce the size of the index by not including rows without a `cpu` field. Note that in order for a query to use the index, it must have `data ? 'cpu'` in the WHERE clause. This expression can also be used with a multi-column index, for example, by adding `time DESC` as a leading column. Note, however, that to enable index-only scans, you need `data` as a column, not the full expression `((data->>'cpu')::double precision)`. ===== PAGE: https://docs.tigerdata.com/use-timescale/schema-management/about-tablespaces/ ===== # About tablespaces Tablespaces are used to determine the physical location of the tables and indexes in your database. In most cases, you want to use faster storage to store data that is accessed frequently, and slower storage for data that is accessed less often. Hypertables consist of a number of chunks, and each chunk can be located in a specific tablespace. This allows you to grow your hypertables across many disks. When you create a new chunk, a tablespace is automatically selected to store the chunk's data. You can attach and detach tablespaces on a hypertable. When a disk runs out of space, you can [detach][detach_tablespace] the full tablespace from the hypertable, and than [attach][attach_tablespace] a tablespace associated with a new disk. To see the tablespaces for you hypertable, use the [`show_tablespaces`][show_tablespaces] command. ## How hypertable chunks are assigned tablespaces A hypertable can be partitioned in multiple dimensions, but only one of the dimensions is used to determine the tablespace assigned to a particular hypertable chunk. If a hypertable has one or more hash-partitioned, or space, dimensions, it uses the first hash-partitioned dimension. Otherwise, it uses the first time dimension. This strategy ensures that hash-partitioned hypertables have chunks co-located according to hash partition, as long as the list of tablespaces attached to the hypertable remains the same. Modulo calculation is used to pick a tablespace, so there can be more partitions than tablespaces. For example, if there are two tablespaces, partition number three uses the first tablespace. Hypertables that are only time-partitioned add new partitions continuously, and therefore have chunks assigned to tablespaces in a way similar to round-robin. It is possible to attach more tablespaces than there are partitions for the hypertable. In this case, some tablespaces remain unused until others are detached or additional partitions are added. This is especially true for hash-partitioned tables. ===== PAGE: https://docs.tigerdata.com/use-timescale/schema-management/about-schemas/ ===== # Table management A database schema defines how the tables and indexes in your database are organized. Using a schema that is appropriate for your workload can result in significant performance improvements. Conversely, using a poorly suited schema can result in significant performance degradation. If you are working with semi-structured data, such as readings from IoT sensors that collect varying measurements, you might need a flexible schema. In this case, you can use Postgres JSON and JSONB data types. TimescaleDB supports all table objects supported within Postgres, including data types, indexes, and triggers. However, when you create a hypertable, set the datatype for the `time` column as `timestamptz` and not `timestamp`. For more information, see [Postgres timestamp][postgresql-timestamp]. This section explains how to design your schema, how indexing and tablespaces work, and how to use Postgres constraint types. It also includes examples to help you create your own schema, and learn how to use JSON and JSONB for semi-structured data. ===== PAGE: https://docs.tigerdata.com/use-timescale/schema-management/indexing/ ===== # Indexing data You can use an index on your database to speed up read operations. You can create an index on any combination of columns. TimescaleDB supports all table objects supported within Postgres, including data types, indexes, and triggers. You can create an index using the `CREATE INDEX` command. For example, to create an index that sorts first by `location`, then by `time`, in descending order:sql CREATE INDEX ON conditions (location, time DESC);
You can run this command before or after you convert a regular Postgres table to a hypertable. ## Default indexes Some indexes are created by default when you perform certain actions on your database. When you create a hypertable with a call to [`CREATE TABLE`][hypertable-create-table], a time index is created on your data. If you want to manually create a time index, you can use this command:sql CREATE INDEX ON conditions (time DESC);
You can also create an additional index on another column and time. For example:sql CREATE INDEX ON conditions (location, time DESC);
TimescaleDB also creates sparse indexes per compressed chunk for optimization. You can manually set up those indexes when you call [`CREATE TABLE`][hypertable-create-table] or [`ALTER_TABLE`][alter-table]. For more information about the order to use when declaring indexes, see the [about indexing][about-index] section. If you do not want to create default indexes, you can set `create_default_indexes` to `false` when you create a hypertable. For example:sql CREATE TABLE conditions ( time TIMESTAMPTZ NOT NULL, location TEXT NOT NULL, device TEXT NOT NULL, temperature DOUBLE PRECISION NULL, humidity DOUBLE PRECISION NULL ) WITH ( tsdb.hypertable, tsdb.partition_column='time', tsdb.create_default_indexes=false );
## OldCreateHypertable Refer to the installation documentation for detailed setup instructions. ## Best practices for indexing If you have sparse data, with columns that are often NULL, you can add a clause to the index, saying `WHERE column IS NOT NULL`. This prevents the index from indexing NULL data, which can lead to a more compact and efficient index. For example:sql CREATE INDEX ON conditions (time DESC, humidity) WHERE humidity IS NOT NULL;
To define an index as a `UNIQUE` or `PRIMARY KEY` index, the index must include the time column and the partitioning column, if you are using one. For example, a unique index must include at least the `(time, location)` columns, in addition to any other columns you want to use. Generally, time-series data uses `UNIQUE` indexes more rarely than relational data. If you do not want to create an index in a single transaction, you can use the [`CREATE_INDEX`][create-index] function. This uses a separate function to create an index on each chunk, instead of a single transaction for the entire hypertable. This means that you can perform other actions on the table while the index is being created, rather than having to wait until index creation is complete. You can also use the [Postgres `WITH` clause](https://www.postgresql.org/docs/current/queries-with.html) to perform indexing transactions on an individual chunk. ===== PAGE: https://docs.tigerdata.com/use-timescale/schema-management/triggers/ ===== # Triggers TimescaleDB supports the full range of Postgres triggers. Creating, altering, or dropping triggers on a hypertable propagates the changes to all of the underlying chunks. ## Create a trigger This example creates a new table called `error_conditions` with the same schema as `conditions`, but that only stores records which are considered errors. An error, in this case, is when an application sends a `temperature` or `humidity` reading with a value that is greater than or equal to 1000. ### Creating a trigger 1. Create a function that inserts erroneous data into the `error_conditions` table: ```sql CREATE OR REPLACE FUNCTION record_error() RETURNS trigger AS $record_error$ BEGIN IF NEW.temperature >= 1000 OR NEW.humidity >= 1000 THEN INSERT INTO error_conditions VALUES(NEW.time, NEW.location, NEW.temperature, NEW.humidity); END IF; RETURN NEW; END; $record_error$ LANGUAGE plpgsql; ``` 1. Create a trigger that calls this function whenever a new row is inserted into the hypertable: ```sql CREATE TRIGGER record_error BEFORE INSERT ON conditions FOR EACH ROW EXECUTE PROCEDURE record_error(); ``` 1. All data is inserted into the `conditions` table, but rows that contain errors are also added to the `error_conditions` table. TimescaleDB supports the full range of triggers, including `BEFORE INSERT`, `AFTER INSERT`, `BEFORE UPDATE`, `AFTER UPDATE`, `BEFORE DELETE`, and `AFTER DELETE`. For more information, see the [Postgres docs][postgres-createtrigger]. ===== PAGE: https://docs.tigerdata.com/use-timescale/schema-management/foreign-data-wrappers/ ===== # Foreign data wrappers You use Postgres foreign data wrappers (FDWs) to query external data sources from a Tiger Cloud service. These external data sources can be one of the following: - Other Tiger Cloud services - Postgres databases outside of Tiger Cloud If you are using VPC peering, you can create FDWs in your Customer VPC to query a service in your Tiger Cloud project. However, you can't create FDWs in your Tiger Cloud services to query a data source in your Customer VPC. This is because Tiger Cloud VPC peering uses AWS PrivateLink for increased security. See [VPC peering documentation][vpc-peering] for additional details. Postgres FDWs are particularly useful if you manage multiple Tiger Cloud services with different capabilities, and need to seamlessly access and merge regular and time-series data. ## Prerequisites To follow the steps on this page: * Create a target [Tiger Cloud service][create-service] with the Real-time analytics capability. You need [your connection details][connection-info]. This procedure also works for [self-hosted TimescaleDB][enable-timescaledb]. ## Query another data source To query another data source: You create Postgres FDWs with the `postgres_fdw` extension, which is enabled by default in Tiger Cloud. 1. **Connect to your service** See [how to connect][connect]. 1. **Create a server** Run the following command using your [connection details][connection-info]:sql CREATE SERVER myserver FOREIGN DATA WRAPPER postgres_fdw OPTIONS (host '', dbname 'tsdb', port '');
1. **Create user mapping** Run the following command using your [connection details][connection-info]:sql CREATE USER MAPPING FOR tsdbadmin SERVER myserver OPTIONS (user 'tsdbadmin', password '');
1. **Import a foreign schema (recommended) or create a foreign table** - Import the whole schema: ```sql CREATE SCHEMA foreign_stuff; IMPORT FOREIGN SCHEMA public FROM SERVER myserver INTO foreign_stuff ; ``` - Alternatively, import a limited number of tables: ```sql CREATE SCHEMA foreign_stuff; IMPORT FOREIGN SCHEMA public LIMIT TO (table1, table2) FROM SERVER myserver INTO foreign_stuff; ``` - Create a foreign table. Skip if you are importing a schema: ```sql CREATE FOREIGN TABLE films ( code char(5) NOT NULL, title varchar(40) NOT NULL, did integer NOT NULL, date_prod date, kind varchar(10), len interval hour to minute ) SERVER film_server; ``` A user with the `tsdbadmin` role assigned already has the required `USAGE` permission to create Postgres FDWs. You can enable another user, without the `tsdbadmin` role assigned, to query foreign data. To do so, explicitly grant the permission. For example, for a new `grafana` user:sql CREATE USER grafana;
GRANT grafana TO tsdbadmin;
CREATE SCHEMA fdw AUTHORIZATION grafana;
CREATE SERVER db1 FOREIGN DATA WRAPPER postgres_fdw OPTIONS (host '', dbname 'tsdb', port '');
CREATE USER MAPPING FOR grafana SERVER db1 OPTIONS (user 'tsdbadmin', password '');
GRANT USAGE ON FOREIGN SERVER db1 TO grafana;
SET ROLE grafana;
IMPORT FOREIGN SCHEMA public
FROM SERVER db1 INTO fdw;You create Postgres FDWs with the `postgres_fdw` extension. See [documenation][enable-fdw-docs] on how to enable it. 1. **Connect to your database** Use [`psql`][psql] to connect to your database. 1. **Create a server** Run the following command using your [connection details][connection-info]:sql CREATE SERVER myserver FOREIGN DATA WRAPPER postgres_fdw OPTIONS (host '', dbname '', port '');
1. **Create user mapping** Run the following command using your [connection details][connection-info]:sql CREATE USER MAPPING FOR postgres SERVER myserver OPTIONS (user 'postgres', password '');
1. **Import a foreign schema (recommended) or create a foreign table** - Import the whole schema: ```sql CREATE SCHEMA foreign_stuff; IMPORT FOREIGN SCHEMA public FROM SERVER myserver INTO foreign_stuff ; ``` - Alternatively, import a limited number of tables: ```sql CREATE SCHEMA foreign_stuff; IMPORT FOREIGN SCHEMA public LIMIT TO (table1, table2) FROM SERVER myserver INTO foreign_stuff; ``` - Create a foreign table. Skip if you are importing a schema: ```sql CREATE FOREIGN TABLE films ( code char(5) NOT NULL, title varchar(40) NOT NULL, did integer NOT NULL, date_prod date, kind varchar(10), len interval hour to minute ) SERVER film_server; ``` ===== PAGE: https://docs.tigerdata.com/use-timescale/write-data/insert/ ===== # Insert data Insert data into a hypertable with a standard [`INSERT`][postgres-insert] SQL command. ## Insert a single row To insert a single row into a hypertable, use the syntax `INSERT INTO ... VALUES`. For example, to insert data into a hypertable named `conditions`:sql INSERT INTO conditions(time, location, temperature, humidity) VALUES (NOW(), 'office', 70.0, 50.0);
## Insert multiple rows You can also insert multiple rows into a hypertable using a single `INSERT` call. This works even for thousands of rows at a time. This is more efficient than inserting data row-by-row, and is recommended when possible. Use the same syntax, separating rows with a comma:sql INSERT INTO conditions VALUES
(NOW(), 'office', 70.0, 50.0), (NOW(), 'basement', 66.5, 60.0), (NOW(), 'garage', 77.0, 65.2);You can insert multiple rows belonging to different chunks within the same `INSERT` statement. Behind the scenes, TimescaleDB batches the rows by chunk, and writes to each chunk in a single transaction. ## Insert and return data In the same `INSERT` command, you can return some or all of the inserted data by adding a `RETURNING` clause. For example, to return all the inserted data, run:sql INSERT INTO conditions VALUES (NOW(), 'office', 70.1, 50.1) RETURNING *;
This returns:sql time | location | temperature | humidity ------------------------------+----------+-------------+---------- 2017-07-28 11:42:42.846621+00 | office | 70.1 | 50.1 (1 row)
===== PAGE: https://docs.tigerdata.com/use-timescale/write-data/about-writing-data/ ===== # About writing data TimescaleDB supports writing data in the same way as Postgres, using `INSERT`, `UPDATE`, `INSERT ... ON CONFLICT`, and `DELETE`. TimescaleDB is optimized for running real-time analytics workloads on time-series data. For this reason, hypertables are optimized for inserts to the most recent time intervals. Inserting data with recent time values gives [excellent performance](https://www.timescale.com/blog/postgresql-timescaledb-1000x-faster-queries-90-data-compression-and-much-more). However, if you need to make frequent updates to older time intervals, you might see lower write throughput. ===== PAGE: https://docs.tigerdata.com/use-timescale/write-data/upsert/ ===== # Upsert data Upserting is an operation that performs both: * Inserting a new row if a matching row doesn't already exist * Either updating the existing row, or doing nothing, if a matching row already exists Upserts only work when you have a unique index or constraint. A matching row is one that has identical values for the columns covered by the index or constraint. In Postgres, a primary key is a unique index with a `NOT NULL` constraint. If you have a primary key, you automatically have a unique index. ## Create a table with a unique constraint The examples in this section use a `conditions` table with a unique constraint on the columns `(time, location)`. To create a unique constraint, use `UNIQUE (<COLUMNS>)` while defining your table:sql CREATE TABLE conditions ( time TIMESTAMPTZ NOT NULL, location TEXT NOT NULL, temperature DOUBLE PRECISION NULL, humidity DOUBLE PRECISION NULL, UNIQUE (time, location) );
You can also create a unique constraint after the table is created. Use the syntax `ALTER TABLE ... ADD CONSTRAINT ... UNIQUE`. In this example, the constraint is named `conditions_time_location`:sql ALTER TABLE conditions ADD CONSTRAINT conditions_time_location
UNIQUE (time, location);When you add a unique constraint to a table, you can't insert data that violates the constraint. In other words, if you try to insert data that has identical values to another row, within the columns covered by the constraint, you get an error. Unique constraints must include all partitioning columns. That means unique constraints on a hypertable must include the time column. If you added other partitioning columns to your hypertable, the constraint must include those as well. For more information, see the section on [hypertables and unique indexes](https://docs.tigerdata.com/use-timescale/latest/hypertables/hypertables-and-unique-indexes/). ## Insert or update data to a table with a unique constraint You can tell the database to insert new data if it doesn't violate the constraint, and to update the existing row if it does. Use the syntax `INSERT INTO ... VALUES ... ON CONFLICT ... DO UPDATE`. For example, to update the `temperature` and `humidity` values if a row with the specified `time` and `location` already exists, run:sql INSERT INTO conditions VALUES ('2017-07-28 11:42:42.846621+00', 'office', 70.2, 50.1) ON CONFLICT (time, location) DO UPDATE
SET temperature = excluded.temperature, humidity = excluded.humidity;## Insert or do nothing to a table with a unique constraint You can also tell the database to do nothing if the constraint is violated. The new data is not inserted, and the old row is not updated. This is useful when writing many rows as one batch, to prevent the entire transaction from failing. The database engine skips the row and moves on. To insert or do nothing, use the syntax `INSERT INTO ... VALUES ... ON CONFLICT DO NOTHING`:sql INSERT INTO conditions VALUES ('2017-07-28 11:42:42.846621+00', 'office', 70.1, 50.0) ON CONFLICT DO NOTHING;
===== PAGE: https://docs.tigerdata.com/use-timescale/write-data/delete/ ===== # Delete data You can delete data from a hypertable using a standard [`DELETE`][postgres-delete] SQL command. If you want to delete old data once it reaches a certain age, you can also drop entire chunks or set up a data retention policy. ## Delete data with DELETE command To delete data from a table, use the syntax `DELETE FROM ...`. In this example, data is deleted from the table `conditions`, if the row's `temperature` or `humidity` is below a certain level:sql DELETE FROM conditions WHERE temperature < 35 OR humidity < 60;
If you delete a lot of data, run [`VACUUM`](https://www.postgresql.org/docs/current/sql-vacuum.html) or `VACUUM FULL` to reclaim storage from the deleted or obsolete rows. ## Delete data by dropping chunks TimescaleDB allows you to delete data by age, by dropping chunks from a hypertable. You can do so either manually or by data retention policy. To learn more, see the [data retention section][data-retention]. ===== PAGE: https://docs.tigerdata.com/use-timescale/write-data/update/ ===== # Update data Update data in a hypertable with a standard [`UPDATE`][postgres-update] SQL command. ## Update a single row Update a single row with the syntax `UPDATE ... SET ... WHERE`. For example, to update a row in the `conditions` hypertable with new `temperature` and `humidity` values, run the following. The `WHERE` clause specifies the row to be updated.sql UPDATE conditions SET temperature = 70.2, humidity = 50.0 WHERE time = '2017-07-28 11:42:42.846621+00'
AND location = 'office';## Update multiple rows at once You can also update multiple rows at once, by using a `WHERE` clause that filters for more than one row. For example, run the following to update all `temperature` values within the given 10-minute span:sql UPDATE conditions SET temperature = temperature + 0.1 WHERE time >= '2017-07-28 11:40'
AND time < '2017-07-28 11:50';===== PAGE: https://docs.tigerdata.com/use-timescale/hypertables/hypertables-and-unique-indexes/ ===== # Enforce constraints with unique indexes You use unique indexes on a hypertable to enforce [constraints][constraints]. If you have a primary key, you have a unique index. In Postgres, a primary key is a unique index with a `NOT NULL` constraint. You do not need to have a unique index on your hypertables. When you create a unique index, it must contain all the partitioning columns of the hypertable. ## Create a hypertable and add unique indexes To create a unique index on a hypertable: 1. **Determine the partitioning columns** Before you create a unique index, you need to determine which unique indexes are allowed on your hypertable. Begin by identifying your partitioning columns. TimescaleDB traditionally uses the following columns to partition hypertables: * The `time` column used to create the hypertable. Every TimescaleDB hypertable is partitioned by time. * Any space-partitioning columns. Space partitions are optional and not included in every hypertable. 1. **Create a hypertable** Create a [hypertable][hypertables-section] for your time-series data using [CREATE TABLE][hypertable-create-table]. For [efficient queries][secondary-indexes] on data in the columnstore, remember to `segmentby` the column you will use most often to filter your data. For example: ```sql CREATE TABLE hypertable_example( time TIMESTAMPTZ, user_id BIGINT, device_id BIGINT, value FLOAT ) WITH ( tsdb.hypertable, tsdb.partition_column='time', tsdb.segmentby = 'device_id', tsdb.orderby = 'time DESC' ); ``` If you are self-hosting TimescaleDB v2.19.3 and below, create a [Postgres relational table][pg-create-table], then convert it using [create_hypertable][create_hypertable]. You then enable hypercore with a call to [ALTER TABLE][alter_table_hypercore]. 1. **Create a unique index on the hypertable** When you create a unique index on a hypertable, it must contain all the partitioning columns. It may contain other columns as well, and they may be arranged in any order. You cannot create a unique index without `time`, because `time` is a partitioning column. For example: - Create a unique index on `time` and `device_id` with a call to `CREATE UNIQUE INDEX`: ```sql CREATE UNIQUE INDEX idx_deviceid_time ON hypertable_example(device_id, time); ``` - Create a unique index on `time`, `user_id`, and `device_id`. `device_id` is not a partitioning column, but this still works: ```sql CREATE UNIQUE INDEX idx_userid_deviceid_time ON hypertable_example(user_id, device_id, time); ``` This restriction is necessary to guarantee global uniqueness in the index. ## Create a hypertable from an existing table with unique indexes If you create a unique index on a table before turning it into a hypertable, the same restrictions apply in reverse. You can only partition the table by columns in your unique index. 1. **Create a relational table** ```sql CREATE TABLE another_hypertable_example( time TIMESTAMPTZ, user_id BIGINT, device_id BIGINT, value FLOAT ); ``` 1. **Create a unique index on the table** For example, on `device_id` and `time`: ```sql CREATE UNIQUE INDEX idx_deviceid_time ON another_hypertable_example(device_id, time); ``` 1. **Turn the table into a partitioned hypertable** - On `time` alone: ```sql SELECT * from create_hypertable('another_hypertable_example', by_range('time')); ``` - On `time` and `device_id`: ```sql SELECT * FROM create_hypertable('another_hypertable_example', by_range('time')); SELECT * FROM add_dimension('another_hypertable_example', by_hash('device_id', 4)); ``` You get an error if you try to turn the relational table into a hypertable partitioned by `time` and `user_id`. This is because `user_id` is not part of the `UNIQUE INDEX`. To fix the error, add `user_id` to your unique index. ===== PAGE: https://docs.tigerdata.com/use-timescale/hypertables/hypertable-crud/ ===== # Optimize time-series data in hypertables Hypertables are designed for real-time analytics, they are Postgres tables that automatically partition your data by time. Typically, you partition hypertables on columns that hold time values. [Best practice is to use `timestamptz`][timestamps-best-practice] column type. However, you can also partition on `date`, `integer`, `timestamp` and [UUIDv7][uuidv7_functions] types. ## Prerequisites To follow the steps on this page: * Create a target [Tiger Cloud service][create-service] with the Real-time analytics capability. You need [your connection details][connection-info]. This procedure also works for [self-hosted TimescaleDB][enable-timescaledb]. ## Create a hypertable Create a [hypertable][hypertables-section] for your time-series data using [CREATE TABLE][hypertable-create-table]. For [efficient queries][secondary-indexes] on data in the columnstore, remember to `segmentby` the column you will use most often to filter your data:sql CREATE TABLE conditions ( time TIMESTAMPTZ NOT NULL, location TEXT NOT NULL, device TEXT NOT NULL, temperature DOUBLE PRECISION NULL, humidity DOUBLE PRECISION NULL ) WITH ( tsdb.hypertable, tsdb.partition_column='time', tsdb.segmentby = 'device', tsdb.orderby = 'time DESC' );
If you are self-hosting TimescaleDB v2.19.3 and below, create a [Postgres relational table][pg-create-table], then convert it using [create_hypertable][create_hypertable]. You then enable hypercore with a call to [ALTER TABLE][alter_table_hypercore]. To convert an existing table with data in it, call `create_hypertable` on that table with [`migrate_data` to `true`][api-create-hypertable-arguments]. However, if you have a lot of data, this may take a long time. ## Speed up data ingestion When you set `timescaledb.enable_direct_compress_copy` your data gets compressed in memory during ingestion with `COPY` statements. By writing the compressed batches immediately in the columnstore, the IO footprint is significantly lower. Also, the [columnstore policy][add_columnstore_policy] you set is less important, `INSERT` already produces compressed chunks. Please note that this feature is a **tech preview** and not production-ready. Using this feature could lead to regressed query performance and/or storage ratio, if the ingested batches are not correctly ordered or are of too high cardinality. To enable in-memory data compression during ingestion:sql SET timescaledb.enable_direct_compress_copy=on;
**Important facts** - High cardinality use cases do not produce good batches and lead to degreaded query performance. - The columnstore is optimized to store 1000 records per batch, which is the optimal format for ingestion per segment by. - WAL records are written for the compressed batches rather than the individual tuples. - Currently only `COPY` is support, `INSERT` will eventually follow. - Best results are achieved for batch ingestion with 1000 records or more, upper boundary is 10.000 records. - Continous Aggregates are **not** supported at the moment. ## Optimize cooling data in the columnstore As the data cools and becomes more suited for analytics, [add a columnstore policy][add_columnstore_policy] so your data is automatically converted to the columnstore after a specific time interval. This columnar format enables fast scanning and aggregation, optimizing performance for analytical workloads while also saving significant storage space. In the columnstore conversion, hypertable chunks are compressed by up to 98%, and organized for efficient, large-scale queries. This columnar format enables fast scanning and aggregation, optimizing performance for analytical workloads. To optimize your data, add a columnstore policy:sql CALL add_columnstore_policy('conditions', after => INTERVAL '1d');
You can also manually [convert chunks][convert_to_columnstore] in a hypertable to the columnstore. ## Alter a hypertable You can alter a hypertable, for example to add a column, by using the Postgres [`ALTER TABLE`][postgres-altertable] command. This works for both regular and distributed hypertables. ### Add a column to a hypertable You add a column to a hypertable using the `ALTER TABLE` command. In this example, the hypertable is named `conditions` and the new column is named `humidity`:sql ALTER TABLE conditions ADD COLUMN humidity DOUBLE PRECISION NULL;
If the column you are adding has the default value set to `NULL`, or has no default value, then adding a column is relatively fast. If you set the default to a non-null value, it takes longer, because it needs to fill in this value for all existing rows of all existing chunks. ### Rename a hypertable You can change the name of a hypertable using the `ALTER TABLE` command. In this example, the hypertable is called `conditions`, and is being changed to the new name, `weather`:sql ALTER TABLE conditions RENAME TO weather;
## Drop a hypertable Drop a hypertable using a standard Postgres [`DROP TABLE`][postgres-droptable] command:sql DROP TABLE weather;
All data chunks belonging to the hypertable are deleted. ===== PAGE: https://docs.tigerdata.com/use-timescale/hypertables/improve-query-performance/ ===== # Improve hypertable and query performance Hypertables are Postgres tables that help you improve insert and query performance by automatically partitioning your data by time. Each hypertable is made up of child tables called chunks. Each chunk is assigned a range of time, and only contains data from that range. When you run a query, TimescaleDB identifies the correct chunk and runs the query on it, instead of going through the entire table. This page shows you how to tune hypertables to increase performance even more. * [Optimize hypertable chunk intervals][chunk-intervals]: choose the optimum chunk size for your data * [Enable chunk skipping][chunk-skipping]: skip chunks on non-partitioning columns in hypertables when you query your data * [Analyze your hypertables][analyze-hypertables]: use Postgres `ANALYZE` to create the best query plan ## Optimize hypertable chunk intervals Adjusting your hypertable chunk interval can improve performance in your database. 1. **Choose an optimum chunk interval** Postgres builds the index on the fly during ingestion. That means that to build a new entry on the index, a significant portion of the index needs to be traversed during every row insertion. When the index does not fit into memory, it is constantly flushed to disk and read back. This wastes IO resources which would otherwise be used for writing the heap/WAL data to disk. The default chunk interval is 7 days. However, best practice is to set `chunk_interval` so that prior to processing, the indexes for chunks currently being ingested into fit within 25% of main memory. For example, on a system with 64 GB of memory, if index growth is approximately 2 GB per day, a 1-week chunk interval is appropriate. If index growth is around 10 GB per day, use a 1-day interval. You set `chunk_interval` when you [create a hypertable][hypertable-create-table], or by calling [`set_chunk_time_interval`][chunk_interval] on an existing hypertable. In the following example you create a table called `conditions` that stores time values in the `time` column and has chunks that store data for a `chunk_interval` of one day:sql CREATE TABLE conditions (
time TIMESTAMPTZ NOT NULL, location TEXT NOT NULL, device TEXT NOT NULL, temperature DOUBLE PRECISION NULL, humidity DOUBLE PRECISION NULL) WITH (
tsdb.hypertable, tsdb.partition_column='time', tsdb.chunk_interval='1 day');
If you are self-hosting TimescaleDB v2.19.3 and below, create a [Postgres relational table][pg-create-table], then convert it using [create_hypertable][create_hypertable]. You then enable hypercore with a call to [ALTER TABLE][alter_table_hypercore]. 1. **Check current setting for chunk intervals** Query the TimescaleDB catalog for a hypertable. For example:sql SELECT *
FROM timescaledb_information.dimensions WHERE hypertable_name = 'conditions';The result looks like:sql hypertable_schema | hypertable_name | dimension_number | column_name | column_type | dimension_type | time_interval | integer_interval | integer_now_func | num_partitions -------------------+-----------------+------------------+-------------+--------------------------+----------------+---------------+------------------+------------------+----------------
public | metrics | 1 | recorded | timestamp with time zone | Time | 1 day | | |Time-based interval lengths are reported in microseconds. 1. **Change the chunk interval length on an existing hypertable** To change the chunk interval on an already existing hypertable, call `set_chunk_time_interval`.sql SELECT set_chunk_time_interval('conditions', INTERVAL '24 hours');
The updated chunk interval only applies to new chunks. This means setting an overly long interval might take a long time to correct. For example, if you set `chunk_interval` to 1 year and start inserting data, you can no longer shorten the chunk for that year. If you need to correct this situation, create a new hypertable and migrate your data. While chunk turnover does not degrade performance, chunk creation does take longer lock time than a normal `INSERT` operation into a chunk that has already been created. This means that if multiple chunks are being created at the same time, the transactions block each other until the first transaction is completed. If you use expensive index types, such as some PostGIS geospatial indexes, take care to check the total size of the chunk and its index using [`chunks_detailed_size`][chunks_detailed_size]. ## Enable chunk skipping Early access: TimescaleDB v2.17.1 One of the key purposes of hypertables is to make your analytical queries run with the lowest latency possible. When you execute a query on a hypertable, you do not parse the whole table; you only access the chunks necessary to satisfy the query. This works well when the `WHERE` clause of a query uses the column by which a hypertable is partitioned. For example, in a hypertable where every day of the year is a separate chunk, a query for September 1 accesses only the chunk for that day. However, many queries use columns other than the partitioning one. For example, a satellite company might have a table with two columns: one for when data was gathered by a satellite and one for when it was added to the database. If you partition by the date of gathering, a query by the date of adding accesses all chunks in the hypertable and slows the performance. To improve query performance, TimescaleDB enables you to skip chunks on non-partitioning columns in hypertables. Chunk skipping only works on chunks converted to the columnstore **after** you `enable_chunk_skipping`. ### How chunk skipping works You enable chunk skipping on a column in a hypertable. TimescaleDB tracks the minimum and maximum values for that column in each chunk. These ranges are stored in the start (inclusive) and end (exclusive) format in the `chunk_column_stats` catalog table. TimescaleDB uses these ranges for dynamic chunk exclusion when the `WHERE` clause of an SQL query specifies ranges on the column. 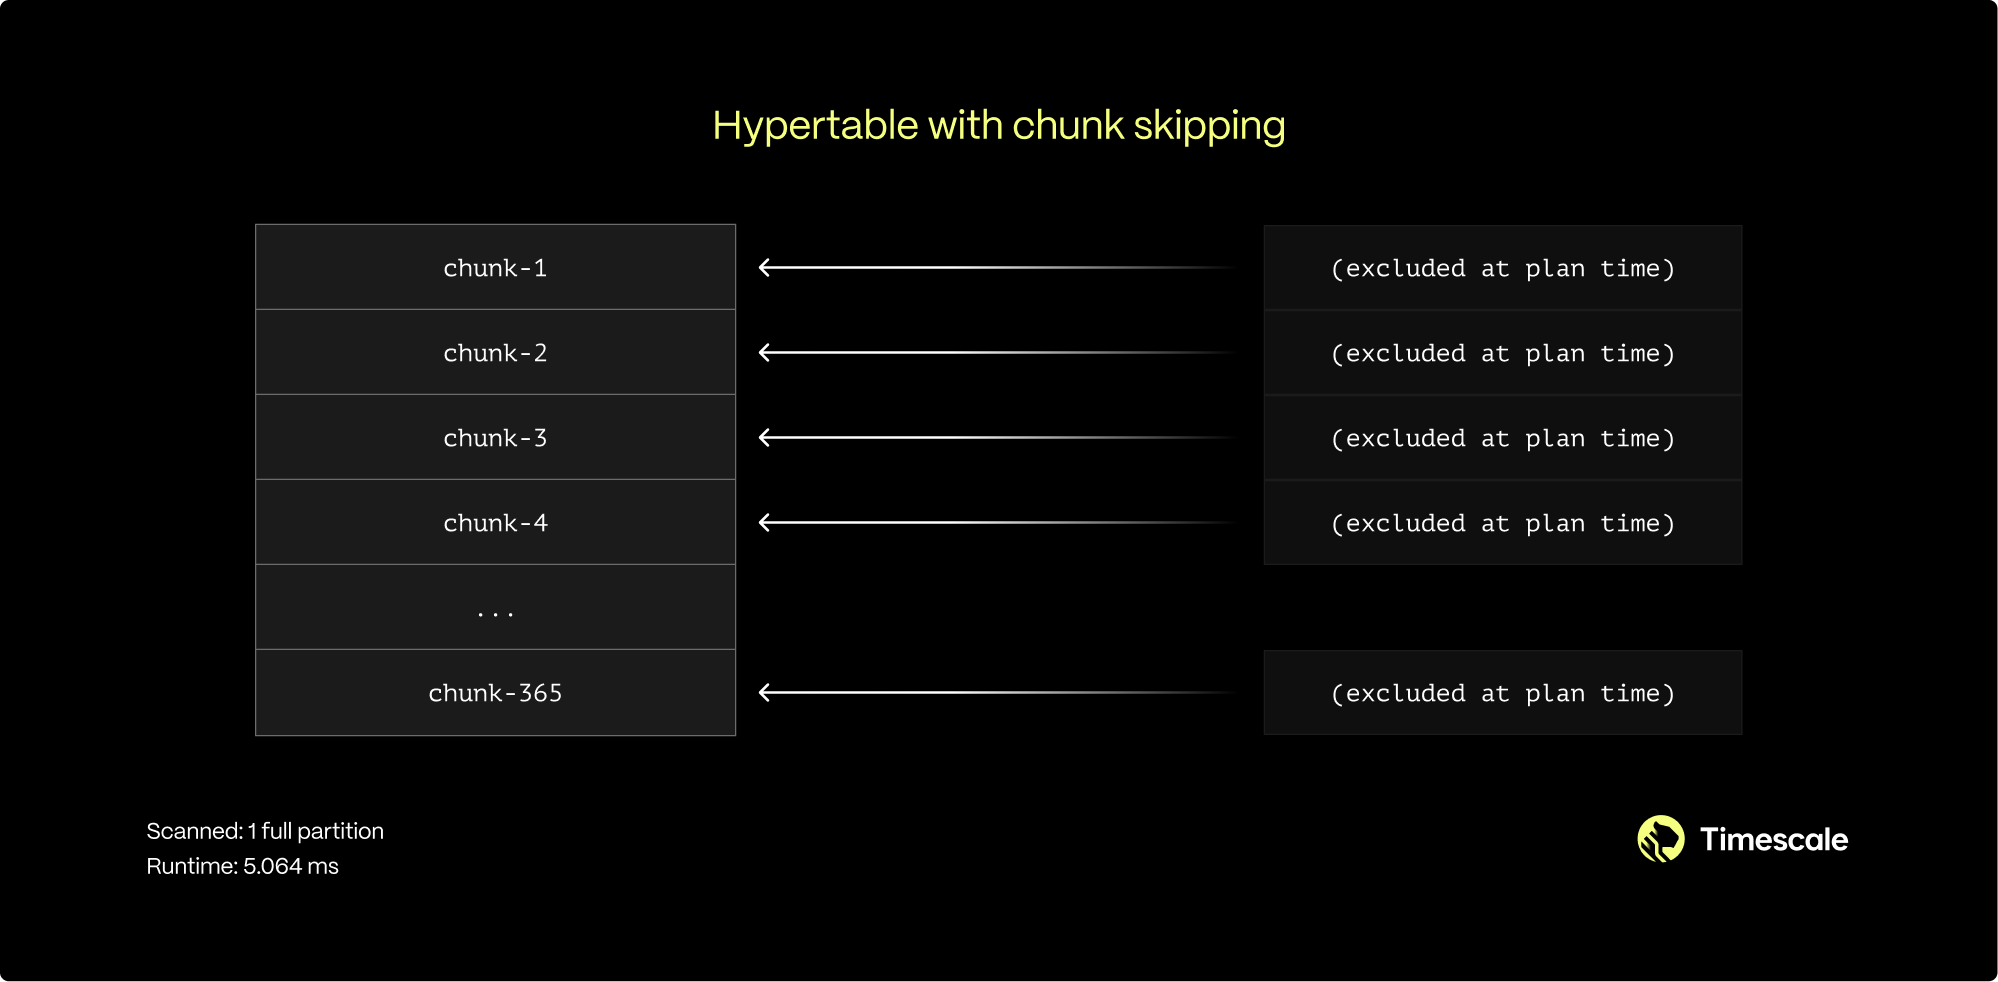 You can enable chunk skipping on hypertables compressed into the columnstore for `smallint`, `int`, `bigint`, `serial`, `bigserial`, `date`, `timestamp`, or `timestamptz` type columns. ### When to enable chunk skipping You can enable chunk skipping on as many columns as you need. However, best practice is to enable it on columns that are both: - Correlated, that is, related to the partitioning column in some way. - Referenced in the `WHERE` clauses of the queries. In the satellite example, the time of adding data to a database inevitably follows the time of gathering. Sequential IDs and the creation timestamp for both entities also increase synchronously. This means those two columns are correlated. For a more in-depth look on chunk skipping, see [our blog post](https://www.timescale.com/blog/boost-postgres-performance-by-7x-with-chunk-skipping-indexes). ### Enable chunk skipping To enable chunk skipping on a column, call `enable_chunk_skipping` on a `hypertable` for a `column_name`. For example, the following query enables chunk skipping on the `order_id` column in the `orders` table:sql SELECT enable_chunk_skipping('orders', 'order_id');
For more details on how to implement chunk skipping, see the [API Reference][api-reference]. ## Analyze your hypertables You can use the Postgres `ANALYZE` command to query all chunks in your hypertable. The statistics collected by the `ANALYZE` command are used by the Postgres planner to create the best query plan. For more information about the `ANALYZE` command, see the [Postgres documentation][pg-analyze]. ===== PAGE: https://docs.tigerdata.com/use-timescale/extensions/pgvector/ ===== # Create a chatbot using pgvector The `pgvector` Postgres extension helps you to store and search over machine learning-generated embeddings. It provides different capabilities that allows you to identify both exact and approximate nearest neighbors. It is designed to work seamlessly with other Postgres features, including indexing and querying. For more information about these functions and the options available, see the [pgvector][pgvector-repo] repository. ## Use the `pgvector` extension to create a `chatbot` The `pgvector` Postgres extension allows you to create, store, and query OpenAI [vector embeddings][vector-embeddings] in a Postgres database instance. This page shows you how to use [retrieval augmented generation (RAG)][rag-docs] to create a chatbot that combines your data with ChatGPT using OpenAI and `pgvector`. RAG provides a solution to the problem that a foundational model such as GPT-3 or GPT-4 could be missing some information needed to give a good answer, because that information was not in the dataset used to train the model. This can happen if the information is stored in private documents or only became available recently. In this example, you create embeddings, insert the embeddings into a Tiger Cloud service and query the embeddings using `pgvector`. The content for the embeddings is from the Tiger Data blog, specifically from the [Developer Q&A][developer-qa] section, which features posts by Tiger Data users talking about their real-world use cases. ### Prerequisites Before you begin, make sure you have: * Installed Python. * Created a [Tiger Cloud service][cloud-login]. * Downloaded the cheatsheet when you created the service. This sheet contains the connection details for the database you want to use as a vector database. * Cloned the [pgvector repository][timescale-pgvector]. * Signed up for an [OpenAI developer account][openai-signup]. * Created an API key and made a note of your OpenAI [API key][api-key]. If you are on a free plan there may be rate limiting for your API requests. ### Using the `pgvector` extension to create a chatbot <!-- Vale has a lot of trouble detecting the code blocks --> <!-- vale off --> 1. Create and activate a Python virtual environment: ```bash virtualenv pgvectorenv source pgvectorenv/bin/activate ``` 1. Set the environment variables for `OPENAI_API_KEY` and `TIMESCALE_CONNECTION_STRING`. In this example, to set the environment variables in macOS, open the `zshrc` profile. Replace `<OPENAI_API>`, and `<SERVICE_URL>` with your OpenAI API key and the URL of your Tiger Cloud service: ```bash nano ~/.zshrc export OPENAI_API_KEY='<OPENAI_API>' export TIMESCALE_CONNECTION_STRING='<SERVICE_URL>' Update the shell with the new variables using `source ~/.zshrc` 1. Confirm that you have set the environment variables using: ```bash echo $OPENAI_API_KEY echo $TIMESCALE_CONNECTION_STRING ``` 1. Install the required modules and packages using the `requirements.txt`. This file is located in the `vector-cookbook\openai_pgvector_helloworld` directory: ```bash pip install -r requirements.txt ``` 1. To create embeddings for your data using the OpenAI API, open an editor of your choice and create the `create_embeddings.py` file. ```python ############################################################################### ############################################################################### import openai import os import pandas as pd import numpy as np import json import tiktoken from dotenv import load_dotenv, find_dotenv _ = load_dotenv(find_dotenv()) openai.api_key = os.environ['OPENAI_API_KEY'] df = pd.read_csv('blog_posts_data.csv') df.head() ############################################################################### ############################################################################### def num_tokens_from_string(string: str, encoding_name = "cl100k_base") -> int: if not string: return 0 encoding = tiktoken.get_encoding(encoding_name) num_tokens = len(encoding.encode(string)) return num_tokens def get_embedding_cost(num_tokens): return num_tokens/1000*0.0001 def get_total_embeddings_cost(): total_tokens = 0 for i in range(len(df.index)): text = df['content'][i] token_len = num_tokens_from_string(text) total_tokens = total_tokens + token_len total_cost = get_embedding_cost(total_tokens) return total_cost ############################################################################### total_cost = get_total_embeddings_cost() print("Estimated price to embed this content = $" + str(total_cost)) ############################################################################### ############################################################################### new_list = [] for i in range(len(df.index)): text = df['content'][i] token_len = num_tokens_from_string(text) if token_len <= 512: new_list.append([df['title'][i], df['content'][i], df['url'][i], token_len]) else: start = 0 ideal_token_size = 512 ideal_size = int(ideal_token_size // (4/3)) end = ideal_size #split text by spaces into words words = text.split() #remove empty spaces words = [x for x in words if x != ' '] total_words = len(words) #calculate iterations chunks = total_words // ideal_size if total_words % ideal_size != 0: chunks += 1 new_content = [] for j in range(chunks): if end > total_words: end = total_words new_content = words[start:end] new_content_string = ' '.join(new_content) new_content_token_len = num_tokens_from_string(new_content_string) if new_content_token_len > 0: new_list.append([df['title'][i], new_content_string, df['url'][i], new_content_token_len]) start += ideal_size end += ideal_size def get_embeddings(text): response = openai.Embedding.create( model="text-embedding-ada-002", input = text.replace("\n"," ") ) embedding = response['data'][0]['embedding'] return embedding for i in range(len(new_list)): text = new_list[i][1] embedding = get_embeddings(text) new_list[i].append(embedding) df_new = pd.DataFrame(new_list, columns=['title', 'content', 'url', 'tokens', 'embeddings']) df_new.head() df_new.to_csv('blog_data_and_embeddings.csv', index=False) print("Done! Check the file blog_data_and_embeddings.csv for your results.") ``` 1. Run the script using the `python create_embeddings.py` command. You should see an output that looks a bit like this: ```bash Estimated price to embed this content = $0.0060178 Done! Check the file blog_data_and_embeddings.csv for your results. ``` 1. To insert these embeddings into your Tiger Cloud service using the `pgvector` extension, open an editor of your choice and create the `insert_embeddings.py` file. ```python ############################################################################### ############################################################################### import openai import os import pandas as pd import numpy as np import psycopg2 import ast import pgvector import math from psycopg2.extras import execute_values from pgvector.psycopg2 import register_vector ############################################################################### ############################################################################### connection_string = os.environ['TIMESCALE_CONNECTION_STRING'] conn = psycopg2.connect(connection_string) cur = conn.cursor() #install pgvector in your database cur.execute("CREATE EXTENSION IF NOT EXISTS vector;"); conn.commit() register_vector(conn) table_create_command = """ CREATE TABLE embeddings ( id bigserial primary key, title text, url text, content text, tokens integer, embedding vector(1536) ); """ cur.execute(table_create_command) cur.close() conn.commit() ############################################################################### df = pd.read_csv('blog_data_and_embeddings.csv') titles = df['title'] urls = df['url'] contents = df['content'] tokens = df['tokens'] embeds = [list(map(float, ast.literal_eval(embed_str))) for embed_str in df['embeddings']] df_new = pd.DataFrame({ 'title': titles, 'url': urls, 'content': contents, 'tokens': tokens, 'embeddings': embeds }) print(df_new.head()) ############################################################################### ############################################################################### register_vector(conn) cur = conn.cursor() data_list = [(row['title'], row['url'], row['content'], int(row['tokens']), np.array(row['embeddings'])) for index, row in df_new.iterrows()] execute_values(cur, "INSERT INTO embeddings (title, url, content, tokens, embedding) VALUES %s", data_list) conn.commit() cur.execute("SELECT COUNT(*) as cnt FROM embeddings;") num_records = cur.fetchone()[0] print("Number of vector records in table: ", num_records,"\n") cur.execute("SELECT * FROM embeddings LIMIT 1;") records = cur.fetchall() print("First record in table: ", records) #calculate the index parameters according to best practices num_lists = num_records / 1000 if num_lists < 10: num_lists = 10 if num_records > 1000000: num_lists = math.sqrt(num_records) #use the cosine distance measure, which is what we'll later use for querying cur.execute(f'CREATE INDEX ON embeddings USING ivfflat (embedding vector_cosine_ops) WITH (lists = {num_lists});') conn.commit() print("Index created on embeddings table") ``` 1. Run the script using the `python insert_embeddings.py` command. You should see an output that looks a bit like this: ```bash 0 How to Build a Weather Station With Elixir, Ne... ... [0.021399984136223793, 0.021850213408470154, -... 1 How to Build a Weather Station With Elixir, Ne... ... [0.01620873250067234, 0.011362895369529724, 0.... 2 How to Build a Weather Station With Elixir, Ne... ... [0.022517921403050423, -0.0019158280920237303,... 3 CloudQuery on Using Postgres for Cloud Asset... ... [0.008915113285183907, -0.004873732570558786, ... 4 CloudQuery on Using PostgreSQL for Cloud Asset... ... [0.0204352755099535, 0.010087345726788044, 0.0... [5 rows x 5 columns] Number of vector records in table: 129 First record in table: [(1, 'How to Build a Weather Station With Elixir, Nerves, and TimescaleDB', 'https://www.timescale.com/blog/how-to-build-a-weather-station-with-elixir-nerves-and-timescaledb/', 'This is an installment of our “Community Member Spotlight” series, where we invite our customers to share their work, shining a light on their success and inspiring others with new ways to use technology to solve problems.In this edition,Alexander Koutmos, author of the Build a Weather Station with Elixir and Nerves book, joins us to share how he uses Grafana and TimescaleDB to store and visualize weather data collected from IoT sensors.About the teamThe bookBuild a Weather Station with Elixir and Nerveswas a joint effort between Bruce Tate, Frank Hunleth, and me.I have been writing software professionally for almost a decade and have been working primarily with Elixir since 2016. I currently maintain a few Elixir libraries onHexand also runStagira, a software consultancy company.Bruce Tateis a kayaker, programmer, and father of two from Chattanooga, Tennessee. He is the author of more than ten books and has been around Elixir from the beginning. He is the founder ofGroxio, a company that trains Elixir developers.Frank Hunlethis an embedded systems programmer, OSS maintainer, and Nerves core team member. When not in front of a computer, he loves running and spending time with his family.About the projectIn the Pragmatic Bookshelf book,Build a Weather Station with Elixir and Nerves, we take a project-based approach and guide the reader to create a Nerves-powered IoT weather station.For those unfamiliar with the Elixir ecosystem,Nervesis an IoT framework that allows you to build and deploy IoT applications on a wide array of embedded devices. At a high level, Nerves allows you to focus on building your project and takes care of a lot of the boilerplate associated with running Elixir on embedded devices.The goal of the book is to guide the reader through the process of building an end-to-end IoT solution for capturing, persisting, and visualizing weather data.Assembled weather station hooked up to development machine.One of the motivating factors for this book was to create a real-world project where readers could get hands-on experience with hardware without worrying too much about the nitty-gritty of soldering components together. Experimenting with hardware can often feel intimidating and confusing, but with Elixir and Nerves, we feel confident that even beginners get comfortable and productive quickly. As a result, in the book, we leverage a Raspberry Pi Zero W along with a few I2C enabled sensors to', 501, array([ 0.02139998, 0.02185021, -0.00537814, ..., -0.01257126, -0.02165324, -0.03714396], dtype=float32))] Index created on embeddings table ``` 1. To query the embeddings that you inserted in to your Tiger Cloud service, open an editor of your choice and create the `query_embeddings.py` file. Here, the query is `How does Density use TimescaleDB?`. ```python ############################################################################### ############################################################################### import openai import os import pandas as pd import numpy as np import json import tiktoken import psycopg2 import ast import pgvector import math from psycopg2.extras import execute_values from pgvector.psycopg2 import register_vector from dotenv import load_dotenv, find_dotenv _ = load_dotenv(find_dotenv()) openai.api_key = os.environ['OPENAI_API_KEY'] connection_string = os.environ['TIMESCALE_CONNECTION_STRING'] conn = psycopg2.connect(connection_string) ############################################################################### ############################################################################### def get_top3_similar_docs(query_embedding, conn): embedding_array = np.array(query_embedding) register_vector(conn) cur = conn.cursor() cur.execute("SELECT content FROM embeddings ORDER BY embedding <=> %s LIMIT 3", (embedding_array,)) top3_docs = cur.fetchall() return top3_docs def get_completion_from_messages(messages, model="gpt-3.5-turbo-0613", temperature=0, max_tokens=1000): response = openai.ChatCompletion.create( model=model, messages=messages, temperature=temperature, max_tokens=max_tokens, ) return response.choices[0].message["content"] def get_embeddings(text): response = openai.Embedding.create( model="text-embedding-ada-002", input = text.replace("\n"," ") ) embedding = response['data'][0]['embedding'] return embedding ############################################################################### ############################################################################### ############################################################################### def process_input_with_retrieval(user_input): delimiter = "```" #Step 1: Get documents related to the user input from database related_docs = get_top3_similar_docs(get_embeddings(user_input), conn) system_message = f""" You are a friendly chatbot. \ You can answer questions about timescaledb, its features and its use cases. \ You respond in a concise, technically credible tone. \ """ messages = [ {"role": "system", "content": system_message}, {"role": "user", "content": f"{delimiter}{user_input}{delimiter}"}, {"role": "assistant", "content": f"Relevant Tiger Data case studies information: \n {related_docs[0] [0]} \n {related_docs[1][0]} {related_docs[2][0]}"} ] final_response = get_completion_from_messages(messages) return final_response ############################################################################### input = "How does Density use TimescaleDB?" response = process_input_with_retrieval(input) print(input) print(response) ``` 1. Run the script using the `python query_embeddings.py` command. You should see an output that looks a bit like this: ```bash How does Density use TimescaleDB? Density uses TimescaleDB as the main database in their smart city system. They store counts of people in spaces over time and derive metrics such as dwell time and space usage. TimescaleDB's flexibility and ability to handle time-series data efficiently allows Density to slice, dice, and compose queries in various ways. They also leverage TimescaleDB's continuous aggregates feature to roll up high-resolution data to lower resolutions, improving query performance. Additionally, TimescaleDB's support for percentile calculations has helped Density deliver accurate percentile values for their data. Overall, TimescaleDB has significantly improved the performance and scalability of Density's analytics workload. ``` <!-- markdown-link-check-disable --> <!-- markdown-link-check-enable--> ===== PAGE: https://docs.tigerdata.com/use-timescale/extensions/pgcrypto/ ===== # Encrypt data using pgcrypto The `pgcrypto` Postgres extension provides cryptographic functions such as: * General hashing * Password hashing * PGP encryption * Raw encryption * Random-data For more information about these functions and the options available, see the [pgcrypto documentation][pgcrypto-docs]. ## Use the `pgcrypto` extension to encrypt inserted data The `pgcrypto` extension allows you to encrypt, decrypt, hash, and create digital signatures within your database. Tiger Data understands how precious your data is and safeguards sensitive information. ### Using the `pgcrypto` extension to encrypt inserted data 1. Install the `pgcrypto` extension: ```sql CREATE EXTENSION IF NOT EXISTS pgcrypto; ``` 1. You can confirm if the extension is installed using the `\dx` command. The installed extensions are listed: ```sql List of installed extensions Name | Version | Schema | Description ---------------------+---------+------------+--------------------------------------------------------------------------------------- pg_stat_statements | 1.10 | public | track planning and execution statistics of all SQL statements executed pgcrypto | 1.3 | public | cryptographic functions plpgsql | 1.0 | pg_catalog | PL/pgSQL procedural language timescaledb | 2.11.0 | public | Enables scalable inserts and complex queries for time-series data (Community Edition) timescaledb_toolkit | 1.16.0 | public | Library of analytical hyperfunctions, time-series pipelining, and other SQL utilities ``` 1. Create a table named `user_passwords`: ```sql CREATE TABLE user_passwords (username varchar(100) PRIMARY KEY, crypttext text); ``` 1. Insert the values in the `user_passwords` table and replace `<Password_Key>` with a password key of your choice: ```sql INSERT INTO tbl_sym_crypt (username, crypttext) VALUES ('user1', pgp_sym_encrypt('user1_password','<Password_Key>')), ('user2', pgp_sym_encrypt('user2_password','<Password_Key>')); ``` 1. You can confirm that the password is encrypted using the command: ```sql SELECT * FROM user_passwords; ``` The encrypted passwords are listed: ```sql username | crypttext ----------+---------------------------------------------------------------------------------------------------------------------------------------------------------------------- user1 | \xc30d040703025caa37f9d1c731d169d240018529d6f0002b2948905a87e4787efaa0046e58fd3f04ee95594bea1803807063321f62c9651cbf0422b04508093df9644a76684b504b317cf633552fcf164f user2 | \xc30d0407030279bbcf760b81d3de73d23c01c04142632fc8527c0c1b17cc954c77f16df46022acddc565fd18f0f0f761ddb2f31b21c4ebe47a48039d685287d64506029e027cf29b5493b574df (2 rows) ``` 1. To view the decrypted passwords, replace `<Password_Key>` with the password key that you created: ```sql SELECT username, pgp_sym_decrypt(crypttext::bytea, '<Password_Key>') FROM user_passwords; ``` The decrypted passwords are listed: ```sql username | pgp_sym_decrypt ----------+----------------- user1 | user1_password user2 | user2_password (2 rows) ``` ===== PAGE: https://docs.tigerdata.com/use-timescale/extensions/postgis/ ===== # Analyse geospatial data with postgis The `postgis` Postgres extension provides storing, indexing, and querying geographic data. It helps in spatial data analysis, the study of patterns, anomalies, and theories within spatial or geographical data. For more information about these functions and the options available, see the [PostGIS documentation] [postgis-docs]. ## Use the `postgis` extension to analyze geospatial data The `postgis` Postgres extension allows you to conduct complex analyses of your geospatial time-series data. Tiger Data understands that you have a multitude of data challenges and helps you discover when things happened, and where they occurred. In this example you can query when the `covid` cases were reported, where they were reported, and how many were reported around a particular location. ### Using the `postgis` extension to analyze geospatial data 1. Install the `postgis` extension: ```sql CREATE EXTENSION postgis; ``` 1. You can confirm if the extension is installed using the `\dx` command. The extensions that are installed are listed: ```sql List of installed extensions Name | Version | Schema | Description ---------------------+---------+------------+--------------------------------------------------------------------------------------- pg_stat_statements | 1.10 | public | track planning and execution statistics of all SQL statements executed pgcrypto | 1.3 | public | cryptographic functions plpgsql | 1.0 | pg_catalog | PL/pgSQL procedural language postgis | 3.3.3 | public | PostGIS geometry and geography spatial types and functions timescaledb | 2.11.0 | public | Enables scalable inserts and complex queries for time-series data (Community Edition) timescaledb_toolkit | 1.16.0 | public | Library of analytical hyperfunctions, time-series pipelining, and other SQL utilities (6 rows) ``` 1. Create a hypertable named `covid_location`, where, `location` is a `GEOGRAPHY` type column that stores GPS coordinates using the 4326/WGS84 coordinate system, and `time` records the time the GPS coordinate was logged for a specific `state_id`. This hypertable is partitioned on the `time` column: ```sql CREATE TABLE covid_location ( time TIMESTAMPTZ NOT NULL, state_id INT NOT NULL, location GEOGRAPHY(POINT, 4326), cases INT NOT NULL, deaths INT NOT NULL ) WITH ( tsdb.hypertable, tsdb.partition_column='time' ); ``` If you are self-hosting TimescaleDB v2.19.3 and below, create a [Postgres relational table][pg-create-table], then convert it using [create_hypertable][create_hypertable]. You then enable hypercore with a call to [ALTER TABLE][alter_table_hypercore]. 1. To support efficient queries, create an index on the `state_id` column: ```sql CREATE INDEX ON covid_location (state_id, time DESC); ``` 1. Insert some randomly generated values in the `covid_location` table. The longitude and latitude coordinates of New Jersey are (-73.935242 40.730610), and New York are (-74.871826 39.833851): ```sql INSERT INTO covid_location VALUES ('2023-06-28 20:00:00',34,'POINT(-74.871826 39.833851)',5,2), ('2023-06-28 20:00:00',36,'POINT(-73.935242 40.730610)',7,1), ('2023-06-29 20:00:00',34,'POINT(-74.871826 39.833851)',14,0), ('2023-06-29 20:00:00',36,'POINT(-73.935242 40.730610)',12,1), ('2023-06-30 20:00:00',34,'POINT(-74.871826 39.833851)',10,4); ``` 1. To fetch all cases of a specific state during a specific period, use: ```sql SELECT * FROM covid_location WHERE state_id = 34 AND time BETWEEN '2023-06-28 00:00:00' AND '2023-06-30 23:59:59'; ``` The data you get back looks a bit like this: ```sql time | state_id | location | cases | deaths ------------------------+----------+----------------------------------------------------+-------+-------- 2023-06-28 20:00:00+00 | 34 | 0101000020E61000005C7347FFCBB752C0535E2BA1BBEA4340 | 5 | 2 2023-06-29 20:00:00+00 | 34 | 0101000020E61000005C7347FFCBB752C0535E2BA1BBEA4340 | 14 | 0 2023-06-30 20:00:00+00 | 34 | 0101000020E61000005C7347FFCBB752C0535E2BA1BBEA4340 | 10 | 4 (3 rows) ``` 1. To fetch the latest logged cases of all states using the [Tiger Data SkipScan][skip-scan] feature, replace `<Interval_Time>` with the number of days between the day you are running the query and the day the last report was logged in the table, in this case 30, June, 2023: ```sql SELECT DISTINCT ON (state_id) state_id, ST_AsText(location) AS location FROM covid_location WHERE time > now() - INTERVAL '<Interval_Time>' ORDER BY state_id, time DESC; ``` The `ST_AsText(location)` function converts the binary geospatial data into human-readable format. The data you get back looks a bit like this: ```sql state_id | location ----------+----------------------------- 34 | POINT(-74.871826 39.833851) (1 row) ``` 1. To fetch all cases and states that were within 10000 meters of Manhattan at any time: ```sql SELECT DISTINCT cases, state_id FROM covid_location WHERE ST_DWithin( location, ST_GeogFromText('POINT(-73.9851 40.7589)'), 10000 ); ``` The data you get back looks a bit like this: ```sql cases | state_id -------+---------- 7 | 36 12 | 36 (2 rows) ``` ===== PAGE: https://docs.tigerdata.com/use-timescale/extensions/pg-textsearch/ ===== # Optimize full text search with BM25 Postgres full-text search at scale consistently hits a wall where performance degrades catastrophically. Tiger Data's [pg_textsearch][pg_textsearch-repo] brings modern [BM25][bm25-wiki]-based full-text search directly into Postgres, with a memtable architecture for efficient indexing and ranking. `pg_textsearch` integrates seamlessly with SQL and provides better search quality and performance than the Postgres built-in full-text search. BM25 scores in `pg_textsearch` are returned as negative values, where lower (more negative) numbers indicate better matches. `pg_textsearch` implements the following: * **Corpus-aware ranking**: BM25 uses inverse document frequency to weight rare terms higher * **Term frequency saturation**: prevents documents with excessive term repetition from dominating results * **Length normalization**: adjusts scores based on document length relative to corpus average * **Relative ranking**: focuses on rank order rather than absolute score values This page shows you how to install `pg_textsearch`, configure BM25 indexes, and optimize your search capabilities using the following best practice: * **Memory planning**: size your `index_memory_limit` based on corpus vocabulary and document count * **Language configuration**: choose appropriate text search configurations for your data language * **Hybrid search**: combine with pgvector or pgvectorscale for applications requiring both semantic and keyword search * **Query optimization**: use score thresholds to filter low-relevance results * **Index monitoring**: regularly check index usage and memory consumption Early access: October 2025 this preview release is designed for development and staging environments. It is not recommended for use with hypertables. ## Prerequisites To follow the steps on this page: * Create a target [Tiger Cloud service][create-service] with the Real-time analytics capability. You need [your connection details][connection-info]. This procedure also works for [self-hosted TimescaleDB][enable-timescaledb]. ## Install pg_textsearch To install this Postgres extension: 1. **Connect to your Tiger Cloud service** In [Tiger Cloud Console][services-portal] open an [SQL editor][in-console-editors]. You can also connect to your service using [psql][connect-using-psql]. 1. **Enable the extension on your Tiger Cloud service** - For new services, simply enable the extension: ```sql CREATE EXTENSION pg_textsearch; ``` - For existing services, update your instance, then enable the extension: The extension may not be available until after your next scheduled maintenance window. To pick up the update immediately, manually pause and restart your service. 1. **Verify the installation**sql SELECT * FROM pg_extension WHERE extname = 'pg_textsearch';
You have installed `pg_textsearch` on Tiger Cloud. ## Create BM25 indexes on your data BM25 indexes provide modern relevance ranking that outperforms Postgres's built-in ts_rank functions by using corpus statistics and better algorithmic design. To create a BM25 index with pg_textsearch: 1. **Create a table with text content**sql CREATE TABLE products (
id serial PRIMARY KEY, name text, description text, category text, price numeric);
1. **Insert sample data**sql INSERT INTO products (name, description, category, price) VALUES ('Mechanical Keyboard', 'Durable mechanical switches with RGB backlighting for gaming and productivity', 'Electronics', 149.99), ('Ergonomic Mouse', 'Wireless mouse with ergonomic design to reduce wrist strain during long work sessions', 'Electronics', 79.99), ('Standing Desk', 'Adjustable height desk for better posture and productivity throughout the workday', 'Furniture', 599.99);
1. **Create a BM25 index**sql CREATE INDEX products_search_idx ON products USING bm25(description) WITH (text_config='english');
BM25 supports single-column indexes only. You have created a BM25 index for full-text search. ## Optimize search queries for performance Use efficient query patterns to leverage BM25 ranking and optimize search performance. 1. **Perform ranked searches using the distance operator**sql SELECT name, description,
description <@> to_bm25query('ergonomic work', 'products_search_idx') as scoreFROM products ORDER BY description <@> to_bm25query('ergonomic work', 'products_search_idx') LIMIT 3;
1. **Filter results by score threshold**sql SELECT name,
description <@> to_bm25query('wireless', 'products_search_idx') as scoreFROM products WHERE description <@> to_bm25query('wireless', 'products_search_idx') < -2.0;
1. **Combine with standard SQL operations**sql SELECT category, name,
description <@> to_bm25query('ergonomic', 'products_search_idx') as scoreFROM products WHERE price < 500
AND description <@> to_bm25query('ergonomic', 'products_search_idx') < -1.0ORDER BY description <@> to_bm25query('ergonomic', 'products_search_idx') LIMIT 5;
1. **Verify index usage with EXPLAIN**sql EXPLAIN SELECT * FROM products ORDER BY description <@> to_bm25query('wireless keyboard', 'products_search_idx') LIMIT 5;
You have optimized your search queries for BM25 ranking. ## Build hybrid search with semantic and keyword search Combine `pg_textsearch` with `pgvector` or `pgvectorscale` to build powerful hybrid search systems that use both semantic vector search and keyword BM25 search. 1. **Enable the [vectorscale][pg-vectorscale] extension on your Tiger Cloud service**sql
CREATE EXTENSION IF NOT EXISTS vectorscale CASCADE; ```Create a table with both text content and vector embeddings
CREATE TABLE articles ( id serial PRIMARY KEY, title text, content text, embedding vector(1536) -- OpenAI ada-002 embedding dimension );Create indexes for both search types
-- Vector index for semantic search CREATE INDEX articles_embedding_idx ON articles USING hnsw (embedding vector_cosine_ops); -- Keyword index for BM25 search CREATE INDEX articles_content_idx ON articles USING bm25(content) WITH (text_config='english');Perform hybrid search using reciprocal rank fusion
WITH vector_search AS ( SELECT id, ROW_NUMBER() OVER (ORDER BY embedding <=> '[0.1, 0.2, 0.3]'::vector) AS rank FROM articles ORDER BY embedding <=> '[0.1, 0.2, 0.3]'::vector LIMIT 20 ), keyword_search AS ( SELECT id, ROW_NUMBER() OVER (ORDER BY content <@> to_bm25query('query performance', 'articles_content_idx')) AS rank FROM articles ORDER BY content <@> to_bm25query('query performance', 'articles_content_idx') LIMIT 20 ) SELECT a.id, a.title, COALESCE(1.0 / (60 + v.rank), 0.0) + COALESCE(1.0 / (60 + k.rank), 0.0) AS combined_score FROM articles a LEFT JOIN vector_search v ON a.id = v.id LEFT JOIN keyword_search k ON a.id = k.id WHERE v.id IS NOT NULL OR k.id IS NOT NULL ORDER BY combined_score DESC LIMIT 10;Adjust relative weights for different search types
WITH vector_search AS ( SELECT id, ROW_NUMBER() OVER (ORDER BY embedding <=> '[0.1, 0.2, 0.3]'::vector) AS rank FROM articles ORDER BY embedding <=> '[0.1, 0.2, 0.3]'::vector LIMIT 20 ), keyword_search AS ( SELECT id, ROW_NUMBER() OVER (ORDER BY content <@> to_bm25query('query performance', 'articles_content_idx')) AS rank FROM articles ORDER BY content <@> to_bm25query('query performance', 'articles_content_idx') LIMIT 20 ) SELECT a.id, a.title, 0.7 * COALESCE(1.0 / (60 + v.rank), 0.0) + -- 70% weight to vectors 0.3 * COALESCE(1.0 / (60 + k.rank), 0.0) -- 30% weight to keywords AS combined_score FROM articles a LEFT JOIN vector_search v ON a.id = v.id LEFT JOIN keyword_search k ON a.id = k.id WHERE v.id IS NOT NULL OR k.id IS NOT NULL ORDER BY combined_score DESC LIMIT 10;
You have implemented hybrid search combining semantic and keyword search.
Configuration options
Customize
pg_textsearchbehavior for your specific use case and data characteristics.- Configure the memory limit
The size of the memtable depends primarily on the number of distinct terms in your corpus. A corpus with longer documents or more varied vocabulary requires more memory per document.
-- Set memory limit per index (default 64MB) SET pg_textsearch.index_memory_limit = '128MB';Configure language-specific text processing
-- French language configuration CREATE INDEX products_fr_idx ON products_fr USING pg_textsearch(description) WITH (text_config='french'); -- Simple tokenization without stemming CREATE INDEX products_simple_idx ON products USING pg_textsearch(description) WITH (text_config='simple');Tune BM25 parameters
-- Adjust term frequency saturation (k1) and length normalization (b) CREATE INDEX products_custom_idx ON products USING bm25(description) WITH (text_config='english', k1=1.5, b=0.8);Monitor index usage and memory consumption
Check index usage statistics
SELECT schemaname, relname, indexrelname, idx_scan, idx_tup_read FROM pg_stat_user_indexes WHERE indexrelid::regclass::text ~ 'bm25';View detailed index information
SELECT bm25_debug_dump_index('products_search_idx');
You have configured
pg_textsearchfor optimal performance. For production applications, consider implementing result caching and pagination to improve user experience with large result sets.Current limitations
This preview release focuses on core BM25 functionality. It has the following limitations:
- Memory-only storage: indexes are limited by
pg_textsearch.index_memory_limit(default 64MB) - No phrase queries: cannot search for exact multi-word phrases yet
These limitations will be addressed in upcoming releases with disk-based segments and expanded query capabilities.
===== PAGE: https://docs.tigerdata.com/use-timescale/metrics-logging/datadog/ =====
Export metrics to Datadog
You can export telemetry data from your Tiger Cloud services with the time-series and analytics capability enabled to Datadog. The available metrics include CPU usage, RAM usage, and storage. This integration is available for Scale or Enterprise pricing plans.
This page shows you how to create a Datadog exporter in Tiger Cloud Console, and manage the lifecycle of data exporters.
Prerequisites
To follow the steps on this page:
- Create a target Tiger Cloud service with real-time analytics enabled.
Create a data exporter
Tiger Cloud data exporters send telemetry data from a Tiger Cloud service to third-party monitoring tools. You create an exporter on the project level, in the same AWS region as your service:
- In Tiger Cloud Console, open Exporters
- Click
New exporter Select
MetricsforData typeandDatadogfor providerChoose your AWS region and provide the API key
The AWS region must be the same for your Tiger Cloud exporter and the Datadog provider.
Set
Siteto your Datadog region, then clickCreate exporter
Manage a data exporter
This section shows you how to attach, monitor, edit, and delete a data exporter.
Attach a data exporter to a Tiger Cloud service
To send telemetry data to an external monitoring tool, you attach a data exporter to your Tiger Cloud service. You can attach only one exporter to a service.
To attach an exporter:
- In Tiger Cloud Console, choose the service
- Click
Operations>Exporters - Select the exporter, then click
Attach exporter - If you are attaching a first
Logsdata type exporter, restart the service
Monitor Tiger Cloud service metrics
You can now monitor your service metrics. Use the following metrics to check the service is running correctly:
timescale.cloud.system.cpu.usage.millicorestimescale.cloud.system.cpu.total.millicorestimescale.cloud.system.memory.usage.bytestimescale.cloud.system.memory.total.bytestimescale.cloud.system.disk.usage.bytestimescale.cloud.system.disk.total.bytes
Additionally, use the following tags to filter your results.
|Tag|Example variable| Description | |-|-|----------------------------| |
host|us-east-1.timescale.cloud| | |project-id|| | |service-id|| | |region|us-east-1| AWS region | |role|replicaorprimary| For service with replicas | |node-id|| For multi-node services |Edit a data exporter
To update a data exporter:
- In Tiger Cloud Console, open Exporters
- Next to the exporter you want to edit, click the menu >
Edit - Edit the exporter fields and save your changes
You cannot change fields such as the provider or the AWS region.
Delete a data exporter
To remove a data exporter that you no longer need:
Disconnect the data exporter from your Tiger Cloud services
- In Tiger Cloud Console, choose the service.
- Click
Operations>Exporters. - Click the trash can icon.
- Repeat for every service attached to the exporter you want to remove.
The data exporter is now unattached from all services. However, it still exists in your project.
Delete the exporter on the project level
- In Tiger Cloud Console, open Exporters
- Next to the exporter you want to edit, click menu >
Delete - Confirm that you want to delete the data exporter.
Reference
When you create the IAM OIDC provider, the URL must match the region you create the exporter in. It must be one of the following:
Region Zone Location URL ap-southeast-1Asia Pacific Singapore irsa-oidc-discovery-prod-ap-southeast-1.s3.ap-southeast-1.amazonaws.comap-southeast-2Asia Pacific Sydney irsa-oidc-discovery-prod-ap-southeast-2.s3.ap-southeast-2.amazonaws.comap-northeast-1Asia Pacific Tokyo irsa-oidc-discovery-prod-ap-northeast-1.s3.ap-northeast-1.amazonaws.comca-central-1Canada Central irsa-oidc-discovery-prod-ca-central-1.s3.ca-central-1.amazonaws.comeu-central-1Europe Frankfurt irsa-oidc-discovery-prod-eu-central-1.s3.eu-central-1.amazonaws.comeu-west-1Europe Ireland irsa-oidc-discovery-prod-eu-west-1.s3.eu-west-1.amazonaws.comeu-west-2Europe London irsa-oidc-discovery-prod-eu-west-2.s3.eu-west-2.amazonaws.comsa-east-1South America São Paulo irsa-oidc-discovery-prod-sa-east-1.s3.sa-east-1.amazonaws.comus-east-1United States North Virginia irsa-oidc-discovery-prod.s3.us-east-1.amazonaws.comus-east-2United States Ohio irsa-oidc-discovery-prod-us-east-2.s3.us-east-2.amazonaws.comus-west-2United States Oregon irsa-oidc-discovery-prod-us-west-2.s3.us-west-2.amazonaws.com===== PAGE: https://docs.tigerdata.com/use-timescale/metrics-logging/metrics-to-prometheus/ =====
Export metrics to Prometheus
Prometheus is an open-source monitoring system with a dimensional data model, flexible query language, and a modern alerting approach.
This page shows you how to export your service telemetry to Prometheus:
- For Tiger Cloud, using a dedicated Prometheus exporter in Tiger Cloud Console.
- For self-hosted TimescaleDB, using Postgres Exporter.
Prerequisites
To follow the steps on this page:
- Download and run Prometheus.
- For Tiger Cloud:
Create a target Tiger Cloud service with the time-series and analytics capability enabled.
- For self-hosted TimescaleDB:
- Create a target self-hosted TimescaleDB instance. You need your connection details.
- Install Postgres Exporter. To reduce latency and potential data transfer costs, install Prometheus and Postgres Exporter on a machine in the same AWS region as your Tiger Cloud service.
Export Tiger Cloud service telemetry to Prometheus
To export your data, do the following:
To export metrics from a Tiger Cloud service, you create a dedicated Prometheus exporter in Tiger Cloud Console, attach it to your service, then configure Prometheus to scrape metrics using the exposed URL. The Prometheus exporter exposes the metrics related to the Tiger Cloud service like CPU, memory, and storage. To scrape other metrics, use Postgres Exporter as described for self-hosted TimescaleDB. The Prometheus exporter is available for Scale and Enterprise pricing plans.
Create a Prometheus exporter
In Tiger Cloud Console, click
Exporters>+ New exporter.Select
Metricsfor data type andPrometheusfor provider.

Choose the region for the exporter. Only services in the same project and region can be attached to this exporter.
Name your exporter.
Change the auto-generated Prometheus credentials, if needed. See official documentation on basic authentication in Prometheus.
Attach the exporter to a service
Select a service, then click
Operations>Exporters.Select the exporter in the drop-down, then click
Attach exporter.

The exporter is now attached to your service. To unattach it, click the trash icon in the exporter list.
Configure the Prometheus scrape target
- Select your service, then click
Operations>Exportersand click the information icon next to the exporter. You see the exporter details.

Copy the exporter URL.
In your Prometheus installation, update
prometheus.ymlto point to the exporter URL as a scrape target:scrape_configs: - job_name: "timescaledb-exporter" scheme: https static_configs: - targets: ["my-exporter-url"] basic_auth: username: "user" password: "pass"
See the Prometheus documentation for details on configuring scrape targets.
You can now monitor your service metrics. Use the following metrics to check the service is running correctly:
timescale.cloud.system.cpu.usage.millicorestimescale.cloud.system.cpu.total.millicorestimescale.cloud.system.memory.usage.bytestimescale.cloud.system.memory.total.bytestimescale.cloud.system.disk.usage.bytestimescale.cloud.system.disk.total.bytes
Additionally, use the following tags to filter your results.
|Tag|Example variable| Description | |-|-|----------------------------| |
host|us-east-1.timescale.cloud| | |project-id|| | |service-id|| | |region|us-east-1| AWS region | |role|replicaorprimary| For service with replicas |- Select your service, then click
To export metrics from self-hosted TimescaleDB, you import telemetry data about your database to Postgres Exporter, then configure Prometheus to scrape metrics from it. Postgres Exporter exposes metrics that you define, excluding the system metrics.
Create a user to access telemetry data about your database
Connect to your database in
psqlusing your connection details.Create a user named
monitoringwith a secure password:CREATE USER monitoring WITH PASSWORD '<password>';Grant the
pg_read_all_statspermission to themonitoringuser:GRANT pg_read_all_stats to monitoring;
Import telemetry data about your database to Postgres Exporter
- Connect Postgres Exporter to your database:
Use your connection details to import telemetry data about your database. You connect as the
monitoringuser:- Local installation: ```shell export DATA_SOURCE_NAME="postgres://<user>:<password>@<host>:<port>/<database>?sslmode=<sslmode>" ./postgres_exporter ``` - Docker: ```shell docker run -d \ -e DATA_SOURCE_NAME="postgres://<user>:<password>@<host>:<port>/<database>?sslmode=<sslmode>" \ -p 9187:9187 \ prometheuscommunity/postgres-exporter ```Check the metrics for your database in the Prometheus format:
- Browser:
Navigate to
http://<exporter-host>:9187/metrics.Command line:
curl http://<exporter-host>:9187/metrics
Configure Prometheus to scrape metrics
In your Prometheus installation, update
prometheus.ymlto point to your Postgres Exporter instance as a scrape target. In the following example, you replace<exporter-host>with the hostname or IP address of the PostgreSQL Exporter.global: scrape_interval: 15s scrape_configs: - job_name: 'postgresql' static_configs: - targets: ['<exporter-host>:9187']
If
prometheus.ymlhas not been created during installation, create it manually. If you are using Docker, you can find the IPAddress inInspect>Networksfor the container running Postgres Exporter.Restart Prometheus.
Check the Prometheus UI at
http://<prometheus-host>:9090/targetsandhttp://<prometheus-host>:9090/tsdb-status.
You see the Postgres Exporter target and the metrics scraped from it.
You can further visualize your data with Grafana. Use the Grafana Postgres dashboard or create a custom dashboard that suits your needs.
===== PAGE: https://docs.tigerdata.com/use-timescale/metrics-logging/monitoring/ =====
Monitor your Tiger Cloud services
Get complete visibility into your service performance with Tiger Cloud's powerful monitoring suite. Whether you're optimizing for peak efficiency or troubleshooting unexpected behavior, Tiger Cloud gives you the tools to quickly identify and resolve issues.
When something doesn't look right, Tiger Cloud provides a complete investigation workflow:

- Pinpoint the bottleneck: check Metrics to identify exactly when CPU, memory, or storage spiked.
- Find the root cause: review Logs for errors or warnings that occurred during the incident.
- Identify the culprit: examine Insights to see which queries were running at that time and how they impacted resources.
- Check background activity: look at Jobs to see if scheduled tasks triggered the issue.
- Investigate active connections: use Connections to see what clients were connected and what queries they were running.
Want to save some time? Check out Recommendations for alerts that may have already flagged the problem!
This pages explains what specific data you get at each point.
Metrics
Tiger Cloud shows you CPU, memory, and storage metrics for up to 30 previous days and with down to 10-second granularity. To access metrics, select your service in Tiger Cloud Console, then click
Monitoring>Metrics: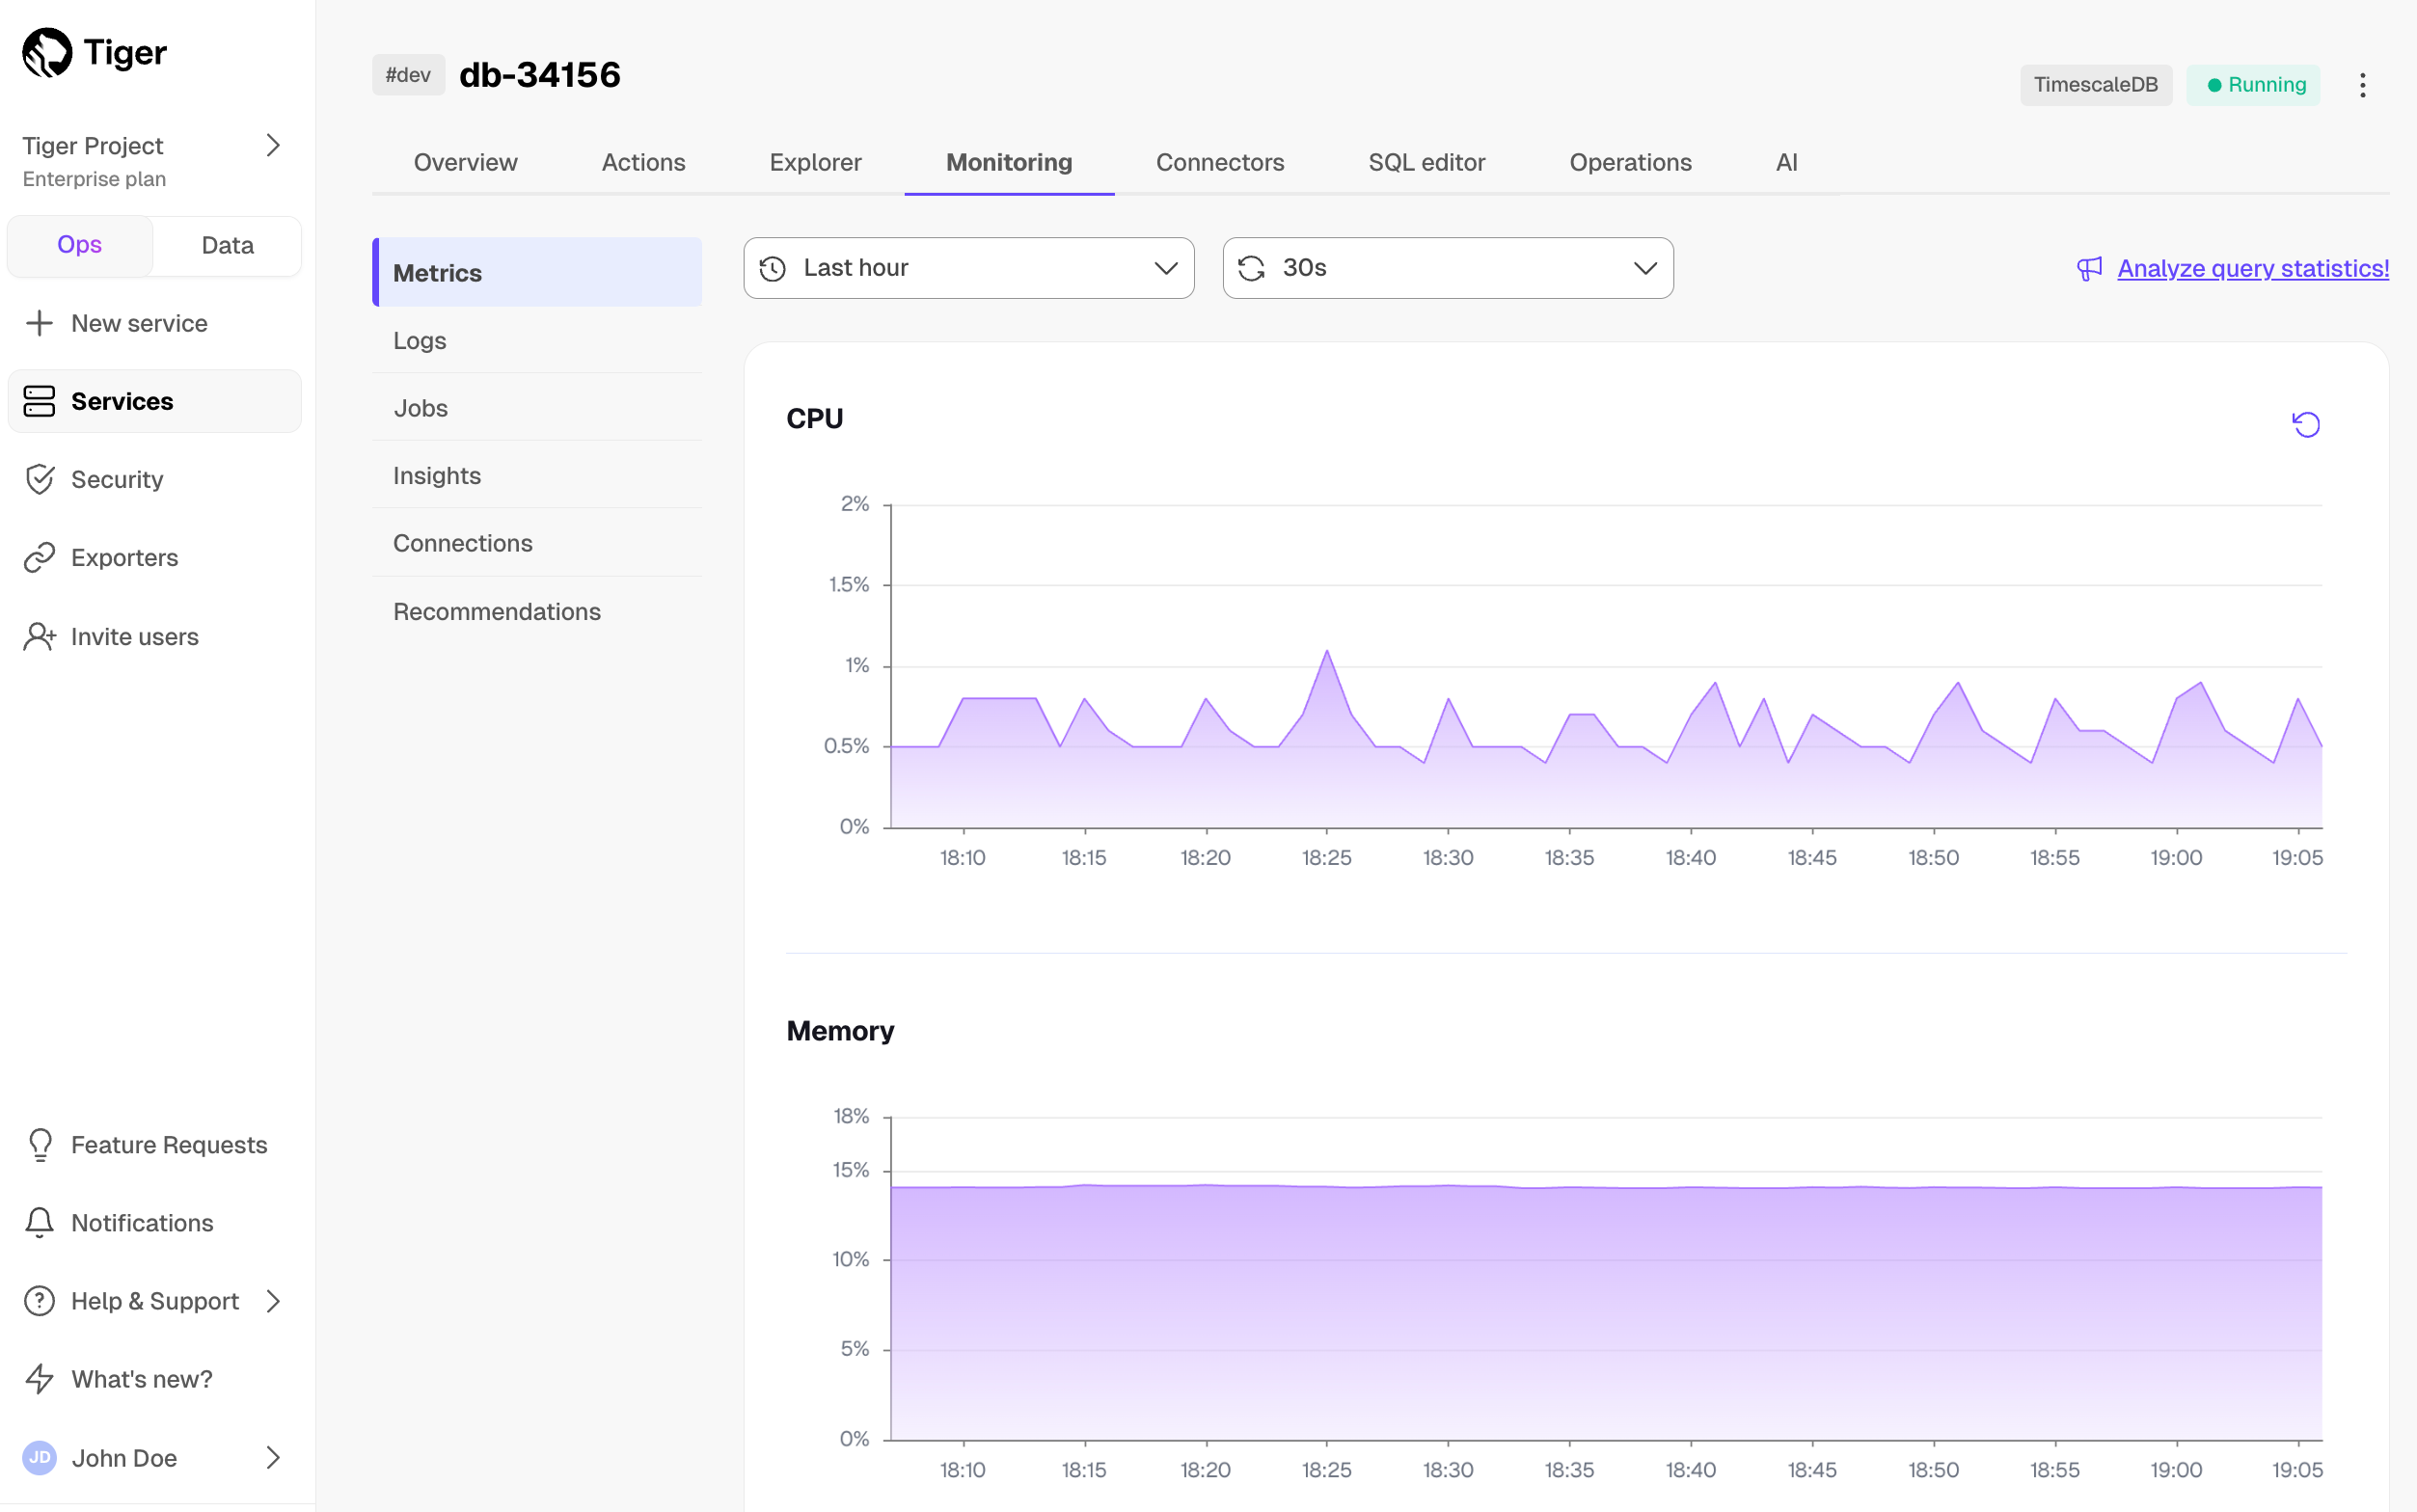
The following metrics are represented by graphs:
- CPU, in mCPU
- Memory, in GiB
- Storage used, in GiB
- Storage I/O, in ops/sec
- Storage bandwidth, in MiB/sec
The Free pricing plan only includes storage metrics.
When you hit the limits:
- For CPU and memory: provision more for your service in
Operations>Compute and storage. - For storage, I/O, and bandwidth: these resources depend on your storage type and I/O boost settings. The standard high-performance storage gives you 16TB of compressed data on a single server, regardless of the number of hypertables in your service. See About storage tiers for how to change the available storage, I/O, and bandwidth.
Hover over the graph to view metrics for a specific time point. Select an area in the graph to zoom into a specific period.
Gray bars indicate that metrics have not been collected for the period shown:
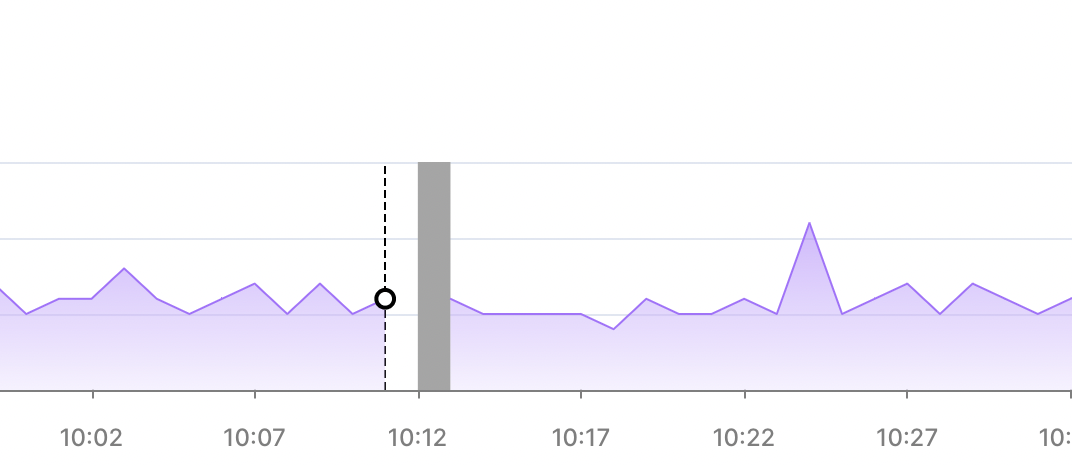
Understand high memory usage
It is normal to observe high overall memory usage for your Tiger Cloud services, especially for workloads with active read and write. Tiger Cloud service run on Linux, and high memory usage is a particularity of the Linux page cache. The Linux kernel stores file-backed data in memory to speed up read operations. Postgres, and by extension, Tiger Cloud services rely heavily on disk I/O to access tables, WALs, and indexes. When your service reads these files, the kernel caches them in memory to improve performance for future access.
Page cache entries are not locked memory: they are evictable and are automatically reclaimed by the kernel when actual memory pressure arises. Therefore, high memory usage shown in the monitoring dashboards is often not due to service memory allocation, but the beneficial caching behavior in the Linux kernel. The trick is to distinguish between normal memory utilization and memory pressure.
High memory usage does not necessarily mean a problem, especially on read replicas or after periods of activity. For a more accurate view of database memory consumption, look at Postgres-specific metrics, such as shared_buffers or memory context breakdowns. Only take action if you see signs of real memory pressure—such as OOM (Out Of Memory) events or degraded performance.
Service states
Tiger Cloud Console gives you a visual representation of the state of your service. The following states are represented with the following colors:
State Color Configuring Yellow Deleted Yellow Deleting Yellow Optimizing Green Paused Grey Pausing Grey Queued Yellow Ready Green Resuming Yellow Unstable Yellow Upgrading Yellow Read-only Red Logs
Tiger Cloud shows you detailed logs for your service, which you can filter by type, date, and time.
To access logs, select your service in Tiger Cloud Console, then click
Monitoring>Logs: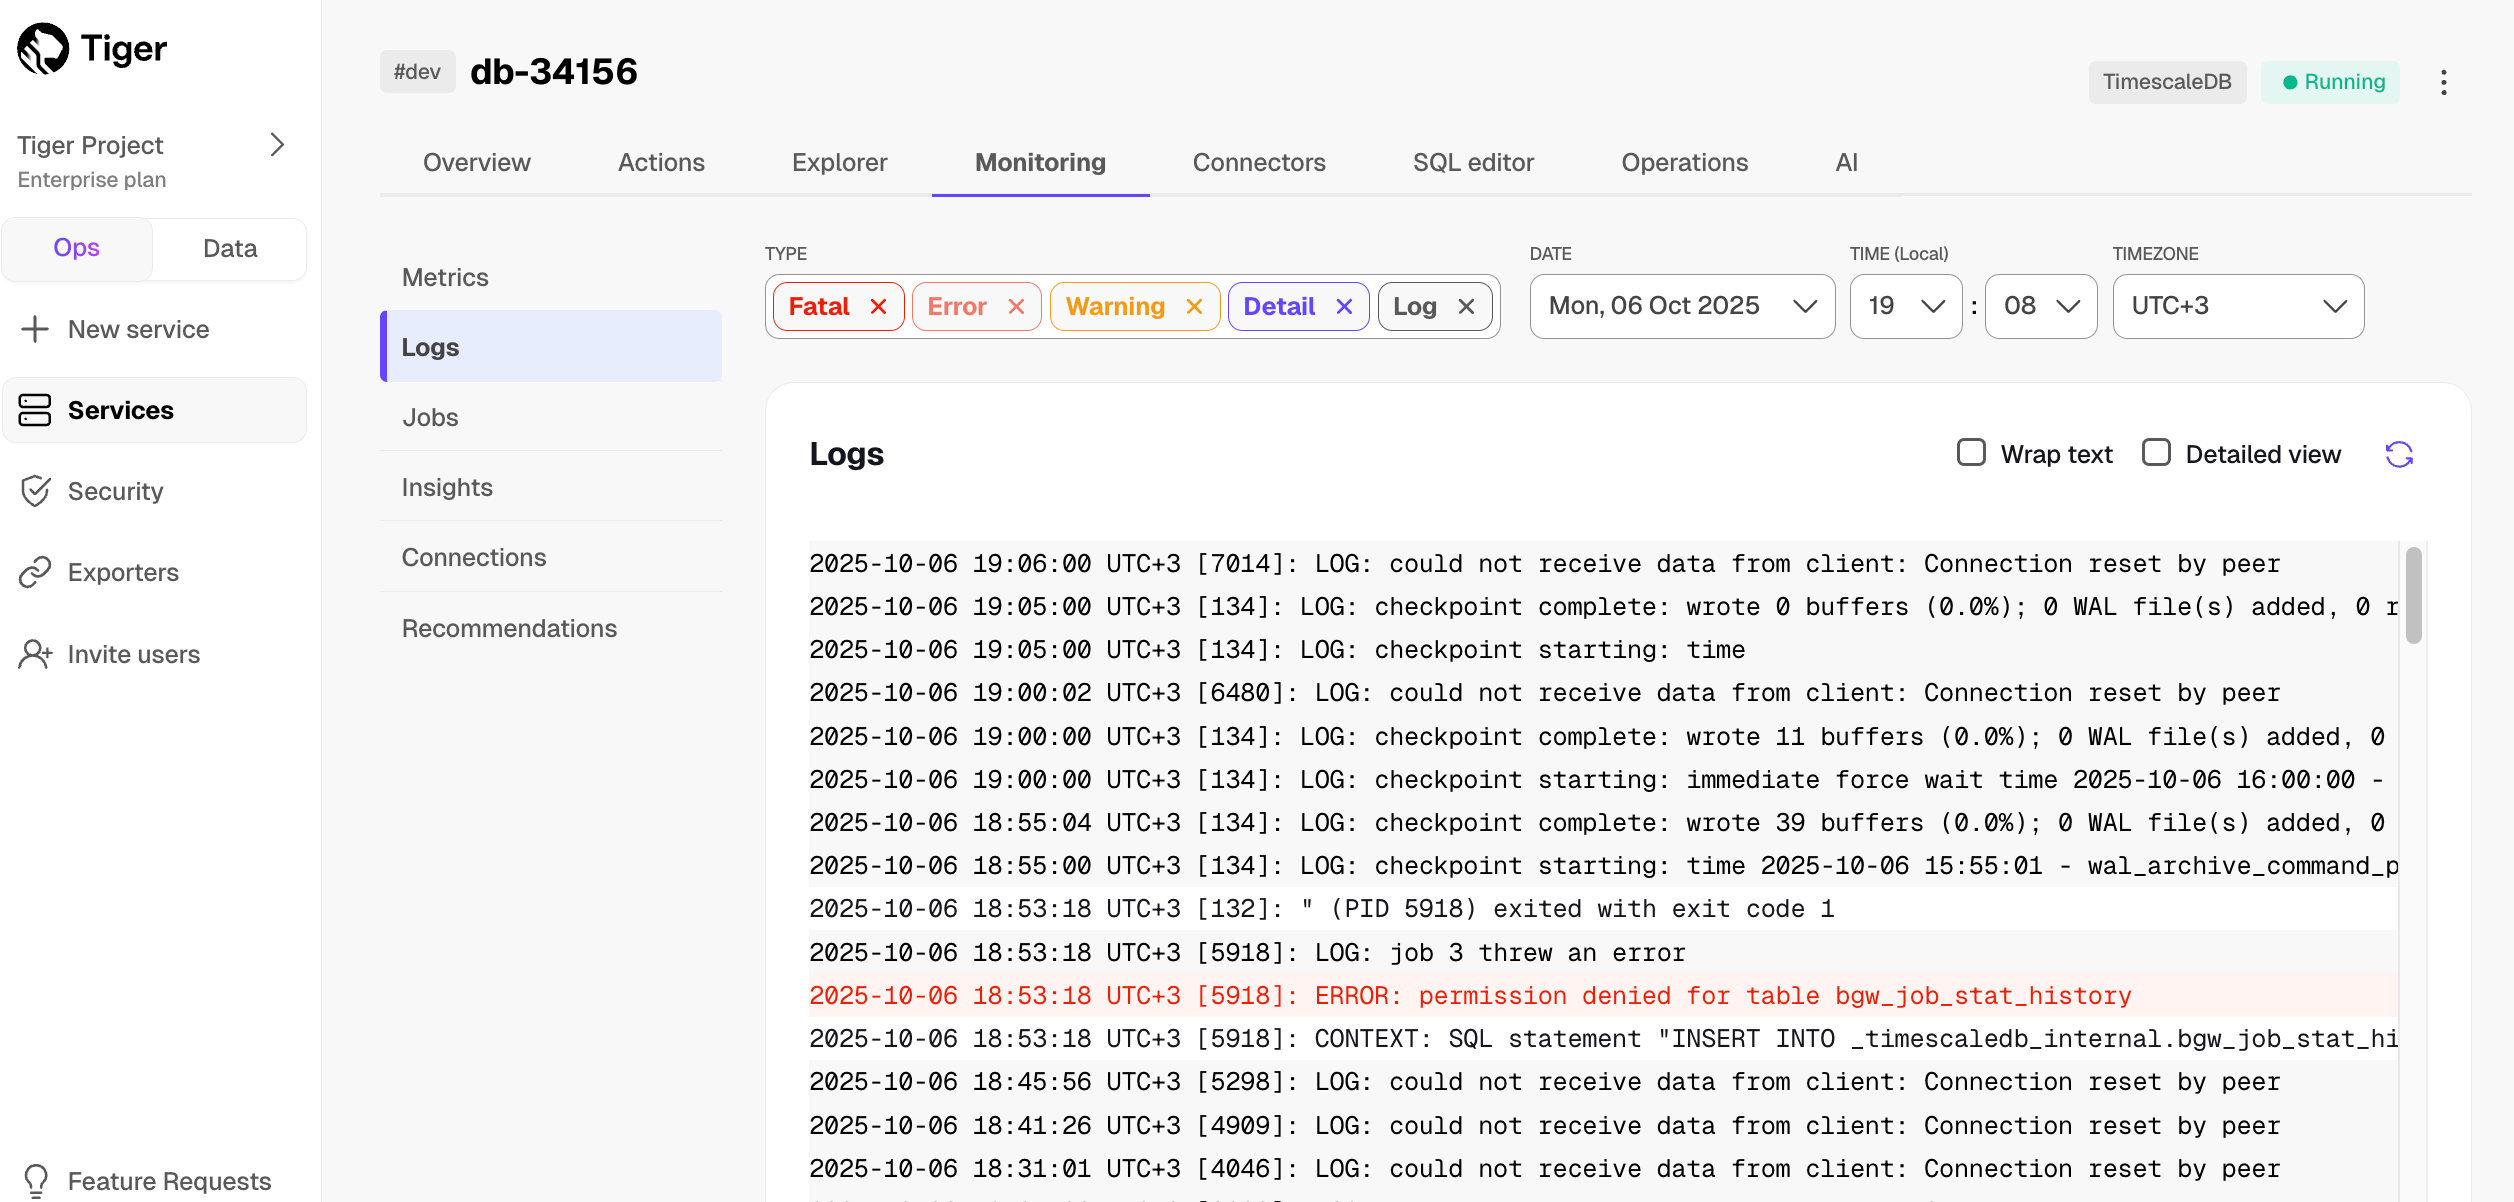
Insights
Insights help you get a comprehensive understanding of how your queries perform over time, and make the most efficient use of your resources.
To view insights, select your service, then click
Monitoring>Insights. Search or filter queries by type, maximum execution time, and time frame.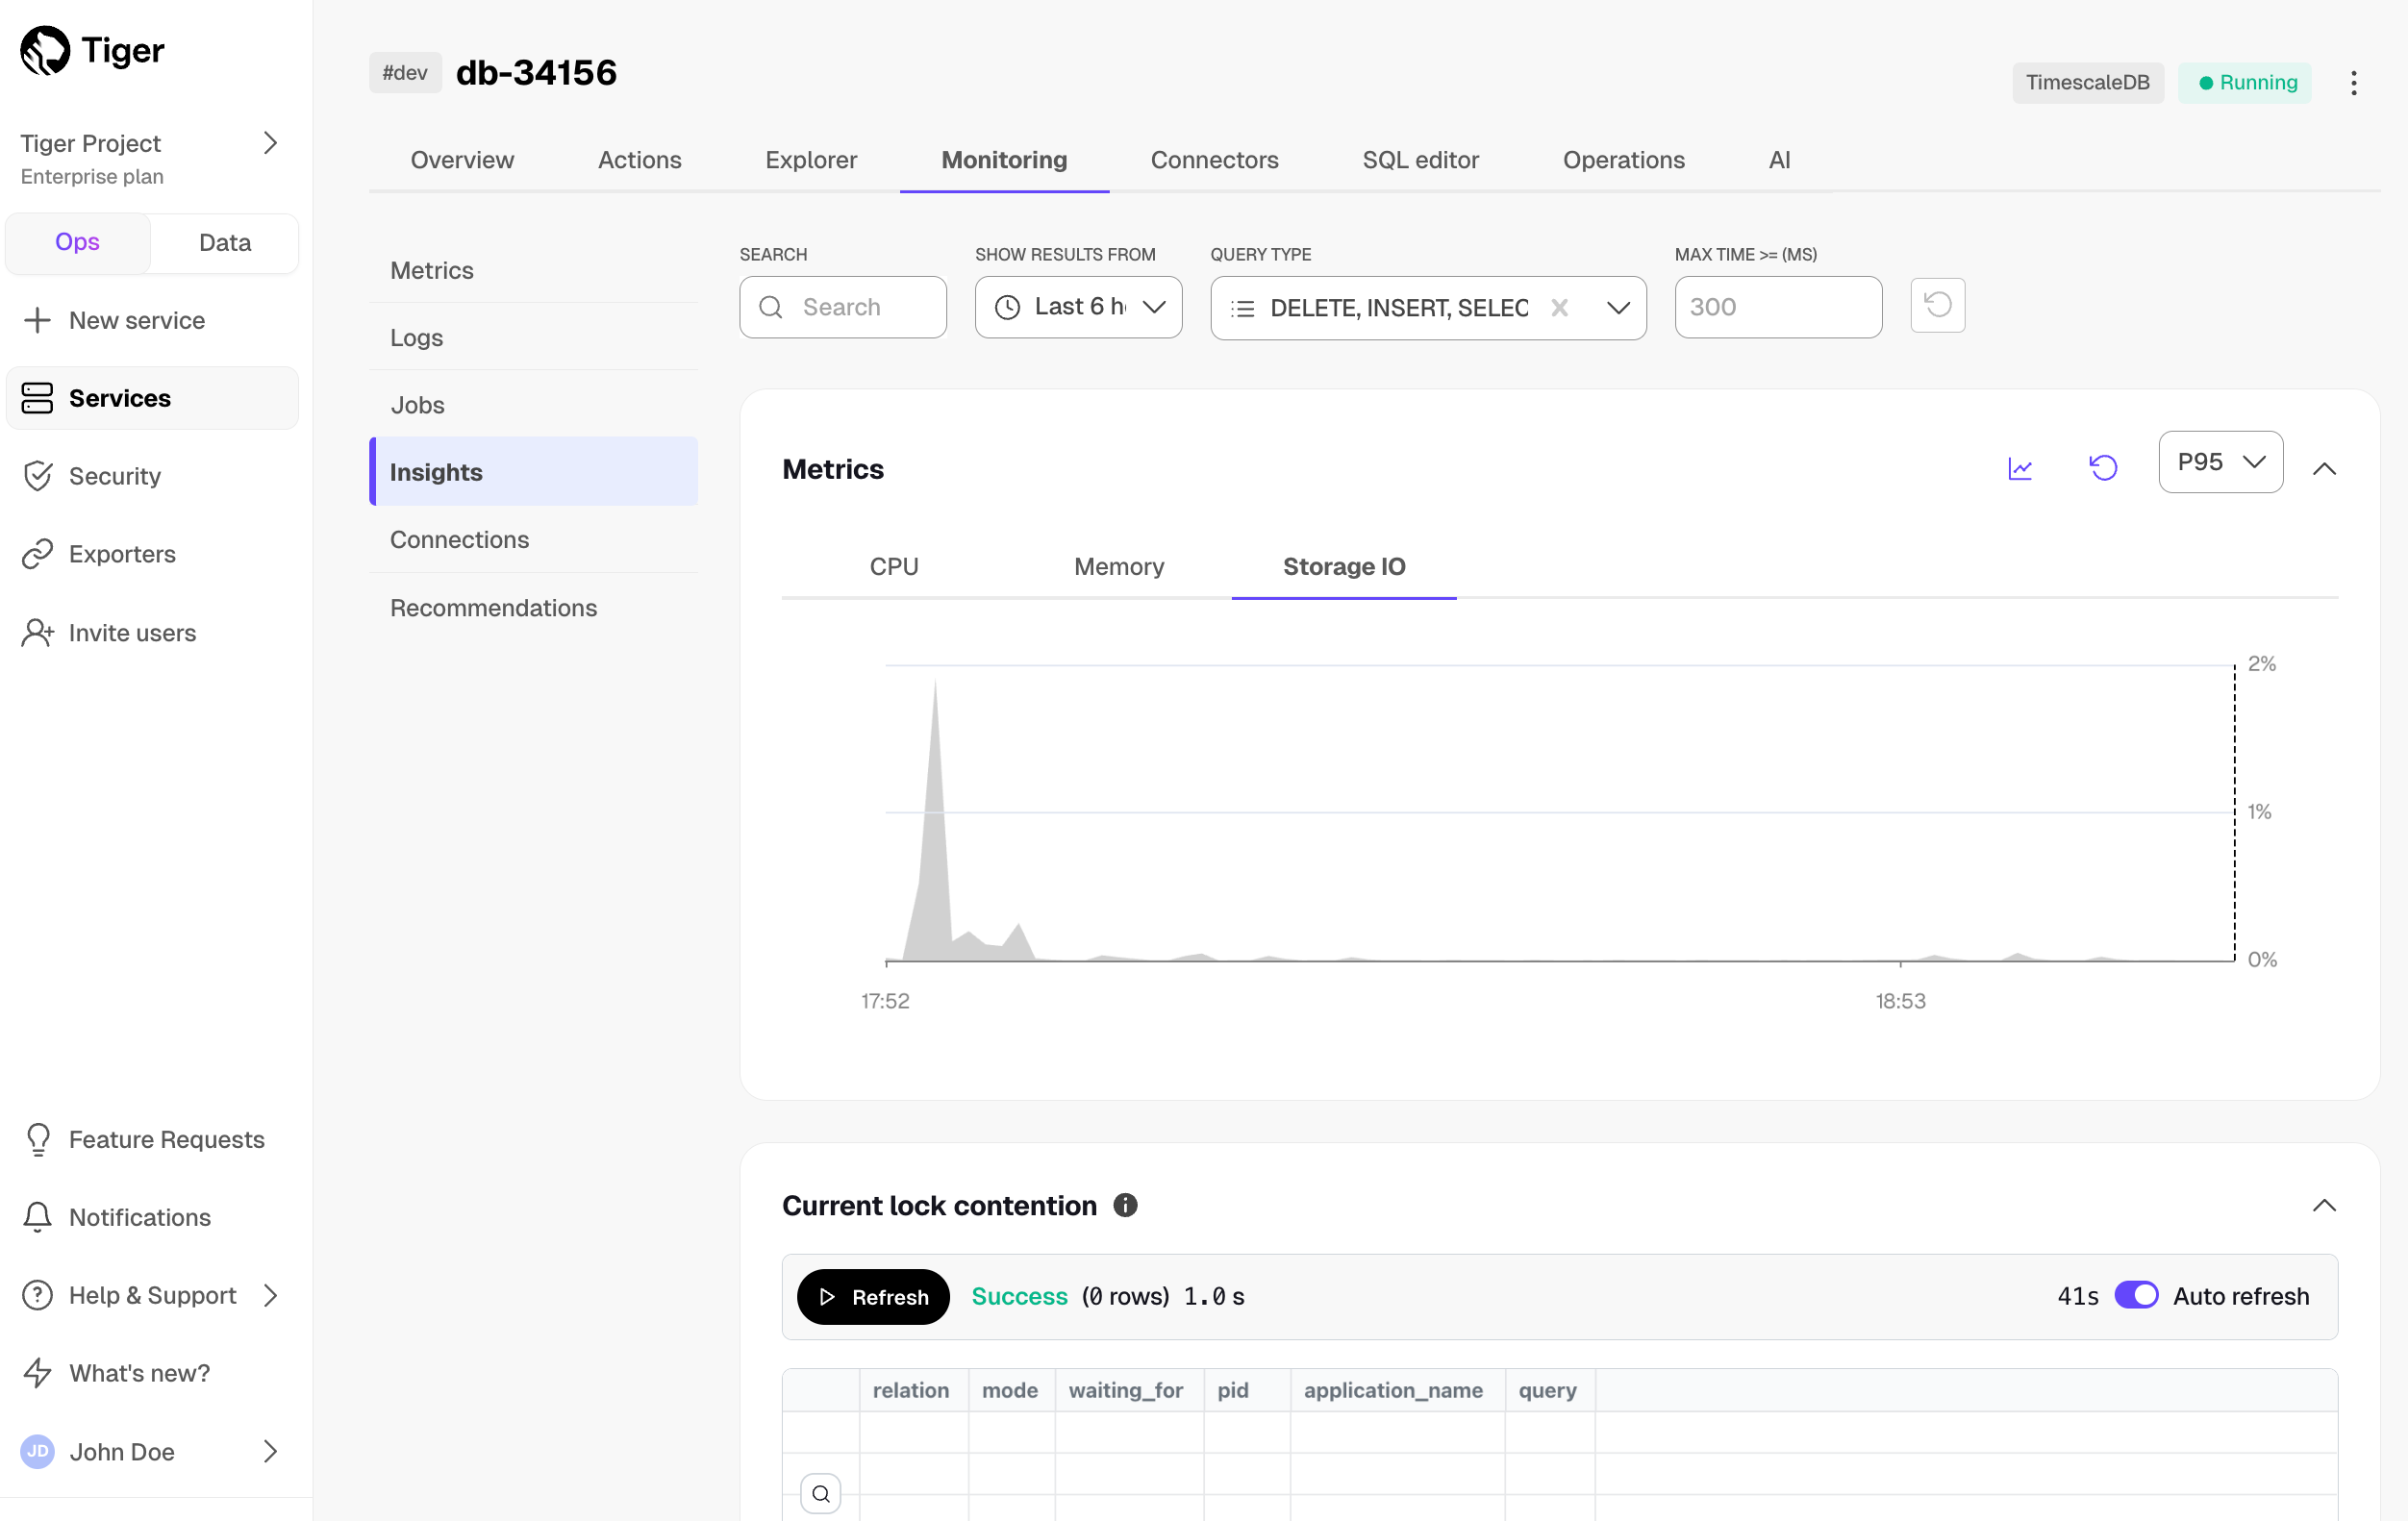
Insights include
Metrics,Current lock contention, andQueries.Metricsprovides a visual representation of CPU, memory, and storage input/output usage over time. It also overlays the execution times of the top three queries matching your search. This helps correlate query executions with resource utilization. Select an area of the graph to zoom into a specific time frame.Current lock contentionshows how many queries or transactions are currently waiting for locks held by other queries or transactions.Queriesdisplays the top 50 queries matching your search. This includes executions, total rows, total time, median time, P95 time, related hypertables, tables in the columnstore, and user name.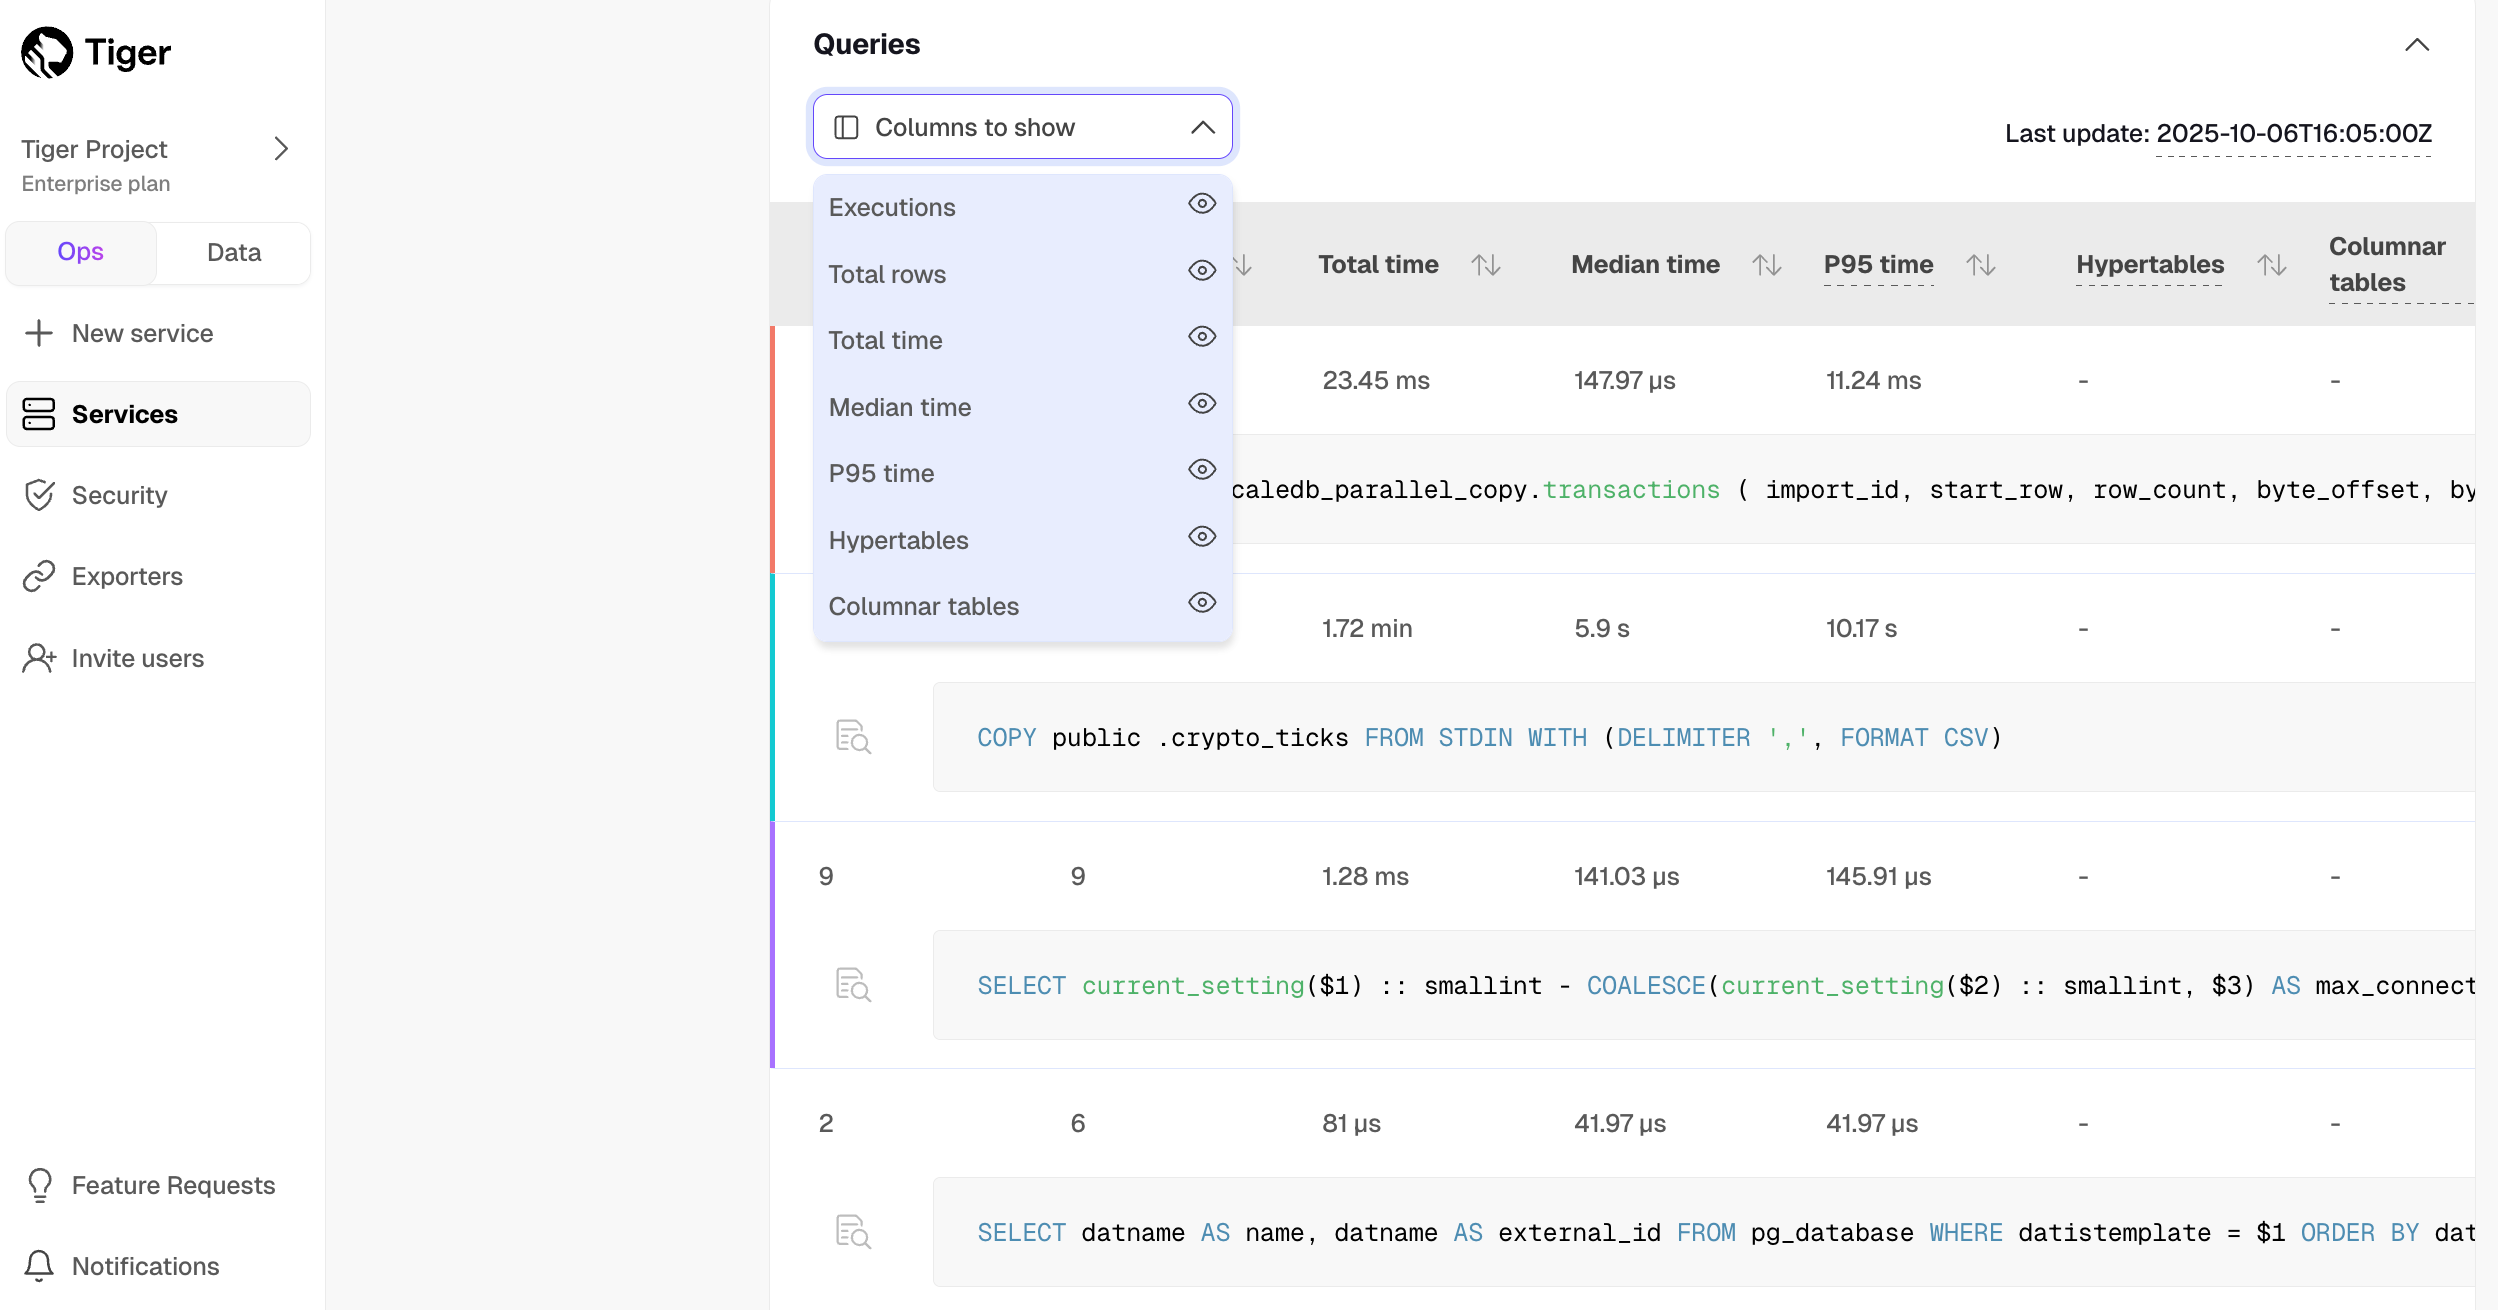
Column Description ExecutionsThe number of times the query ran during the selected period. Total rowsThe total number of rows scanned, inserted, or updated by the query during the selected period. Total timeThe total time of query execution. Median timeThe median (P50) time of query execution. P95 timeThe ninety-fifth percentile, or the maximum time of query execution. HypertablesIf the query ran on a hypertable. Columnar tablesIf the query drew results from a chunk in the columnstore. User nameThe user name of the user running the query. These metrics calculations are based on the entire period you've selected. For example, if you've selected six hours, all the metrics represent an aggregation of the previous six hours of executions.
If you have just completed a query, it can take some minutes for it to show in the table. Wait a little, then refresh the page to see your query. Check out the last update value at the top of the query table to identify the timestamp from the last processed query stat.
Click a query in the list to see the drill-down view. This view not only helps you identify spikes and unexpected behaviors, but also offers information to optimize your query.
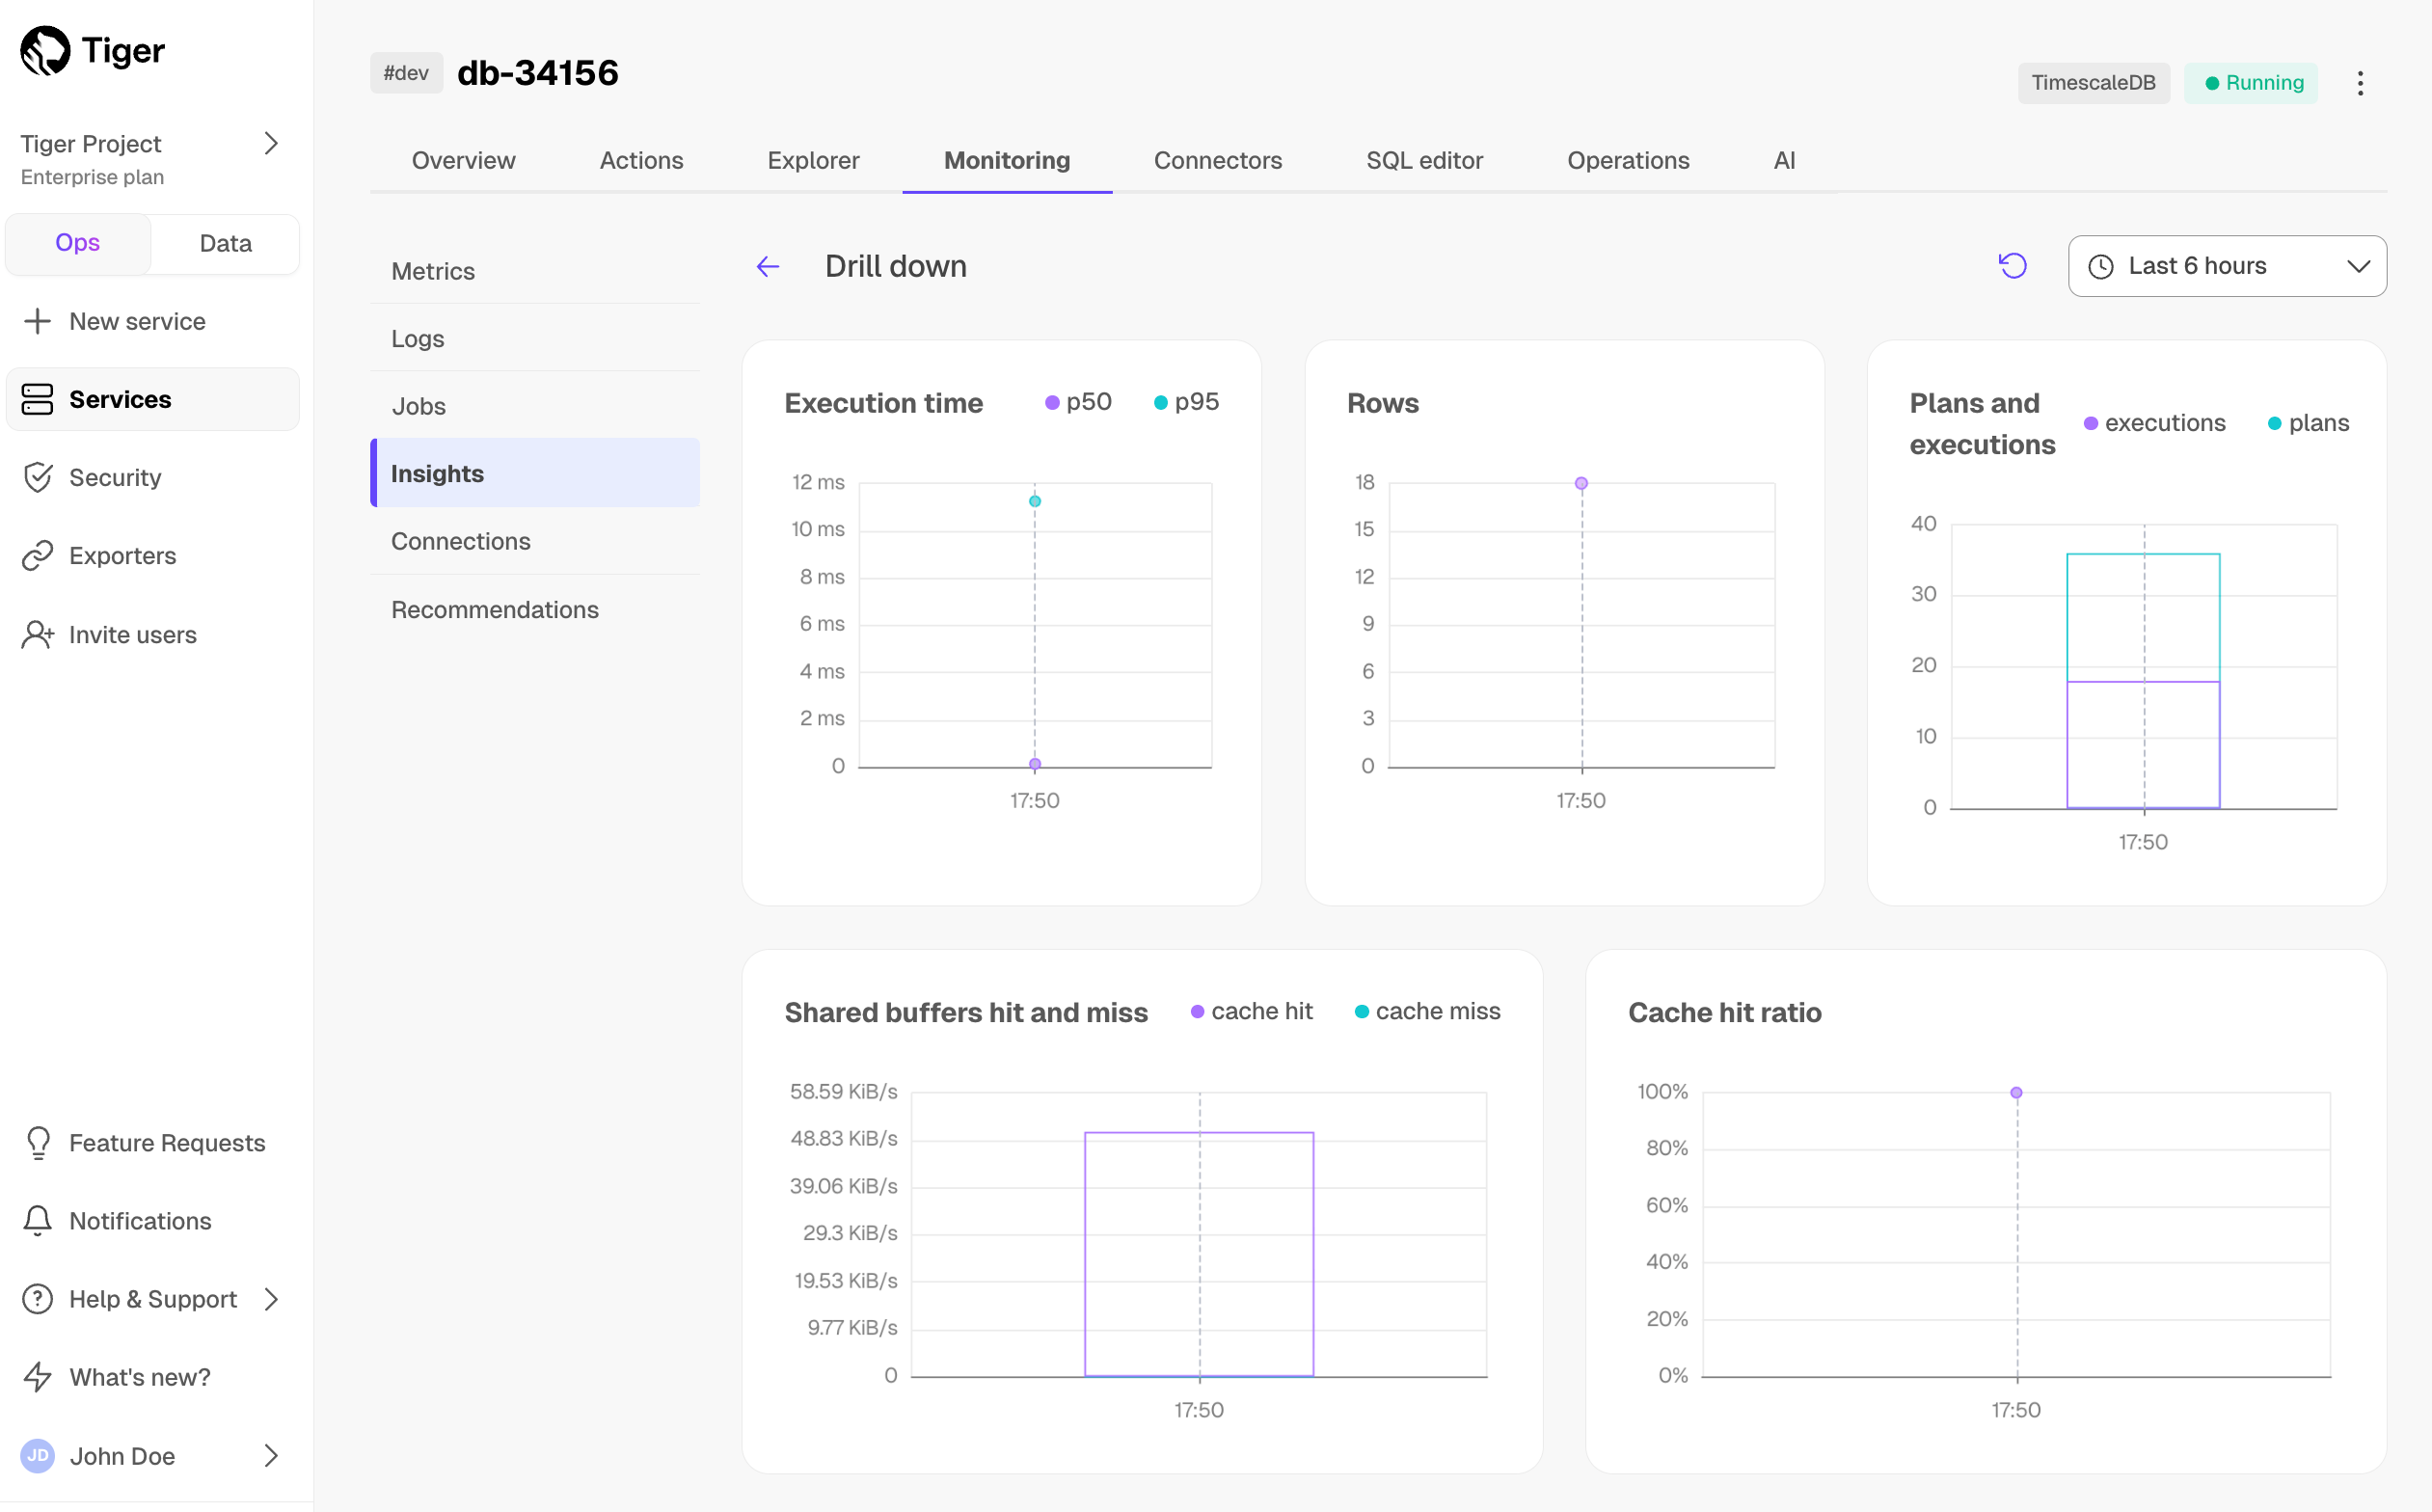
This view includes the following graphs:
Execution time: the median and P95 query execution times over the selected period. This is useful to understand the consistency and efficiency of your query's execution over time.EXPLAINplan: for queries that take more than 10 seconds to execute, there is an EXPLAIN plan collected automatically.Rows: the impact of your query on rows over time. If it's aSELECTstatement, it shows the number of rows retrieved, while for anINSERT/UPDATEstatement, it reflects the rows inserted.Plans and executions: the number of query plans and executions over time. You can use this to optimize query performance, helping you assess if you can benefit from prepared statements to reduce planning overhead.Shared buffers hit and miss: shared buffers play a critical role in Postgres's performance by caching data in memory. A shared buffer hit occurs when the required data block is found in the shared buffer memory, while a miss indicates that Postgres couldn't locate the block in memory. A miss doesn't necessarily mean a disk read, because Postgres may retrieve the data from the operating system's disk pages cache. If you observe a high number of shared buffer misses, your current shared buffers setting might be insufficient. Increasing the shared buffer size can improve cache hit rates and query speed.Cache hit ratio: measures how much of your query's data is read from shared buffers. A 100% value indicates that all the data required by the query was found in the shared buffer, while a 0% value means none of the necessary data blocks were in the shared buffers. This metric provides a clear understanding of how efficiently your query leverages shared buffers, helping you optimize data access and database performance.
Jobs
Tiger Cloud summarizes all jobs set up for your service along with their details like type, target object, and status. This includes native Tiger Cloud jobs as well as custom jobs you configure based on your specific needs.
- To view jobs, select your service in Tiger Cloud Console, then click
Monitoring>Jobs:
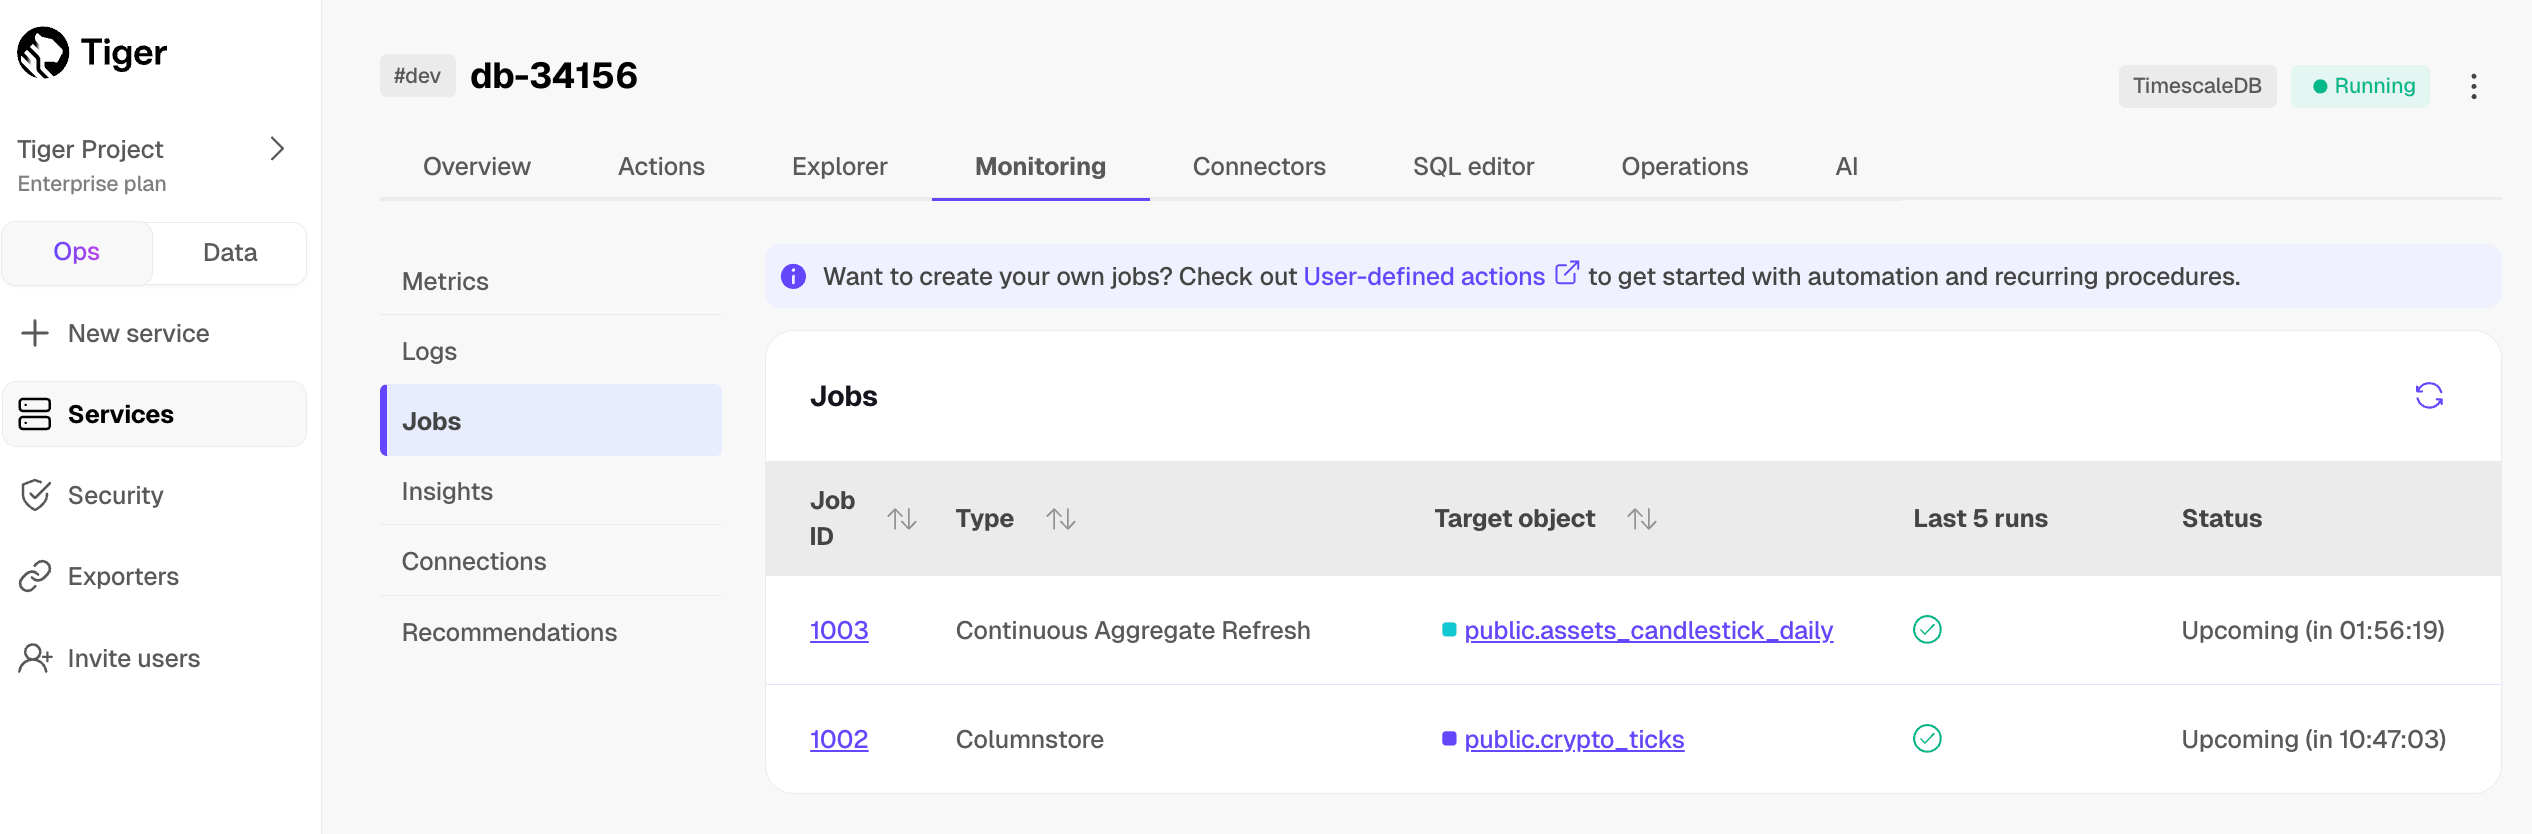
- Click a job ID in the list to view its config and run history:
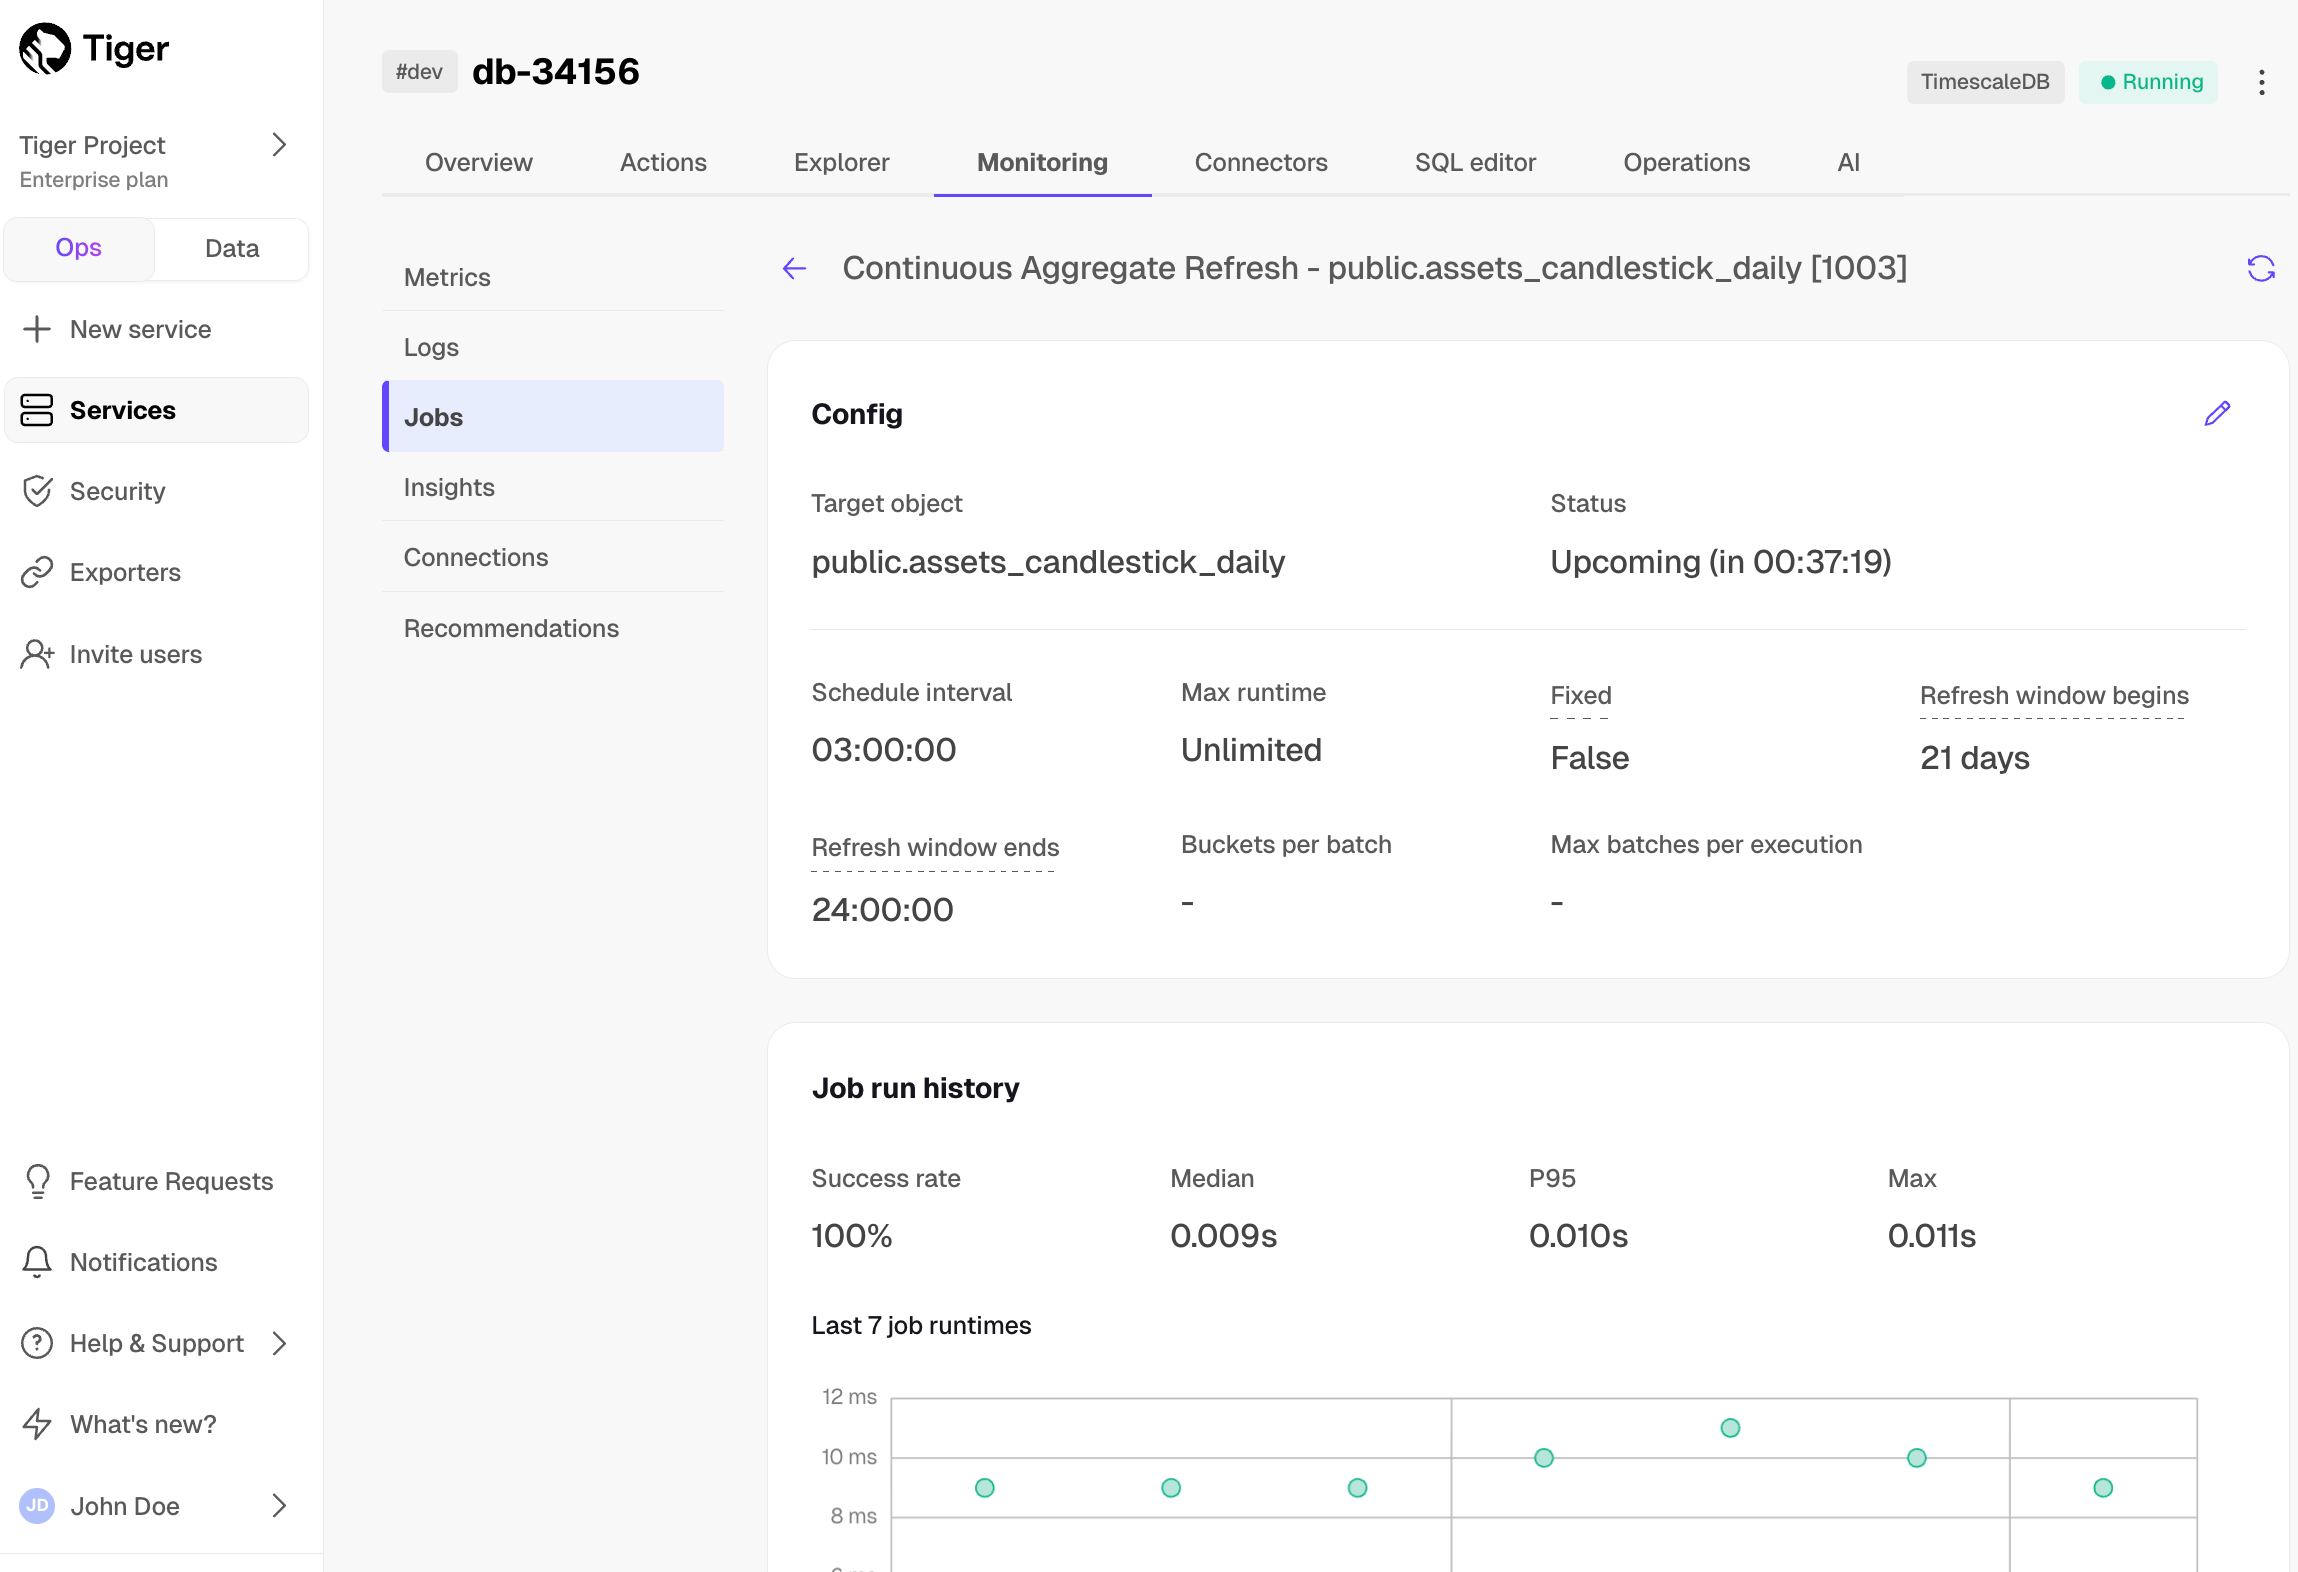
- Click the pencil icon to edit the job config:
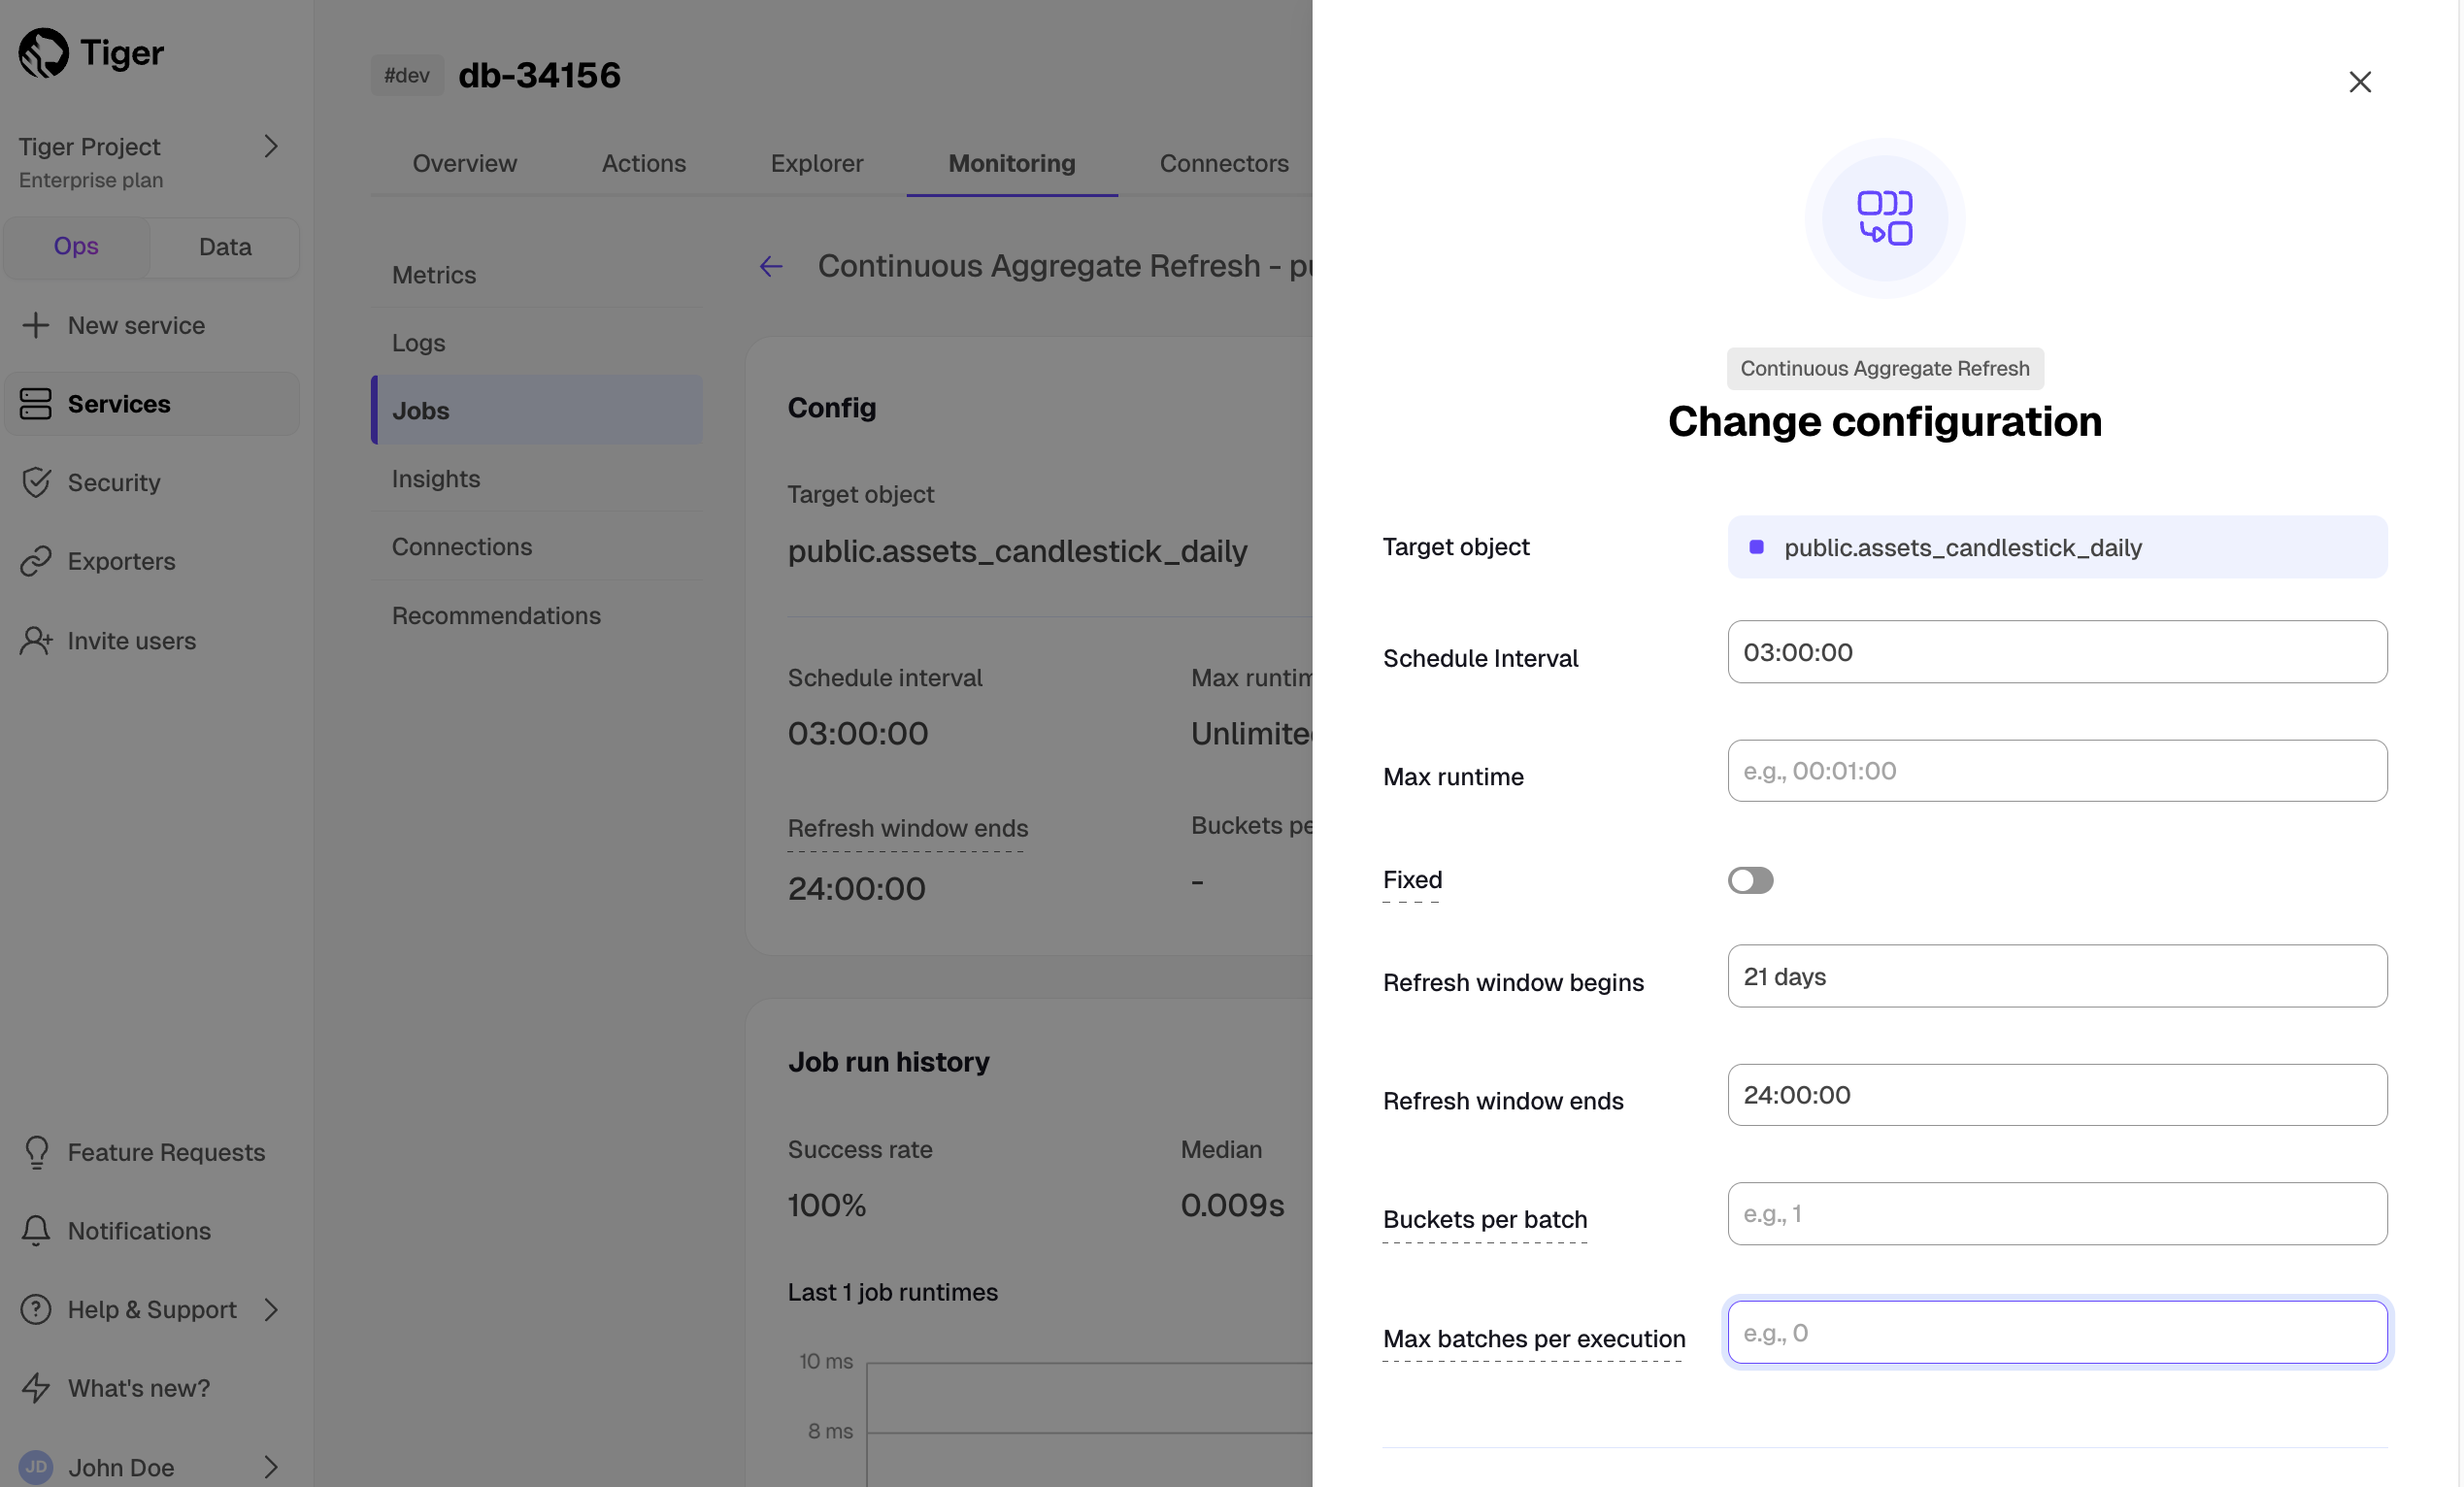
Connections
Tiger Cloud lists current and past connections to your service. This includes details like the corresponding query, connecting application, username, connection status, start time, and duration.
To view connections, select your service in Tiger Cloud Console, then click
Monitoring>Connections. Expand the query underneath each connection to see the full SQL.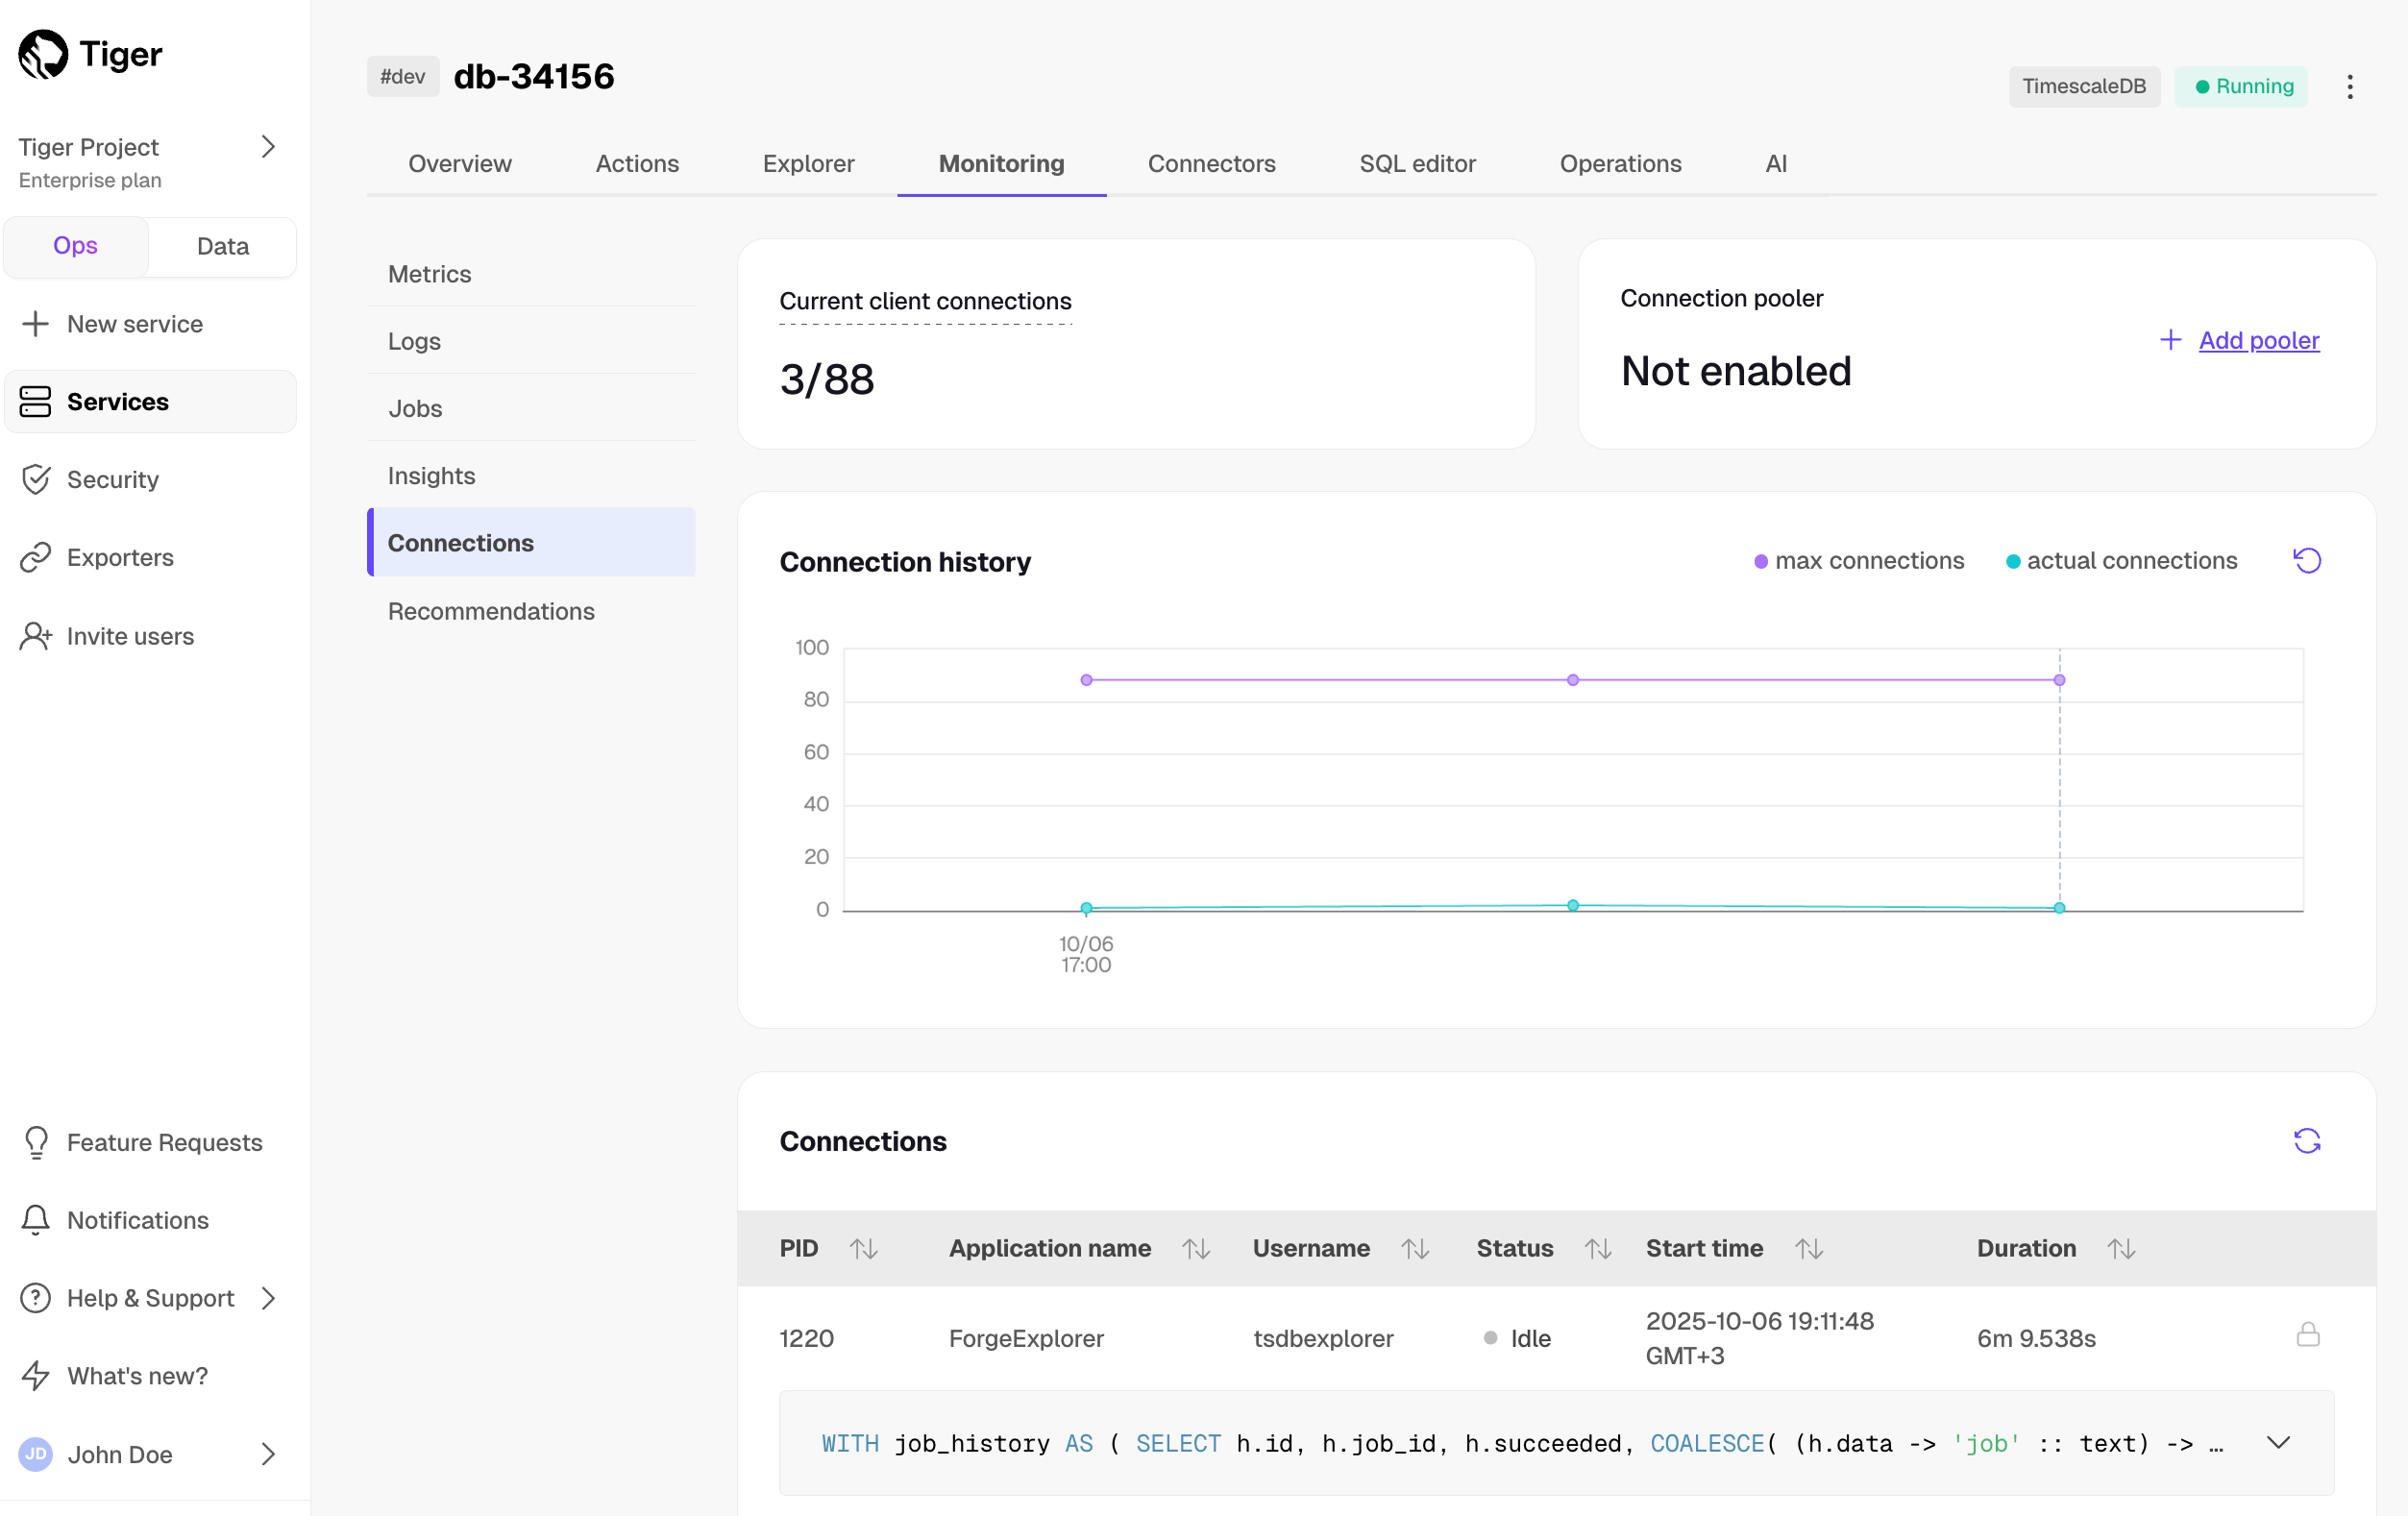
Click the trash icon next to a connection in the list to terminate it. A lock icon means that a connection cannot be terminated; hover over the icon to see the reason.
Recommendations
Tiger Cloud offers specific tips on configuring your service. This includes a wide range of actions—from finishing account setup to tuning your service for the best performance. For example, Tiger Cloud may recommend a more suitable chunk interval or draw your attention to consistently failing jobs.
To view recommendations, select your service in Tiger Cloud Console, then click
Monitoring>Recommendations: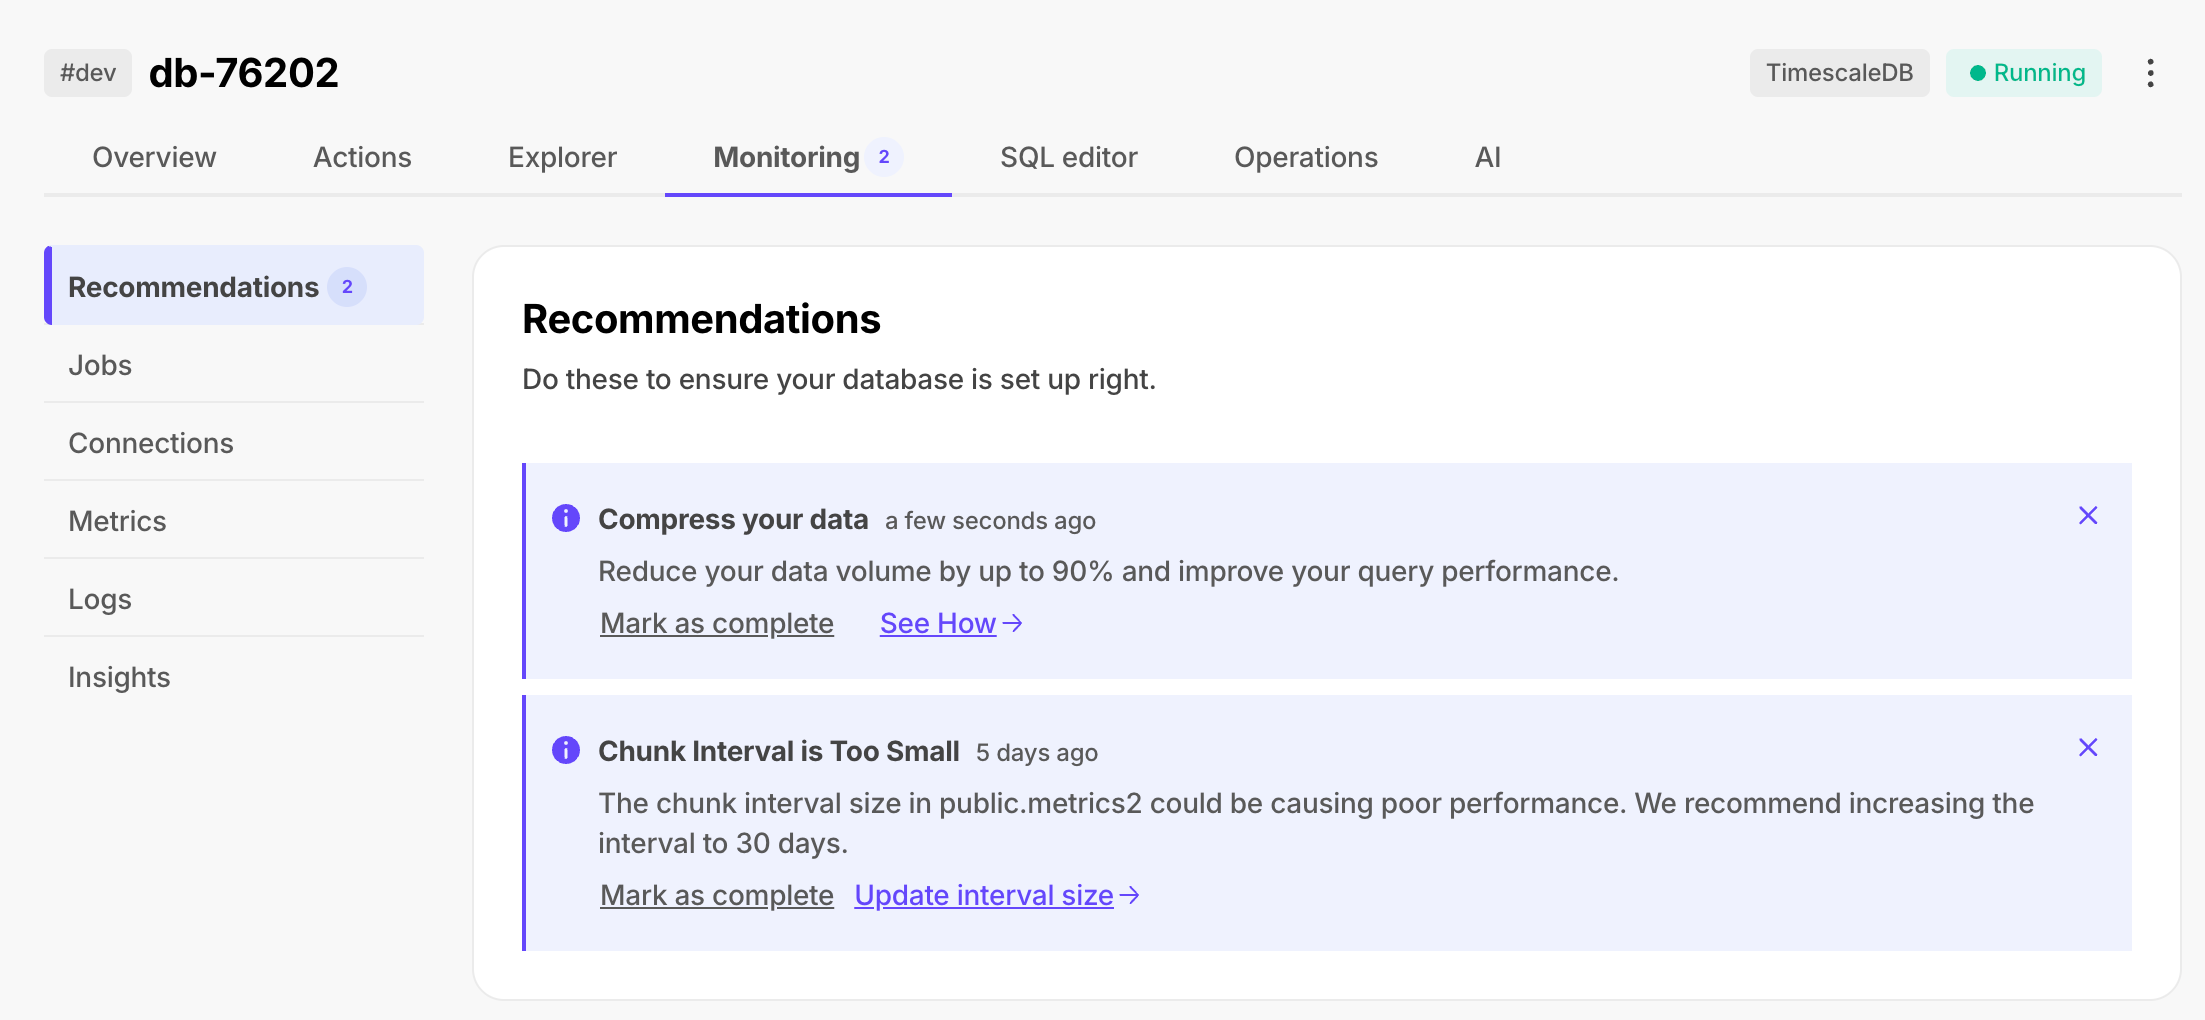
Query-level statistics with
pg_stat_statementsYou can also get query-level statistics for your services with the
pg_stat_statementsextension. This includes the time spent planning and executing each query; the number of blocks hit, read, and written; and more.pg_stat_statementscomes pre-installed with Tiger Cloud.For more information about
pg_stat_statements, see the Postgres documentation.Query the
pg_stat_statementsview as you would any Postgres view. The full view includes superuser queries used by Tiger Cloud to manage your service in the background. To view only your queries, filter by the current user.Connect to your service and run the following command:
SELECT * FROM pg_stat_statements WHERE pg_get_userbyid(userid) = current_user;For example, to identify the top five longest-running queries by their mean execution time:
SELECT calls, mean_exec_time, query FROM pg_stat_statements WHERE pg_get_userbyid(userid) = current_user ORDER BY mean_exec_time DESC LIMIT 5;Or the top five queries with the highest relative variability in the execution time, expressed as a percentage:
SELECT calls, stddev_exec_time/mean_exec_time*100 AS rel_std_dev, query FROM pg_stat_statements WHERE pg_get_userbyid(userid) = current_user ORDER BY rel_std_dev DESC LIMIT 5;For more examples and detailed explanations, see the blog post on identifying performance bottlenecks with
pg_stat_statements.===== PAGE: https://docs.tigerdata.com/use-timescale/metrics-logging/aws-cloudwatch/ =====
Export metrics to Amazon Cloudwatch
You can export telemetry data from your Tiger Cloud services with the time-series and analytics capability enabled to Amazon CloudWatch. Available metrics include CPU usage, RAM usage, and storage. This integration is available for Scale or Enterprise pricing plans.
This page shows you how to create an Amazon CloudWatch exporter in Tiger Cloud Console, and manage the lifecycle of data exporters.
Prerequisites
To follow the steps on this page:
- Create a target Tiger Cloud service with real-time analytics enabled.
Create a data exporter
Tiger Cloud data exporters send telemetry data from a Tiger Cloud service to a third-party monitoring tools. You create an exporter on the project level, in the same AWS region as your service:
- In Tiger Cloud Console, open Exporters
- Click
New exporter Select the data type and specify
AWS CloudWatchfor provider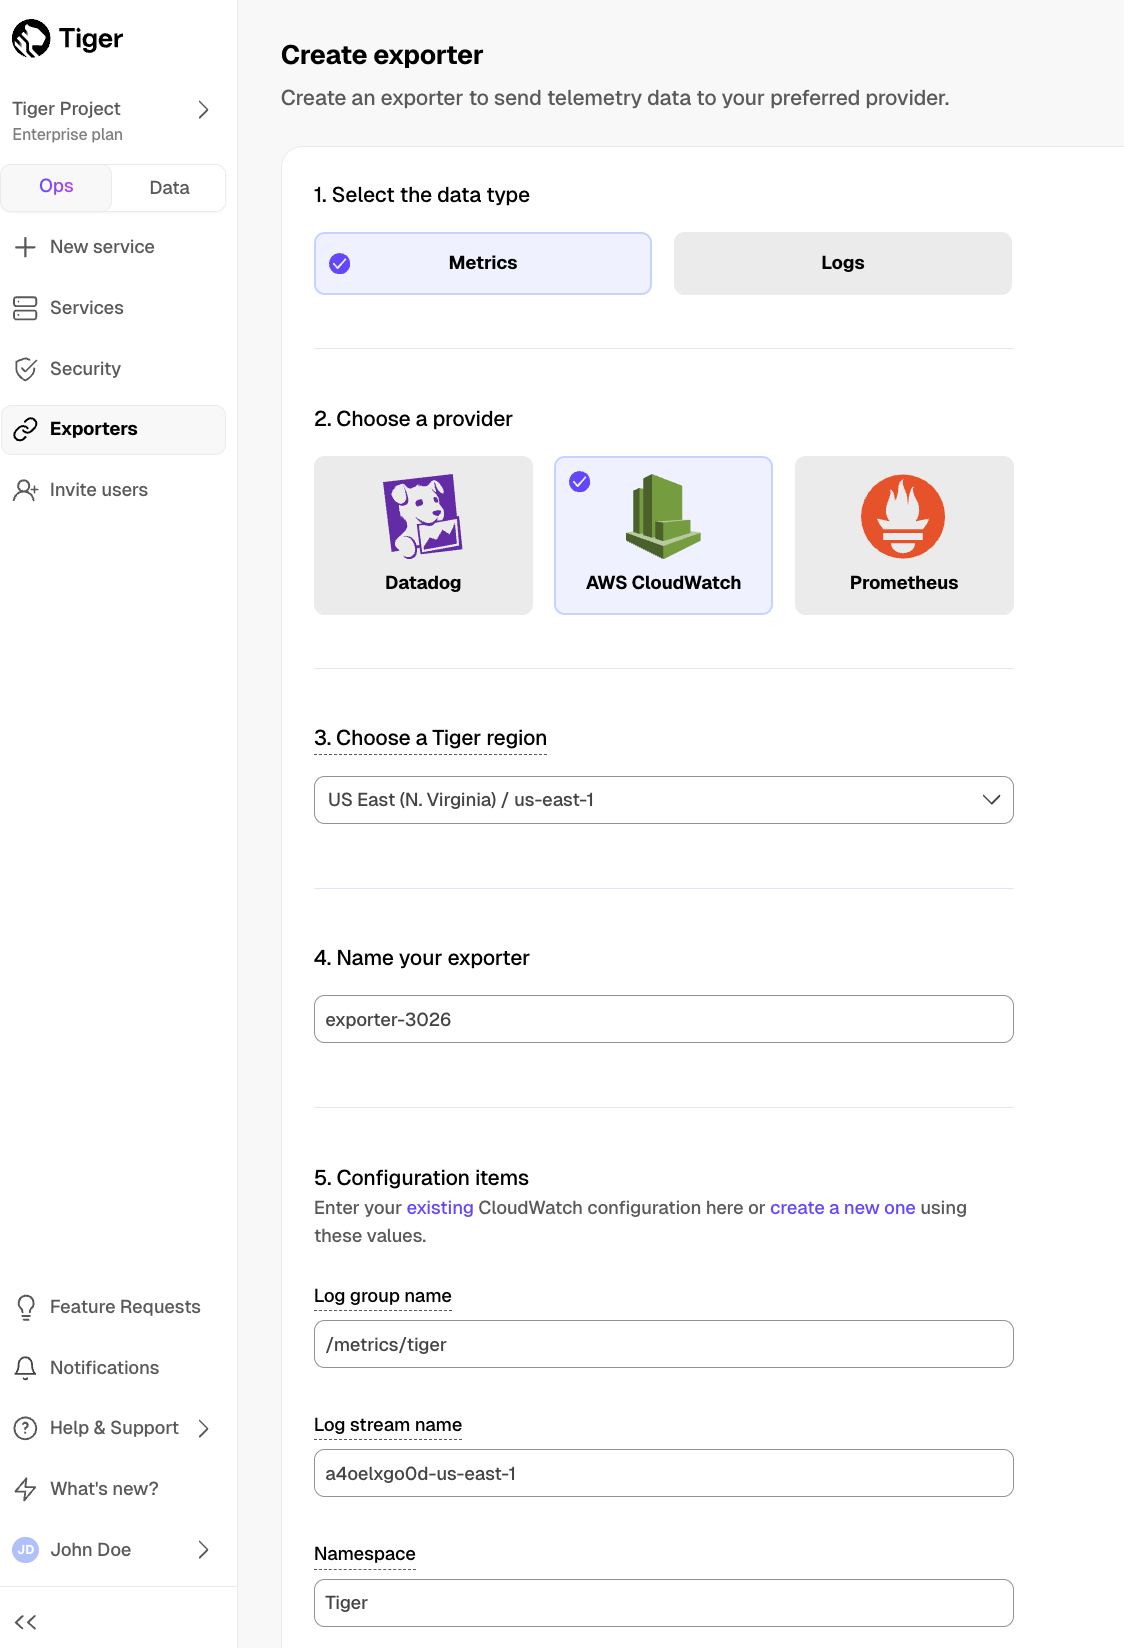
Provide your AWS CloudWatch configuration
- The AWS region must be the same for your Tiger Cloud exporter and AWS CloudWatch Log group.
- The exporter name appears in Tiger Cloud Console, best practice is to make this name easily understandable.
- For CloudWatch credentials, either use an existing CloudWatch Log group or create a new one. If you're uncertain, use the default values. For more information, see Working with log groups and log streams.
Choose the authentication method to use for the exporter
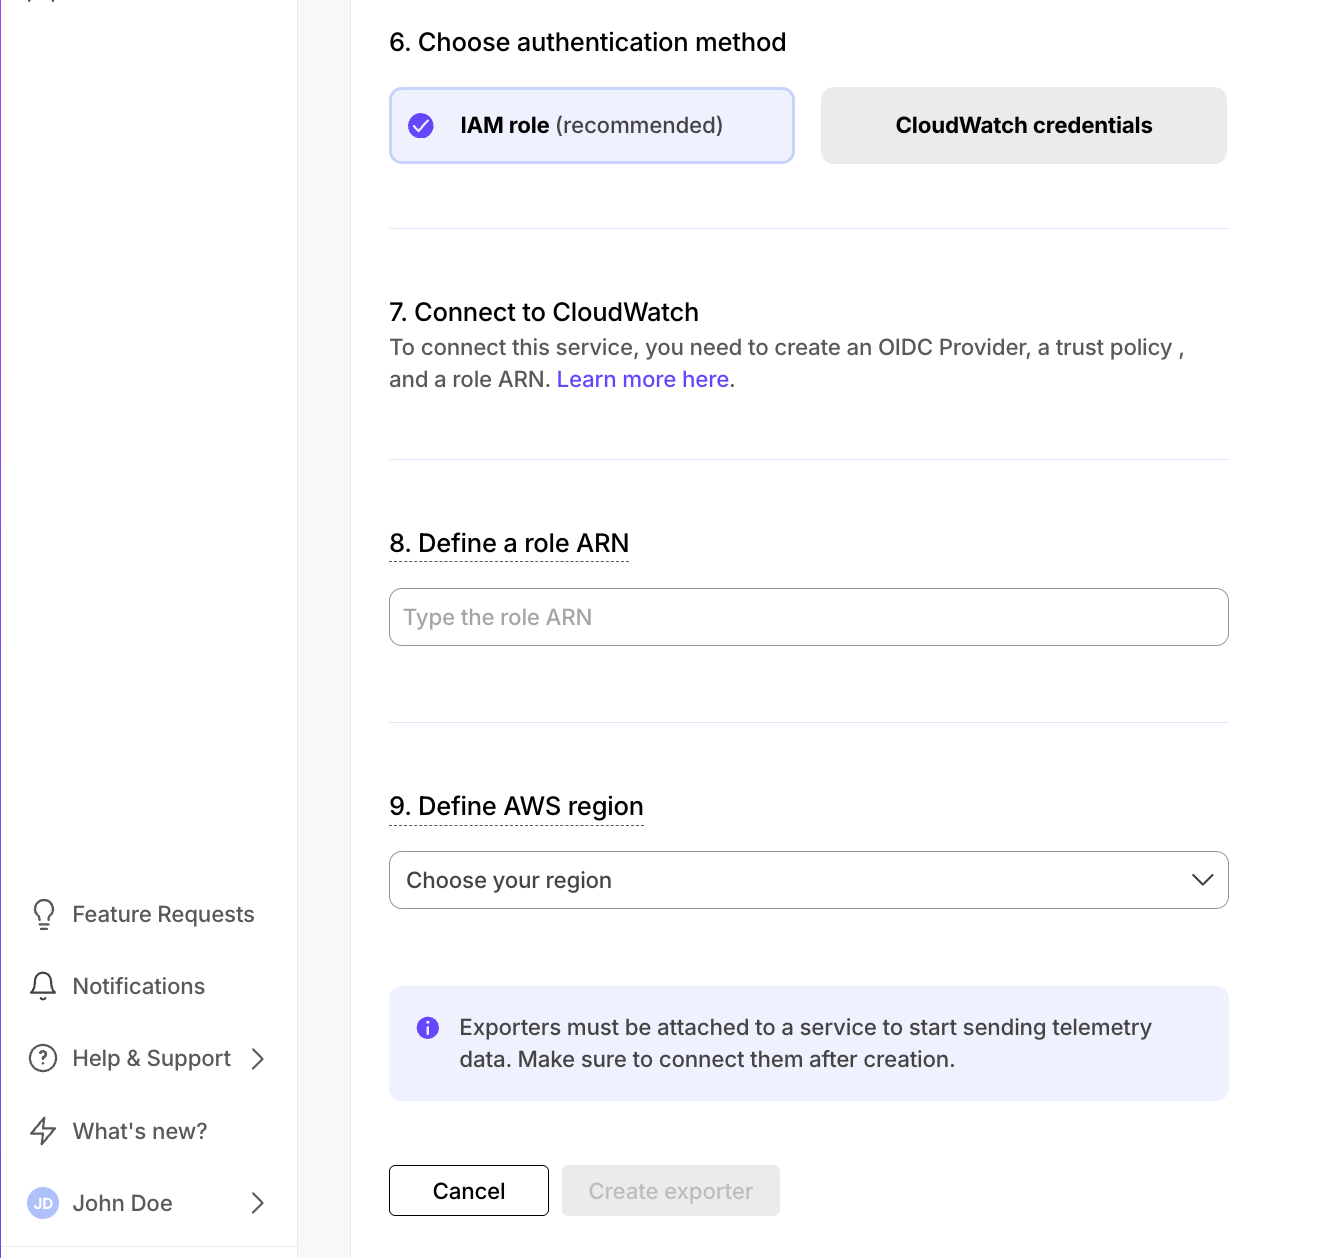
In AWS, navigate to IAM > Identity providers, then click
Add provider.Update the new identity provider with your details:
Set
Provider URLto the region where you are creating your exporter.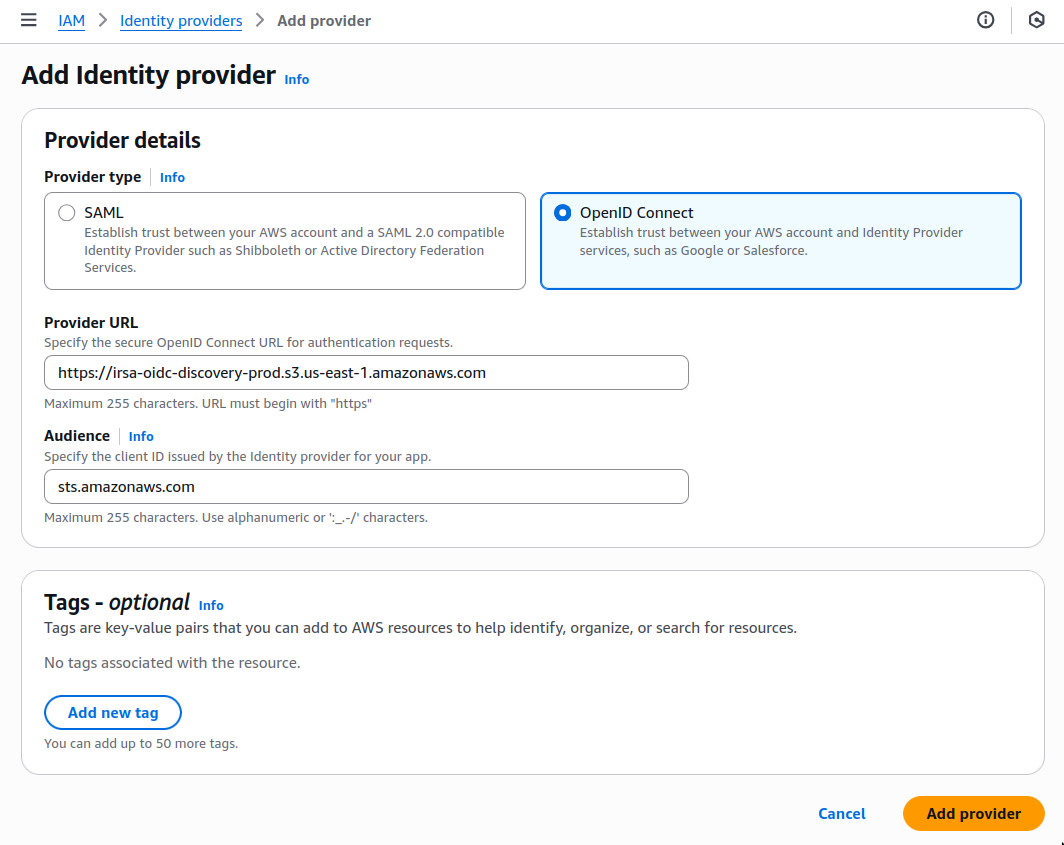
Click
Add provider.In AWS, navigate to IAM > Roles, then click
Create role.Add your identity provider as a Web identity role and click
Next.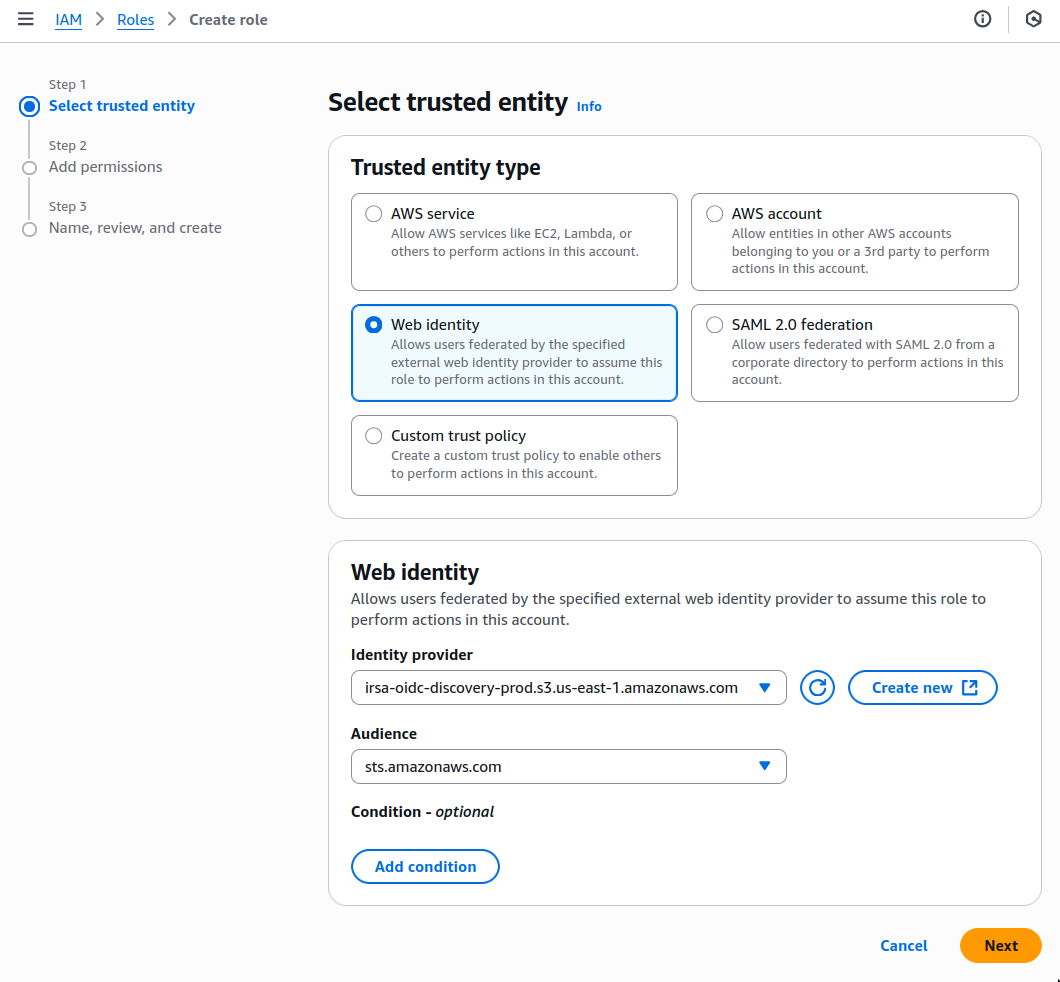
Set the following permission and trust policies:
Permission policy:
{ "Version": "2012-10-17", "Statement": [ { "Effect": "Allow", "Action": [ "logs:PutLogEvents", "logs:CreateLogGroup", "logs:CreateLogStream", "logs:DescribeLogStreams", "logs:DescribeLogGroups", "logs:PutRetentionPolicy", "xray:PutTraceSegments", "xray:PutTelemetryRecords", "xray:GetSamplingRules", "xray:GetSamplingTargets", "xray:GetSamplingStatisticSummaries", "ssm:GetParameters" ], "Resource": "*" } ] }Role with a Trust Policy:
{ "Version": "2012-10-17", "Statement": [ { "Effect": "Allow", "Principal": { "Federated": "arn:aws:iam::12345678910:oidc-provider/irsa-oidc-discovery-prod.s3.us-east-1.amazonaws.com" }, "Action": "sts:AssumeRoleWithWebIdentity", "Condition": { "StringEquals": { "irsa-oidc-discovery-prod.s3.us-east-1.amazonaws.com:aud": "sts.amazonaws.com" } } }, { "Sid": "Statement1", "Effect": "Allow", "Principal": { "AWS": "arn:aws:iam::12345678910:role/my-exporter-role" }, "Action": "sts:AssumeRole" } ] }
- Click
Add role.
When you use CloudWatch credentials, you link an Identity and Access Management (IAM) user with access to CloudWatch only with your Tiger Cloud service:
- Retrieve the user information from IAM > Users in AWS console.
If you do not have an AWS user with access restricted to CloudWatch only, create one. For more information, see Creating IAM users (console).
- Enter the credentials for the AWS IAM user.
AWS keys give access to your AWS services. To keep your AWS account secure, restrict users to the minimum required permissions. Always store your keys in a safe location. To avoid this issue, use the IAM role authentication method.
Select the AWS Region your CloudWatch services run in, then click
Create exporter.
Manage a data exporter
This section shows you how to attach, monitor, edit, and delete a data exporter.
Attach a data exporter to a Tiger Cloud service
To send telemetry data to an external monitoring tool, you attach a data exporter to your Tiger Cloud service. You can attach only one exporter to a service.
To attach an exporter:
- In Tiger Cloud Console, choose the service
- Click
Operations>Exporters - Select the exporter, then click
Attach exporter - If you are attaching a first
Logsdata type exporter, restart the service
Monitor Tiger Cloud service metrics
You can now monitor your service metrics. Use the following metrics to check the service is running correctly:
timescale.cloud.system.cpu.usage.millicorestimescale.cloud.system.cpu.total.millicorestimescale.cloud.system.memory.usage.bytestimescale.cloud.system.memory.total.bytestimescale.cloud.system.disk.usage.bytestimescale.cloud.system.disk.total.bytes
Additionally, use the following tags to filter your results.
|Tag|Example variable| Description | |-|-|----------------------------| |
host|us-east-1.timescale.cloud| | |project-id|| | |service-id|| | |region|us-east-1| AWS region | |role|replicaorprimary| For service with replicas | |node-id|| For multi-node services |Edit a data exporter
To update a data exporter:
- In Tiger Cloud Console, open Exporters
- Next to the exporter you want to edit, click the menu >
Edit - Edit the exporter fields and save your changes
You cannot change fields such as the provider or the AWS region.
Delete a data exporter
To remove a data exporter that you no longer need:
Disconnect the data exporter from your Tiger Cloud services
- In Tiger Cloud Console, choose the service.
- Click
Operations>Exporters. - Click the trash can icon.
- Repeat for every service attached to the exporter you want to remove.
The data exporter is now unattached from all services. However, it still exists in your project.
Delete the exporter on the project level
- In Tiger Cloud Console, open Exporters
- Next to the exporter you want to edit, click menu >
Delete - Confirm that you want to delete the data exporter.
Reference
When you create the IAM OIDC provider, the URL must match the region you create the exporter in. It must be one of the following:
Region Zone Location URL ap-southeast-1Asia Pacific Singapore irsa-oidc-discovery-prod-ap-southeast-1.s3.ap-southeast-1.amazonaws.comap-southeast-2Asia Pacific Sydney irsa-oidc-discovery-prod-ap-southeast-2.s3.ap-southeast-2.amazonaws.comap-northeast-1Asia Pacific Tokyo irsa-oidc-discovery-prod-ap-northeast-1.s3.ap-northeast-1.amazonaws.comca-central-1Canada Central irsa-oidc-discovery-prod-ca-central-1.s3.ca-central-1.amazonaws.comeu-central-1Europe Frankfurt irsa-oidc-discovery-prod-eu-central-1.s3.eu-central-1.amazonaws.comeu-west-1Europe Ireland irsa-oidc-discovery-prod-eu-west-1.s3.eu-west-1.amazonaws.comeu-west-2Europe London irsa-oidc-discovery-prod-eu-west-2.s3.eu-west-2.amazonaws.comsa-east-1South America São Paulo irsa-oidc-discovery-prod-sa-east-1.s3.sa-east-1.amazonaws.comus-east-1United States North Virginia irsa-oidc-discovery-prod.s3.us-east-1.amazonaws.comus-east-2United States Ohio irsa-oidc-discovery-prod-us-east-2.s3.us-east-2.amazonaws.comus-west-2United States Oregon irsa-oidc-discovery-prod-us-west-2.s3.us-west-2.amazonaws.com===== PAGE: https://docs.tigerdata.com/use-timescale/data-retention/create-a-retention-policy/ =====
Create a data retention policy
Automatically drop data once its time value ages past a certain interval. When you create a data retention policy, TimescaleDB automatically schedules a background job to drop old chunks.
Add a data retention policy
Add a data retention policy by using the
add_retention_policyfunction.Adding a data retention policy
- Choose which hypertable you want to add the policy to. Decide how long
you want to keep data before dropping it. In this example, the hypertable
named
conditionsretains the data for 24 hours. Call
add_retention_policy:SELECT add_retention_policy('conditions', INTERVAL '24 hours');
A data retention policy only allows you to drop chunks based on how far they are in the past. To drop chunks based on how far they are in the future, manually drop chunks.
Remove a data retention policy
Remove an existing data retention policy by using the
remove_retention_policyfunction. Pass it the name of the hypertable to remove the policy from.SELECT remove_retention_policy('conditions');See scheduled data retention jobs
To see your scheduled data retention jobs and their job statistics, query the
timescaledb_information.jobsandtimescaledb_information.job_statstables. For example:SELECT j.hypertable_name, j.job_id, config, schedule_interval, job_status, last_run_status, last_run_started_at, js.next_start, total_runs, total_successes, total_failures FROM timescaledb_information.jobs j JOIN timescaledb_information.job_stats js ON j.job_id = js.job_id WHERE j.proc_name = 'policy_retention';The results look like this:
-[ RECORD 1 ]-------+----------------------------------------------- hypertable_name | conditions job_id | 1000 config | {"drop_after": "5 years", "hypertable_id": 14} schedule_interval | 1 day job_status | Scheduled last_run_status | Success last_run_started_at | 2022-05-19 16:15:11.200109+00 next_start | 2022-05-20 16:15:11.243531+00 total_runs | 1 total_successes | 1 total_failures | 0===== PAGE: https://docs.tigerdata.com/use-timescale/data-retention/manually-drop-chunks/ =====
Manually drop chunks
Drop chunks manually by time value. For example, drop chunks containing data older than 30 days.
Dropping chunks manually is a one-time operation. To automatically drop chunks as they age, set up a data retention policy.
Drop chunks older than a certain date
To drop chunks older than a certain date, use the
drop_chunksfunction. Provide the name of the hypertable to drop chunks from, and a time interval beyond which to drop chunks.For example, to drop chunks with data older than 24 hours:
SELECT drop_chunks('conditions', INTERVAL '24 hours');Drop chunks between 2 dates
You can also drop chunks between 2 dates. For example, drop chunks with data between 3 and 4 months old.
Supply a second
INTERVALargument for thenewer_thancutoff:SELECT drop_chunks( 'conditions', older_than => INTERVAL '3 months', newer_than => INTERVAL '4 months' )Drop chunks in the future
You can also drop chunks in the future, for example, to correct data with the wrong timestamp. To drop all chunks that are more than 3 months in the future, from a hypertable called
conditions:SELECT drop_chunks( 'conditions', newer_than => now() + INTERVAL '3 months' );===== PAGE: https://docs.tigerdata.com/use-timescale/data-retention/data-retention-with-continuous-aggregates/ =====
About data retention with continuous aggregates
You can downsample your data by combining a data retention policy with continuous aggregates. If you set your refresh policies correctly, you can delete old data from a hypertable without deleting it from any continuous aggregates. This lets you save on raw data storage while keeping summarized data for historical analysis.
To keep your aggregates while dropping raw data, you must be careful about refreshing your aggregates. You can delete raw data from the underlying table without deleting data from continuous aggregates, so long as you don't refresh the aggregate over the deleted data. When you refresh a continuous aggregate, TimescaleDB updates the aggregate based on changes in the raw data for the refresh window. If it sees that the raw data was deleted, it also deletes the aggregate data. To prevent this, make sure that the aggregate's refresh window doesn't overlap with any deleted data. For more information, see the following example.
As an example, say that you add a continuous aggregate to a
conditionshypertable that stores device temperatures:CREATE MATERIALIZED VIEW conditions_summary_daily (day, device, temp) WITH (timescaledb.continuous) AS SELECT time_bucket('1 day', time), device, avg(temperature) FROM conditions GROUP BY (1, 2); SELECT add_continuous_aggregate_policy('conditions_summary_daily', '7 days', '1 day', '1 day');This creates a
conditions_summary_dailyaggregate which stores the daily temperature per device. The aggregate refreshes every day. Every time it refreshes, it updates with any data changes from 7 days ago to 1 day ago.You should not set a 24-hour retention policy on the
conditionshypertable. If you do, chunks older than 1 day are dropped. Then the aggregate refreshes based on data changes. Since the data change was to delete data older than 1 day, the aggregate also deletes the data. You end up with no data in theconditions_summary_dailytable.To fix this, set a longer retention policy, for example 30 days:
SELECT add_retention_policy('conditions', INTERVAL '30 days');Now, chunks older than 30 days are dropped. But when the aggregate refreshes, it doesn't look for changes older than 30 days. It only looks for changes between 7 days and 1 day ago. The raw hypertable still contains data for that time period. So your aggregate retains the data.
Data retention on a continuous aggregate itself
You can also apply data retention on a continuous aggregate itself. For example, you can keep raw data for 30 days, as mentioned earlier. Meanwhile, you can keep daily data for 600 days, and no data beyond that.
===== PAGE: https://docs.tigerdata.com/use-timescale/data-retention/about-data-retention/ =====
About data retention
In modern applications, data grows exponentially. As data gets older, it often becomes less useful in day-to-day operations. However, you still need it for analysis. TimescaleDB elegantly solves this problem with automated data retention policies.
Data retention policies delete raw old data for you on a schedule that you define. By combining retention policies with continuous aggregates, you can downsample your data and keep useful summaries of it instead. This lets you analyze historical data - while also saving on storage.
Drop data by chunk
TimescaleDB data retention works on chunks, not on rows. Deleting data row-by-row, for example, with the Postgres
DELETEcommand, can be slow. But dropping data by the chunk is faster, because it deletes an entire file from disk. It doesn't need garbage collection and defragmentation.Whether you use a policy or manually drop chunks, TimescaleDB drops data by the chunk. It only drops chunks where all the data is within the specified time range.
For example, consider the setup where you have 3 chunks containing data:
- More than 36 hours old
- Between 12 and 36 hours old
- From the last 12 hours
You manually drop chunks older than 24 hours. Only the oldest chunk is deleted. The middle chunk is retained, because it contains some data newer than 24 hours. No individual rows are deleted from that chunk.
===== PAGE: https://docs.tigerdata.com/use-timescale/continuous-aggregates/refresh-policies/ =====
Refresh continuous aggregates
Continuous aggregates can have a range of different refresh policies. In addition to refreshing the continuous aggregate automatically using a policy, you can also refresh it manually.
Prerequisites
To follow the procedure on this page you need to:
- Create a target Tiger Cloud service.
This procedure also works for self-hosted TimescaleDB.
Change the refresh policy
Continuous aggregates require a policy for automatic refreshing. You can adjust this to suit different use cases. For example, you can have the continuous aggregate and the hypertable stay in sync, even when data is removed from the hypertable. Alternatively, you could keep source data in the continuous aggregate even after it is removed from the hypertable.
You can change the way your continuous aggregate is refreshed by calling
add_continuous_aggregate_policy.Among others,
add_continuous_aggregate_policytakes the following arguments:start_offset: the start of the refresh window relative to when the policy runsend_offset: the end of the refresh window relative to when the policy runsschedule_interval: the refresh interval in minutes or hours. Defaults to 24 hours.
Note the following:
- If you set the
start_offsetorend_offsettoNULL, the range is open-ended and extends to the beginning or end of time. If you set
end_offsetwithin the current time bucket, this bucket is excluded from materialization. This is done for the following reasons:- The current bucket is incomplete and can't be refreshed.
- The current bucket gets a lot of writes in the timestamp order, and its aggregate becomes outdated very quickly. Excluding it improves performance.
To include the latest raw data in queries, enable real-time aggregation.
See the API reference for the full list of required and optional arguments and use examples.
The policy in the following example ensures that all data in the continuous aggregate is up to date with the hypertable, except for data written within the last hour of wall-clock time. The policy also does not refresh the last time bucket of the continuous aggregate.
Since the policy in this example runs once every hour (
schedule_interval) while also excluding data within the most recent hour (end_offset), it takes up to 2 hours for data written to the hypertable to be reflected in the continuous aggregate. Backfills, which are usually outside the most recent hour of data, will be visible after up to 1 hour depending on when the policy last ran when the data was written.Because it has an open-ended
start_offsetparameter, any data that is removed from the table, for example with aDELETEor withdrop_chunks, is also removed from the continuous aggregate view. This means that the continuous aggregate always reflects the data in the underlying hypertable.To changing a refresh policy to use a
NULLstart_offset:- Connect to your Tiger Cloud service
In Tiger Cloud Console open an SQL editor. You can also connect to your service using psql.
Create a new policy on
conditions_summary_hourlythat keeps the continuous aggregate up to date, and runs every hour:SELECT add_continuous_aggregate_policy('conditions_summary_hourly', start_offset => NULL, end_offset => INTERVAL '1 h', schedule_interval => INTERVAL '1 h');
If you want to keep data in the continuous aggregate even if it is removed from the underlying hypertable, you can set the
start_offsetto match the data retention policy on the source hypertable. For example, if you have a retention policy that removes data older than one month, setstart_offsetto one month or less. This sets your policy so that it does not refresh the dropped data.- Connect to your Tiger Cloud service.
In Tiger Cloud Console open an SQL editor. You can also connect to your service using psql.
Create a new policy on
conditions_summary_hourlythat keeps data removed from the hypertable in the continuous aggregate, and runs every hour:SELECT add_continuous_aggregate_policy('conditions_summary_hourly', start_offset => INTERVAL '1 month', end_offset => INTERVAL '1 h', schedule_interval => INTERVAL '1 h');
It is important to consider your data retention policies when you're setting up continuous aggregate policies. If the continuous aggregate policy window covers data that is removed by the data retention policy, the data will be removed when the aggregates for those buckets are refreshed. For example, if you have a data retention policy that removes all data older than two weeks, the continuous aggregate policy will only have data for the last two weeks.
Add concurrent refresh policies
You can add concurrent refresh policies on each continuous aggregate, as long as their start and end offsets don't overlap. For example, to backfill data into older chunks you set up one policy that refreshes recent data, and another that refreshes backfilled data.
The first policy in this example is keeps the continuous aggregate up to date with data that was inserted in the past day. Any data that was inserted or updated for previous days is refreshed by the second policy.
- Connect to your Tiger Cloud service.
In Tiger Cloud Console open an SQL editor. You can also connect to your service using psql.
Create a new policy on
conditions_summary_dailyto refresh the continuous aggregate with recently inserted data which runs hourly:SELECT add_continuous_aggregate_policy('conditions_summary_daily', start_offset => INTERVAL '1 day', end_offset => INTERVAL '1 h', schedule_interval => INTERVAL '1 h');At the
psqlprompt, create a concurrent policy onconditions_summary_dailyto refresh the continuous aggregate with backfilled data:SELECT add_continuous_aggregate_policy('conditions_summary_daily', start_offset => NULL end_offset => INTERVAL '1 day', schedule_interval => INTERVAL '1 hour');
Manually refresh a continuous aggregate
If you need to manually refresh a continuous aggregate, you can use the
refreshcommand. This recomputes the data within the window that has changed in the underlying hypertable since the last refresh. Therefore, if only a few buckets need updating, the refresh runs quickly.If you have recently dropped data from a hypertable with a continuous aggregate, calling
refresh_continuous_aggregateon a region containing dropped chunks recalculates the aggregate without the dropped data. See drop data for more information.The
refreshcommand takes three arguments:- The name of the continuous aggregate view to refresh
- The timestamp of the beginning of the refresh window
- The timestamp of the end of the refresh window
Only buckets that are wholly within the specified range are refreshed. For example, if you specify
2021-05-01', '2021-06-01the only buckets that are refreshed are those up to but not including 2021-06-01. It is possible to specifyNULLin a manual refresh to get an open-ended range, but we do not recommend using it, because you could inadvertently materialize a large amount of data, slow down your performance, and have unintended consequences on other policies like data retention.To manually refresh a continuous aggregate, use the
refreshcommand:CALL refresh_continuous_aggregate('example', '2021-05-01', '2021-06-01');Follow the logic used by automated refresh policies and avoid refreshing time buckets that are likely to have a lot of writes. This means that you should generally not refresh the latest incomplete time bucket. To include the latest raw data in your queries, use real-time aggregation instead.
===== PAGE: https://docs.tigerdata.com/use-timescale/continuous-aggregates/drop-data/ =====
Dropping data
When you are working with continuous aggregates, you can drop a view, or you can drop raw data from the underlying hypertable or from the continuous aggregate itself. A combination of refresh and data retention policies can help you downsample your data. This lets you keep historical data at a lower granularity than recent data.
However, you should be aware if a retention policy is likely to drop raw data from your hypertable that you need in your continuous aggregate.
To simplify the process of setting up downsampling, you can use the visualizer and code generator.
Drop a continuous aggregate view
You can drop a continuous aggregate view using the
DROP MATERIALIZED VIEWcommand. This command also removes refresh policies defined on the continuous aggregate. It does not drop the data from the underlying hypertable.Dropping a continuous aggregate view
From the
psqlprompt, drop the view:DROP MATERIALIZED VIEW view_name;
Drop raw data from a hypertable
If you drop data from a hypertable used in a continuous aggregate it can lead to problems with your continuous aggregate view. In many cases, dropping underlying data replaces the aggregate with NULL values, which can lead to unexpected results in your view.
You can drop data from a hypertable using
drop_chunksin the usual way, but before you do so, always check that the chunk is not within the refresh window of a continuous aggregate that still needs the data. This is also important if you are manually refreshing a continuous aggregate. Callingrefresh_continuous_aggregateon a region containing dropped chunks recalculates the aggregate without the dropped data.If a continuous aggregate is refreshing when data is dropped because of a retention policy, the aggregate is updated to reflect the loss of data. If you need to retain the continuous aggregate after dropping the underlying data, set the
start_offsetvalue of the aggregate policy to a smaller interval than thedrop_afterparameter of the retention policy.For more information, see the [data retention documentation][data-retention-with-continuous-aggregates].
PolicyVisualizerDownsampling
Refer to the installation documentation for detailed setup instructions.
[data-retention-with-continuous-aggregates]:
/use-timescale/:currentVersion:/data-retention/data-retention-with-continuous-aggregates===== PAGE: https://docs.tigerdata.com/use-timescale/continuous-aggregates/migrate/ =====
Migrate a continuous aggregate to the new form
In TimescaleDB v2.7 and later, continuous aggregates use a new format that improves performance and makes them compatible with more SQL queries. Continuous aggregates created in older versions of TimescaleDB, or created in a new version with the option
timescaledb.finalizedset tofalse, use the old format.To migrate a continuous aggregate from the old format to the new format, you can use this procedure. It automatically copies over your data and policies. You can continue to use the continuous aggregate while the migration is happening.
Connect to your database and run:
CALL cagg_migrate('<CONTINUOUS_AGGREGATE_NAME>');There are known issues with
cagg_migrate()in version 2.8.0. Upgrade to version 2.8.1 or later before using it.Configure continuous aggregate migration
The migration procedure provides two boolean configuration parameters,
overrideanddrop_old. By default, the name of your new continuous aggregate is the name of your old continuous aggregate, with the suffix_new.Set
overrideto true to rename your new continuous aggregate with the original name. The old continuous aggregate is renamed with the suffix_old.To both rename and drop the old continuous aggregate entirely, set both parameters to true. Note that
drop_oldmust be used together withoverride.Check on continuous aggregate migration status
To check the progress of the continuous aggregate migration, query the migration planning table:
SELECT * FROM _timescaledb_catalog.continuous_agg_migrate_plan_step;Troubleshooting
Permissions error when migrating a continuous aggregate
You might get a permissions error when migrating a continuous aggregate from old to new format using
cagg_migrate. The user performing the migration must have the following permissions:- Select, insert, and update permissions on the tables
_timescale_catalog.continuous_agg_migrate_planand_timescale_catalog.continuous_agg_migrate_plan_step - Usage permissions on the sequence
_timescaledb_catalog.continuous_agg_migrate_plan_step_step_id_seq
To solve the problem, change to a user capable of granting permissions, and grant the following permissions to the user performing the migration:
GRANT SELECT, INSERT, UPDATE ON TABLE _timescaledb_catalog.continuous_agg_migrate_plan TO <USER>; GRANT SELECT, INSERT, UPDATE ON TABLE _timescaledb_catalog.continuous_agg_migrate_plan_step TO <USER>; GRANT USAGE ON SEQUENCE _timescaledb_catalog.continuous_agg_migrate_plan_step_step_id_seq TO <USER>;===== PAGE: https://docs.tigerdata.com/use-timescale/continuous-aggregates/compression-on-continuous-aggregates/ =====
Compress continuous aggregates
To save on storage costs, you use hypercore to downsample historical data stored in continuous aggregates. After you enable columnstore on a
MATERIALIZED VIEW, you set a columnstore policy. This policy defines the intervals when chunks in a continuous aggregate are compressed as they are converted from the rowstore to the columnstore.Columnstore works in the same way on hypertables and continuous aggregates. When you enable columnstore with no other options, your data is segmented by the
groupbycolumns in the continuous aggregate, and ordered by the time column. Real-time aggregation is disabled by default.Since TimescaleDB v2.20.0 For the old API, see Compress continuous aggregates.
Configure columnstore on continuous aggregates
For an existing continuous aggregate:
- Enable columnstore on a continuous aggregate
To enable the columnstore compression on a continuous aggregate, set
timescaledb.enable_columnstore = truewhen you alter the view:ALTER MATERIALIZED VIEW <cagg_name> set (timescaledb.enable_columnstore = true);To disable the columnstore compression, set
timescaledb.enable_columnstore = false:- Set columnstore policies on the continuous aggregate
Before you set up a columnstore policy on a continuous aggregate, you first set the refresh policy. To prevent refresh policies from failing, you set the columnstore policy interval so that actively refreshed regions are not compressed. For example:
Set the refresh policy
SELECT add_continuous_aggregate_policy('<cagg_name>', start_offset => INTERVAL '30 days', end_offset => INTERVAL '1 day', schedule_interval => INTERVAL '1 hour');Set the columnstore policy
For this refresh policy, the
afterparameter must be greater than the value ofstart_offsetin the refresh policy:CALL add_columnstore_policy('<cagg_name>', after => INTERVAL '45 days');
===== PAGE: https://docs.tigerdata.com/use-timescale/continuous-aggregates/create-index/ =====
Create an index on a continuous aggregate
By default, some indexes are automatically created when you create a continuous aggregate. You can change this behavior. You can also manually create and drop indexes.
Automatically created indexes
When you create a continuous aggregate, an index is automatically created for each
GROUP BYcolumn. The index is a composite index, combining theGROUP BYcolumn with thetime_bucketcolumn.For example, if you define a continuous aggregate view with
GROUP BY device, location, bucket, two composite indexes are created: one on{device, bucket}and one on{location, bucket}.Turn off automatic index creation
To turn off automatic index creation, set
timescaledb.create_group_indexestofalsewhen you create the continuous aggregate.For example:
CREATE MATERIALIZED VIEW conditions_daily WITH (timescaledb.continuous, timescaledb.create_group_indexes=false) AS ...Manually create and drop indexes
You can use a regular Postgres statement to create or drop an index on a continuous aggregate.
For example, to create an index on
avg_tempfor a materialized hypertable namedweather_daily:CREATE INDEX avg_temp_idx ON weather_daily (avg_temp);Indexes are created under the
_timescaledb_internalschema, where the continuous aggregate data is stored. To drop the index, specify the schema. For example, to drop the indexavg_temp_idx, run:DROP INDEX _timescaledb_internal.avg_temp_idxLimitations on created indexes
In TimescaleDB v2.7 and later, you can create an index on any column in the materialized view. This includes aggregated columns, such as those storing sums and averages. In earlier versions of TimescaleDB, you can't create an index on an aggregated column.
You can't create unique indexes on a continuous aggregate, in any of the TimescaleDB versions.
===== PAGE: https://docs.tigerdata.com/use-timescale/continuous-aggregates/about-continuous-aggregates/ =====
About continuous aggregates
In modern applications, data usually grows very quickly. This means that aggregating it into useful summaries can become very slow. If you are collecting data very frequently, you might want to aggregate your data into minutes or hours instead. For example, if an IoT device takes temperature readings every second, you might want to find the average temperature for each hour. Every time you run this query, the database needs to scan the entire table and recalculate the average. TimescaleDB makes aggregating data lightning fast, accurate, and easy with continuous aggregates.
Continuous aggregates in TimescaleDB are a kind of hypertable that is refreshed automatically in the background as new data is added, or old data is modified. Changes to your dataset are tracked, and the hypertable behind the continuous aggregate is automatically updated in the background.
Continuous aggregates have a much lower maintenance burden than regular Postgres materialized views, because the whole view is not created from scratch on each refresh. This means that you can get on with working your data instead of maintaining your database.
Because continuous aggregates are based on hypertables, you can query them in exactly the same way as your other tables. This includes continuous aggregates in the rowstore, compressed into the columnstore, or tiered to object storage. You can even create continuous aggregates on top of your continuous aggregates, for an even more fine-tuned aggregation.
Real-time aggregation enables you to combine pre-aggregated data from the materialized view with the most recent raw data. This gives you up-to-date results on every query. In TimescaleDB v2.13 and later, real-time aggregates are DISABLED by default. In earlier versions, real-time aggregates are ENABLED by default; when you create a continuous aggregate, queries to that view include the results from the most recent raw data.
Types of aggregation
There are three main ways to make aggregation easier: materialized views, continuous aggregates, and real-time aggregates.
Materialized views are a standard Postgres function. They are used to cache the result of a complex query so that you can reuse it later on. Materialized views do not update regularly, although you can manually refresh them as required.
Continuous aggregates are a TimescaleDB-only feature. They work in a similar way to a materialized view, but they are updated automatically in the background, as new data is added to your database. Continuous aggregates are updated continuously and incrementally, which means they are less resource intensive to maintain than materialized views. Continuous aggregates are based on hypertables, and you can query them in the same way as you do your other tables.
Real-time aggregates are a TimescaleDB-only feature. They are the same as continuous aggregates, but they add the most recent raw data to the previously aggregated data to provide accurate and up-to-date results, without needing to aggregate data as it is being written.
Continuous aggregates on continuous aggregates
You can create a continuous aggregate on top of another continuous aggregate. This allows you to summarize data at different granularity. For example, you might have a raw hypertable that contains second-by-second data. Create a continuous aggregate on the hypertable to calculate hourly data. To calculate daily data, create a continuous aggregate on top of your hourly continuous aggregate.
For more information, see the documentation about continuous aggregates on continuous aggregates.
Continuous aggregates with a
JOINclauseContinuous aggregates support the following JOIN features:
| Feature | TimescaleDB < 2.10.x | TimescaleDB <= 2.15.x | TimescaleDB >= 2.16.x| |-|-|-|-| |INNER JOIN|❌|✅|✅| |LEFT JOIN|❌|❌|✅| |LATERAL JOIN|❌|❌|✅| |Joins between ONE hypertable and ONE standard Postgres table|❌|✅|✅| |Joins between ONE hypertable and MANY standard Postgres tables|❌|❌|✅| |Join conditions must be equality conditions, and there can only be ONE
JOINcondition|❌|✅|✅| |Any join conditions|❌|❌|✅|JOINS in TimescaleDB must meet the following conditions:
- Only the changes to the hypertable are tracked, and they are updated in the continuous aggregate when it is refreshed. Changes to standard Postgres table are not tracked.
- You can use an
INNER,LEFT, andLATERALjoins; no other join type is supported. - Joins on the materialized hypertable of a continuous aggregate are not supported.
- Hierarchical continuous aggregates can be created on top of a continuous
aggregate with a
JOINclause, but cannot themselves have aJOINclause.
JOIN examples
Given the following schema:
CREATE TABLE locations ( id TEXT PRIMARY KEY, name TEXT ); CREATE TABLE devices ( id SERIAL PRIMARY KEY, location_id TEXT, name TEXT ); CREATE TABLE conditions ( "time" TIMESTAMPTZ, device_id INTEGER, temperature FLOAT8 ) WITH ( tsdb.hypertable, tsdb.partition_column='time' );See the following
JOINexamples on continuous aggregates:INNER JOINon a single equality condition, using theONclause:CREATE MATERIALIZED VIEW conditions_by_day WITH (timescaledb.continuous) AS SELECT time_bucket('1 day', time) AS bucket, devices.name, MIN(temperature), MAX(temperature) FROM conditions JOIN devices ON devices.id = conditions.device_id GROUP BY bucket, devices.name WITH NO DATA;INNER JOINon a single equality condition, using theONclause, with a further condition added in theWHEREclause:CREATE MATERIALIZED VIEW conditions_by_day WITH (timescaledb.continuous) AS SELECT time_bucket('1 day', time) AS bucket, devices.name, MIN(temperature), MAX(temperature) FROM conditions JOIN devices ON devices.id = conditions.device_id WHERE devices.location_id = 'location123' GROUP BY bucket, devices.name WITH NO DATA;INNER JOINon a single equality condition specified inWHEREclause:CREATE MATERIALIZED VIEW conditions_by_day WITH (timescaledb.continuous) AS SELECT time_bucket('1 day', time) AS bucket, devices.name, MIN(temperature), MAX(temperature) FROM conditions, devices WHERE devices.id = conditions.device_id GROUP BY bucket, devices.name WITH NO DATA;INNER JOINon multiple equality conditions:CREATE MATERIALIZED VIEW conditions_by_day WITH (timescaledb.continuous) AS SELECT time_bucket('1 day', time) AS bucket, devices.name, MIN(temperature), MAX(temperature) FROM conditions JOIN devices ON devices.id = conditions.device_id AND devices.location_id = 'location123' GROUP BY bucket, devices.name WITH NO DATA;
TimescaleDB v2.16.x and higher.
INNER JOINwith a single equality condition specified inWHEREclause can be combined with further conditions in theWHEREclause:CREATE MATERIALIZED VIEW conditions_by_day WITH (timescaledb.continuous) AS SELECT time_bucket('1 day', time) AS bucket, devices.name, MIN(temperature), MAX(temperature) FROM conditions, devices WHERE devices.id = conditions.device_id AND devices.location_id = 'location123' GROUP BY bucket, devices.name WITH NO DATA;TimescaleDB v2.16.x and higher.
INNER JOINbetween a hypertable and multiple Postgres tables:CREATE MATERIALIZED VIEW conditions_by_day WITH (timescaledb.continuous) AS SELECT time_bucket('1 day', time) AS bucket, devices.name AS device, locations.name AS location, MIN(temperature), MAX(temperature) FROM conditions JOIN devices ON devices.id = conditions.device_id JOIN locations ON locations.id = devices.location_id GROUP BY bucket, devices.name, locations.name WITH NO DATA;
TimescaleDB v2.16.x and higher.
LEFT JOINbetween a hypertable and a Postgres table:CREATE MATERIALIZED VIEW conditions_by_day WITH (timescaledb.continuous) AS SELECT time_bucket('1 day', time) AS bucket, devices.name, MIN(temperature), MAX(temperature) FROM conditions LEFT JOIN devices ON devices.id = conditions.device_id GROUP BY bucket, devices.name WITH NO DATA;TimescaleDB v2.16.x and higher.
LATERAL JOINbetween a hypertable and a subquery:CREATE MATERIALIZED VIEW conditions_by_day WITH (timescaledb.continuous) AS SELECT time_bucket('1 day', time) AS bucket, devices.name, MIN(temperature), MAX(temperature) FROM conditions, LATERAL (SELECT * FROM devices WHERE devices.id = conditions.device_id) AS devices GROUP BY bucket, devices.name WITH NO DATA;
TimescaleDB v2.16.x and higher.
Function support
In TimescaleDB v2.7 and later, continuous aggregates support all Postgres aggregate functions. This includes both parallelizable aggregates, such as
SUMandAVG, and non-parallelizable aggregates, such asRANK.In TimescaleDB v2.10.0 and later, the
FROMclause supportsJOINS, with some restrictions. For more information, see theJOINsupport section.In older versions of TimescaleDB, continuous aggregates only support aggregate functions that can be parallelized by Postgres. You can work around this by aggregating the other parts of your query in the continuous aggregate, then using the window function to query the aggregate.
The following table summarizes the aggregate functions supported in continuous aggregates:
| Function, clause, or feature |TimescaleDB 2.6 and earlier|TimescaleDB 2.7, 2.8, and 2.9|TimescaleDB 2.10 and later| |------------------------------------------------------------|-|-|-| | Parallelizable aggregate functions |✅|✅|✅| | Non-parallelizable SQL aggregates |❌|✅|✅| |
ORDER BY|❌|✅|✅| | Ordered-set aggregates |❌|✅|✅| | Hypothetical-set aggregates |❌|✅|✅| |DISTINCTin aggregate functions |❌|✅|✅| |FILTERin aggregate functions |❌|✅|✅| |FROMclause supportsJOINS|❌|❌|✅|DISTINCT works in aggregate functions, not in the query definition. For example, for the table:
CREATE TABLE public.candle( symbol_id uuid NOT NULL, symbol text NOT NULL, "time" timestamp with time zone NOT NULL, open double precision NOT NULL, high double precision NOT NULL, low double precision NOT NULL, close double precision NOT NULL, volume double precision NOT NULL );The following works:
CREATE MATERIALIZED VIEW candles_start_end WITH (timescaledb.continuous) AS SELECT time_bucket('1 hour', "time"), COUNT(DISTINCT symbol), first(time, time) as first_candle, last(time, time) as last_candle FROM candle GROUP BY 1;This does not:
CREATE MATERIALIZED VIEW candles_start_end WITH (timescaledb.continuous) AS SELECT DISTINCT ON (symbol) symbol,symbol_id, first(time, time) as first_candle, last(time, time) as last_candle FROM candle GROUP BY symbol_id;
If you want the old behavior in later versions of TimescaleDB, set the
timescaledb.finalizedparameter tofalsewhen you create your continuous aggregate.Components of a continuous aggregate
Continuous aggregates consist of:
- Materialization hypertable to store the aggregated data in
- Materialization engine to aggregate data from the raw, underlying, table to the materialization hypertable
- Invalidation engine to determine when data needs to be re-materialized, due to changes in the data
- Query engine to access the aggregated data
Materialization hypertable
Continuous aggregates take raw data from the original hypertable, aggregate it, and store the aggregated data in a materialization hypertable. When you query the continuous aggregate view, the aggregated data is returned to you as needed.
Using the same temperature example, the materialization table looks like this:
|day|location|chunk|avg temperature| |-|-|-|-| |2021/01/01|New York|1|73| |2021/01/01|Stockholm|1|70| |2021/01/02|New York|2|| |2021/01/02|Stockholm|2|69|
The materialization table is stored as a TimescaleDB hypertable, to take advantage of the scaling and query optimizations that hypertables offer. Materialization tables contain a column for each group-by clause in the query, and an
aggregatecolumn for each aggregate in the query.For more information, see materialization hypertables.
Materialization engine
The materialization engine performs two transactions. The first transaction blocks all INSERTs, UPDATEs, and DELETEs, determines the time range to materialize, and updates the invalidation threshold. The second transaction unblocks other transactions, and materializes the aggregates. The first transaction is very quick, and most of the work happens during the second transaction, to ensure that the work does not interfere with other operations.
Invalidation engine
Any change to the data in a hypertable could potentially invalidate some materialized rows. The invalidation engine checks to ensure that the system does not become swamped with invalidations.
Fortunately, time-series data means that nearly all INSERTs and UPDATEs have a recent timestamp, so the invalidation engine does not materialize all the data, but to a set point in time called the materialization threshold. This threshold is set so that the vast majority of INSERTs contain more recent timestamps. These data points have never been materialized by the continuous aggregate, so there is no additional work needed to notify the continuous aggregate that they have been added. When the materializer next runs, it is responsible for determining how much new data can be materialized without invalidating the continuous aggregate. It then materializes the more recent data and moves the materialization threshold forward in time. This ensures that the threshold lags behind the point-in-time where data changes are common, and that most INSERTs do not require any extra writes.
When data older than the invalidation threshold is changed, the maximum and minimum timestamps of the changed rows is logged, and the values are used to determine which rows in the aggregation table need to be recalculated. This logging does cause some write load, but because the threshold lags behind the area of data that is currently changing, the writes are small and rare.
===== PAGE: https://docs.tigerdata.com/use-timescale/continuous-aggregates/time/ =====
Time and continuous aggregates
Functions that depend on a local timezone setting inside a continuous aggregate are not supported. You cannot adjust to a local time because the timezone setting changes from user to user.
To manage this, you can use explicit timezones in the view definition. Alternatively, you can create your own custom aggregation scheme for tables that use an integer time column.
Declare an explicit timezone
The most common method of working with timezones is to declare an explicit timezone in the view query.
At the
psqlprompt, create the view and declare the timezone:CREATE MATERIALIZED VIEW device_summary WITH (timescaledb.continuous) AS SELECT time_bucket('1 hour', observation_time) AS bucket, min(observation_time AT TIME ZONE 'EST') AS min_time, device_id, avg(metric) AS metric_avg, max(metric) - min(metric) AS metric_spread FROM device_readings GROUP BY bucket, device_id;Alternatively, you can cast to a timestamp after the view using
SELECT:SELECT min_time::timestamp FROM device_summary;
Integer-based time
Date and time is usually expressed as year-month-day and hours:minutes:seconds. Most TimescaleDB databases use a date/time-type column to express the date and time. However, in some cases, you might need to convert these common time and date formats to a format that uses an integer. The most common integer time is Unix epoch time, which is the number of seconds since the Unix epoch of 1970-01-01, but other types of integer-based time formats are possible.
These examples use a hypertable called
devicesthat contains CPU and disk usage information. The devices measure time using the Unix epoch.To create a hypertable that uses an integer-based column as time, you need to provide the chunk time interval. In this case, each chunk is 10 minutes.
At the
psqlprompt, create a hypertable and define the integer-based time column and chunk time interval:CREATE TABLE devices( time BIGINT, -- Time in minutes since epoch cpu_usage INTEGER, -- Total CPU usage disk_usage INTEGER, -- Total disk usage PRIMARY KEY (time) ) WITH ( tsdb.hypertable, tsdb.partition_column='time', tsdb.chunk_interval='10' );If you are self-hosting TimescaleDB v2.19.3 and below, create a Postgres relational table, then convert it using create_hypertable. You then enable hypercore with a call to ALTER TABLE.
To define a continuous aggregate on a hypertable that uses integer-based time, you need to have a function to get the current time in the correct format, and set it for the hypertable. You can do this with the
set_integer_now_funcfunction. It can be defined as a regular Postgres function, but needs to beSTABLE, take no arguments, and return an integer value of the same type as the time column in the table. When you have set up the time-handling, you can create the continuous aggregate.At the
psqlprompt, set up a function to convert the time to the Unix epoch:CREATE FUNCTION current_epoch() RETURNS BIGINT LANGUAGE SQL STABLE AS $$ SELECT EXTRACT(EPOCH FROM CURRENT_TIMESTAMP)::bigint;$$; SELECT set_integer_now_func('devices', 'current_epoch');Create the continuous aggregate for the
devicestable:CREATE MATERIALIZED VIEW devices_summary WITH (timescaledb.continuous) AS SELECT time_bucket('500', time) AS bucket, avg(cpu_usage) AS avg_cpu, avg(disk_usage) AS avg_disk FROM devices GROUP BY bucket;Insert some rows into the table:
CREATE EXTENSION tablefunc; INSERT INTO devices(time, cpu_usage, disk_usage) SELECT time, normal_rand(1,70,10) AS cpu_usage, normal_rand(1,2,1) * (row_number() over()) AS disk_usage FROM generate_series(1,10000) AS time;This command uses the
tablefuncextension to generate a normal distribution, and uses therow_numberfunction to turn it into a cumulative sequence.Check that the view contains the correct data:
postgres=# SELECT * FROM devices_summary ORDER BY bucket LIMIT 10; bucket | avg_cpu | avg_disk --------+---------------------+---------------------- 0 | 63.0000000000000000 | 6.0000000000000000 5 | 69.8000000000000000 | 9.6000000000000000 10 | 70.8000000000000000 | 24.0000000000000000 15 | 75.8000000000000000 | 37.6000000000000000 20 | 71.6000000000000000 | 26.8000000000000000 25 | 67.6000000000000000 | 56.0000000000000000 30 | 68.8000000000000000 | 90.2000000000000000 35 | 71.6000000000000000 | 88.8000000000000000 40 | 66.4000000000000000 | 81.2000000000000000 45 | 68.2000000000000000 | 106.0000000000000000 (10 rows)
===== PAGE: https://docs.tigerdata.com/use-timescale/continuous-aggregates/materialized-hypertables/ =====
Materialized hypertables
Continuous aggregates take raw data from the original hypertable, aggregate it, and store the aggregated data in a materialization hypertable. You can modify this materialized hypertable in the same way as any other hypertable.
Discover the name of a materialized hypertable
To change a materialized hypertable, you need to use its fully qualified name. To find the correct name, use the timescaledb_information.continuous_aggregates view). You can then use the name to modify it in the same way as any other hypertable.
Discovering the name of a materialized hypertable
At the
psqlprompt, querytimescaledb_information.continuous_aggregates:SELECT view_name, format('%I.%I', materialization_hypertable_schema, materialization_hypertable_name) AS materialization_hypertable FROM timescaledb_information.continuous_aggregates;Locate the name of the hypertable you want to adjust in the results of the query. The results look like this:
view_name | materialization_hypertable ---------------------------+--------------------------------------------------- conditions_summary_hourly | _timescaledb_internal._materialized_hypertable_30 conditions_summary_daily | _timescaledb_internal._materialized_hypertable_31 (2 rows)
===== PAGE: https://docs.tigerdata.com/use-timescale/continuous-aggregates/real-time-aggregates/ =====
Real-time aggregates
Rapidly growing data means you need more control over what to aggregate and how to aggregate it. With this in mind, Tiger Data equips you with tools for more fine-tuned data analysis.
By default, continuous aggregates do not include the most recent data chunk from the underlying hypertable. Real-time aggregates, however, use the aggregated data and add the most recent raw data to it. This provides accurate and up-to-date results, without needing to aggregate data as it is being written.
In TimescaleDB v2.13 and later, real-time aggregates are DISABLED by default. In earlier versions, real-time aggregates are ENABLED by default; when you create a continuous aggregate, queries to that view include the results from the most recent raw data.
For more detail on the comparison between continuous and real-time aggregates, see our real-time aggregate blog post.
Use real-time aggregates
You can enable and disable real-time aggregation by setting the
materialized_onlyparameter when you create or alter the view.Enable real-time aggregation for an existing continuous aggregate:
ALTER MATERIALIZED VIEW table_name set (timescaledb.materialized_only = false);Disable real-time aggregation:
ALTER MATERIALIZED VIEW table_name set (timescaledb.materialized_only = true);
Real-time aggregates and refreshing historical data
Real-time aggregates automatically add the most recent data when you query your continuous aggregate. In other words, they include data more recent than your last materialized bucket.
If you add new historical data to an already-materialized bucket, it won't be reflected in a real-time aggregate. You should wait for the next scheduled refresh, or manually refresh by calling
refresh_continuous_aggregate. You can think of real-time aggregates as being eventually consistent for historical data.For more information, see the troubleshooting section.
===== PAGE: https://docs.tigerdata.com/use-timescale/continuous-aggregates/create-a-continuous-aggregate/ =====
Create a continuous aggregate
Creating a continuous aggregate is a two-step process. You need to create the view first, then enable a policy to keep the view refreshed. You can create the view on a hypertable, or on top of another continuous aggregate. You can have more than one continuous aggregate on each source table or view.
Continuous aggregates require a
time_bucketon the time partitioning column of the hypertable.By default, views are automatically refreshed. You can adjust this by setting the WITH NO DATA option. Additionally, the view can not be a security barrier view.
Continuous aggregates use hypertables in the background, which means that they also use chunk time intervals. By default, the continuous aggregate's chunk time interval is 10 times what the original hypertable's chunk time interval is. For example, if the original hypertable's chunk time interval is 7 days, the continuous aggregates that are on top of it have a 70 day chunk time interval.
Create a continuous aggregate
In this example, we are using a hypertable called
conditions, and creating a continuous aggregate view for daily weather data. TheGROUP BYclause must include atime_bucketexpression which uses time dimension column of the hypertable. Additionally, all functions and their arguments included inSELECT,GROUP BY, andHAVINGclauses must be immutable.Creating a continuous aggregate
At the
psqlprompt, create the materialized view:CREATE MATERIALIZED VIEW conditions_summary_daily WITH (timescaledb.continuous) AS SELECT device, time_bucket(INTERVAL '1 day', time) AS bucket, AVG(temperature), MAX(temperature), MIN(temperature) FROM conditions GROUP BY device, bucket;To create a continuous aggregate within a transaction block, use the WITH NO DATA option.
To improve continuous aggregate performance, set
timescaledb.invalidate_using = 'wal'Since TimescaleDB v2.22.0.Create a policy to refresh the view every hour:
SELECT add_continuous_aggregate_policy('conditions_summary_daily', start_offset => INTERVAL '1 month', end_offset => INTERVAL '1 day', schedule_interval => INTERVAL '1 hour');
You can use most Postgres aggregate functions in continuous aggregations. To see what Postgres features are supported, check the function support table.
Choosing an appropriate bucket interval
Continuous aggregates require a
time_bucketon the time partitioning column of the hypertable. The time bucket allows you to define a time interval, instead of having to use specific timestamps. For example, you can define a time bucket as five minutes, or one day.You can't use time_bucket_gapfill directly in a continuous aggregate. This is because you need access to previous data to determine the gapfill content, which isn't yet available when you create the continuous aggregate. You can work around this by creating the continuous aggregate using
time_bucket, then querying the continuous aggregate usingtime_bucket_gapfill.Using the WITH NO DATA option
By default, when you create a view for the first time, it is populated with data. This is so that the aggregates can be computed across the entire hypertable. If you don't want this to happen, for example if the table is very large, or if new data is being continuously added, you can control the order in which the data is refreshed. You can do this by adding a manual refresh with your continuous aggregate policy using the
WITH NO DATAoption.The
WITH NO DATAoption allows the continuous aggregate to be created instantly, so you don't have to wait for the data to be aggregated. Data begins to populate only when the policy begins to run. This means that only data newer than thestart_offsettime begins to populate the continuous aggregate. If you have historical data that is older than thestart_offsetinterval, you need to manually refresh the history up to the currentstart_offsetto allow real-time queries to run efficiently.Creating a continuous aggregate with the WITH NO DATA option
At the
psqlprompt, create the view:CREATE MATERIALIZED VIEW cagg_rides_view WITH (timescaledb.continuous) AS SELECT vendor_id, time_bucket('1h', pickup_datetime) AS hour, count(*) total_rides, avg(fare_amount) avg_fare, max(trip_distance) as max_trip_distance, min(trip_distance) as min_trip_distance FROM rides GROUP BY vendor_id, time_bucket('1h', pickup_datetime) WITH NO DATA;Manually refresh the view:
CALL refresh_continuous_aggregate('cagg_rides_view', NULL, localtimestamp - INTERVAL '1 week');Add the policy:
SELECT add_continuous_aggregate_policy('cagg_rides_view', start_offset => INTERVAL '1 week', end_offset => INTERVAL '1 hour', schedule_interval => INTERVAL '30 minutes');
Create a continuous aggregate with a JOIN
In TimescaleDB V2.10 and later, with Postgres v12 or later, you can create a continuous aggregate with a query that also includes a
JOIN. For example:CREATE MATERIALIZED VIEW conditions_summary_daily_3 WITH (timescaledb.continuous) AS SELECT time_bucket(INTERVAL '1 day', day) AS bucket, AVG(temperature), MAX(temperature), MIN(temperature), name FROM devices JOIN conditions USING (device_id) GROUP BY name, bucket;For more information about creating a continuous aggregate with a
JOIN, including some additional restrictions, see the about continuous aggregates section.Query continuous aggregates
When you have created a continuous aggregate and set a refresh policy, you can query the view with a
SELECTquery. You can only specify a single hypertable in theFROMclause. Including more hypertables, tables, views, or subqueries in yourSELECTquery is not supported. Additionally, make sure that the hypertable you are querying does not have row-level-security policies enabled.Querying a continuous aggregate
At the
psqlprompt, query the continuous aggregate view calledconditions_summary_hourlyfor the average, minimum, and maximum temperatures for the first quarter of 2021 recorded by device 5:SELECT * FROM conditions_summary_hourly WHERE device = 5 AND bucket >= '2020-01-01' AND bucket < '2020-04-01';Alternatively, query the continuous aggregate view called
conditions_summary_hourlyfor the top 20 largest metric spreads in that quarter:SELECT * FROM conditions_summary_hourly WHERE max - min > 1800 AND bucket >= '2020-01-01' AND bucket < '2020-04-01' ORDER BY bucket DESC, device DESC LIMIT 20;
Use continuous aggregates with mutable functions: experimental
Mutable functions have experimental supported in the continuous aggregate query definition. Mutable functions are enabled by default. However, if you use them in a materialized query a warning is returned.
When using non-immutable functions you have to ensure these functions produce consistent results across continuous aggregate refresh runs. For example, if a function depends on the current time zone you have to ensure all your continuous aggregate refreshes run with a consistent setting for this.
Use continuous aggregates with window functions: experimental
Window functions have experimental supported in the continuous aggregate query definition. Window functions are disabled by default. To enable them, set
timescaledb.enable_cagg_window_functionstotrue.Support is experimental, there is a risk of data inconsistency. For example, in backfill scenarios, buckets could be missed.
Create a window function
To use a window function in a continuous aggregate:
Create a simple table with to store a value at a specific time:
CREATE TABLE example ( time TIMESTAMPZ NOT NULL, value TEXT NOT NULL, );Enable window functions.
As window functions are experimental, in order to create continuous aggregates with window functions. you have to
enable_cagg_window_functions.SET timescaledb.enable_cagg_window_functions TO TRUE; ``` 1. Bucket your data by `time` and calculate the delta between time buckets using the `lag` window function: Window functions must stay within the time bucket. Any query that tries to look beyond the current time bucket will produce incorrect results around the refresh boundaries.sql CREATE MATERIALIZED VIEW example_aggregate
WITH (timescaledb.continuous) AS SELECT time_bucket('1d', time), customer_id, sum(amount) AS amount, sum(amount) - LAG(sum(amount),1,NULL) OVER (PARTITION BY time_bucket('1d', time) ORDER BY sum(amount) DESC) AS amount_diff, ROW_NUMBER() OVER (PARTITION BY time_bucket('1d', time) ORDER BY sum(amount) DESC) FROM sales GROUP BY 1,2;Window functions that partition by time_bucket should be safe even with LAG()/LEAD() ### Window function workaround for older versions of TimescaleDB For TimescaleDB v2.19.3 and below, continuous aggregates do not support window functions. To work around this: 1. Create a simple table with to store a value at a specific time: ```sql CREATE TABLE example ( time TIMESTAMPZ NOT NULL, value TEXT NOT NULL, ); ``` 1. Create a continuous aggregate that does not use a window function:sql CREATE MATERIALIZED VIEW example_aggregate
WITH (timescaledb.continuous) AS SELECT time_bucket('10 minutes', time) AS bucket, first(value, time) AS value FROM example GROUP BY bucket;1. Use the `lag` window function on your continuous aggregate at query time: This speeds up your query by calculating the aggregation ahead of time. The delta is calculated at query time. ```sql SELECT bucket, value - lag(value, 1) OVER (ORDER BY bucket) AS delta FROM example_aggregate; ``` ===== PAGE: https://docs.tigerdata.com/use-timescale/continuous-aggregates/hierarchical-continuous-aggregates/ ===== # Continuous aggregates on continuous aggregates The more data you have, the more likely you are to run a more sophisticated analysis on it. When a simple one-level aggregation is not enough, TimescaleDB lets you create continuous aggregates on top of other continuous aggregates. This way, you summarize data at different levels of granularity, while still saving resources with precomputing. For example, you might have an hourly continuous aggregate that summarizes minute-by-minute data. To get a daily summary, you can create a new continuous aggregate on top of your hourly aggregate. This is more efficient than creating the daily aggregate on top of the original hypertable, because you can reuse the calculations from the hourly aggregate. This feature is available in TimescaleDB v2.9 and later. ## Create a continuous aggregate on top of another continuous aggregate Creating a continuous aggregate on top of another continuous aggregate works the same way as creating it on top of a hypertable. In your query, select from a continuous aggregate rather than from the hypertable, and use the time-bucketed column from the existing continuous aggregate as your time column. For more information, see the instructions for [creating a continuous aggregate][create-cagg]. ## Use real-time aggregation with hierarchical continuous aggregates In TimescaleDB v2.13 and later, real-time aggregates are **DISABLED** by default. In earlier versions, real-time aggregates are **ENABLED** by default; when you create a continuous aggregate, queries to that view include the results from the most recent raw data. Real-time aggregates always return up-to-date data in response to queries. They accomplish this by joining the materialized data in the continuous aggregate with unmaterialized raw data from the source table or view. When continuous aggregates are stacked, each continuous aggregate is only aware of the layer immediately below. The joining of unmaterialized data happens recursively until it reaches the bottom layer, giving you access to recent data down to that layer. If you keep all continuous aggregates in the stack as real-time aggregates, the bottom layer is the source hypertable. That means every continuous aggregate in the stack has access to all recent data. If there is a non-real-time continuous aggregate somewhere in the stack, the recursive joining stops at that non-real-time continuous aggregate. Higher-level continuous aggregates don't receive any unmaterialized data from lower levels. For example, say you have the following continuous aggregates: * A real-time hourly continuous aggregate on the source hypertable * A real-time daily continuous aggregate on the hourly continuous aggregate * A non-real-time, or materialized-only, monthly continuous aggregate on the daily continuous aggregate * A real-time yearly continuous aggregate on the monthly continuous aggregate Queries on the hourly and daily continuous aggregates include real-time, non-materialized data from the source hypertable. Queries on the monthly continuous aggregate only return already-materialized data. Queries on the yearly continuous aggregate return materialized data from the yearly continuous aggregate itself, plus more recent data from the monthly continuous aggregate. However, the data is limited to what is already materialized in the monthly continuous aggregate, and doesn't get even more recent data from the source hypertable. This happens because the materialized-only continuous aggregate provides a stopping point, and the yearly continuous aggregate is unaware of any layers beyond that stopping point. This is similar to [how stacked views work in Postgres][postgresql-views]. To make queries on the yearly continuous aggregate access all recent data, you can either: * Make the monthly continuous aggregate real-time, or * Redefine the yearly continuous aggregate on top of the daily continuous aggregate. <img class="main-content__illustration" width={1375} height={944} src="https://assets.timescale.com/docs/images/cagg_hierarchy.webp" alt="Example of hierarchical continuous aggregates in a finance application"/> ## Roll up calculations When summarizing already-summarized data, be aware of how stacked calculations work. Not all calculations return the correct result if you stack them. For example, if you take the maximum of several subsets, then take the maximum of the maximums, you get the maximum of the entire set. But if you take the average of several subsets, then take the average of the averages, that can result in a different figure than the average of all the data. To simplify such calculations when using continuous aggregates on top of continuous aggregates, you can use the [hyperfunctions][hyperfunctions] from TimescaleDB Toolkit, such as the [statistical aggregates][stats-aggs]. These hyperfunctions are designed with a two-step aggregation pattern that allows you to roll them up into larger buckets. The first step creates a summary aggregate that can be rolled up, just as a maximum can be rolled up. You can store this aggregate in your continuous aggregate. Then, you can call an accessor function as a second step when you query from your continuous aggregate. This accessor takes the stored data from the summary aggregate and returns the final result. For example, you can create an hourly continuous aggregate using `percentile_agg` over a hypertable, like this:sql CREATE MATERIALIZED VIEW response_times_hourly WITH (timescaledb.continuous) AS SELECT
time_bucket('1 h'::interval, ts) as bucket, api_id, avg(response_time_ms), percentile_agg(response_time_ms) as percentile_hourlyFROM response_times GROUP BY 1, 2;
To then stack another daily continuous aggregate over it, you can use a `rollup` function, like this:sql CREATE MATERIALIZED VIEW response_times_daily WITH (timescaledb.continuous) AS SELECT
time_bucket('1 d'::interval, bucket) as bucket_daily, api_id, mean(rollup(percentile_hourly)) as mean, rollup(percentile_hourly) as percentile_dailyFROM response_times_hourly GROUP BY 1, 2;
The `mean` function of the TimescaleDB Toolkit is used to calculate the concrete mean value of the rolled up values. The additional `percentile_daily` attribute contains the raw rolled up values, which can be used in an additional continuous aggregate on top of this continuous aggregate (for example a continuous aggregate for the daily values). For more information and examples about using `rollup` functions to stack calculations, see the [percentile approximation API documentation][percentile_agg_api]. ## Restrictions There are some restrictions when creating a continuous aggregate on top of another continuous aggregate. In most cases, these restrictions are in place to ensure valid time-bucketing: * You can only create a continuous aggregate on top of a finalized continuous aggregate. This new finalized format is the default for all continuous aggregates created since TimescaleDB 2.7. If you need to create a continuous aggregate on top of a continuous aggregate in the old format, you need to [migrate your continuous aggregate][migrate-cagg] to the new format first. * The time bucket of a continuous aggregate should be greater than or equal to the time bucket of the underlying continuous aggregate. It also needs to be a multiple of the underlying time bucket. For example, you can rebucket an hourly continuous aggregate into a new continuous aggregate with time buckets of 6 hours. You can't rebucket the hourly continuous aggregate into a new continuous aggregate with time buckets of 90 minutes, because 90 minutes is not a multiple of 1 hour. * A continuous aggregate with a fixed-width time bucket can't be created on top of a continuous aggregate with a variable-width time bucket. Fixed-width time buckets are time buckets defined in seconds, minutes, hours, and days, because those time intervals are always the same length. Variable-width time buckets are time buckets defined in months or years, because those time intervals vary by the month or on leap years. This limitation prevents a case such as trying to rebucket monthly buckets into `61 day` buckets, where there is no good mapping between time buckets for month combinations such as July/August (62 days). Note that even though weeks are fixed-width intervals, you can't use monthly or yearly time buckets on top of weekly time buckets for the same reason. The number of weeks in a month or year is usually not an integer. However, you can stack a variable-width time bucket on top of a fixed-width time bucket. For example, creating a monthly continuous aggregate on top of a daily continuous aggregate works, and is the one of the main use cases for this feature. ===== PAGE: https://docs.tigerdata.com/use-timescale/hypercore/secondary-indexes/ ===== # Improve query and upsert performance Real-time analytics applications require more than fast inserts and analytical queries. They also need high performance when retrieving individual records, enforcing constraints, or performing upserts, something that OLAP/columnar databases lack. This pages explains how to improve performance by segmenting and ordering data. To improve query performance using indexes, see [About indexes][about-index] and [Indexing data][create-index]. ## Segmenting and ordering data To optimize query performance, TimescaleDB enables you to explicitly control the way your data is physically organized in the columnstore. By structuring data effectively, queries can minimize disk reads and execute more efficiently, using vectorized execution for parallel batch processing where possible. <center> <img class="main-content__illustration" width="80%" src="https://assets.timescale.com/docs/images/columnstore-segmentby.png" alt="" /> </center> * **Group related data together to improve scan efficiency**: organizing rows into logical segments ensures that queries filtering by a specific value only scan relevant data sections. For example, in the above, querying for a specific ID is particularly fast. * **Sort data within segments to accelerate range queries**: defining a consistent order reduces the need for post-query sorting, making time-based queries and range scans more efficient. * **Reduce disk reads and maximize vectorized execution**: a well-structured storage layout enables efficient batch processing (Single Instruction, Multiple Data, or SIMD vectorization) and parallel execution, optimizing query performance. By combining segmentation and ordering, TimescaleDB ensures that columnar queries are not only fast but also resource-efficient, enabling high-performance real-time analytics. ### Improve performance in the columnstore by segmenting and ordering data Ordering data in the columnstore has a large impact on the compression ratio and performance of your queries. Rows that change over a dimension should be close to each other. As hypertables contain time-series data, they are partitioned by time. This makes the time column a perfect candidate for ordering your data since the measurements evolve as time goes on. If you use `orderby` as your only columnstore setting, you get a good enough compression ratio to save a lot of storage and your queries are faster. However, if you only use `orderby`, you always have to access your data using the time dimension, then filter the rows returned on other criteria. Accessing the data effectively depends on your use case and your queries. You segment data in the columnstore to match the way you want to access it. That is, in a way that makes it easier for your queries to fetch the right data at the right time. When you segment your data to access specific columns, your queries are optimized and yield even better performance. For example, to access information about a single device with a specific `device_id`, you segment on the `device_id` column. This enables you to run analytical queries on compressed data in the columnstore much faster. For example for the following hypertable:sql CREATE TABLE metrics ( time TIMESTAMPTZ, user_id INT, device_id INT, data JSONB ) WITH ( tsdb.hypertable, tsdb.partition_column='time' );
1. **Execute a query on a regular hypertable** 1. Query your data ```sql SELECT device_id, AVG(cpu) AS avg_cpu, AVG(disk_io) AS avg_disk_io FROM metrics WHERE device_id = 5 GROUP BY device_id; ``` Gives the following result: ```sql device_id | avg_cpu | avg_disk_io -----------+--------------------+--------------------- 5 | 0.4972598866221261 | 0.49820356730280524 (1 row) Time: 177,399 ms ``` 1. **Execute a query on the same data segmented and ordered in the columnstore** 1. Control the way your data is ordered in the columnstore: ```sql ALTER TABLE metrics SET ( timescaledb.enable_columnstore = true, timescaledb.orderby = 'time', timescaledb.segmentby = 'device_id' ); ``` 1. Query your data ```sql select avg(cpu) from metrics where time >= '2024-03-01 00:00:00+01' and time < '2024-03-02 00:00:00+01'; ``` Gives the following result: ```sql device_id | avg_cpu | avg_disk_io -----------+-------------------+--------------------- 5 | 0.497259886622126 | 0.49820356730280535 (1 row) Time: 42,139 ms ``` As you see, using `orderby` and `segmentby` not only reduces the amount of space taken by your data, but also vastly improves query speed. The number of rows that are compressed together in a single batch (like the ones we see above) is 1000. If your chunk does not contain enough data to create big enough batches, your compression ratio will be reduced. This needs to be taken into account when you define your columnstore settings. ===== PAGE: https://docs.tigerdata.com/use-timescale/hypercore/modify-data-in-hypercore/ ===== # Modify data in hypercore Old API since [TimescaleDB v2.20.0](https://github.com/timescale/timescaledb/releases/tag/2.20.0) TimescaleDB is optimized for fast updates on compressed data in the columnstore. To modify data in the columnstore, use standard SQL. You [set up hypercore][setup-hypercore] to automatically convert data between the rowstore and columnstore when it reaches a certain age. After you have optimized data in the columnstore, you may need to modify it. For example, to make small changes, or backfill large amounts of data. You may even have to update the schema to accommodate these changes to the data. This page shows you how to update small and large amounts of new data, and update the schema in the columnstore. ## Prerequisites To follow the procedure on this page you need to: * Create a [target Tiger Cloud service][create-service]. This procedure also works for [self-hosted TimescaleDB][enable-timescaledb]. - [Optimize your data][setup-hypercore] for real-time analytics. ## Modify small amounts of data You can [`INSERT`, `UPDATE`, and `DELETE`][write] data in the columnstore, even if the data you are inserting has unique constraints. When you insert data into a chunk in the columnstore, a small amount of data is decompressed to allow a speculative insertion, and block any inserts that could violate the constraints. When you `DELETE` whole segments of data, filter your deletes using the column you `segment_by` instead of separate deletes. This considerably increases performance. ## Modify large amounts of data If you need to modify or add a lot of data to a chunk in the columnstore, best practice is to stop any [jobs][job] moving chunks to the columnstore, convert the chunk back to the rowstore, then modify the data. After the update, [convert the chunk to the columnstore][convert_to_columnstore] and restart the jobs. This workflow is especially useful if you need to backfill old data. 1. **Stop the jobs that are automatically adding chunks to the columnstore** Retrieve the list of jobs from the [timescaledb_information.jobs][informational-views] view to find the job you need to [alter_job][alter_job].sql SELECT alter_job(JOB_ID, scheduled => false);
1. **Convert a chunk to update back to the rowstore** ``` sql CALL convert_to_rowstore('_timescaledb_internal._hyper_2_2_chunk'); ``` 1. **Update the data in the chunk you added to the rowstore** Best practice is to structure your [INSERT][insert] statement to include appropriate partition key values, such as the timestamp. TimescaleDB adds the data to the correct chunk:sql INSERT INTO metrics (time, value) VALUES ('2025-01-01T00:00:00', 42);
1. **Convert the updated chunks back to the columnstore**sql CALL convert_to_columnstore('_timescaledb_internal._hyper_1_2_chunk');
1. **Restart the jobs that are automatically converting chunks to the columnstore**sql SELECT alter_job(JOB_ID, scheduled => true);
## Modify a table schema for data in the columnstore You can modify the schema of a table in the columnstore. To do this, you need to: 1. **Stop the jobs that are automatically adding chunks to the columnstore** Retrieve the list of jobs from the [timescaledb_information.jobs][informational-views] view to find the job you need to [alter_job][alter_job].sql SELECT alter_job(JOB_ID, scheduled => false);
1. **Convert a chunk to update back to the rowstore** ``` sql CALL convert_to_rowstore('_timescaledb_internal._hyper_2_2_chunk'); ``` 2. **Modify the schema**: Possible modifications are: - Add a nullable column: `ALTER TABLE <hypertable> ADD COLUMN <column_name> <datatype>;` - Add a column with a default value and a `NOT NULL` constraint: `ALTER TABLE <hypertable> ADD COLUMN <column_name> <datatype> NOT NULL DEFAULT <default_value>;` - Rename a column: `ALTER TABLE <hypertable> RENAME <column_name> TO <new_name>;` - Drop a column: `ALTER TABLE <hypertable> DROP COLUMN <column_name>;` You cannot change the data type of an existing column. 1. **Convert the updated chunks back to the columnstore**sql CALL convert_to_columnstore('_timescaledb_internal._hyper_1_2_chunk');
1. **Restart the jobs that are automatically converting chunks to the columnstore**sql SELECT alter_job(JOB_ID, scheduled => true);
===== PAGE: https://docs.tigerdata.com/use-timescale/hypercore/real-time-analytics-in-hypercore/ ===== # Optimize your data for real-time analytics [Hypercore][hypercore] is the hybrid row-columnar storage engine in TimescaleDB used by hypertables. Traditional databases force a trade-off between fast inserts (row-based storage) and efficient analytics (columnar storage). Hypercore eliminates this trade-off, allowing real-time analytics without sacrificing transactional capabilities. Hypercore dynamically stores data in the most efficient format for its lifecycle: * **Row-based storage for recent data**: the most recent chunk (and possibly more) is always stored in the rowstore, ensuring fast inserts, updates, and low-latency single record queries. Additionally, row-based storage is used as a writethrough for inserts and updates to columnar storage. * **Columnar storage for analytical performance**: chunks are automatically compressed into the columnstore, optimizing storage efficiency and accelerating analytical queries. Unlike traditional columnar databases, hypercore allows data to be inserted or modified at any stage, making it a flexible solution for both high-ingest transactional workloads and real-time analytics—within a single database. When you convert chunks from the rowstore to the columnstore, multiple records are grouped into a single row. The columns of this row hold an array-like structure that stores all the data. For example, data in the following rowstore chunk: | Timestamp | Device ID | Device Type | CPU |Disk IO| |---|---|---|---|---| |12:00:01|A|SSD|70.11|13.4| |12:00:01|B|HDD|69.70|20.5| |12:00:02|A|SSD|70.12|13.2| |12:00:02|B|HDD|69.69|23.4| |12:00:03|A|SSD|70.14|13.0| |12:00:03|B|HDD|69.70|25.2| Is converted and compressed into arrays in a row in the columnstore: |Timestamp|Device ID|Device Type|CPU|Disk IO| |-|-|-|-|-| |[12:00:01, 12:00:01, 12:00:02, 12:00:02, 12:00:03, 12:00:03]|[A, B, A, B, A, B]|[SSD, HDD, SSD, HDD, SSD, HDD]|[70.11, 69.70, 70.12, 69.69, 70.14, 69.70]|[13.4, 20.5, 13.2, 23.4, 13.0, 25.2]| Because a single row takes up less disk space, you can reduce your chunk size by up to 98%, and can also speed up your queries. This saves on storage costs, and keeps your queries operating at lightning speed. For an in-depth explanation of how hypertables and hypercore work, see the [Data model][data-model]. This page shows you how to get the best results when you set a policy to automatically convert chunks in a hypertable from the rowstore to the columnstore. ## Prerequisites To follow the steps on this page: * Create a target [Tiger Cloud service][create-service] with real-time analytics enabled. You need your [connection details][connection-info]. The code samples in this page use the [crypto_sample.zip](https://assets.timescale.com/docs/downloads/candlestick/crypto_sample.zip) data from [this key features tutorial][ingest-data]. ## Optimize your data with columnstore policies The compression ratio and query performance of data in the columnstore is dependent on the order and structure of your data. Rows that change over a dimension should be close to each other. With time-series data, you `orderby` the time dimension. For example, `Timestamp`: | Timestamp | Device ID | Device Type | CPU |Disk IO| |---|---|---|---|---| |12:00:01|A|SSD|70.11|13.4| This ensures that records are compressed and accessed in the same order. However, you would always have to access the data using the time dimension, then filter all the rows using other criteria. To make your queries more efficient, you segment your data based on the following: - The way you want to access it. For example, to rapidly access data about a single device, you `segmentby` the `Device ID` column. This enables you to run much faster analytical queries on data in the columnstore. - The compression rate you want to achieve. The [lower the cardinality][cardinality-blog] of the `segmentby` column, the better compression results you get. When TimescaleDB converts a chunk to the columnstore, it automatically creates a different schema for your data. It also creates and uses custom indexes to incorporate the `segmentby` and `orderby` parameters when you write to and read from the columnstore. To set up your hypercore automation: 1. **Connect to your Tiger Cloud service** In [Tiger Cloud Console][services-portal] open an [SQL editor][in-console-editors]. You can also connect to your service using [psql][connect-using-psql]. 1. **Enable columnstore on a hypertable** Create a [hypertable][hypertables-section] for your time-series data using [CREATE TABLE][hypertable-create-table]. For [efficient queries][secondary-indexes] on data in the columnstore, remember to `segmentby` the column you will use most often to filter your data. For example: * [Use `CREATE TABLE` for a hypertable][hypertable-create-table] ```sql CREATE TABLE crypto_ticks ( "time" TIMESTAMPTZ, symbol TEXT, price DOUBLE PRECISION, day_volume NUMERIC ) WITH ( tsdb.hypertable, tsdb.partition_column='time', tsdb.segmentby='symbol', tsdb.orderby='time DESC' ); ``` If you are self-hosting TimescaleDB v2.19.3 and below, create a [Postgres relational table][pg-create-table], then convert it using [create_hypertable][create_hypertable]. You then enable hypercore with a call to [ALTER TABLE][alter_table_hypercore]. * [Use `ALTER MATERIALIZED VIEW` for a continuous aggregate][compression_continuous-aggregate] ```sql ALTER MATERIALIZED VIEW assets_candlestick_daily set ( timescaledb.enable_columnstore = true, timescaledb.segmentby = 'symbol' ); ``` Before you say `huh`, a continuous aggregate is a specialized hypertable. 1. **Add a policy to convert chunks to the columnstore at a specific time interval** Create a [columnstore_policy][add_columnstore_policy] that automatically converts chunks in a hypertable to the columnstore at a specific time interval. For example, convert yesterday's crypto trading data to the columnstore:sql CALL add_columnstore_policy('crypto_ticks', after => INTERVAL '1d');
TimescaleDB is optimized for fast updates on compressed data in the columnstore. To modify data in the columnstore, use standard SQL. 1. **Check the columnstore policy** 1. View your data space saving: When you convert data to the columnstore, as well as being optimized for analytics, it is compressed by more than 90%. This helps you save on storage costs and keeps your queries operating at lightning speed. To see the amount of space saved: ``` sql SELECT pg_size_pretty(before_compression_total_bytes) as before, pg_size_pretty(after_compression_total_bytes) as after FROM hypertable_columnstore_stats('crypto_ticks'); ``` You see something like: | before | after | |---------|--------| | 194 MB | 24 MB | 1. View the policies that you set or the policies that already exist: ``` sql SELECT * FROM timescaledb_information.jobs WHERE proc_name='policy_compression'; ``` See [timescaledb_information.jobs][informational-views]. 1. **Pause a columnstore policy**sql SELECT * FROM timescaledb_information.jobs where
proc_name = 'policy_compression' AND relname = 'crypto_ticks'-- Select the JOB_ID from the results
SELECT alter_job(JOB_ID, scheduled => false);
See [alter_job][alter_job]. 1. **Restart a columnstore policy**sql SELECT alter_job(JOB_ID, scheduled => true);
See [alter_job][alter_job]. 1. **Remove a columnstore policy**sql CALL remove_columnstore_policy('crypto_ticks');
See [remove_columnstore_policy][remove_columnstore_policy]. 1. **Disable columnstore** If your table has chunks in the columnstore, you have to [convert the chunks back to the rowstore][convert_to_rowstore] before you disable the columnstore.sql ALTER TABLE crypto_ticks SET (timescaledb.enable_columnstore = false);
See [alter_table_hypercore][alter_table_hypercore]. ## Reference For integers, timestamps, and other integer-like types, data is compressed using [delta encoding][delta], [delta-of-delta][delta-delta], [simple-8b][simple-8b], and [run-length encoding][run-length]. For columns with few repeated values, [XOR-based][xor] and [dictionary compression][dictionary] is used. For all other types, [dictionary compression][dictionary] is used. ===== PAGE: https://docs.tigerdata.com/use-timescale/hypercore/compression-methods/ ===== # About compression methods Depending on the data type that is compressed when your data is converted from the rowstore to the columnstore, TimescaleDB uses the following compression algorithms: - **Integers, timestamps, boolean and other integer-like types**: a combination of the following compression methods is used: [delta encoding][delta], [delta-of-delta][delta-delta], [simple-8b][simple-8b], and [run-length encoding][run-length]. - **Columns that do not have a high amount of repeated values**: [XOR-based][xor] compression with some [dictionary compression][dictionary]. - **All other types**: [dictionary compression][dictionary]. This page gives an in-depth explanation of the compression methods used in hypercore. ## Integer compression For integers, timestamps, and other integer-like types TimescaleDB uses a combination of delta encoding, delta-of-delta, simple 8-b, and run-length encoding. The simple-8b compression method has been extended so that data can be decompressed in reverse order. Backward scanning queries are common in time-series workloads. This means that these types of queries run much faster. ### Delta encoding Delta encoding reduces the amount of information required to represent a data object by only storing the difference, sometimes referred to as the delta, between that object and one or more reference objects. These algorithms work best where there is a lot of redundant information, and it is often used in workloads like versioned file systems. For example, this is how Dropbox keeps your files synchronized. Applying delta-encoding to time-series data means that you can use fewer bytes to represent a data point, because you only need to store the delta from the previous data point. For example, imagine you had a dataset that collected CPU, free memory, temperature, and humidity over time. If you time column was stored as an integer value, like seconds since UNIX epoch, your raw data would look a little like this: |time|cpu|mem_free_bytes|temperature|humidity| |-|-|-|-|-| |2023-04-01 10:00:00|82|1,073,741,824|80|25| |2023-04-01 10:00:05|98|858,993,459|81|25| |2023-04-01 10:00:10|98|858,904,583|81|25| With delta encoding, you only need to store how much each value changed from the previous data point, resulting in smaller values to store. So after the first row, you can represent subsequent rows with less information, like this: |time|cpu|mem_free_bytes|temperature|humidity| |-|-|-|-|-| |2023-04-01 10:00:00|82|1,073,741,824|80|25| |5 seconds|16|-214,748,365|1|0| |5 seconds|0|-88,876|0|0| Applying delta encoding to time-series data takes advantage of the fact that most time-series datasets are not random, but instead represent something that is slowly changing over time. The storage savings over millions of rows can be substantial, especially if the value changes very little, or doesn't change at all. ### Delta-of-delta encoding Delta-of-delta encoding takes delta encoding one step further and applies delta-encoding over data that has previously been delta-encoded. With time-series datasets where data collection happens at regular intervals, you can apply delta-of-delta encoding to the time column, which results in only needing to store a series of zeroes. In other words, delta encoding stores the first derivative of the dataset, while delta-of-delta encoding stores the second derivative of the dataset. Applied to the example dataset from earlier, delta-of-delta encoding results in this: |time|cpu|mem_free_bytes|temperature|humidity| |-|-|-|-|-| |2020-04-01 10:00:00|82|1,073,741,824|80|25| |5 seconds|16|-214,748,365|1|0| |0 seconds|0|-88,876|0|0| In this example, delta-of-delta further compresses 5 seconds in the time column down to 0 for every entry in the time column after the second row, because the five second gap remains constant for each entry. Note that you see two entries in the table before the delta-delta 0 values, because you need two deltas to compare. This compresses a full timestamp of 8 bytes, or 64 bits, down to just a single bit, resulting in 64x compression. ### Simple-8b With delta and delta-of-delta encoding, you can significantly reduce the number of digits you need to store. But you still need an efficient way to store the smaller integers. The previous examples used a standard integer datatype for the time column, which needs 64 bits to represent the value of 0 when delta-delta encoded. This means that even though you are only storing the integer 0, you are still consuming 64 bits to store it, so you haven't actually saved anything. Simple-8b is one of the simplest and smallest methods of storing variable-length integers. In this method, integers are stored as a series of fixed-size blocks. For each block, every integer within the block is represented by the minimal bit-length needed to represent the largest integer in that block. The first bits of each block denotes the minimum bit-length for the block. This technique has the advantage of only needing to store the length once for a given block, instead of once for each integer. Because the blocks are of a fixed size, you can infer the number of integers in each block from the size of the integers being stored. For example, if you wanted to store a temperature that changed over time, and you applied delta encoding, you might end up needing to store this set of integers: |temperature (deltas)| |-| |1| |10| |11| |13| |9| |100| |22| |11| With a block size of 10 digits, you could store this set of integers as two blocks: one block storing 5 2-digit numbers, and a second block storing 3 3-digit numbers, like this: <CodeBlock canCopy={false} showLineNumbers={false} children={` {2: [01, 10, 11, 13, 09]} {3: [100, 022, 011]} `} /> In this example, both blocks store about 10 digits worth of data, even though some of the numbers have to be padded with a leading 0. You might also notice that the second block only stores 9 digits, because 10 is not evenly divisible by 3. Simple-8b works in this way, except it uses binary numbers instead of decimal, and it usually uses 64-bit blocks. In general, the longer the integer, the fewer number of integers that can be stored in each block. ### Run-length encoding Simple-8b compresses integers very well, however, if you have a large number of repeats of the same value, you can get even better compression with run-length encoding. This method works well for values that don't change very often, or if an earlier transformation removes the changes. Run-length encoding is one of the classic compression algorithms. For time-series data with billions of contiguous zeroes, or even a document with a million identically repeated strings, run-length encoding works incredibly well. For example, if you wanted to store a temperature that changed minimally over time, and you applied delta encoding, you might end up needing to store this set of integers: |temperature (deltas)| |-| |11| |12| |12| |12| |12| |12| |12| |1| |12| |12| |12| |12| For values like these, you do not need to store each instance of the value, but rather how long the run, or number of repeats, is. You can store this set of numbers as `{run; value}` pairs like this: <CodeBlock canCopy={false} showLineNumbers={false} children={` {1; 11}, {6; 12}, {1; 1}, {4; 12} `} /> This technique uses 11 digits of storage (1, 1, 1, 6, 1, 2, 1, 1, 4, 1, 2), rather than 23 digits that an optimal series of variable-length integers requires (11, 12, 12, 12, 12, 12, 12, 1, 12, 12, 12, 12). Run-length encoding is also used as a building block for many more advanced algorithms, such as Simple-8b RLE, which is an algorithm that combines run-length and Simple-8b techniques. TimescaleDB implements a variant of Simple-8b RLE. This variant uses different sizes to standard Simple-8b, in order to handle 64-bit values, and RLE. ## Floating point compression For columns that do not have a high amount of repeated values, TimescaleDB uses XOR-based compression. The standard XOR-based compression method has been extended so that data can be decompressed in reverse order. Backward scanning queries are common in time-series workloads. This means that queries that use backwards scans run much faster. ### XOR-based compression Floating point numbers are usually more difficult to compress than integers. Fixed-length integers often have leading zeroes, but floating point numbers usually use all of their available bits, especially if they are converted from decimal numbers, which can't be represented precisely in binary. Techniques like delta-encoding don't work well for floats, because they do not reduce the number of bits sufficiently. This means that most floating-point compression algorithms tend to be either complex and slow, or truncate significant digits. One of the few simple and fast lossless floating-point compression algorithms is XOR-based compression, built on top of Facebook's Gorilla compression. XOR is the binary function `exclusive or`. In this algorithm, successive floating point numbers are compared with XOR, and a difference results in a bit being stored. The first data point is stored without compression, and subsequent data points are represented using their XOR'd values. ## Data-agnostic compression For values that are not integers or floating point, TimescaleDB uses dictionary compression. ### Dictionary compression One of the earliest lossless compression algorithms, dictionary compression is the basis of many popular compression methods. Dictionary compression can also be found in areas outside of computer science, such as medical coding. Instead of storing values directly, dictionary compression works by making a list of the possible values that can appear, and then storing an index into a dictionary containing the unique values. This technique is quite versatile, can be used regardless of data type, and works especially well when you have a limited set of values that repeat frequently. For example, if you had the list of temperatures shown earlier, but you wanted an additional column storing a city location for each measurement, you might have a set of values like this: |City| |-| |New York| |San Francisco| |San Francisco| |Los Angeles| Instead of storing all the city names directly, you can instead store a dictionary, like this: <CodeBlock canCopy={false} showLineNumbers={false} children={` {0: "New York", 1: "San Francisco", 2: "Los Angeles",} `} /> You can then store just the indices in your column, like this: |City| |-| |0| |1| |1| |2| For a dataset with a lot of repetition, this can offer significant compression. In the example, each city name is on average 11 bytes in length, while the indices are never going to be more than 4 bytes long, reducing space usage nearly 3 times. In TimescaleDB, the list of indices is compressed even further with the Simple-8b+RLE method, making the storage cost even smaller. Dictionary compression doesn't always result in savings. If your dataset doesn't have a lot of repeated values, then the dictionary is the same size as the original data. TimescaleDB automatically detects this case, and falls back to not using a dictionary in that scenario. ===== PAGE: https://docs.tigerdata.com/use-timescale/compression/modify-a-schema/ ===== # Schema modifications You can modify the schema of compressed hypertables in recent versions of TimescaleDB. |Schema modification|Before TimescaleDB 2.1|TimescaleDB 2.1 to 2.5|TimescaleDB 2.6 and above| |-|-|-|-| |Add a nullable column|❌|✅|✅| |Add a column with a default value and a `NOT NULL` constraint|❌|❌|✅| |Rename a column|❌|✅|✅| |Drop a column|❌|❌|✅| |Change the data type of a column|❌|❌|❌| To perform operations that aren't supported on compressed hypertables, first [decompress][decompression] the table. ## Add a nullable column To add a nullable column:sql ALTER TABLE ADD COLUMN ;
For example:sql ALTER TABLE conditions ADD COLUMN device_id integer;
Note that adding constraints to the new column is not supported before TimescaleDB v2.6. ## Add a column with a default value and a NOT NULL constraint To add a column with a default value and a not-null constraint:sql ALTER TABLE ADD COLUMN
NOT NULL DEFAULT <default_value>;For example:sql ALTER TABLE conditions ADD COLUMN device_id integer
NOT NULL DEFAULT 1;## Rename a column To rename a column:sql ALTER TABLE RENAME TO ;
For example:sql ALTER TABLE conditions RENAME device_id TO devid;
## Drop a column You can drop a column from a compressed hypertable, if the column is not an `orderby` or `segmentby` column. To drop a column:sql ALTER TABLE DROP COLUMN ;
For example:sql ALTER TABLE conditions DROP COLUMN temperature;
===== PAGE: https://docs.tigerdata.com/use-timescale/compression/decompress-chunks/ ===== # Decompression Old API since [TimescaleDB v2.18.0](https://github.com/timescale/timescaledb/releases/tag/2.18.0) Replaced by <a href="https://docs.tigerdata.com/api/latest/hypercore/convert_to_rowstore/">`convert_to_rowstore`</a>. When compressing your data, you can reduce the amount of storage space used. But you should always leave some additional storage capacity. This gives you the flexibility to decompress chunks when necessary, for actions such as bulk inserts. This section describes commands to use for decompressing chunks. You can filter by time to select the chunks you want to decompress. ## Decompress chunks manually Before decompressing chunks, stop any compression policy on the hypertable you are decompressing. The database automatically recompresses your chunks in the next scheduled job. If you accumulate a large amount of chunks that need to be compressed, the [troubleshooting guide][troubleshooting-oom-chunks] shows how to compress a backlog of chunks. For more information on how to stop and run compression policies using `alter_job()`, see the [API reference][api-reference-alter-job]. There are several methods for selecting chunks and decompressing them. ### Decompress individual chunks To decompress a single chunk by name, run this command:sql SELECT decompress_chunk('_timescaledb_internal.');
where, `<chunk_name>` is the name of the chunk you want to decompress. ### Decompress chunks by time To decompress a set of chunks based on a time range, you can use the output of `show_chunks` to decompress each one:sql SELECT decompress_chunk(c, true)
FROM show_chunks('table_name', older_than, newer_than) c;For more information about the `decompress_chunk` function, see the `decompress_chunk` [API reference][api-reference-decompress]. ### Decompress chunks on more precise constraints If you want to use more precise matching constraints, for example space partitioning, you can construct a command like this:sql SELECT tableoid::regclass FROM metrics WHERE time = '2000-01-01' AND device_id = 1 GROUP BY tableoid;
tableoid
_timescaledb_internal._hyper_72_37_chunk
===== PAGE: https://docs.tigerdata.com/use-timescale/compression/compression-on-continuous-aggregates/ ===== # Convert continuous aggregates to the columnstore Continuous aggregates are often used to downsample historical data. If the data is only used for analytical queries and never modified, you can compress the aggregate to save on storage. Old API since [TimescaleDB v2.18.0](https://github.com/timescale/timescaledb/releases/tag/2.18.0) Replaced by <a href="https://docs.tigerdata.com/use-timescale/latest/continuous-aggregates/compression-on-continuous-aggregates/">Convert continuous aggregates to the columnstore</a>. Before version [2.18.1](https://github.com/timescale/timescaledb/releases/tag/2.18.1), you can't refresh the compressed regions of a continuous aggregate. To avoid conflicts between compression and refresh, make sure you set `compress_after` to a larger interval than the `start_offset` of your [refresh policy](https://docs.tigerdata.com/api/latest/continuous-aggregates/add_continuous_aggregate_policy). Compression on continuous aggregates works similarly to [compression on hypertables][compression]. When compression is enabled and no other options are provided, the `segment_by` value will be automatically set to the group by columns of the continuous aggregate and the `time_bucket` column will be used as the `order_by` column in the compression configuration. ## Enable compression on continuous aggregates You can enable and disable compression on continuous aggregates by setting the `compress` parameter when you alter the view. ### Enabling and disabling compression on continuous aggregates 1. For an existing continuous aggregate, at the `psql` prompt, enable compression: ```sql ALTER MATERIALIZED VIEW cagg_name set (timescaledb.compress = true); ``` 1. Disable compression: ```sql ALTER MATERIALIZED VIEW cagg_name set (timescaledb.compress = false); ``` Disabling compression on a continuous aggregate fails if there are compressed chunks associated with the continuous aggregate. In this case, you need to decompress the chunks, and then drop any compression policy on the continuous aggregate, before you disable compression. For more detailed information, see the [decompress chunks][decompress-chunks] section:sql SELECT decompress_chunk(c, true) FROM show_chunks('cagg_name') c;
## Compression policies on continuous aggregates Before setting up a compression policy on a continuous aggregate, you should set up a [refresh policy][refresh-policy]. The compression policy interval should be set so that actively refreshed regions are not compressed. This is to prevent refresh policies from failing. For example, consider a refresh policy like this:sql SELECT add_continuous_aggregate_policy('cagg_name', start_offset => INTERVAL '30 days', end_offset => INTERVAL '1 day', schedule_interval => INTERVAL '1 hour');
With this kind of refresh policy, the compression policy needs the `compress_after` parameter greater than the `start_offset` parameter of the continuous aggregate policy:sql SELECT add_compression_policy('cagg_name', compress_after=>'45 days'::interval);
===== PAGE: https://docs.tigerdata.com/use-timescale/compression/manual-compression/ ===== # Manual compression In most cases, an [automated compression policy][add_compression_policy] is sufficient to automatically compress your chunks. However, if you want more control, you can also use manual synchronous compression of specific chunks. Before you start, you need a list of chunks to compress. In this example, you use a hypertable called `example`, and compress chunks older than three days. ### Selecting chunks to compress 1. At the psql prompt, select all chunks in the table `example` that are older than three days: ```sql SELECT show_chunks('example', older_than => INTERVAL '3 days'); ``` 1. This returns a list of chunks. Take note of the chunks' names: ||show_chunks| |---|---| |1|_timescaledb_internal_hyper_1_2_chunk| |2|_timescaledb_internal_hyper_1_3_chunk| When you are happy with the list of chunks, you can use the chunk names to manually compress each one. ### Compressing chunks manually 1. At the psql prompt, compress the chunk: ```sql SELECT compress_chunk( '<chunk_name>'); ``` 1. Check the results of the compression with this command: ```sql SELECT * FROM chunk_compression_stats('example'); ``` The results show the chunks for the given hypertable, their compression status, and some other statistics: |chunk_schema|chunk_name|compression_status|before_compression_table_bytes|before_compression_index_bytes|before_compression_toast_bytes|before_compression_total_bytes|after_compression_table_bytes|after_compression_index_bytes|after_compression_toast_bytes|after_compression_total_bytes|node_name| |---|---|---|---|---|---|---|---|---|---|---|---| |_timescaledb_internal|_hyper_1_1_chunk|Compressed|8192 bytes|16 kB|8192 bytes|32 kB|8192 bytes|16 kB|8192 bytes|32 kB|| |_timescaledb_internal|_hyper_1_20_chunk|Uncompressed|||||||||| 1. Repeat for all chunks you want to compress. ## Manually compress chunks in a single command Alternatively, you can select the chunks and compress them in a single command by using the output of the `show_chunks` command to compress each one. For example, use this command to compress chunks between one and three weeks old if they are not already compressed:sql SELECT compress_chunk(i, if_not_compressed => true)
FROM show_chunks( 'example', now()::timestamp - INTERVAL '1 week', now()::timestamp - INTERVAL '3 weeks' ) i;## Roll up uncompressed chunks when compressing In TimescaleDB v2.9 and later, you can roll up multiple uncompressed chunks into a previously compressed chunk as part of your compression procedure. This allows you to have much smaller uncompressed chunk intervals, which reduces the disk space used for uncompressed data. For example, if you have multiple smaller uncompressed chunks in your data, you can roll them up into a single compressed chunk. To roll up your uncompressed chunks into a compressed chunk, alter the compression settings to set the compress chunk time interval and run compression operations to roll up the chunks while compressing. The default setting of `compress_orderby` is `'time DESC'` (the descending or DESC command is used to sort the data returned in ascending order), which causes chunks to be re-compressed many times during the rollup, possibly leading to a steep performance penalty. Set `timescaledb.compress_orderby = 'time ASC'` to avoid this penalty.sql ALTER TABLE example SET (timescaledb.compress_chunk_time_interval = '',
timescaledb.compress_orderby = 'time ASC');SELECT compress_chunk(c, if_not_compressed => true)
FROM show_chunks( 'example', now()::timestamp - INTERVAL '1 week' ) c;The time interval you choose must be a multiple of the uncompressed chunk interval. For example, if your uncompressed chunk interval is one week, your `<time_interval>` of the compressed chunk could be two weeks or six weeks, but not one month. ===== PAGE: https://docs.tigerdata.com/use-timescale/compression/about-compression/ ===== # About compression Old API since [TimescaleDB v2.18.0](https://github.com/timescale/timescaledb/releases/tag/2.18.0) Replaced by <a href="https://docs.tigerdata.com/use-timescale/latest/hypercore/">hypercore</a>. Compressing your time-series data allows you to reduce your chunk size by more than 90%. This saves on storage costs, and keeps your queries operating at lightning speed. When you enable compression, the data in your hypertable is compressed chunk by chunk. When the chunk is compressed, multiple records are grouped into a single row. The columns of this row hold an array-like structure that stores all the data. This means that instead of using lots of rows to store the data, it stores the same data in a single row. Because a single row takes up less disk space than many rows, it decreases the amount of disk space required, and can also speed up your queries. For example, if you had a table with data that looked a bit like this: |Timestamp|Device ID|Device Type|CPU|Disk IO| |-|-|-|-|-| |12:00:01|A|SSD|70.11|13.4| |12:00:01|B|HDD|69.70|20.5| |12:00:02|A|SSD|70.12|13.2| |12:00:02|B|HDD|69.69|23.4| |12:00:03|A|SSD|70.14|13.0| |12:00:03|B|HDD|69.70|25.2| You can convert this to a single row in array form, like this: |Timestamp|Device ID|Device Type|CPU|Disk IO| |-|-|-|-|-| |[12:00:01, 12:00:01, 12:00:02, 12:00:02, 12:00:03, 12:00:03]|[A, B, A, B, A, B]|[SSD, HDD, SSD, HDD, SSD, HDD]|[70.11, 69.70, 70.12, 69.69, 70.14, 69.70]|[13.4, 20.5, 13.2, 23.4, 13.0, 25.2]| This section explains how to enable native compression, and then goes into detail on the most important settings for compression, to help you get the best possible compression ratio. ## Key aspects of compression Every table has a different schema but they do share some commonalities that you need to think about. Consider the table `metrics` with the following attributes: |Column|Type|Collation|Nullable|Default| |-|-|-|-|-| time|timestamp with time zone|| not null| device_id| integer|| not null| device_type| integer|| not null| cpu| double precision||| disk_io| double precision||| All hypertables have a primary dimension which is used to partition the table into chunks. The primary dimension is given when [the hypertable is created][hypertable-create-table]. In the example below, you can see a classic time-series use case with a `time` column as the primary dimension. In addition, there are two columns `cpu` and `disk_io` containing the values that are captured over time, and a column `device_id` for the device that captured the values. Columns can be used in a few different ways: - You can use values in a column as a lookup key, in the example above `device_id` is a typical example of such a column. - You can use a column for partitioning a table. This is typically a time column like `time` in the example above, but it is possible to partition the table using other types as well. - You can use a column as a filter to narrow down on what data you select. The column `device_type` is an example of where you can decide to look at, for example, only solid state drives (SSDs). The remaining columns are typically the values or metrics you are collecting. These are typically aggregated or presented in other ways. The columns `cpu` and `disk_io` are typical examples of such columns. <CodeBlock canCopy={false} showLineNumbers={false} children={` SELECT avg(cpu), sum(disk_io) FROM metrics WHERE device_type = ‘SSD’ AND time >= now() - ‘1 day’::interval; `} /> When chunks are compressed in a hypertable, data stored in them is reorganized and stored in column-order rather than row-order. As a result, it is not possible to use the same uncompressed schema version of the chunk and a different schema must be created. This is automatically handled by TimescaleDB, but it has a few implications: The compression ratio and query performance is very dependent on the order and structure of the compressed data, so some considerations are needed when setting up compression. Indexes on the hypertable cannot always be used in the same manner for the compressed data. Indexes set on the hypertable are used only on chunks containing uncompressed data. TimescaleDB creates and uses custom indexes to incorporate the `segmentby` and `orderby` parameters during compression which are used when reading compressed data. More on this in the next section. Based on the previous schema, filtering of data should happen over a certain time period and analytics are done on device granularity. This pattern of data access lends itself to organizing the data layout suitable for compression. ### Ordering and segmenting. Ordering the data will have a great impact on the compression ratio and performance of your queries. Rows that change over a dimension should be close to each other. Since we are mostly dealing with time-series data, time dimension is a great candidate. Most of the time data changes in a predictable fashion, following a certain trend. We can exploit this fact to encode the data so it takes less space to store. For example, if you order the records over time, they will get compressed in that order and subsequently also accessed in the same order. Using the following configuration setup on our example table: <CodeBlock canCopy={false} showLineNumbers={false} children={` ALTER TABLE metrics SET (timescaledb.compress, timescaledb.compress_orderby='time'); `} /> would produce the following data layout. |Timestamp|Device ID|Device Type|CPU|Disk IO| |-|-|-|-| |[12:00:01, 12:00:01, 12:00:02, 12:00:02, 12:00:03, 12:00:03]|[A, B, A, B, A, B]|[SSD, HDD, SSD, HDD, SSD, HDD]|[70.11, 69.70, 70.12, 69.69, 70.14, 69.70]|[13.4, 20.5, 13.2, 23.4, 13.0, 25.2]| `time` column is used for ordering data, which makes filtering it using `time` column much more efficient. <CodeBlock canCopy={false} showLineNumbers={false} children={` postgres=# select avg(cpu) from metrics where time >= '2024-03-01 00:00:00+01' and time < '2024-03-02 00:00:00+01'; avg -------------------- 0.4996848437842719 (1 row) Time: 87,218 ms postgres=# ALTER TABLE metrics SET ( timescaledb.compress, timescaledb.compress_segmentby = 'device_id', timescaledb.compress_orderby='time' ); ALTER TABLE Time: 6,607 ms postgres=# SELECT compress_chunk(c) FROM show_chunks('metrics') c; compress_chunk ---------------------------------------- _timescaledb_internal._hyper_2_4_chunk _timescaledb_internal._hyper_2_5_chunk _timescaledb_internal._hyper_2_6_chunk (3 rows) Time: 3070,626 ms (00:03,071) postgres=# select avg(cpu) from metrics where time >= '2024-03-01 00:00:00+01' and time < '2024-03-02 00:00:00+01'; avg ------------------ 0.49968484378427 (1 row) Time: 45,384 ms `} /> This makes the time column a perfect candidate for ordering your data since the measurements evolve as time goes on. If you were to use that as your only compression setting, you would most likely get a good enough compression ratio to save a lot of storage. However, accessing the data effectively depends on your use case and your queries. With this setup, you would always have to access the data by using the time dimension and subsequently filter all the rows based on any other criteria. Segmenting the compressed data should be based on the way you access the data. Basically, you want to segment your data in such a way that you can make it easier for your queries to fetch the right data at the right time. That is to say, your queries should dictate how you segment the data so they can be optimized and yield even better query performance. For example, If you want to access a single device using a specific `device_id` value (either all records or maybe for a specific time range), you would need to filter all those records one by one during row access time. To get around this, you can use device_id column for segmenting. This would allow you to run analytical queries on compressed data much faster if you are looking for specific device IDs. Consider the following query: <CodeBlock canCopy={false} showLineNumbers={false} children={` SELECT device_id, AVG(cpu) AS avg_cpu, AVG(disk_io) AS avg_disk_io FROM metrics WHERE device_id = 5 GROUP BY device_id; `} /> As you can see, the query does a lot of work based on the `device_id` identifier by grouping all its values together. We can use this fact to speed up these types of queries by setting up compression to segment the data around the values in this column. Using the following configuration setup on our example table: <CodeBlock canCopy={false} showLineNumbers={false} children={` ALTER TABLE metrics SET ( timescaledb.compress, timescaledb.compress_segmentby='device_id', timescaledb.compress_orderby='time' ); `} /> would produce the following data layout. |time|device_id|device_type|cpu|disk_io|energy_consumption| |---|---|---|---|---|---| |[12:00:02, 12:00:01]|1|[SSD,SSD]|[88.2, 88.6]|[20, 25]|[0.8, 0.85]| |[12:00:02, 12:00:01]|2|[HDD,HDD]|[300.5, 299.1]|[30, 40]|[0.9, 0.95]| |...|...|...|...|...|...| Segmenting column `device_id` is used for grouping data points together based on the value of that column. This makes accessing a specific device much more efficient. <CodeBlock canCopy={false} showLineNumbers={false} children={` postgres=# \\timing Timing is on. postgres=# SELECT device_id, AVG(cpu) AS avg_cpu, AVG(disk_io) AS avg_disk_io FROM metrics WHERE device_id = 5 GROUP BY device_id; device_id | avg_cpu | avg_disk_io -----------+--------------------+--------------------- 5 | 0.4972598866221261 | 0.49820356730280524 (1 row) Time: 177,399 ms postgres=# ALTER TABLE metrics SET ( timescaledb.compress, timescaledb.compress_segmentby = 'device_id', timescaledb.compress_orderby='time' ); ALTER TABLE Time: 6,607 ms postgres=# SELECT compress_chunk(c) FROM show_chunks('metrics') c; compress_chunk ---------------------------------------- _timescaledb_internal._hyper_2_4_chunk _timescaledb_internal._hyper_2_5_chunk _timescaledb_internal._hyper_2_6_chunk (3 rows) Time: 3070,626 ms (00:03,071) postgres=# SELECT device_id, AVG(cpu) AS avg_cpu, AVG(disk_io) AS avg_disk_io FROM metrics WHERE device_id = 5 GROUP BY device_id; device_id | avg_cpu | avg_disk_io -----------+-------------------+--------------------- 5 | 0.497259886622126 | 0.49820356730280535 (1 row) Time: 42,139 ms `} /> Number of rows that are compressed together in a single batch (like the ones we see above) is 1000. If your chunk does not contain enough data to create big enough batches, your compression ratio will be reduced. This needs to be taken into account when defining your compression settings. ===== PAGE: https://docs.tigerdata.com/use-timescale/compression/compression-design/ ===== # Designing your database for compression Old API since [TimescaleDB v2.18.0](https://github.com/timescale/timescaledb/releases/tag/2.18.0) Replaced by <a href="https://docs.tigerdata.com/use-timescale/latest/hypercore/">hypercore</a>. Time-series data can be unique, in that it needs to handle both shallow and wide queries, such as "What's happened across the deployment in the last 10 minutes," and deep and narrow, such as "What is the average CPU usage for this server over the last 24 hours." Time-series data usually has a very high rate of inserts as well; hundreds of thousands of writes per second can be very normal for a time-series dataset. Additionally, time-series data is often very granular, and data is collected at a higher resolution than many other datasets. This can result in terabytes of data being collected over time. All this means that if you need great compression rates, you probably need to consider the design of your database, before you start ingesting data. This section covers some of the things you need to take into consideration when designing your database for maximum compression effectiveness. ## Compressing data TimescaleDB is built on Postgres which is, by nature, a row-based database. Because time-series data is accessed in order of time, when you enable compression, TimescaleDB converts many wide rows of data into a single row of data, called an array form. This means that each field of that new, wide row stores an ordered set of data comprising the entire column. For example, if you had a table with data that looked a bit like this: |Timestamp|Device ID|Status Code|Temperature| |-|-|-|-| |12:00:01|A|0|70.11| |12:00:01|B|0|69.70| |12:00:02|A|0|70.12| |12:00:02|B|0|69.69| |12:00:03|A|0|70.14| |12:00:03|B|4|69.70| You can convert this to a single row in array form, like this: |Timestamp|Device ID|Status Code|Temperature| |-|-|-|-| |[12:00:01, 12:00:01, 12:00:02, 12:00:02, 12:00:03, 12:00:03]|[A, B, A, B, A, B]|[0, 0, 0, 0, 0, 4]|[70.11, 69.70, 70.12, 69.69, 70.14, 69.70]| Even before you compress any data, this format immediately saves storage by reducing the per-row overhead. Postgres typically adds a small number of bytes of overhead per row. So even without any compression, the schema in this example is now smaller on disk than the previous format. This format arranges the data so that similar data, such as timestamps, device IDs, or temperature readings, is stored contiguously. This means that you can then use type-specific compression algorithms to compress the data further, and each array is separately compressed. For more information about the compression methods used, see the [compression methods section][compression-methods]. When the data is in array format, you can perform queries that require a subset of the columns very quickly. For example, if you have a query like this one, that asks for the average temperature over the past day: <CodeBlock canCopy={false} showLineNumbers={false} children={` SELECT time_bucket(‘1 minute’, timestamp) as minute AVG(temperature) FROM table WHERE timestamp > now() - interval ‘1 day’ ORDER BY minute DESC GROUP BY minute; `} /> The query engine can fetch and decompress only the timestamp and temperature columns to efficiently compute and return these results. Finally, TimescaleDB uses non-inline disk pages to store the compressed arrays. This means that the in-row data points to a secondary disk page that stores the compressed array, and the actual row in the main table becomes very small, because it is now just pointers to the data. When data stored like this is queried, only the compressed arrays for the required columns are read from disk, further improving performance by reducing disk reads and writes. ## Querying compressed data In the previous example, the database has no way of knowing which rows need to be fetched and decompressed to resolve a query. For example, the database can't easily determine which rows contain data from the past day, as the timestamp itself is in a compressed column. You don't want to have to decompress all the data in a chunk, or even an entire hypertable, to determine which rows are required. TimescaleDB automatically includes more information in the row and includes additional groupings to improve query performance. When you compress a hypertable, either manually or through a compression policy, it can help to specify an `ORDER BY` column. `ORDER BY` columns specify how the rows that are part of a compressed batch are ordered. For most time-series workloads, this is by timestamp, so if you don't specify an `ORDER BY` column, TimescaleDB defaults to using the time column. You can also specify additional dimensions, such as location. For each `ORDER BY` column, TimescaleDB automatically creates additional columns that store the minimum and maximum value of that column. This way, the query planner can look at the range of timestamps in the compressed column, without having to do any decompression, and determine whether the row could possibly match the query. When you compress your hypertable, you can also choose to specify a `SEGMENT BY` column. This allows you to segment compressed rows by a specific column, so that each compressed row corresponds to a data about a single item such as, for example, a specific device ID. This further allows the query planner to determine if the row could possibly match the query without having to decompress the column first. For example: |Device ID|Timestamp|Status Code|Temperature|Min Timestamp|Max Timestamp| |-|-|-|-|-|-| |A|[12:00:01, 12:00:02, 12:00:03]|[0, 0, 0]|[70.11, 70.12, 70.14]|12:00:01|12:00:03| |B|[12:00:01, 12:00:02, 12:00:03]|[0, 0, 4]|[69.70, 69.69, 69.70]|12:00:01|12:00:03| With the data segmented in this way, a query for device A between a time interval becomes quite fast. The query planner can use an index to find those rows for device A that contain at least some timestamps corresponding to the specified interval, and even a sequential scan is quite fast since evaluating device IDs or timestamps does not require decompression. This means the query executor only decompresses the timestamp and temperature columns corresponding to those selected rows. ===== PAGE: https://docs.tigerdata.com/use-timescale/compression/compression-policy/ ===== # Create a compression policy Old API since [TimescaleDB v2.18.0](https://github.com/timescale/timescaledb/releases/tag/2.18.0) Replaced by <a href="https://docs.tigerdata.com/use-timescale/latest/hypercore/real-time-analytics-in-hypercore/">Optimize your data for real-time analytics</a>. You can enable compression on individual hypertables, by declaring which column you want to segment by. ## Enable a compression policy This page uses an example table, called `example`, and segments it by the `device_id` column. Every chunk that is more than seven days old is then marked to be automatically compressed. The source data is organized like this: |time|device_id|cpu|disk_io|energy_consumption| |-|-|-|-|-| |8/22/2019 0:00|1|88.2|20|0.8| |8/22/2019 0:05|2|300.5|30|0.9| ### Enabling compression 1. At the `psql` prompt, alter the table: ```sql ALTER TABLE example SET ( timescaledb.compress, timescaledb.compress_segmentby = 'device_id' ); ``` 1. Add a compression policy to compress chunks that are older than seven days: ```sql SELECT add_compression_policy('example', INTERVAL '7 days'); ``` For more information, see the API reference for [`ALTER TABLE (compression)`][alter-table-compression] and [`add_compression_policy`][add_compression_policy]. ## View current compression policy To view the compression policy that you've set:sql SELECT * FROM timescaledb_information.jobs WHERE proc_name='policy_compression';
For more information, see the API reference for [`timescaledb_information.jobs`][timescaledb_information-jobs]. ## Pause compression policy To disable a compression policy temporarily, find the corresponding job ID and then call `alter_job` to pause it:sql SELECT * FROM timescaledb_information.jobs where proc_name = 'policy_compression' AND relname = 'example'
sql SELECT alter_job(, scheduled => false);
To enable it again:sql SELECT alter_job(, scheduled => true);
## Remove compression policy To remove a compression policy, use `remove_compression_policy`:sql SELECT remove_compression_policy('example');
For more information, see the API reference for [`remove_compression_policy`][remove_compression_policy]. ## Disable compression You can disable compression entirely on individual hypertables. This command works only if you don't currently have any compressed chunks:sql ALTER TABLE SET (timescaledb.compress=false);
If your hypertable contains compressed chunks, you need to [decompress each chunk][decompress-chunks] individually before you can turn off compression. ===== PAGE: https://docs.tigerdata.com/use-timescale/compression/modify-compressed-data/ ===== # Inserting or modifying data in the columnstore In TimescaleDB [v2.11.0][tsdb-release-2-11-0] and later, you can use the `UPDATE` and `DELETE` commands to modify existing rows in compressed chunks. This works in a similar way to `INSERT` operations. To reduce the amount of decompression, TimescaleDB only attempts to decompress data where it is necessary. However, if there are no qualifiers, or if the qualifiers cannot be used as filters, calls to `UPDATE` and `DELETE` may convert large amounts of data to the rowstore and back to the columnstore. To avoid large scale conversion, filter on the columns you use to `segementby` and `orderby`. This filters as much data as possible before any data is modified, and reduces the amount of data conversions. DML operations on the columnstore work if the data you are inserting has unique constraints. Constraints are preserved during the insert operation. TimescaleDB uses a Postgres function that decompresses relevant data during the insert to check if the new data breaks unique checks. This means that any time you insert data into the columnstore, a small amount of data is decompressed to allow a speculative insertion, and block any inserts which could violate constraints. For TimescaleDB [v2.17.0][tsdb-release-2-17-0] and later, delete performance is improved on compressed hypertables when a large amount of data is affected. When you delete whole segments of data, filter your deletes by `segmentby` column(s) instead of separate deletes. This considerably increases performance by skipping the decompression step. Since TimescaleDB [v2.21.0][tsdb-release-2-21-0] and later, `DELETE` operations on the columnstore are executed on the batch level, which allows more performant deletion of data of non-segmentby columns and reduces IO usage. ## Earlier versions of TimescaleDB (before v2.11.0) This feature requires Postgres 14 or later From TimescaleDB v2.3.0, you can insert data into compressed chunks with some limitations. The primary limitation is that you can't insert data with unique constraints. Additionally, newly inserted data needs to be compressed at the same time as the data in the chunk, either by a running recompression policy, or by using `recompress_chunk` manually on the chunk. In TimescaleDB v2.2.0 and earlier, you cannot insert data into compressed chunks. ===== PAGE: https://docs.tigerdata.com/use-timescale/jobs/create-and-manage-jobs/ ===== # Create and manage jobs Jobs in TimescaleDB are custom functions or procedures that run on a schedule that you define. This page explains how to create, test, alter, and delete a job. ## Prerequisites To follow the procedure on this page you need to: * Create a [target Tiger Cloud service][create-service]. This procedure also works for [self-hosted TimescaleDB][enable-timescaledb]. ## Create a job To create a job, create a [function][postgres-createfunction] or [procedure][postgres-createprocedure] that you want your database to execute, then set it up to run on a schedule. 1. **Define a function or procedure in the language of your choice** Wrap it in a `CREATE` statement: ```sql CREATE FUNCTION <function_name> (job_id INT DEFAULT NULL, config JSONB DEFAULT NULL) RETURNS VOID DECLARE <declaration>; BEGIN <function_body>; END; $<variable_name>$ LANGUAGE <language>; ``` For example, to create a function that reindexes a table within your database: ```sql CREATE FUNCTION reindex_mytable(job_id INT DEFAULT NULL, config JSONB DEFAULT NULL) RETURNS VOID AS $$ BEGIN REINDEX TABLE mytable; END; $$ LANGUAGE plpgsql; ``` `job_id` and `config` are required arguments in the function signature. This returns `CREATE FUNCTION` to indicate that the function has successfully been created. 1. **Call the function to validate** For example: ```sql select reindex_mytable(); ``` The result looks like this: ```sql reindex_mytable ----------------- (1 row) ``` 1. **Register your job with [`add_job`][api-add_job]** Pass the name of your job, the schedule you want it to run on, and the content of your config. For the `config` value, if you don't need any special configuration parameters, set to `NULL`. For example, to run the `reindex_mytable` function every hour: ```sql SELECT add_job('reindex_mytable', '1h', config => NULL); ``` The call returns a `job_id` and stores it along with `config` in the TimescaleDB catalog. The job runs on the schedule you set. You can also run it manually with [`run_job`][api-run_job] passing `job_id`. When the job runs, `job_id` and `config` are passed as arguments. 1. **Validate the job** List all currently registered jobs with [`timescaledb_information.jobs`][api-timescaledb_information-jobs]: ```sql SELECT * FROM timescaledb_information.jobs; ``` The result looks like this: ```sql job_id | application_name | schedule_interval | max_runtime | max_retries | retry_period | proc_schema | proc_name | owner | scheduled | config | next_start | hypertable_schema | hypertable_name --------+----------------------------+-------------------+-------------+-------------+--------------+-----------------------+------------------+-----------+-----------+------------------------+-------------------------------+-------------------+----------------- 1 | Telemetry Reporter [1] | 24:00:00 | 00:01:40 | -1 | 01:00:00 | _timescaledb_internal | policy_telemetry | postgres | t | | 2022-08-18 06:26:39.524065+00 | | 1000 | User-Defined Action [1000] | 01:00:00 | 00:00:00 | -1 | 00:05:00 | public | reindex_mytable | tsdbadmin | t | | 2022-08-17 07:17:24.831698+00 | | (2 rows) ``` ## Test and debug a job To debug a job, increase the log level and run the job manually with [`run_job`][api-run_job] in the foreground. Because `run_job` is a stored procedure and not a function, run it with [`CALL`][postgres-call] instead of `SELECT`. 1. **Set the minimum log level to `DEBUG1`** ```sql SET client_min_messages TO DEBUG1; ``` 1. **Run the job** Replace `1000` with your `job_id`: ```sql CALL run_job(1000); ``` ## Alter and delete a job Alter an existing job with [`alter_job`][api-alter_job]. You can change both the config and the schedule on which the job runs. 1. **Change a job's config** To replace the entire JSON config for a job, call `alter_job` with a new `config` object. For example, replace the JSON config for a job with ID `1000`: ```sql SELECT alter_job(1000, config => '{"hypertable":"metrics"}'); ``` 1. **Turn off job scheduling** To turn off automatic scheduling of a job, call `alter_job` and set `scheduled`to `false`. You can still run the job manually with `run_job`. For example, turn off the scheduling for a job with ID `1000`: ```sql SELECT alter_job(1000, scheduled => false); ``` 1. **Re-enable automatic scheduling of a job** To re-enable automatic scheduling of a job, call `alter_job` and set `scheduled` to `true`. For example, re-enable scheduling for a job with ID `1000`: ```sql SELECT alter_job(1000, scheduled => true); ``` 1. **Delete a job with [`delete_job`][api-delete_job]** For example, to delete a job with ID `1000`: ```sql SELECT delete_job(1000); ``` ===== PAGE: https://docs.tigerdata.com/use-timescale/hyperfunctions/function-pipelines/ ===== # Function pipelines Function pipelines are an experimental feature, designed to radically improve how you write queries to analyze data in Postgres and SQL. They work by applying principles from functional programming and popular tools like Python Pandas, and PromQL. Experimental features could have bugs. They might not be backwards compatible, and could be removed in future releases. Use these features at your own risk, and do not use any experimental features in production. The `timevector()` function materializes all its data points in memory. This means that if you use it on a very large dataset, it runs out of memory. Do not use the `timevector` function on a large dataset, or in production. SQL is the best language for data analysis, but it is not perfect, and at times it can be difficult to construct the query you want. For example, this query gets data from the last day from the measurements table, sorts the data by the time column, calculates the delta between the values, takes the absolute value of the delta, and then takes the sum of the result of the previous steps:sql SELECT device id, sum(abs_delta) as volatility FROM ( SELECT device_id, abs(val - lag(val) OVER last_day) as abs_delta FROM measurements WHERE ts >= now()-'1 day'::interval) calc_delta GROUP BY device_id;
You can express the same query with a function pipeline like this:sql SELECT device_id,
toolkit_experimental.timevector(ts, val) -> toolkit_experimental.sort() -> toolkit_experimental.delta() -> toolkit_experimental.abs() -> toolkit_experimental.sum() as volatilityFROM measurements WHERE ts >= now()-'1 day'::interval GROUP BY device_id;
Function pipelines are completely SQL compliant, meaning that any tool that speaks SQL is able to support data analysis using function pipelines. ## Anatomy of a function pipeline Function pipelines are built as a series of elements that work together to create your query. The most important part of a pipeline is a custom data type called a `timevector`. The other elements then work on the `timevector` to build your query, using a custom operator to define the order in which the elements are run. ### Timevectors A `timevector` is a collection of time,value pairs with a defined start and end time, that could something like this: <img class="main-content__illustration" width={1375} height={944} src="https://assets.timescale.com/docs/images/timevector.webp" alt="An example timevector"/> Your entire database might have time,value pairs that go well into the past and continue into the future, but the `timevector` has a defined start and end time within that dataset, which could look something like this: <img class="main-content__illustration" width={1375} height={944} src="https://assets.timescale.com/docs/images/timeseries_vector.webp" alt="An example of a timevector within a larger dataset"/> To construct a `timevector` from your data, use a custom aggregate and pass in the columns to become the time,value pairs. It uses a `WHERE` clause to define the limits of the subset, and a `GROUP BY` clause to provide identifying information about the time-series. For example, to construct a `timevector` from a dataset that contains temperatures, the SQL looks like this:sql SELECT device_id, toolkit_experimental.timevector(ts, val) FROM measurements WHERE ts >= now() - '1 day'::interval GROUP BY device_id;
### Custom operator Function pipelines use a single custom operator of `->`. This operator is used to apply and compose multiple functions. The `->` operator takes the inputs on the left of the operator, and applies the operation on the right of the operator. To put it more plainly, you can think of it as "do the next thing." A typical function pipeline could look something like this:sql SELECT device_id, toolkit_experimental.timevector(ts, val)
-> toolkit_experimental.sort() -> toolkit_experimental.delta() -> toolkit_experimental.abs() -> toolkit_experimental.sum() as volatilityFROM measurements WHERE ts >= now() - '1 day'::interval GROUP BY device_id;
While it might look at first glance as though `timevector(ts, val)` operation is an argument to `sort()`, in a pipeline these are all regular function calls. Each of the calls can only operate on the things in their own parentheses, and don't know about anything to the left of them in the statement. Each of the functions in a pipeline returns a custom type that describes the function and its arguments, these are all pipeline elements. The `->` operator performs one of two different types of actions depending on the types on its right and left sides: * Applies a pipeline element to the left hand argument: performing the function described by the pipeline element on the incoming data type directly. * Compose pipeline elements into a combined element that can be applied at some point in the future. This is an optimization that allows you to nest elements to reduce the number of passes that are required. The operator determines the action to perform based on its left and right arguments. ### Pipeline elements There are two main types of pipeline elements: * Transforms change the contents of the `timevector`, returning the updated vector. * Finalizers finish the pipeline and output the resulting data. Transform elements take in a `timevector` and produce a `timevector`. They are the simplest element to compose, because they produce the same type. For example:sql SELECT device_id, toolkit_experimental.timevector(ts, val)
-> toolkit_experimental.sort() -> toolkit_experimental.delta() -> toolkit_experimental.map($$ ($value^3 + $value^2 + $value * 2) $$) -> toolkit_experimental.lttb(100)FROM measurements
Finalizer elements end the `timevector` portion of a pipeline. They can produce an output in a specified format. or they can produce an aggregate of the `timevector`. For example, a finalizer element that produces an output:sql SELECT device_id, toolkit_experimental.timevector(ts, val)
-> toolkit_experimental.sort() -> toolkit_experimental.delta() -> toolkit_experimental.unnest()FROM measurements
Or a finalizer element that produces an aggregate:sql SELECT device_id, toolkit_experimental.timevector(ts, val)
-> toolkit_experimental.sort() -> toolkit_experimental.delta() -> toolkit_experimental.time_weight()FROM measurements
The third type of pipeline elements are aggregate accessors and mutators. These work on a `timevector` in a pipeline, but they also work in regular aggregate queries. An example of using these in a pipeline:sql SELECT percentile_agg(val) -> toolkit_experimental.approx_percentile(0.5) FROM measurements
## Transform elements Transform elements take a `timevector`, and produce a `timevector`. ### Vectorized math functions Vectorized math function elements modify each `value` inside the `timevector` with the specified mathematical function. They are applied point-by-point and they produce a one-to-one mapping from the input to output `timevector`. Each point in the input has a corresponding point in the output, with its `value` transformed by the mathematical function specified. Elements are always applied left to right, so the order of operations is not taken into account even in the presence of explicit parentheses. This means for a `timevector` row `('2020-01-01 00:00:00+00', 20.0)`, this pipeline works:bash timevector('2021-01-01 UTC', 10) -> add(5) -> (mul(2) -> add(1))
And this pipeline works in the same way:bash timevector('2021-01-01 UTC', 10) -> add(5) -> mul(2) -> add(1)
Both of these examples produce `('2020-01-01 00:00:00+00', 31.0)`. If multiple arithmetic operations are needed and precedence is important, consider using a [Lambda](#lambda-elements) instead. ### Unary mathematical functions Unary mathematical function elements apply the corresponding mathematical function to each datapoint in the `timevector`, leaving the timestamp and ordering the same. The available elements are: |Element|Description| |-|-| |`abs()`|Computes the absolute value of each value| |`cbrt()`|Computes the cube root of each value| |`ceil()`|Computes the first integer greater than or equal to each value| |`floor()`|Computes the first integer less than or equal to each value| |`ln()`|Computes the natural logarithm of each value| |`log10()`|Computes the base 10 logarithm of each value| |`round()`|Computes the closest integer to each value| |`sign()`|Computes +/-1 for each positive/negative value| |`sqrt()`|Computes the square root for each value| |`trunc()`|Computes only the integer portion of each value| Even if an element logically computes an integer, `timevectors` only deal with double precision floating point values, so the computed value is the floating point representation of the integer. For example:sql -- NOTE: the (pipeline -> unnest()).* allows for time, value columns to be produced without a subselect SELECT (
toolkit_experimental.timevector(time, value) -> toolkit_experimental.abs() -> toolkit_experimental.unnest()).*FROM (VALUES (TimestampTZ '2021-01-06 UTC', 0.0 ),
( '2021-01-01 UTC', 25.0 ), ( '2021-01-02 UTC', 0.10), ( '2021-01-04 UTC', -10.0 ), ( '2021-01-05 UTC', 3.3 ) ) as v(time, value);The output for this example:sql
time | value------------------------+------- 2021-01-06 00:00:00+00 | 0 2021-01-01 00:00:00+00 | 25 2021-01-02 00:00:00+00 | 0.1 2021-01-04 00:00:00+00 | 10 2021-01-05 00:00:00+00 | 3.3 (5 rows)
### Binary mathematical functions Binary mathematical function elements run the corresponding mathematical function on the `value` in each point in the `timevector`, using the supplied number as the second argument of the function. The available elements are: |Element|Description| |-|-| |`add(N)`|Computes each value plus `N`| |`div(N)`|Computes each value divided by `N`| |`logn(N)`|Computes the logarithm base `N` of each value| |`mod(N)`|Computes the remainder when each number is divided by `N`| |`mul(N)`|Computes each value multiplied by `N`| |`power(N)`|Computes each value taken to the `N` power| |`sub(N)`|Computes each value less `N`| These elements calculate `vector -> power(2)` by squaring all of the `values`, and `vector -> logn(3)` gives the log-base-3 of each `value`. For example:sql SELECT (
toolkit_experimental.timevector(time, value) -> toolkit_experimental.power(2) -> toolkit_experimental.unnest()).*FROM (VALUES (TimestampTZ '2021-01-06 UTC', 0.0 ),
( '2021-01-01 UTC', 25.0 ), ( '2021-01-02 UTC', 0.10), ( '2021-01-04 UTC', -10.0 ), ( '2021-01-05 UTC', 3.3 ) ) as v(time, value);The output for this example:sql
time | value------------------------+---------------------- 2021-01-06 00:00:00+00 | 0 2021-01-01 00:00:00+00 | 625 2021-01-02 00:00:00+00 | 0.010000000000000002 2021-01-04 00:00:00+00 | 100 2021-01-05 00:00:00+00 | 10.889999999999999 (5 rows)
### Compound transforms Mathematical transforms are applied only to the `value` in each point in a `timevector` and always produce one-to-one output `timevectors`. Compound transforms can involve both the `time` and `value` parts of the points in the `timevector`, and they are not necessarily one-to-one. One or more points in the input can be used to produce zero or more points in the output. So, where mathematical transforms always produce `timevectors` of the same length, compound transforms can produce larger or smaller `timevectors` as an output. #### Delta transforms A `delta()` transform calculates the difference between consecutive `values` in the `timevector`. The first point in the `timevector` is omitted as there is no previous value and it cannot have a `delta()`. Data should be sorted using the `sort()` element before passing into `delta()`. For example:sql SELECT (
toolkit_experimental.timevector(time, value) -> toolkit_experimental.sort() -> toolkit_experimental.delta() -> toolkit_experimental.unnest()).*FROM (VALUES (TimestampTZ '2021-01-06 UTC', 0.0 ),
( '2021-01-01 UTC', 25.0 ), ( '2021-01-02 UTC', 0.10), ( '2021-01-04 UTC', -10.0 ), ( '2021-01-05 UTC', 3.3 ) ) as v(time, value);The output for this example:sql
time | value------------------------+------- 2021-01-02 00:00:00+00 | -24.9 2021-01-04 00:00:00+00 | -10.1 2021-01-05 00:00:00+00 | 13.3 2021-01-06 00:00:00+00 | -3.3 (4 rows)
The first row of the output is missing, as there is no way to compute a delta without a previous value. #### Fill method transform The `fill_to()` transform ensures that there is a point at least every `interval`, if there is not a point, it fills in the point using the method provided. The `timevector` must be sorted before calling `fill_to()`. The available fill methods are: |fill_method|description| |-|-| |LOCF|Last object carried forward, fill with last known value prior to the hole| |Interpolate|Fill the hole using a collinear point with the first known value on either side| |Linear|This is an alias for interpolate| |Nearest|Fill with the matching value from the closer of the points preceding or following the hole| For example:sql SELECT (
toolkit_experimental.timevector(time, value) -> toolkit_experimental.sort() -> toolkit_experimental.fill_to('1 day', 'LOCF') -> toolkit_experimental.unnest()).*FROM (VALUES (TimestampTZ '2021-01-06 UTC', 0.0 ),
( '2021-01-01 UTC', 25.0 ), ( '2021-01-02 UTC', 0.10), ( '2021-01-04 UTC', -10.0 ), ( '2021-01-05 UTC', 3.3 ) ) as v(time, value);The output for this example:sql
time | value------------------------+------- 2021-01-01 00:00:00+00 | 25 2021-01-02 00:00:00+00 | 0.1 2021-01-03 00:00:00+00 | 0.1 2021-01-04 00:00:00+00 | -10 2021-01-05 00:00:00+00 | 3.3 2021-01-06 00:00:00+00 | 0 (6 rows)
#### Largest triangle three buckets (LTTB) transform The largest triangle three buckets (LTTB) transform uses the LTTB graphical downsampling algorithm to downsample a `timevector` to the specified resolution while maintaining visual acuity. <!---- Insert example here. --LKB 2021-10-19--> #### Sort transform The `sort()` transform sorts the `timevector` by time, in ascending order. This transform is ignored if the `timevector` is already sorted. For example:sql SELECT (
toolkit_experimental.timevector(time, value) -> toolkit_experimental.sort() -> toolkit_experimental.unnest()).*FROM (VALUES (TimestampTZ '2021-01-06 UTC', 0.0 ),
( '2021-01-01 UTC', 25.0 ), ( '2021-01-02 UTC', 0.10), ( '2021-01-04 UTC', -10.0 ), ( '2021-01-05 UTC', 3.3 ) ) as v(time, value);The output for this example:sql
time | value------------------------+------- 2021-01-01 00:00:00+00 | 25 2021-01-02 00:00:00+00 | 0.1 2021-01-04 00:00:00+00 | -10 2021-01-05 00:00:00+00 | 3.3 2021-01-06 00:00:00+00 | 0 (5 rows)
### Lambda elements The Lambda element functions use the Toolkit's experimental Lambda syntax to transform a `timevector`. A Lambda is an expression that is applied to the elements of a `timevector`. It is written as a string, usually `$$`-quoted, containing the expression to run. For example:sql $$ let $is_relevant = $time > '2021-01-01't and $time < '2021-10-14't; let $is_significant = abs(round($value)) >= 0; $is_relevant and $is_significant $$
A Lambda expression can be constructed using these components: * **Variable declarations** such as `let $foo = 3; $foo * $foo`. Variable declarations end with a semicolon. All Lambdas must end with an expression, this does not have a semicolon. Multiple variable declarations can follow one another, for example: `let $foo = 3; let $bar = $foo * $foo; $bar * 10` * **Variable names** such as `$foo`. They must start with a `$` symbol. The variables `$time` and `$value` are reserved; they refer to the time and value of the point in the vector the Lambda expression is being called on. * **Function calls** such as `abs($foo)`. Most mathematical functions are supported. * **Binary operations** containing the arithmetic binary operators `and`, `or`, `=`, `!=`, `<`, `<=`, `>`, `>=`, `^`, `*`, `/`, `+`, and `-` are supported. * **Interval literals** are expressed with a trailing `i`. For example, `'1 day'i`. Except for the trailing `i`, these follow the Postgres `INTERVAL` input format. * **Time literals** such as `'2021-01-02 03:00:00't` expressed with a trailing `t`. Except for the trailing `t` these follow the Postgres `TIMESTAMPTZ` input format. * **Number literals** such as `42`, `0.0`, `-7`, or `1e2`. Lambdas follow a grammar that is roughly equivalent to EBNF. For example:ebnf Expr = ('let' Variable '=' Tuple ';')* Tuple Tuple = Binops (',' Binops)* Binops = Unaryops (Binop Unaryops)* UnaryOps = ('-' | 'not') UnaryOps | Term Term = Variable | Time | Interval | Number | Function | '(' Expr ')' Function = FunctionName '(' (Binops ',')* ')' Variable = ? described above ? Time = ? described above ? Interval = ? described above ? Number = ? described above ?
#### Map Lambda The `map()` Lambda maps each element of the `timevector`. This Lambda must return either a `DOUBLE PRECISION`, where only the values of each point in the `timevector` is altered, or a `(TIMESTAMPTZ, DOUBLE PRECISION)`, where both the times and values are changed. An example of the `map()` Lambda with a `DOUBLE PRECISION` return:sql SELECT ( toolkit_experimental.timevector(time, value) -> toolkit_experimental.map($$ $value + 1 $$) -> toolkit_experimental.unnest()).* FROM (VALUES (TimestampTZ '2021-01-06 UTC', 0.0 ),
( '2021-01-01 UTC', 25.0 ), ( '2021-01-02 UTC', 0.10), ( '2021-01-04 UTC', -10.0 ), ( '2021-01-05 UTC', 3.3 ) ) as v(time, value);The output for this example:sql
time | value------------------------+------- 2021-01-06 00:00:00+00 | 1 2021-01-01 00:00:00+00 | 26 2021-01-02 00:00:00+00 | 1.1 2021-01-04 00:00:00+00 | -9 2021-01-05 00:00:00+00 | 4.3 (5 rows)
An example of the `map()` Lambda with a `(TIMESTAMPTZ, DOUBLE PRECISION)` return:sql SELECT ( toolkit_experimental.timevector(time, value) -> toolkit_experimental.map($$ ($time + '1day'i, $value * 2) $$) -> toolkit_experimental.unnest()).* FROM (VALUES (TimestampTZ '2021-01-06 UTC', 0.0 ),
( '2021-01-01 UTC', 25.0 ), ( '2021-01-02 UTC', 0.10), ( '2021-01-04 UTC', -10.0 ), ( '2021-01-05 UTC', 3.3 ) ) as v(time, value);The output for this example:sql
time | value------------------------+------- 2021-01-07 00:00:00+00 | 0 2021-01-02 00:00:00+00 | 50 2021-01-03 00:00:00+00 | 0.2 2021-01-05 00:00:00+00 | -20 2021-01-06 00:00:00+00 | 6.6 (5 rows)
#### Filter Lambda The `filter()` Lambda filters a `timevector` based on a Lambda expression that returns `true` for every point that should stay in the `timevector` timeseries, and `false` for every point that should be removed. For example:sql SELECT ( toolkit_experimental.timevector(time, value) -> toolkit_experimental.filter($$ $time != '2021-01-01't AND $value > 0 $$) -> toolkit_experimental.unnest()).* FROM (VALUES (TimestampTZ '2021-01-06 UTC', 0.0 ),
( '2021-01-01 UTC', 25.0 ), ( '2021-01-02 UTC', 0.10), ( '2021-01-04 UTC', -10.0 ), ( '2021-01-05 UTC', 3.3 ) ) as v(time, value);The output for this example:sql
time | value------------------------+------- 2021-01-02 00:00:00+00 | 0.1 2021-01-05 00:00:00+00 | 3.3 (2 rows)
## Finalizer elements Finalizer elements complete the function pipeline, and output a value or an aggregate. ### Output element You can finalize a pipeline with a `timevector` output element. These are used at the end of a pipeline to return a `timevector`. This can be useful if you need to use them in another pipeline later on. The two types of output are: * `unnest()`, which returns a set of `(TimestampTZ, DOUBLE PRECISION)` pairs. * `materialize()`, which forces the pipeline to materialize a `timevector`. This blocks any optimizations that lazily materialize a `timevector`. ### Aggregate output elements These elements take a `timevector` and run the corresponding aggregate over it to produce a result.. The possible elements are: * `average()` * `integral()` * `counter_agg()` * `hyperloglog()` * `stats_agg()` * `sum()` * `num_vals()` An example of an aggregate output using `num_vals()`:sql SELECT toolkit_experimental.timevector(time, value) -> toolkit_experimental.num_vals() FROM (VALUES (TimestampTZ '2021-01-06 UTC', 0.0 ),
( '2021-01-01 UTC', 25.0 ), ( '2021-01-02 UTC', 0.10), ( '2021-01-04 UTC', -10.0 ), ( '2021-01-05 UTC', 3.3 ) ) as v(time, value);The output for this example:sql
?column?
5(1 row)
An example of an aggregate output using `stats_agg()`:sql SELECT
toolkit_experimental.timevector(time, value) -> toolkit_experimental.stats_agg() -> toolkit_experimental.stddev()FROM (VALUES (TimestampTZ '2021-01-06 UTC', 0.0 ),
( '2021-01-01 UTC', 25.0 ), ( '2021-01-02 UTC', 0.10), ( '2021-01-04 UTC', -10.0 ), ( '2021-01-05 UTC', 3.3 ) ) as v(time, value);The output for this example:sql
?column?
12.924666339987272 (1 row)
## Aggregate accessors and mutators Aggregate accessors and mutators work in function pipelines in the same way as they do in other aggregates. You can use them to get a value from the aggregate part of a function pipeline. For example:sql SELECT device_id, timevector(ts, val) -> sort() -> delta() -> stats_agg() -> variance() FROM measurements
When you use them in a pipeline instead of standard function accessors and mutators, they can make the syntax clearer by getting rid of nested functions. For example, the nested syntax looks like this:sql SELECT approx_percentile(0.5, percentile_agg(val)) FROM measurements
Using a function pipeline with the `->` operator instead looks like this:sql SELECT percentile_agg(val) -> approx_percentile(0.5) FROM measurements
### Counter aggregates Counter aggregates handle resetting counters. Counters are a common type of metric in application performance monitoring and metrics. All values have resets accounted for. These elements must have a `CounterSummary` to their left when used in a pipeline, from a `counter_agg()` aggregate or pipeline element. The available counter aggregate functions are: |Element|Description| |-|-| |`counter_zero_time()`|The time at which the counter value is predicted to have been zero based on the least squares fit of the points input to the `CounterSummary`(x intercept)| |`corr()`|The correlation coefficient of the least squares fit line of the adjusted counter value| |`delta()`|Computes the last - first value of the counter| |`extrapolated_delta(method)`|Computes the delta extrapolated using the provided method to bounds of range. Bounds must have been provided in the aggregate or a `with_bounds` call.| |`idelta_left()`/`idelta_right()`|Computes the instantaneous difference between the second and first points (left) or last and next-to-last points (right)| |`intercept()`|The y-intercept of the least squares fit line of the adjusted counter value| |`irate_left()`/`irate_right()`|Computes the instantaneous rate of change between the second and first points (left) or last and next-to-last points (right)| |`num_changes()`|Number of times the counter changed values| |`num_elements()`|Number of items - any with the exact same time have been counted only once| |`num_changes()`|Number of times the counter reset| |`slope()`|The slope of the least squares fit line of the adjusted counter value| |`with_bounds(range)`|Applies bounds using the `range` (a `TSTZRANGE`) to the `CounterSummary` if they weren't provided in the aggregation step| ### Percentile approximation Percentile approximation aggregate accessors are used to approximate percentiles. Currently, only accessors are implemented for `percentile_agg` and `uddsketch` based aggregates. We have not yet implemented the pipeline aggregate for percentile approximation with `tdigest`. |Element|Description| |---|---| |`approx_percentile(p)`| The approximate value at percentile `p` | |`approx_percentile_rank(v)`|The approximate percentile a value `v` would fall in| |`error()`|The maximum relative error guaranteed by the approximation| |`mean()`| The exact average of the input values.| |`num_vals()`| The number of input values| ### Statistical aggregates Statistical aggregate accessors add support for common statistical aggregates. These allow you to compute and `rollup()` common statistical aggregates like `average` and `stddev`, more advanced aggregates like `skewness`, and two-dimensional aggregates like `slope` and `covariance`. Because there are both single-dimensional and two-dimensional versions of these, the accessors can have multiple forms. For example, `average()` calculates the average on a single-dimension aggregate, while `average_y()` and `average_x()` calculate the average on each of two dimensions. The available statistical aggregates are: |Element|Description| |-|-| |`average()/average_y()/average_x()`|The average of the values| |`corr()`|The correlation coefficient of the least squares fit line| |`covariance(method)`|The covariance of the values using either `population` or `sample` method| | `determination_coeff()`|The determination coefficient (or R squared) of the values| |`kurtosis(method)/kurtosis_y(method)/kurtosis_x(method)`|The kurtosis (fourth moment) of the values using either the `population` or `sample` method| |`intercept()`|The intercept of the least squares fit line| |`num_vals()`|The number of values seen| |`skewness(method)/skewness_y(method)/skewness_x(method)`|The skewness (third moment) of the values using either the `population` or `sample` method| |`slope()`|The slope of the least squares fit line| |`stddev(method)/stddev_y(method)/stddev_x(method)`|The standard deviation of the values using either the `population` or `sample` method| |`sum()`|The sum of the values| |`variance(method)/variance_y(method)/variance_x(method)`|The variance of the values using either the `population` or `sample` method| |`x_intercept()`|The x intercept of the least squares fit line| ### Time-weighted averages aggregates The `average()` accessor can be called on the output of a `time_weight()`. For example:sql SELECT time_weight('Linear', ts, val) -> average() FROM measurements;
### Approximate count distinct aggregates This is an approximation for distinct counts. The `distinct_count()` accessor can be called on the output of a `hyperloglog()`. For example:sql SELECT hyperloglog(device_id) -> distinct_count() FROM measurements;
## Formatting timevectors You can turn a timevector into a formatted text representation. There are two functions for turning a timevector to text: * [`to_text`](#to-text), which allows you to specify the template * [`to_plotly`](#to-plotly), which outputs a format suitable for use with the [Plotly JSON chart schema][plotly] ### `to_text`sql toolkit_experimental.to_text(
timevector(time, value), format_string)
This function produces a text representation, formatted according to the `format_string`. The format string can use any valid Tera template syntax, and it can include any of the built-in variables: * `TIMES`: All the times in the timevector, as an array * `VALUES`: All the values in the timevector, as an array * `TIMEVALS`: All the time-value pairs in the timevector, formatted as `{"time": $TIME, "val": $VAL}`, as an array For example, given this table of data:sql CREATE TABLE data(time TIMESTAMPTZ, value DOUBLE PRECISION);
INSERT INTO data VALUES
('2020-1-1', 30.0), ('2020-1-2', 45.0), ('2020-1-3', NULL), ('2020-1-4', 55.5), ('2020-1-5', 10.0);You can use a format string with `TIMEVALS` to produce the following text:sql SELECT toolkit_experimental.to_text(
timevector(time, value), '{{TIMEVALS}}') FROM data;
txt [{\"time\": \"2020-01-01 00:00:00+00\", \"val\": 30}, {\"time\": \"2020-01-02 00:00:00+00\", \"val\": 45}, {\"time\": \"2020-01-03 00:00:00+00\", \"val\": null}, {\"time\": \"2020-01-04 00:00:00+00\", \"val\": 55.5}, {\"time\": \"2020-01-05 00:00:00+00\", \"val\": 10} ]
Or you can use a format string with `TIMES` and `VALUES` to produce the following text:sql SELECT toolkit_experimental.to_text(
timevector(time,value), '{\"times\": {{ TIMES }}, \"vals\": {{ VALUES }}}') FROM data
txt {\"times\": [\"2020-01-01 00:00:00+00\",\"2020-01-02 00:00:00+00\",\"2020-01-03 00:00:00+00\",\"2020-01-04 00:00:00+00\",\"2020-01-05 00:00:00+00\"], \"vals\": [\"30\",\"45\",\"null\",\"55.5\",\"10\"]}
### `to_plotly` This function produces a text representation, formatted for use with Plotly. For example, given this table of data:sql CREATE TABLE data(time TIMESTAMPTZ, value DOUBLE PRECISION);
INSERT INTO data VALUES
('2020-1-1', 30.0), ('2020-1-2', 45.0), ('2020-1-3', NULL), ('2020-1-4', 55.5), ('2020-1-5', 10.0);You can produce the following Plotly-compatible text:sql SELECT toolkit_experimental.to_plotly(
timevector(time, value)) FROM data;
txt {\"times\": [\"2020-01-01 00:00:00+00\",\"2020-01-02 00:00:00+00\",\"2020-01-03 00:00:00+00\",\"2020-01-04 00:00:00+00\",\"2020-01-05 00:00:00+00\"], \"vals\": [\"30\",\"45\",\"null\",\"55.5\",\"10\"]}
## All function pipeline elements This table lists all function pipeline elements in alphabetical order: |Element|Category|Output| |-|-|-| |`abs()`|Unary Mathematical|`timevector` pipeline| |`add(val DOUBLE PRECISION)`|Binary Mathematical|`timevector` pipeline| |`average()`|Aggregate Finalizer|DOUBLE PRECISION| |`cbrt()`|Unary Mathematical| `timevector` pipeline| |`ceil()`|Unary Mathematical| `timevector` pipeline| |`counter_agg()`|Aggregate Finalizer| `CounterAgg`| |`delta()`|Compound|`timevector` pipeline| |`div`|Binary Mathematical|`timevector` pipeline| |`fill_to`|Compound|`timevector` pipeline| |`filter`|Lambda|`timevector` pipeline| |`floor`|Unary Mathematical|`timevector` pipeline| |`hyperloglog`|Aggregate Finalizer|HyperLogLog| |`ln`|Unary Mathematical|`timevector` pipeline| |`log10`|Unary Mathematical|`timevector` pipeline| |`logn`|Binary Mathematical|`timevector` pipeline| |`lttb`|Compound|`timevector` pipeline| |`map`|Lambda|`timevector` pipeline| |`materialize`|Output|`timevector` pipeline| |`mod`|Binary Mathematical|`timevector` pipeline| |`mul`|Binary Mathematical|`timevector` pipeline| |`num_vals`|Aggregate Finalizer|BIGINT| |`power`|Binary Mathematical|`timevector` pipeline| |`round`|Unary Mathematical|`timevector` pipeline| |`sign`|Unary Mathematical|`timevector` pipeline| |`sort`|Compound|`timevector` pipeline| |`sqrt`|Unary Mathematical|`timevector` pipeline| |`stats_agg`|Aggregate Finalizer|StatsSummary1D| |`sub`|Binary Mathematical|`timevector` pipeline| |`sum`|Aggregate Finalizer|`timevector` pipeline| |`trunc`|Unary Mathematical|`timevector` pipeline| |`unnest`|Output|`TABLE (time TIMESTAMPTZ, value DOUBLE PRECISION)`| ===== PAGE: https://docs.tigerdata.com/use-timescale/hyperfunctions/time-weighted-averages/ ===== # Time-weighted averages and integrals Time weighted averages and integrals are used in cases where a time series is not evenly sampled. Time series data points are often evenly spaced, for example every 30 seconds, or every hour. But sometimes data points are recorded irregularly, for example if a value has a large change, or changes quickly. Computing an average using data that is not evenly sampled is not always useful. For example, if you have a lot of ice cream in freezers, you need to make sure the ice cream stays within a 0-10℉ (-20 to -12℃) temperature range. The temperature in the freezer can vary if folks are opening and closing the door, but the ice cream only has a problem if the temperature is out of range for a long time. You can set your sensors in the freezer to sample every five minutes while the temperature is in range, and every 30 seconds while the temperature is out of range. If the results are generally stable, but with some quick moving transients, an average of all the data points weights the transient values too highly. A time weighted average weights each value by the duration over which it occurred based on the points around it, producing much more accurate results. Time weighted integrals are useful when you need a time-weighted sum of irregularly sampled data. For example, if you bill your users based on irregularly sampled CPU usage, you need to find the total area under the graph of their CPU usage. You can use a time-weighted integral to find the total CPU-hours used by a user over a given time period. * For more information about how time-weighted averages work, read our [time-weighted averages blog][blog-timeweight]. * For more information about time-weighted average API calls, see the [hyperfunction API documentation][hyperfunctions-api-timeweight]. ===== PAGE: https://docs.tigerdata.com/use-timescale/hyperfunctions/about-hyperfunctions/ ===== # About TimescaleDB hyperfunctions TimescaleDB hyperfunctions are a specialized set of functions that power real-time analytics on time series and events. IoT devices, IT systems, marketing analytics, user behavior, financial metrics, cryptocurrency - these are only a few examples of domains where hyperfunctions can make a huge difference. Hyperfunctions provide you with meaningful, actionable insights in real time. Tiger Cloud includes all hyperfunctions by default, while self-hosted TimescaleDB includes a subset of them. For additional hyperfunctions, install the [TimescaleDB Toolkit][install-toolkit] Postgres extension. ## Available hyperfunctions Here is a list of all the hyperfunctions provided by TimescaleDB. Hyperfunctions with a tick in the `Toolkit` column require an installation of TimescaleDB Toolkit for self-hosted deployments. Hyperfunctions with a tick in the `Experimental` column are still under development. Experimental features could have bugs. They might not be backwards compatible, and could be removed in future releases. Use these features at your own risk, and do not use any experimental features in production. When you upgrade the `timescaledb` extension, the experimental schema is removed by default. To use experimental features after an upgrade, you need to add the experimental schema again. <HyperfunctionTable includeExperimental /> For more information about each of the API calls listed in this table, see the [hyperfunction API documentation][api-hyperfunctions]. ## Function pipelines Function pipelines are an experimental feature, designed to radically improve the developer ergonomics of analyzing data in Postgres and SQL, by applying principles from functional programming and popular tools like Python's Pandas, and PromQL. SQL is the best language for data analysis, but it is not perfect, and at times can get quite unwieldy. For example, this query gets data from the last day from the measurements table, sorts the data by the time column, calculates the delta between the values, takes the absolute value of the delta, and then takes the sum of the result of the previous steps:SQL SELECT device id, sum(abs_delta) as volatility FROM ( SELECT device_id, abs(val - lag(val) OVER last_day) as abs_delta FROM measurements WHERE ts >= now()-'1 day'::interval) calc_delta GROUP BY device_id;
You can express the same query with a function pipeline like this:SQL SELECT device_id, timevector(ts, val) -> sort() -> delta() -> abs() -> sum() as volatility FROM measurements WHERE ts >= now()-'1 day'::interval GROUP BY device_id;
Function pipelines are completely SQL compliant, meaning that any tool that speaks SQL is able to support data analysis using function pipelines. For more information about how function pipelines work, read our [blog post][blog-function-pipelines]. ## Toolkit feature development TimescaleDB Toolkit features are developed in the open. As features are developed they are categorized as experimental, beta, stable, or deprecated. This documentation covers the stable features, but more information on our experimental features in development can be found in the [Toolkit repository][gh-docs]. ## Contribute to TimescaleDB Toolkit We want and need your feedback! What are the frustrating parts of analyzing time-series data? What takes far more code than you feel it should? What runs slowly, or only runs quickly after many rewrites? We want to solve community-wide problems and incorporate as much feedback as possible. * Join the [discussion][gh-discussions]. * Check out the [proposed features][gh-proposed]. * Explore the current [feature requests][gh-requests]. * Add your own [feature request][gh-newissue]. ===== PAGE: https://docs.tigerdata.com/use-timescale/hyperfunctions/approx-count-distincts/ ===== # Approximate count distincts Approximate count distincts are typically used to find the number of unique values, or cardinality, in a large dataset. When you calculate cardinality in a dataset, the time it takes to process the query is proportional to how large the dataset is. So if you wanted to find the cardinality of a dataset that contained only 20 entries, the calculation would be very fast. Finding the cardinality of a dataset that contains 20 million entries, however, can take a significant amount of time and compute resources. Approximate count distincts do not calculate the exact cardinality of a dataset, but rather estimate the number of unique values, to reduce memory consumption and improve compute time by avoiding spilling the intermediate results to the secondary storage. ===== PAGE: https://docs.tigerdata.com/use-timescale/hyperfunctions/gapfilling-interpolation/ ===== # Gapfilling and interpolation Most time-series data analysis techniques aggregate data into fixed time intervals, which smooths the data and makes it easier to interpret and analyze. When you write queries for data in this form, you need an efficient way to aggregate raw observations, which are often noisy and irregular, in to fixed time intervals. TimescaleDB does this using time bucketing, which gives a clear picture of the important data trends using a concise, declarative SQL query. Sorting data into time buckets works well in most cases, but problems can arise if there are gaps in the data. This can happen if you have irregular sampling intervals, or you have experienced an outage of some sort. You can use a gapfilling function to create additional rows of data in any gaps, ensuring that the returned rows are in chronological order, and contiguous. * For more information about how gapfilling works, read our [gapfilling blog][blog-gapfilling]. * For more information about gapfilling and interpolation API calls, see the [hyperfunction API documentation][hyperfunctions-api-gapfilling]. ===== PAGE: https://docs.tigerdata.com/use-timescale/hyperfunctions/approximate-percentile/ ===== # Approximate percentiles TimescaleDB uses approximation algorithms to calculate a percentile without requiring all of the data. This also makes them more compatible with continuous aggregates. By default, TimescaleDB Toolkit uses `uddsketch`, but you can also choose to use `tdigest`. For more information about these algorithms, see the [advanced aggregation methods][advanced-agg] documentation. ## Run an approximate percentage query In this procedure, we use an example table called `response_times` that contains information about how long a server takes to respond to API calls. ### Running an approximate percentage query 1. At the `psql` prompt, create a continuous aggregate that computes the daily aggregates: ```sql CREATE MATERIALIZED VIEW response_times_daily WITH (timescaledb.continuous) AS SELECT time_bucket('1 day'::interval, ts) as bucket, percentile_agg(response_time_ms) FROM response_times GROUP BY 1; ``` 1. Re-aggregate the aggregate to get the last 30 days, and look for the ninety-fifth percentile: ```sql SELECT approx_percentile(0.95, percentile_agg) as threshold FROM response_times_daily WHERE bucket >= time_bucket('1 day'::interval, now() - '30 days'::interval); ``` 1. You can also create an alert: ```sql WITH t as (SELECT approx_percentile(0.95, percentile_agg(percentile_agg)) as threshold FROM response_times_daily WHERE bucket >= time_bucket('1 day'::interval, now() - '30 days'::interval)) SELECT count(*) FROM response_times WHERE ts > now()- '1 minute'::interval AND response_time_ms > (SELECT threshold FROM t); ``` For more information about percentile approximation API calls, see the [hyperfunction API documentation][hyperfunctions-api-approx-percentile]. ===== PAGE: https://docs.tigerdata.com/use-timescale/hyperfunctions/index/ ===== # Hyperfunctions Real-time analytics demands more than basic SQL functions, efficient computation becomes essential as datasets grow in size and complexity. That’s where TimescaleDB hyperfunctions come in: high-performance, SQL-native functions purpose-built for time-series analysis. They are designed to process, aggregate, and analyze large volumes of data with maximum efficiency while maintaining consistently high performance. With hyperfunctions, you can run sophisticated analytical queries and extract meaningful insights in real time. Hyperfunctions introduce partial aggregation, letting TimescaleDB store intermediate states instead of raw data or final results. These partials can be merged later for rollups (consolidation), eliminating costly reprocessing and slashing compute overhead, especially when paired with continuous aggregates. Take tracking p95 latency across thousands of app instances as an example: - With standard SQL, every rollup requires rescanning and resorting massive datasets. - With TimescaleDB, the `percentile_agg` hyperfunction stores a compact state per minute, which you simply merge to get hourly or daily percentiles—no full reprocess needed.  The result? Scalable, real-time percentile analytics that deliver fast, accurate insights across high-ingest, high-resolution data, while keeping resource use lean. Tiger Cloud includes all hyperfunctions by default, while self-hosted TimescaleDB includes a subset of them. To include all hyperfunctions with TimescaleDB, install the [TimescaleDB Toolkit][install-toolkit] Postgres extension on your self-hosted Postgres deployment. For more information, read the [hyperfunctions blog post][hyperfunctions-blog]. ## Learn hyperfunction basics and install TimescaleDB Toolkit * [Learn about hyperfunctions][about-hyperfunctions] to understand how they work before using them. * Install the [TimescaleDB Toolkit extension][install-toolkit] to access more hyperfunctions on self-hosted TimescaleDB. ## Browse hyperfunctions and TimescaleDB Toolkit features by category ===== PAGE: https://docs.tigerdata.com/use-timescale/hyperfunctions/hyperloglog/ ===== # Hyperloglog Hyperloglog is typically used to find the cardinality of very large datasets. If you want to find the number of unique values, or cardinality, in a dataset, the time it takes to process this query is proportional to how large the dataset is. So if you wanted to find the cardinality of a dataset that contained only 20 entries, the calculation would be very fast. Finding the cardinality of a dataset that contains 20 million entries, however, can take a significant amount of time and compute resources. Hyperloglog does not calculate the exact cardinality of a dataset, but rather estimates the number of unique values. It does this by converting the original data into a hash of random numbers that represents the cardinality of the dataset. This is not a perfect calculation of the cardinality, but it is usually within a margin of error of 2%. The benefit of hyperloglog on time-series data is that it can continue to calculate the approximate cardinality of a dataset as it changes over time. It does this by adding an entry to the hyperloglog hash as new data is retrieved, rather than recalculating the result for the entire dataset every time it is needed. This makes it an ideal candidate for using with continuous aggregates. For more information about approximate count distinct API calls, see the [hyperfunction API documentation][hyperfunctions-api-approx-count-distincts]. ===== PAGE: https://docs.tigerdata.com/use-timescale/hyperfunctions/time-bucket-gapfill/ ===== # Time bucket gapfill Sometimes data sorted into time buckets can have gaps. This can happen if you have irregular sampling intervals, or you have experienced an outage of some sort. If you have a time bucket that has no data at all, the average returned from the time bucket is NULL, which could cause problems. You can use a gapfilling function to create additional rows of data in any gaps, ensuring that the returned rows are in chronological order, and contiguous. The time bucket gapfill function creates a contiguous set of time buckets but does not fill the rows with data. You can create data for the new rows using another function, such as last observation carried forward (LOCF), or interpolation. For more information about gapfilling and interpolation API calls, see the [hyperfunction API documentation][hyperfunctions-api-gapfilling]. ===== PAGE: https://docs.tigerdata.com/use-timescale/hyperfunctions/percentile-approx/ ===== # Percentile approximation In general, percentiles are useful for understanding the distribution of data. The fiftieth percentile is the point at which half of your data is greater and half is lesser. The tenth percentile is the point at which 90% of the data is greater, and 10% is lesser. The ninety-ninth percentile is the point at which 1% is greater, and 99% is lesser. The fiftieth percentile, or median, is often a more useful measure than the average, especially when your data contains outliers. Outliers can dramatically change the average, but do not affect the median as much. For example, if you have three rooms in your house and two of them are 40℉ (4℃) and one is 130℉ (54℃), the average room temperature is 70℉ (21℃), which doesn't tell you much. However, the fiftieth percentile temperature is 40℉ (4℃), which tells you that at least half your rooms are at refrigerator temperatures (also, you should probably get your heating checked!) Percentiles are sometimes avoided because calculating them requires more CPU and memory than an average or other aggregate measures. This is because an exact computation of the percentile needs the full dataset as an ordered list. TimescaleDB uses approximation algorithms to calculate a percentile without requiring all of the data. This also makes them more compatible with continuous aggregates. By default, TimescaleDB uses `uddsketch`, but you can also choose to use `tdigest`. For more information about these algorithms, see the [advanced aggregation methods][advanced-agg] documentation. Technically, a percentile divides a group into 100 equally sized pieces, while a quantile divides a group into an arbitrary number of pieces. Because we don't always use exactly 100 buckets, "quantile" is the more technically correct term in this case. However, we use the word "percentile" because it's a more common word for this type of function. * For more information about how percentile approximation works, read our [percentile approximation blog][blog-percentile-approx]. * For more information about percentile approximation API calls, see the [hyperfunction API documentation][hyperfunctions-api-approx-percentile]. ===== PAGE: https://docs.tigerdata.com/use-timescale/hyperfunctions/advanced-agg/ ===== # Percentile approximation advanced aggregation methods TimescaleDB uses approximation algorithms to calculate a percentile without requiring all of the data. This also makes them more compatible with continuous aggregates. By default, TimescaleDB uses `uddsketch`, but you can also choose to use `tdigest`. This section describes the different methods, and helps you to decide which one you should use. `uddsketch` is the default algorithm. It uses exponentially sized buckets to guarantee the approximation falls within a known error range, relative to the true discrete percentile. This algorithm offers the ability to tune the size and maximum error target of the sketch. `tdigest` buckets data more aggressively toward the center of the quantile range, giving it greater accuracy at the tails of the range, around 0.001 or 0.995. ## Choose the right algorithm Each algorithm has different features, which can make one better than another depending on your use case. Here are some of the differences to consider when choosing an algorithm: Before you begin, it is important to understand that the formal definition for a percentile is imprecise, and there are different methods for determining what the true percentile actually is. In Postgres, given a target percentile `p`, [`percentile_disc`][pg-percentile] returns the smallest element of a set, so that `p` percent of the set is less than that element. However, [`percentile_cont`][pg-percentile] returns an interpolated value between the two nearest matches for `p`. In practice, the difference between these methods is very small but, if it matters to your use case, keep in mind that `tdigest` approximates the continuous percentile, while `uddsketch` provides an estimate of the discrete value. Think about the types of percentiles you're most interested in. `tdigest` is optimized for more accurate estimates at the extremes, and less accurate estimates near the median. If your workflow involves estimating ninety-ninth percentiles, then choose `tdigest`. If you're more concerned about getting highly accurate median estimates, choose `uddsketch`. The algorithms differ in the way they estimate data. `uddsketch` has a stable bucketing function, so it always returns the same percentile estimate for the same underlying data, regardless of how it is ordered or re-aggregated. On the other hand, `tdigest` builds up incremental buckets based on the average of nearby points, which can result in some subtle differences in estimates based on the same data unless the order and batching of the aggregation is strictly controlled, which is sometimes difficult to do in Postgres. If stable estimates are important to you, choose `uddsketch`. Calculating precise error bars for `tdigest` can be difficult, especially when merging multiple sub-digests into a larger one. This can occur through summary aggregation, or parallelization of the normal point aggregate. If you need to tightly characterize your errors, choose `uddsketch`. However, because `uddsketch` uses exponential bucketing to provide a guaranteed relative error, it can cause some wildly varying absolute errors if the dataset covers a large range. For example, if the data is evenly distributed over the range `[1,100]`, estimates at the high end of the percentile range have about 100 times the absolute error of those at the low end of the range. This gets much more extreme if the data range is `[0,100]`. If having a stable absolute error is important to your use case, choose `tdigest`. While both algorithms are likely to get smaller and faster with future optimizations, `uddsketch` generally requires a smaller memory footprint than `tdigest`, and a correspondingly smaller disk footprint for any continuous aggregates. Regardless of the algorithm you choose, the best way to improve the accuracy of your percentile estimates is to increase the number of buckets, which is simpler to do with `uddsketch`. If your use case does not get a clear benefit from using `tdigest`, the default `uddsketch` is your best choice. For some more technical details and usage examples of the different algorithms, see the developer documentation for [uddsketch][gh-uddsketch] and [tdigest][gh-tdigest]. ===== PAGE: https://docs.tigerdata.com/use-timescale/hyperfunctions/locf/ ===== # Last observation carried forward Last observation carried forward (LOCF) is a form of linear interpolation used to fill gaps in your data. It takes the last known value and uses it as a replacement for the missing data. For more information about gapfilling and interpolation API calls, see the [hyperfunction API documentation][hyperfunctions-api-gapfilling]. ===== PAGE: https://docs.tigerdata.com/use-timescale/hyperfunctions/stats-aggs/ ===== # Statistical aggregation To make common statistical aggregates easier to work with in window functions and continuous aggregates, TimescaleDB provides common statistical aggregates in a slightly different form than otherwise available in Postgres. This example calculates the average, standard deviation, and kurtosis of a value in the `measurements` table:sql SELECT
time_bucket('10 min'::interval, ts), average(stats_agg(val)), stddev(stats_agg(val), 'pop'), kurtosis(stats_agg(val), 'pop')FROM measurements GROUP BY 1;
This uses a two-step aggregation process. The first step is an aggregation step (`stats_agg(val)`), which creates a machine-readable form of the aggregate. The second step is an accessor. The available accessors are `average`, `stddev`, and `kurtosis`. The accessors run final calculations and output the calculated value in a human-readable way. This makes it easier to construct your queries, because it distinguishes the parameters, and makes it clear which aggregates are being re-aggregated or rolled up. Additionally, because this query syntax is used in all TimescaleDB Toolkit queries, when you are used to it, you can use it to construct more and more complicated queries. A more complex example uses window functions to calculate tumbling window statistical aggregates. The statistical aggregate is first calculated over each minute in the subquery and then the `rolling` aggregate is used to re-aggregate it over each 15 minute period preceding. The accessors remain the same as the previous example:sql SELECT
bucket, average(rolling(stats_agg) OVER fifteen_min), stddev(rolling(stats_agg) OVER fifteen_min, 'pop'), kurtosis(rolling(stats_agg) OVER fifteen_min, 'pop')FROM (SELECT
time_bucket('1 min'::interval, ts) AS bucket, stats_agg(val) FROM measurements GROUP BY 1) AS statsWINDOW fifteen_min as (ORDER BY bucket ASC RANGE '15 minutes' PRECEDING);
For some more technical details and usage examples of the two-step aggregation method, see the [blog post on aggregates][blog-aggregates] or the [developer documentation][gh-two-step-agg]. The `stats_agg` aggregate is available in two forms, a one-dimensional aggregate shown earlier in this section, and a two-dimensional aggregate. The two-dimensional aggregate takes in two variables `(Y, X)`, which are dependent and independent variables respectively. The two-dimensional aggregate performs all the same calculations on each individual variable as performing separate one-dimensional aggregates would, and additionally performs linear regression on the two variables. Accessors for one-dimensional values append a `_y` or `_x` to the name. For example:sql SELECT
average_y(stats_agg(val2, val1)), -- equivalent to average(stats_agg(val2)) stddev_x(stats_agg(val2, val1)), -- equivalent to stddev(stats_agg(val1)) slope(stats_agg(val2, val1)) -- the slope of the least squares fit line of the values in val2 & val1FROM measurements_multival;
For more information about statistical aggregation API calls, see the [hyperfunction API documentation][hyperfunctions-api-stats-agg]. ===== PAGE: https://docs.tigerdata.com/use-timescale/hyperfunctions/counter-aggregation/ ===== # Counter aggregation When you are monitoring application performance, there are two main types of metrics that you can collect: gauges, and counters. Gauges fluctuate up and down, like temperature or speed, while counters always increase, like the total number of miles travelled in a vehicle. When you process counter data, it is usually assumed that if the value of the counter goes down, the counter has been reset. For example, if you wanted to count the total number of miles travelled in a vehicle, you would expect the values to continuously increase: 1, 2, 3, 4, and so on. If the counter reset to 0, you would expect that this was a new trip, or an entirely new vehicle. This can become a problem if you want to continue counting from where you left off, rather than resetting to 0. A reset could occur if you have had a short server outage, or any number of other reasons. To get around this, you can analyze counter data by looking at the change over time, which accounts for resets. Accounting for resets can be difficult to do in SQL, so TimescaleDB has developed aggregate and accessor functions that handle calculations for counters in a more practical way. Counter aggregates can be used in continuous aggregates, even though they are not parallelizable in Postgres. For more information, see the section on parallelism and ordering. For more information about counter aggregation API calls, see the [hyperfunction API documentation][hyperfunctions-api-counter-agg]. ## Run a counter aggregate query using a delta function In this procedure, we are using an example table called `example` that contains counter data. ### Running a counter aggregate query using a delta function 1. Create a table called `example`: ```sql CREATE TABLE example ( measure_id BIGINT, ts TIMESTAMPTZ , val DOUBLE PRECISION, PRIMARY KEY (measure_id, ts) ); ``` 1. Create a counter aggregate and the delta accessor function. This gives you the change in the counter's value over the time period, accounting for any resets. This allows you to search for fifteen minute periods where the counter increased by a larger or smaller amount: ```sql SELECT measure_id, delta( counter_agg(ts, val) ) FROM example GROUP BY measure_id; ``` 1. You can also use the `time_bucket` function to produce a series of deltas over fifteen minute increments: ```sql SELECT measure_id, time_bucket('15 min'::interval, ts) as bucket, delta( counter_agg(ts, val) ) FROM example GROUP BY measure_id, time_bucket('15 min'::interval, ts); ``` ## Run a counter aggregate query using an extrapolated delta function If your series is less regular, the deltas are affected by the number of samples in each fifteen minute period. You can improve this by using the `extrapolated_delta` function. To do this, you need to provide bounds that define where to extrapolate to. In this example, we use the `time_bucket_range` function, which works in the same way as `time_bucket` but produces an open ended range of all the times in the bucket. This example also uses a CTE to do the counter aggregation, which makes it a little easier to understand what's going on in each part. ### Running a counter aggregate query using an extrapolated delta function 1. Create a hypertable called `example`: ```sql CREATE TABLE example ( measure_id BIGINT, ts TIMESTAMPTZ , val DOUBLE PRECISION, PRIMARY KEY (measure_id, ts) ) WITH ( tsdb.hypertable, tsdb.partition_column='ts', tsdb.chunk_interval='15 days' ); ``` If you are self-hosting TimescaleDB v2.19.3 and below, create a [Postgres relational table][pg-create-table], then convert it using [create_hypertable][create_hypertable]. You then enable hypercore with a call to [ALTER TABLE][alter_table_hypercore]. 1. Create a counter aggregate and the extrapolated delta function: ```sql with t as ( SELECT measure_id, time_bucket('15 min'::interval, ts) as bucket, counter_agg(ts, val, toolkit_experimental.time_bucket_range('15 min'::interval, ts)) FROM example GROUP BY measure_id, time_bucket('15 min'::interval, ts)) SELECT time_bucket, extrapolated_delta(counter_agg, method => 'prometheus') FROM t ; ``` In this procedure, `Prometheus` is used to do the extrapolation. TimescaleDB's current `extrapolation` function is built to mimic the Prometheus project's `increase` function, which measures the change of a counter extrapolated to the edges of the queried region. ## Run a counter aggregate query with a continuous aggregate Your counter aggregate might be more useful if you make a continuous aggregate out of it. 1. Create the continuous aggregate: ```sql CREATE MATERIALIZED VIEW example_15 WITH (timescaledb.continuous) AS SELECT measure_id, time_bucket('15 min'::interval, ts) as bucket, counter_agg(ts, val, time_bucket_range('15 min'::interval, ts)) FROM example GROUP BY measure_id, time_bucket('15 min'::interval, ts); ``` 1. You can also re-aggregate from the continuous aggregate into a larger bucket size: ```sql SELECT measure_id, time_bucket('1 day'::interval, bucket), delta( rollup(counter_agg) ) FROM example_15 GROUP BY measure_id, time_bucket('1 day'::interval, bucket); ``` ## Parallelism and ordering The counter reset calculations require a strict ordering of inputs, which means they are not parallelizable in Postgres. This is because Postgres handles parallelism by issuing rows randomly to workers. However, if your parallelism can guarantee sets of rows that are disjointed in time, the algorithm can be parallelized, as long as it is within a time range, and all rows go to the same worker. This is the case for both continuous aggregates and for distributed hypertables, as long as the partitioning keys are in the `group by`, even though the aggregate itself doesn't really make sense otherwise. For more information about parallelism and ordering, see our [developer documentation][gh-parallelism-ordering] ===== PAGE: https://docs.tigerdata.com/use-timescale/hyperfunctions/heartbeat-agg/ ===== # Heartbeat aggregation Given a series of timestamped health checks, it can be tricky to determine the overall health of a system over a given interval. Postgres provides window functions that you use to get a sense of where unhealthy gaps are, but they can be somewhat awkward to use efficiently. This is one of the many cases where hyperfunctions provide an efficient, simple solution for a frequently occurring problem. Heartbeat aggregation helps analyze event-based time-series data with intermittent or irregular signals. This example uses the [SustData public dataset][sustdata]. This dataset tracks the power usage of a small number of apartments and houses over four different deployment intervals. The data is collected in one-minute samples from each unit. When you have loaded the data into hypertables, you can create a materialized view containing weekly heartbeat aggregates for each of the units:sql CREATE MATERIALIZED VIEW weekly_heartbeat AS SELECT
time_bucket('1 week', tmstp) as week, iid as unit, deploy, heartbeat_agg(tmstp, time_bucket('1w', tmstp), '1w', '2m')FROM power_samples GROUP BY 1,2,3;
The heartbeat aggregate takes four parameters: the timestamp column, the start of the interval, the length of the interval, and how long the aggregate is considered live after each timestamp. This example uses 2 minutes as the heartbeat lifetime to give some tolerance for small gaps. You can use this data to see when you're receiving data for a particular unit. This example rolls up the weekly aggregates into a single aggregate, and then views the live ranges:sql SELECT live_ranges(rollup(heartbeat_agg)) FROM weekly_heartbeat WHERE unit = 17;
output
live_ranges
("2010-09-18 00:00:00+00","2011-03-27 01:01:50+00") ("2011-03-27 03:00:52+00","2011-07-03 00:01:00+00") ("2011-07-05 00:00:00+00","2011-08-21 00:01:00+00") ("2011-08-22 00:00:00+00","2011-08-25 00:01:00+00") ("2011-08-27 00:00:00+00","2011-09-06 00:01:00+00") ("2011-09-08 00:00:00+00","2011-09-29 00:01:00+00") ("2011-09-30 00:00:00+00","2011-10-04 00:01:00+00") ("2011-10-05 00:00:00+00","2011-10-17 00:01:00+00") ("2011-10-19 00:00:00+00","2011-11-09 00:01:00+00") ("2011-11-10 00:00:00+00","2011-11-14 00:01:00+00") ("2011-11-15 00:00:00+00","2011-11-18 00:01:00+00") ("2011-11-20 00:00:00+00","2011-11-23 00:01:00+00") ("2011-11-24 00:00:00+00","2011-12-01 00:01:00+00") ("2011-12-02 00:00:00+00","2011-12-12 00:01:00+00") ("2011-12-13 00:00:00+00","2012-01-12 00:01:00+00") ("2012-01-13 00:00:00+00","2012-02-03 00:01:00+00") ("2012-02-04 00:00:00+00","2012-02-10 00:01:00+00") ("2012-02-11 00:00:00+00","2012-03-25 01:01:50+00") ("2012-03-25 03:00:51+00","2012-04-11 00:01:00+00")
You can construct more elaborate queries. For example, to return the 5 units with the lowest uptime during the third deployment:sql SELECT unit, uptime(rollup(heartbeat_agg)) FROM weekly_heartbeat WHERE deploy = 3 GROUP BY unit ORDER BY uptime LIMIT 5;
output unit | uptime ------+------------------- 31 | 203 days 22:05:00 34 | 222 days 22:05:00 32 | 222 days 22:05:00 35 | 222 days 22:05:00 30 | 222 days 22:05:00
Combine aggregates from different units to get the combined coverage. This example queries the interval where any part of a deployment was active:sql SELECT deploy, live_ranges(rollup(heartbeat_agg)) FROM weekly_heartbeat group by deploy order by deploy;
output deploy | live_ranges --------+-----------------------------------------------------
1 | ("2010-07-29 00:00:00+00","2010-11-26 00:01:00+00") 2 | ("2010-11-25 00:00:00+00","2011-03-27 01:01:59+00") 2 | ("2011-03-27 03:00:00+00","2012-03-25 01:01:59+00") 2 | ("2012-03-25 03:00:26+00","2012-04-17 00:01:00+00") 2 | ("2012-04-20 00:00:00+00","2012-04-21 00:01:00+00") 2 | ("2012-05-11 00:00:00+00","2012-05-13 00:01:00+00") 2 | ("2013-02-20 00:00:00+00","2013-02-21 00:01:00+00") 3 | ("2012-08-01 00:00:01+00","2013-03-31 01:01:16+00") 3 | ("2013-03-31 03:00:03+00","2013-05-22 00:01:00+00") 4 | ("2013-07-31 00:00:00+00","2014-03-30 01:01:49+00") 4 | ("2014-03-30 03:00:01+00","2014-04-25 00:01:00+00")Then use this data to make observations and draw conclusions: - The second deployment had a lot more problems than the other ones. - There were some readings from February 2013 that were incorrectly categorized as a second deployment. - The timestamps are given in a local time without time zone, resulting in some missing hours around springtime daylight savings time changes. For more information about heartbeat aggregation API calls, see the [hyperfunction API documentation][hyperfunctions-api-heartbeat-agg]. ===== PAGE: https://docs.tigerdata.com/use-timescale/hyperfunctions/troubleshoot-hyperfunctions/ ===== # Troubleshooting hyperfunctions and TimescaleDB Toolkit This section contains some ideas for troubleshooting common problems experienced with hyperfunctions and Toolkit. <!--- * Keep this section in alphabetical order * Use this format for writing troubleshooting sections: - Cause: What causes the problem? - Consequence: What does the user see when they hit this problem? - Fix/Workaround: What can the user do to fix or work around the problem? Provide a "Resolving" Procedure if required. - Result: When the user applies the fix, what is the result when the same action is applied? * Copy this comment at the top of every troubleshooting page --> ## Updating the Toolkit extension fails with an error saying `no update path` In some cases, when you create the extension, or use the `ALTER EXTENSION timescaledb_toolkit UPDATE` command to update the Toolkit extension, it might fail with an error like this:sql ERROR: extension "timescaledb_toolkit" has no update path from version "1.2" to version "1.3"
This occurs if the list of available extensions does not include the version you are trying to upgrade to, and it can occur if the package was not installed correctly in the first place. To correct the problem, install the upgrade package, restart Postgres, verify the version, and then attempt the update again. #### Troubleshooting Toolkit setup 1. If you're installing Toolkit from a package, check your package manager's local repository list. Make sure the TimescaleDB repository is available and contains Toolkit. For instructions on adding the TimescaleDB repository, see the installation guides: * [Debian/Ubuntu installation guide][deb-install] * [RHEL/CentOS installation guide][rhel-install] 1. Update your local repository list with `apt update` or `yum update`. 1. Restart your Postgres service. 1. Check that the right version of Toolkit is among your available extensions: ```sql SELECT * FROM pg_available_extensions WHERE name = 'timescaledb_toolkit'; ``` The result should look like this: ``` -[ RECORD 1 ]-----+-------------------------------------------------------------------------------------- name | timescaledb_toolkit default_version | 1.6.0 installed_version | 1.6.0 comment | Library of analytical hyperfunctions, time-series pipelining, and other SQL utilities ``` 1. Retry `CREATE EXTENSION` or `ALTER EXTENSION`. ===== PAGE: https://docs.tigerdata.com/use-timescale/hyperfunctions/time-weighted-average/ ===== # Time-weighted average Time weighted average in TimescaleDB is implemented as an aggregate that weights each value using last observation carried forward (LOCF), or linear interpolation. The aggregate is not parallelizable, but it is supported with [continuous aggregation][caggs]. ## Run a time-weighted average query In this procedure, we are using an example table called `freezer_temps` that contains data about internal freezer temperatures. ### Running a time-weighted average query 1. At the `psql`prompt, find the average and the time-weighted average of the data: ```sql SELECT freezer_id, avg(temperature), average(time_weight('Linear', ts, temperature)) as time_weighted_average FROM freezer_temps GROUP BY freezer_id; ``` 1. To determine if the freezer has been out of temperature range for more than 15 minutes at a time, use a time-weighted average in a window function: ```sql SELECT *, average( time_weight('Linear', ts, temperature) OVER (PARTITION BY freezer_id ORDER BY ts RANGE '15 minutes'::interval PRECEDING ) ) as rolling_twa FROM freezer_temps ORDER BY freezer_id, ts; ``` For more information about time-weighted average API calls, see the [hyperfunction API documentation][hyperfunctions-api-timeweight]. ===== PAGE: https://docs.tigerdata.com/use-timescale/services/service-management/ ===== # Service management In the `Service management` section of the `Operations` dashboard, you can fork your service, reset the password, pause, or delete the service. ## Fork a service When you a fork a service, you create its exact copy including the underlying database. This allows you to create a copy that you can use for testing purposes, or to prepare for a major version upgrade. The only difference between the original and the forked service is that the `tsdbadmin` user has a different password. The fork is created by restoring from backup and applying the write-ahead log. The data is fetched from Amazon S3, so forking doesn't tax the running instance. You can fork services that have a status of `Running` or `Paused`. You cannot fork services while they have a status of `In progress`. Wait for the service to complete the transition before you start forking. Forks only have data up to the point when the original service was forked. Any data written to the original service after the time of forking does not appear in the fork. If you want the fork to assume operations from the original service, pause your main service before forking to avoid any data discrepancy between services. 1. In Tiger Cloud Console, from the `Services` list, ensure the service you want to form has a status of `Running` or `Paused`, then click the name of the service you want to fork. 1. Navigate to the `Operations` tab. 1. In the `Service management` section, click `Fork service`. In the dialog, confirm by clicking `Fork service`. The forked service takes a few minutes to start. 1. [](#)To change the configuration of your fork, click `Advanced options`. You can set different compute and storage options, separate from your original service. 1. Confirm by clicking `Fork service`. The forked service takes a few minutes to start. 1. The forked service shows in the `Services` dashboard with a label stating which service it has been forked from. <img class="main-content__illustration" width={1375} height={944} src="https://assets.timescale.com/docs/images/tsc-forked-service.webp" alt="Fork a Tiger Cloud service" /> ## Create a service fork using the CLI To manage development forks: 1. **Install Tiger CLI** Use the terminal to install the CLI: ```shell curl -s https://packagecloud.io/install/repositories/timescale/tiger-cli/script.deb.sh | sudo os=any dist=any bash sudo apt-get install tiger-cli ``` ```shell curl -s https://packagecloud.io/install/repositories/timescale/tiger-cli/script.deb.sh | sudo os=any dist=any bash sudo apt-get install tiger-cli ``` ```shell curl -s https://packagecloud.io/install/repositories/timescale/tiger-cli/script.rpm.sh | sudo os=rpm_any dist=rpm_any bash sudo yum install tiger-cli ``` ```shell curl -s https://packagecloud.io/install/repositories/timescale/tiger-cli/script.rpm.sh | sudo os=rpm_any dist=rpm_any bash sudo yum install tiger-cli ``` ```shell brew install --cask timescale/tap/tiger-cli ``` ```shell curl -fsSL https://cli.tigerdata.com | sh ``` 1. **Set up API credentials** 1. Log Tiger CLI into your Tiger Data account: ```shell tiger auth login ``` Tiger CLI opens Console in your browser. Log in, then click `Authorize`. You can have a maximum of 10 active client credentials. If you get an error, open [credentials][rest-api-credentials] and delete an unused credential. 1. Select a Tiger Cloud project: ```terminaloutput Auth URL is: https://console.cloud.timescale.com/oauth/authorize?client_id=lotsOfURLstuff Opening browser for authentication... Select a project: > 1. Tiger Project (tgrproject) 2. YourCompany (Company wide project) (cpnproject) 3. YourCompany Department (dptproject) Use ↑/↓ arrows or number keys to navigate, enter to select, q to quit ``` If only one project is associated with your account, this step is not shown. Where possible, Tiger CLI stores your authentication information in the system keychain/credential manager. If that fails, the credentials are stored in `~/.config/tiger/credentials` with restricted file permissions (600). By default, Tiger CLI stores your configuration in `~/.config/tiger/config.yaml`. 1. **Test your authenticated connection to Tiger Cloud by listing services** ```bash tiger service list ``` This call returns something like: - No services: ```terminaloutput 🏜️ No services found! Your project is looking a bit empty. 🚀 Ready to get started? Create your first service with: tiger service create ``` - One or more services: ```terminaloutput ┌────────────┬─────────────────────┬────────┬─────────────┬──────────────┬──────────────────┐ │ SERVICE ID │ NAME │ STATUS │ TYPE │ REGION │ CREATED │ ├────────────┼─────────────────────┼────────┼─────────────┼──────────────┼──────────────────┤ │ tgrservice │ tiger-agent-service │ READY │ TIMESCALEDB │ eu-central-1 │ 2025-09-25 16:09 │ └────────────┴─────────────────────┴────────┴─────────────┴──────────────┴──────────────────┘ ``` 1. **Fork the service**shell
tiger service fork tgrservice --now --no-wait --name bobBy default a fork matches the resource of the parent Tiger Cloud services. For paid plans specify `--cpu` and/or `--memory` for dedicated resources. You see something like: ```terminaloutput 🍴 Forking service 'tgrservice' to create 'bob' at current state... ✅ Fork request accepted! 📋 New Service ID: <service_id> 🔐 Password saved to system keyring for automatic authentication 🎯 Set service '<service_id>' as default service. ⏳ Service is being forked. Use 'tiger service list' to check status. ┌───────────────────┬──────────────────────────────────────────────────────────────────────────────────────────────────┐ │ PROPERTY │ VALUE │ ├───────────────────┼──────────────────────────────────────────────────────────────────────────────────────────────────┤ │ Service ID │ <service_id> │ │ Name │ bob │ │ Status │ │ │ Type │ TIMESCALEDB │ │ Region │ eu-central-1 │ │ CPU │ 0.5 cores (500m) │ │ Memory │ 2 GB │ │ Direct Endpoint │ <service-id>.<project-id>.tsdb.cloud.timescale.com:<port> │ │ Created │ 2025-10-08 13:58:07 UTC │ │ Connection String │ postgresql://tsdbadmin@<service-id>.<project-id>.tsdb.cloud.timescale.com:<port>/tsdb?sslmode=require │ └───────────────────┴──────────────────────────────────────────────────────────────────────────────────────────────────┘When you are done, delete your forked service
Use the CLI to request service delete:
tiger service delete <service_id>Validate the service delete:
Are you sure you want to delete service '<service_id>'? This operation cannot be undone. Type the service ID '<service_id>' to confirm: <service_id>
You see something like:
```terminaloutput 🗑️ Delete request accepted for service '<service_id>'. ✅ Service '<service_id>' has been successfully deleted. ```
Reset your service password
You can reset your service password from the
Operationsdashboard. This is the password you use to connect to your service, not the password for Tiger Cloud Console. To reset your Console password, navigate to theAccountpage.When you reset your service password, you are prompted for your Console password. When you have authenticated, you can create a new service password, ask Console to auto-generate a password, or switch your authentication type between SCRAM and MD5.
SCRAM (salted challenge response authentication mechanism) and MD5 (message digest algorithm 5) are cryptographic authentication mechanisms. Tiger Cloud Console uses SCRAM by default. It is more secure and strongly recommended. The MD5 option is provided for compatibility with older clients.
Pause a service
You can pause a service if you want to stop it running temporarily. When you pause a service, you are no longer billed for compute resources. However, you do need to continue paying for any storage you are using. Pausing a service ensures that it is still available, and is ready to be restarted at any time.
Delete a service
You can delete a service to remove it completely. This removes the service and its underlying data from the server. You cannot recover a deleted service.
===== PAGE: https://docs.tigerdata.com/use-timescale/services/connection-pooling/ =====
Connection pooling
You can scale your Tiger Cloud service connections and improve its performance by using connection poolers. Tiger Cloud uses
pgBouncerfor connection pooling.If your service needs a large number of short-lived connections, a connection pooler is a great way to improve performance. For example, web, serverless, and IoT applications often use an event-based architecture where data is read or written from the database for a very short amount of time.
Your application rapidly opens and closes connections while the pooler maintains a set of long-running connections to the service. This improves performance because the pooler opens the connections in advance, allowing the application to open many short-lived connections, while the service opens few, long-lived connections.
User authentication
By default, the poolers have authentication to the service, so you can use any custom users you already have set up without further configuration. You can continue using the
tsdbadminuser if that is your preferred method. However, you might need to add custom configurations for some cases such asstatement_timeoutfor a pooler user.Creating a new user with custom settings
Connect to your service as the
tsdbadminuser, and create a new role named<MY_APP>with the password as<PASSWORD>:CREATE ROLE <MY_APP> LOGIN PASSWORD '<PASSWORD>';Change the
statement_timeoutsettings to 2 seconds for this user:ALTER ROLE my_app SET statement_timeout TO '2s';In a new terminal window, connect on the pooler with the new user
<MY_APP>:❯ PGPASSWORD=<NEW_PASSWORD> psql 'postgres://my_app@service.project.tsdb.cloud.timescale.com:30477/tsdb?sslmode=require'The output looks something like this:
Check that the settings are correct by logging in as the
<MY_APP>user:SELECT current_user; ┌──────────────┐ │ current_user │ ├──────────────┤ │ my_app │ └──────────────┘ (1 row)Check the
statement_timeoutsetting is correct for the<MY_APP>user:tsdb=> show statement_timeout; ┌───────────────────┐ │ statement_timeout │ ├───────────────────┤ │ 2s │ └───────────────────┘ (1 row)
Pool types
When you create a connection pooler, there are two pool types to choose from: session or transaction. Each pool type uses a different mode to handle connections.
Session pools allocate a connection from the pool until they are closed by the application, similar to a regular Postgres connection. When the application closes the connection, it is sent back to the pool.
Transaction pool connections are allocated only for the duration of the transaction, releasing the connection back to the pool when the transaction ends. If your application opens and closes connections frequently, choose the transaction pool type.
By default, the pooler supports both modes simultaneously. However, the connection string you use to connect your application is different, depending on whether you want a session or transaction pool type. When you create a connection pool in the Tiger Cloud Console, you are given the correct connection string for the mode you choose.
For example, a connection string to connect directly to your service looks a bit like this:
:@service.example.cloud.timescale.com:30133/tsdb?sslmode=require `} />
A session pool connection string is the same, but uses a different port number, like this:
:@service.example.cloud.timescale.com:29303/tsdb?sslmode=require `} />
The transaction pool connection string uses the same port number as a session pool connection, but uses a different database name, like this:
:@service.example.cloud.timescale.com:29303/tsdb_transaction?sslmode=require `} />
Make sure you check the Tiger Cloud Console output for the correct connection string to use in your application.
Connection pool sizes
A connection pooler manages connections to both the service itself, and the client application. It keeps a fixed number of connections open with the service, while allowing clients to open and close connections. Clients can request a connection from the session pool or the transaction pool. The connection pooler will then allocate the connection if there is one free.
The number of client connections allowed to each pool is proportional to the
max_connectionsparameter set for the service. The session pool can have a maximum ofmax_connections - 17client connections, while the transaction pool can have a maximum of(max_connections - 17) * 20client connections.Of the 17 reserved connections that are not allocated to either pool, 12 are reserved for the database superuser by default, and another 5 for Tiger Cloud operations.
For example, if
max_connectionsis set to 500, the maximum number of client connections for your session pool is483 (500 - 17)and9,660 (483 * 20)for your transaction pool. The default value ofmax_connectionsvaries depending on your service's compute size.Add a connection pooler
When you create a new service, you can also create a connection pooler. Alternatively, you can add a connection pooler to an existing service in Console.
Adding a connection pooler
- Log in to Console and click the service you want to add a connection pooler to.
In
Operations, clickConnection pooling>Add pooler.Your pooler connection details are displayed in the
Connection poolingtab. Use this information to connect to your transaction or session pooler. For more information about the different pool types, see the pool types section.
Remove a connection pooler
If you no longer need a connection pooler, you can remove it in Console. When you have removed your connection pooler, make sure that you also update your application to adjust the port it uses to connect to your service.
- In Console, select the service you want to remove a connection pooler from.
- Select
Operations, thenConnection pooling. - Click
Remove connection pooler.
Confirm that you want to remove the connection pooler.
After you have removed a pooler, if you add it back in the future, it uses the same connection string and port that was used before.
pgBouncer statistics commands
- Connect to your service.
- Switch to the
pgbouncerdatabase:\c pgbouncer - Run any read-only command for the pgBouncer cli (e.g.,
SHOW STATS;). - For full options, see the pgBouncer docs here.
VPC and connection pooling
VPCs are supported with connection pooling. It does not matter the order you add the pooler or connect to a VPC. Your connection strings will automatically be updated to use the VPC connection string.
===== PAGE: https://docs.tigerdata.com/use-timescale/services/service-explorer/ =====
Service explorer
Service explorer in Tiger Cloud Console provides a rich administrative dashboard for understanding the state of your database instance. The explorer gives you insight into the performance of your database, giving you greater confidence and control over your data.
The explorer works like an operations center as you develop and run your applications with Tiger Cloud. It gives you quick access to the key properties of your database, like table sizes, schema definitions, and foreign key references, as well as information specific to Tiger Cloud, like information on your hypertables and continuous aggregates.
To see the explorer, select your service in Console and click
Explorer.General information
In the
General informationsection, you can see a high-level summary of your service, including all your hypertables and relational tables. It summarizes your overall compression ratios, and other policy and continuous aggregate data. And, if you aren't already using key features like continuous aggregates, columnstore compression, or other automation policies and actions, it provides pointers to tutorials and documentation to help you get started.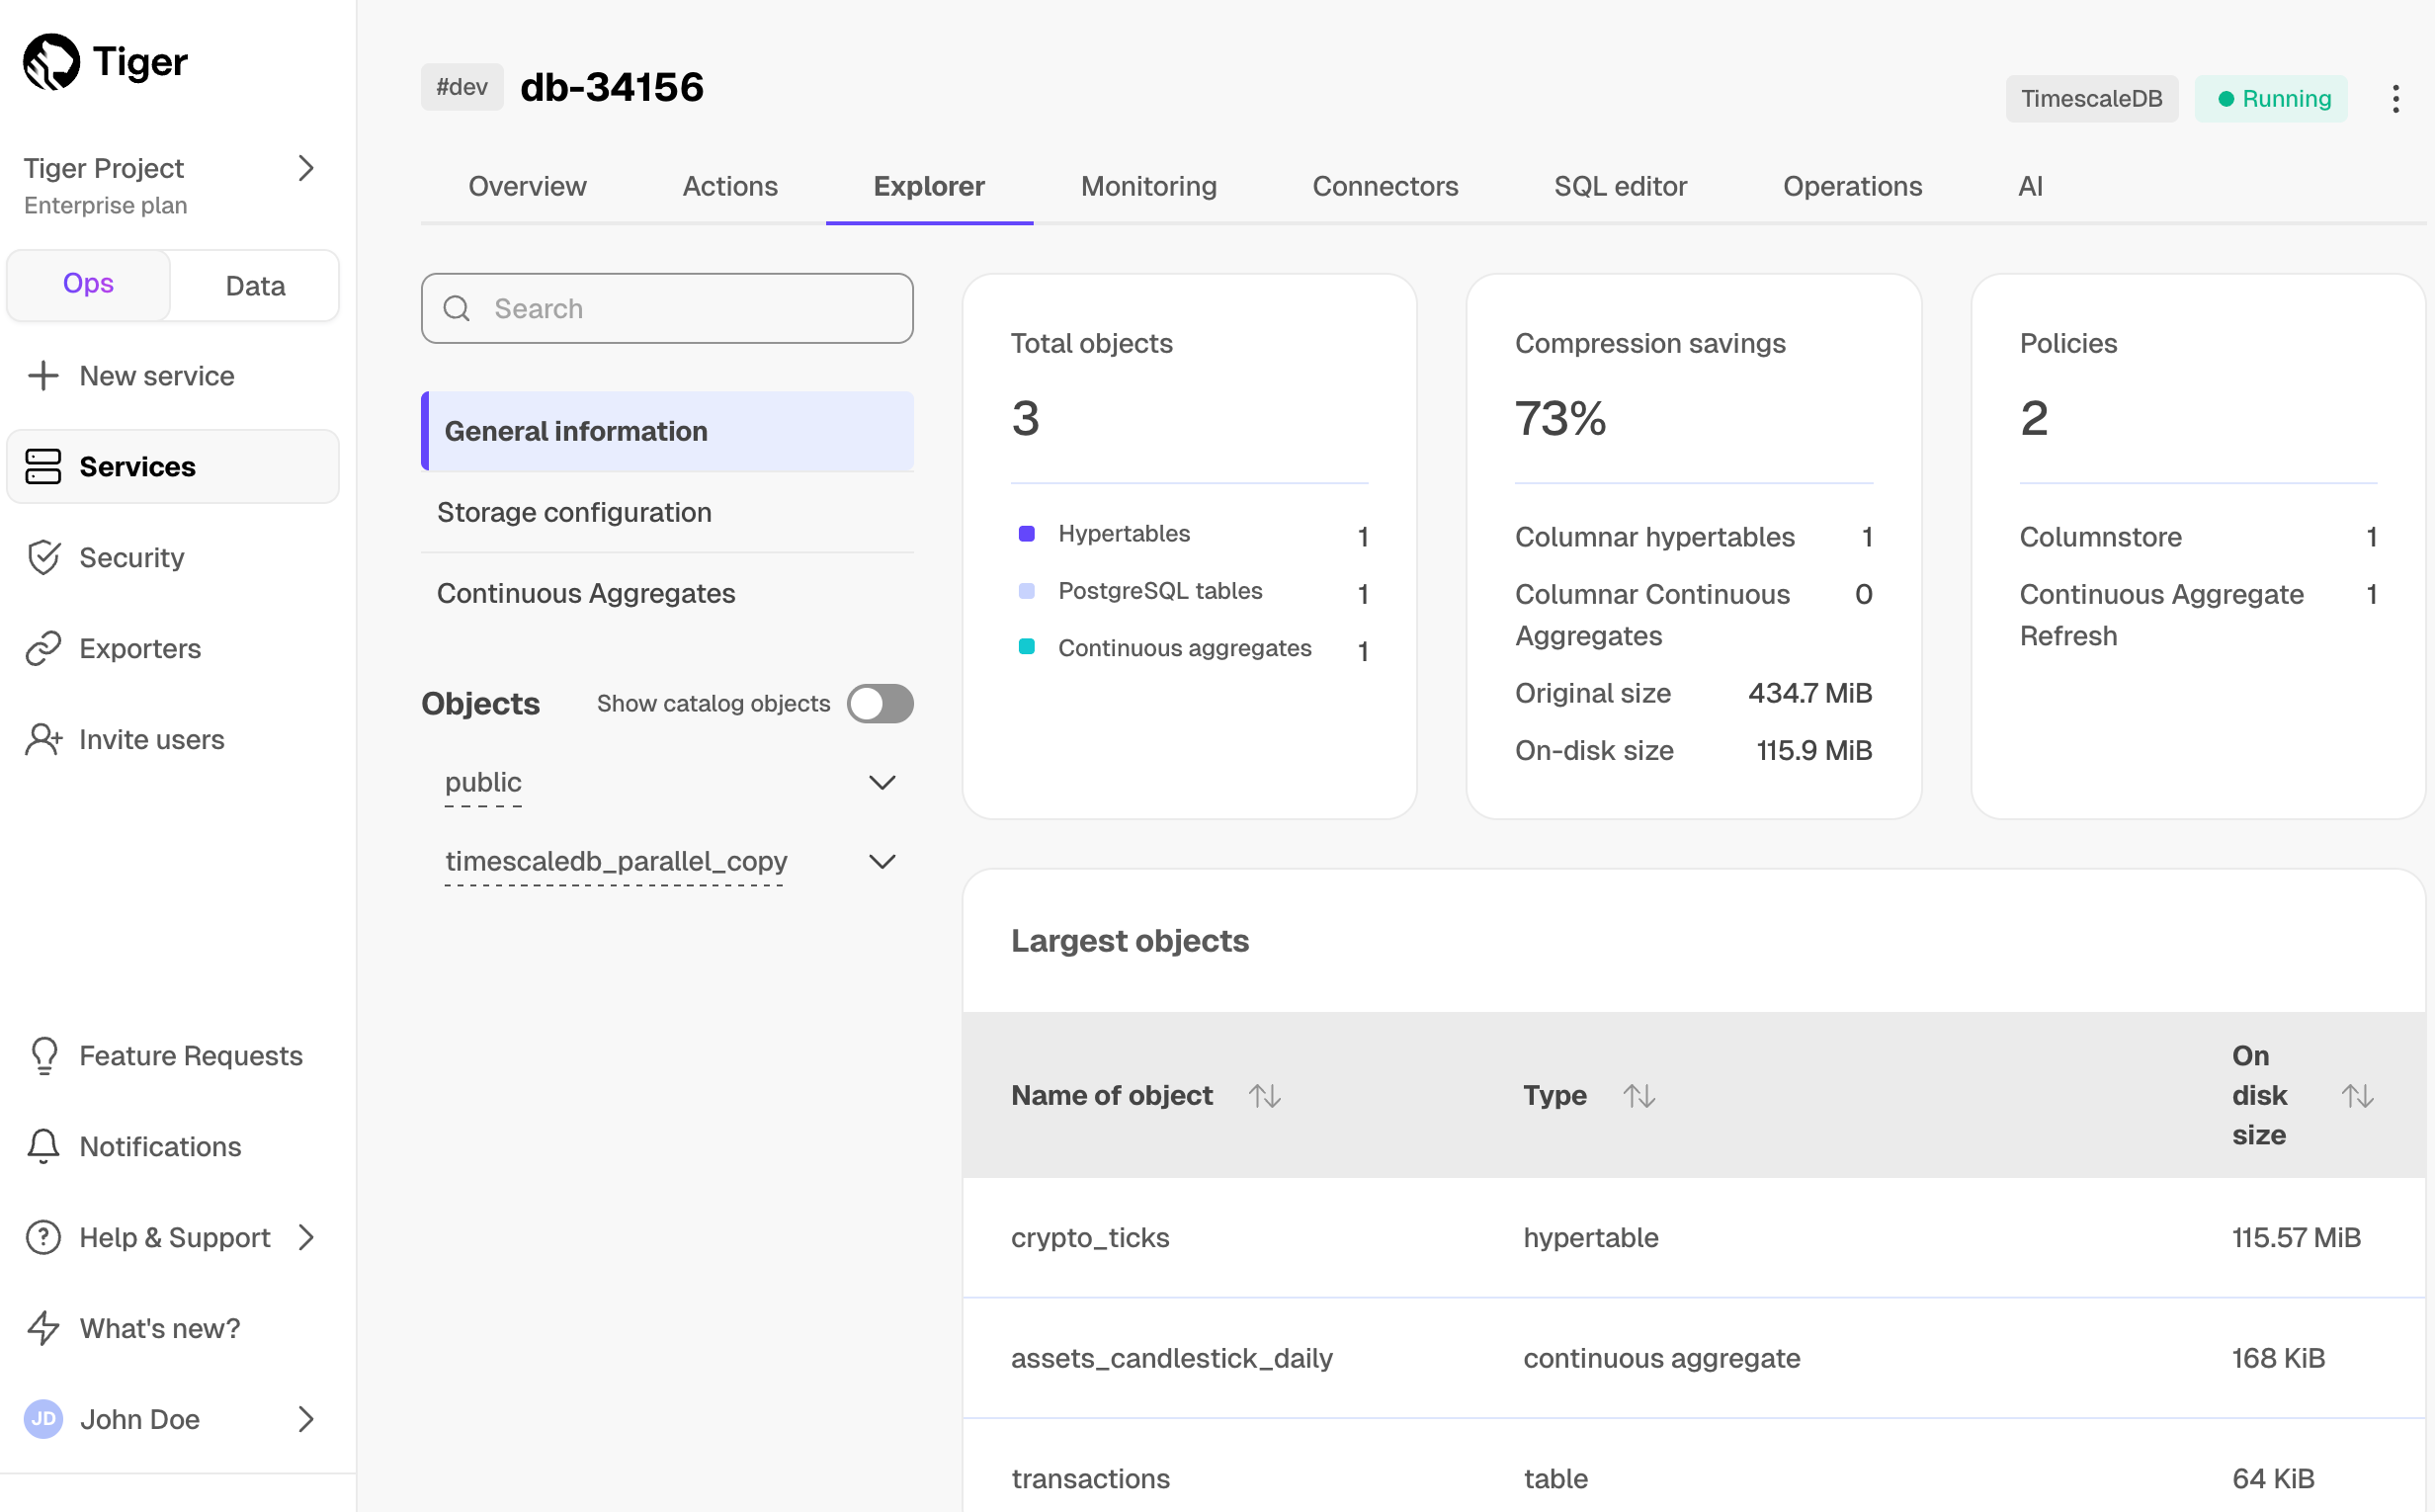
Tables
You can have a detailed look into all your tables, including information about table schemas, table indexes, and foreign keys. For your hypertables, it shows details about chunks, continuous aggregates, and policies such as data retention policies and data reordering. You can also inspect individual hypertables, including their sizes, dimension ranges, and columnstore compression status.
From this section, you can also set an automated policy to compress chunks into the columnstore. For more information, see the hypercore documentation.
For more information about hypertables, see the hypertables section.
Continuous aggregates
In the
Continuous aggregatesection, you can see all your continuous aggregates, including top-level information such as their size, whether they are configured for real-time aggregation, and their refresh periods.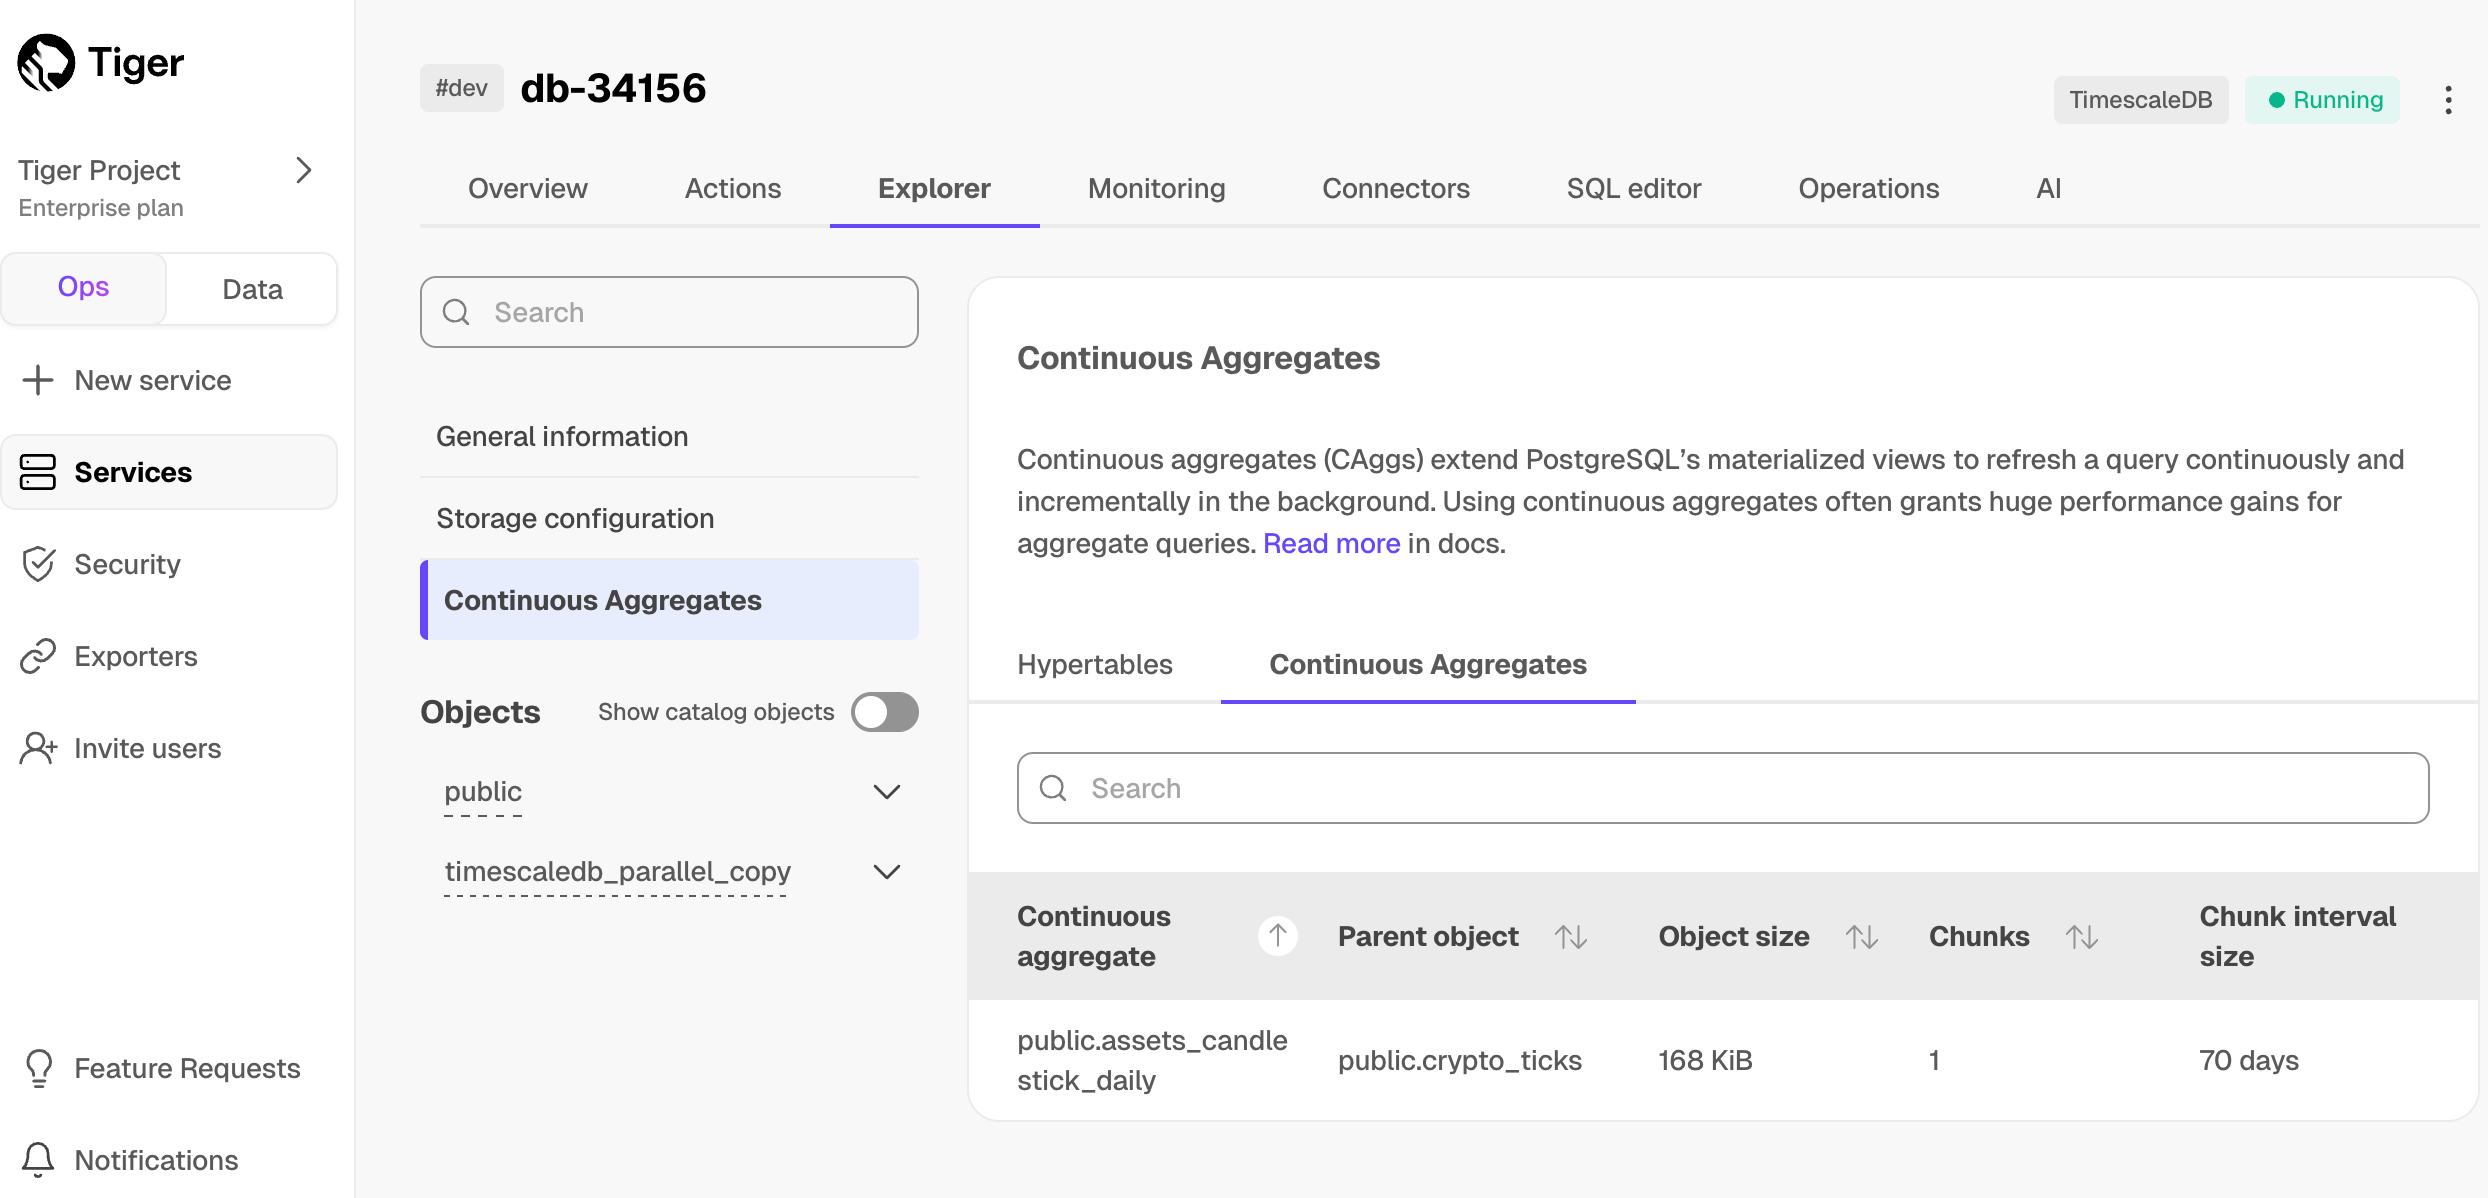
For more information about continuous aggregates, see the continuous aggregates section.
===== PAGE: https://docs.tigerdata.com/use-timescale/services/service-overview/ =====
About services
You manage your Tiger Cloud services and interact with your data in Tiger Cloud Console using the following modes:
Ops mode Data mode You use the ops mode to: - Ensure data security with high availability and read replicas
- Save money with columnstore compression and tiered storage
- Enable Postgres extensions to add extra functionality
- Increase security using VPCs
- Perform day-to-day administration
Powered by PopSQL, you use the data mode to: - Write queries with autocomplete
- Visualize data with charts and dashboards
- Schedule queries and dashboards for alerts or recurring reports
- Share queries and dashboards
- Interact with your data on auto-pilot with SQL assistant
When you log into Tiger Cloud Console, you see the project overview. Click a service to view run-time data and connection information. Click
Operationsto configure your service.Each service hosts a single database managed for you by Tiger Cloud. If you need more than one database, create a new service.
Service users
By default, when you create a new service, a new
tsdbadminuser is created. This is the user that you use to connect to your new service.The
tsdbadminuser is the owner of the database, but is not a superuser. You cannot access thepostgresuser. There is no superuser access to Tiger Cloud databases.In your service, the
tsdbadminuser can create another user with any other role. For a complete list of roles available, see the Postgres role attributes documentation.You cannot create multiple databases in a single service. If you need data isolation, use schemas or create additional services.
===== PAGE: https://docs.tigerdata.com/use-timescale/services/change-resources/ =====
Manually change compute resources
Tiger Cloud charges are based on the amount of storage you use. You don't pay for fixed storage size, and you don't need to worry about scaling disk size as your data grows—we handle it all for you. To reduce your data costs further, combine hypercore, a data retention policy, and tiered storage.
You use Tiger Cloud Console to resize the compute (CPU/RAM) resources available to your Tiger Cloud services at any time, with a short downtime.
Update compute resources for a service
You can change the CPU and memory allocation for your service at any time with minimal downtime, usually less than a minute. The new resources become available as soon as the service restarts. You can change the CPU and memory allocation up or down, as frequently as required.
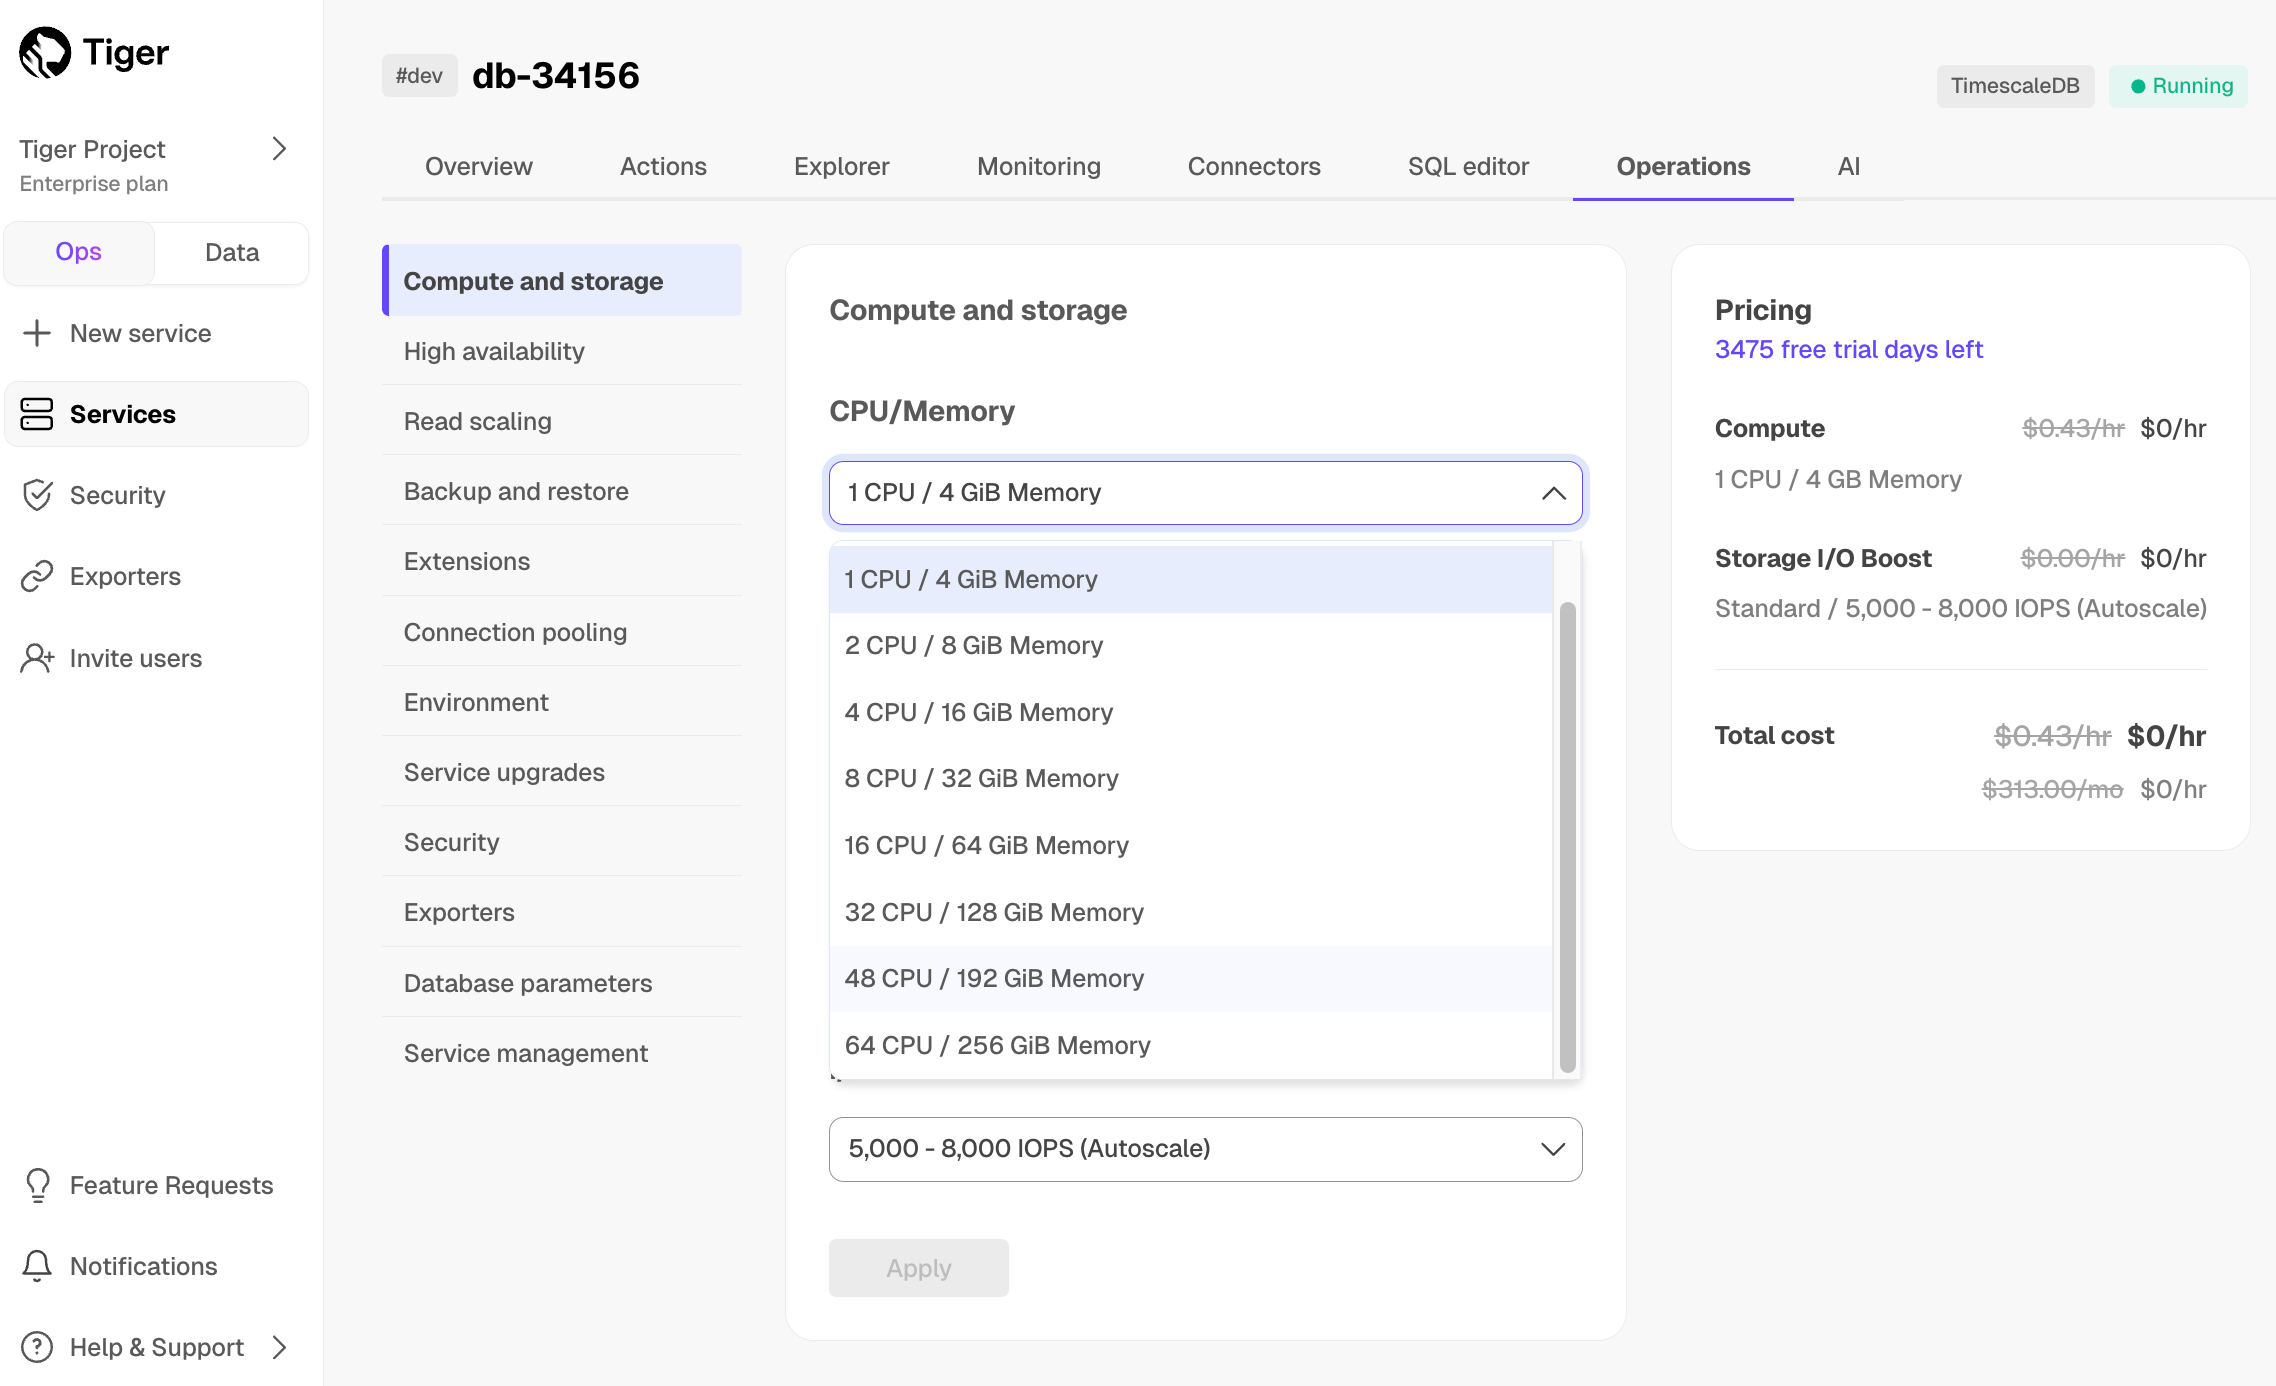
Note that:
- For the 48 CPU / 192 GiB option, 6 CPU / 14 GiB is reserved for platform operations.
- For the 64 CPU / 256 GiB option, 6 CPU / 16 GiB is reserved for platform operations.
There is momentary downtime while the new compute settings are applied. In most cases, this is less than a minute. However, before making changes to your service, best practice is to enable HA replication on the service. When you resize a service with HA enabled, Tiger Cloud:
- Resizes the replica.
- Waits for the replica to catch up.
- Performs a switchover to the resized replica.
- Restarts the primary.
HA reduce downtime in the case of resizes or maintenance window restarts, from a minute or so to a couple of seconds.
When you change resource settings, the current and new charges are displayed immediately so that you can verify how the changes impact your costs.
Because compute changes require an interruption to your services, plan accordingly so that the settings are applied during an appropriate service window.
- In Console, choose the service to modify.
- Click
Operations>Compute and storage. - Select the new
CPU / Memoryallocation. You see the allocation and costs in the comparison chart - Click
Apply. Your service goes down briefly while the changes are applied.
Out of memory errors
If you run intensive queries on your services, you might encounter out of memory (OOM) errors. This occurs if your query consumes more memory than is available.
When this happens, an
OOM killerprocess shuts down Postgres processes usingSIGKILLcommands until the memory usage falls below the upper limit. Because this kills the entire server process, it usually requires a restart.To prevent service disruption caused by OOM errors, Tiger Cloud attempts to shut down only the query that caused the problem. This means that the problematic query does not run, but that your service continues to operate normally.
If the normal OOM killer is triggered, the error log looks like this:
2021-09-09 18:15:08 UTC [560567]:TimescaleDB: LOG: server process (PID 2351983) was terminated by signal 9: Killed
Wait for the service to come back online before reconnecting.
- Tiger Cloud shuts the client connection only
If Tiger Cloud successfully guards the service against the OOM killer, it shuts down only the client connection that was using too much memory. This prevents the entire service from shutting down, so you can reconnect immediately. The error log looks like this:
2022-02-03 17:12:04 UTC [2253150]:TimescaleDB: tsdbadmin@tsdb,app=psql [53200] ERROR: out of memory===== PAGE: https://docs.tigerdata.com/use-timescale/time-buckets/use-time-buckets/ =====
Aggregate time-series data with time bucket
The
time_bucketfunction helps you group in a hypertable so you can perform aggregate calculations over arbitrary time intervals. It is usually used in combination withGROUP BYfor this purpose.This section shows examples of
time_bucketuse. To learn how time buckets work, see the about time buckets section.Group data by time buckets and calculate a summary value
Group data into time buckets and calculate a summary value for a column. For example, calculate the average daily temperature in a table named
weather_conditions. The table has a time column namedtimeand atemperaturecolumn:SELECT time_bucket('1 day', time) AS bucket, avg(temperature) AS avg_temp FROM weather_conditions GROUP BY bucket ORDER BY bucket ASC;The
time_bucketfunction returns the start time of the bucket. In this example, the first bucket starts at midnight on November 15, 2016, and aggregates all the data from that day:bucket | avg_temp -----------------------+--------------------- 2016-11-15 00:00:00+00 | 68.3704391666665821 2016-11-16 00:00:00+00 | 67.0816684374999347Group data by time buckets and show the end time of the bucket
By default, the
time_bucketcolumn shows the start time of the bucket. If you prefer to show the end time, you can shift the displayed time using a mathematical operation ontime.For example, you can calculate the minimum and maximum CPU usage for 5-minute intervals, and show the end of time of the interval. The example table is named
metrics. It has a time column namedtimeand a CPU usage column namedcpu:SELECT time_bucket('5 min', time) + '5 min' AS bucket, min(cpu), max(cpu) FROM metrics GROUP BY bucket ORDER BY bucket DESC;The addition of
+ '5 min'changes the displayed timestamp to the end of the bucket. It doesn't change the range of times spanned by the bucket.Group data by time buckets and change the time range of the bucket
To change the time range spanned by the buckets, use the
offsetparameter, which takes anINTERVALargument. A positive offset shifts the start and end time of the buckets later. A negative offset shifts the start and end time of the buckets earlier.For example, you can calculate the average CPU usage for 5-hour intervals, and shift the start and end times of all buckets 1 hour later:
SELECT time_bucket('5 hours', time, '1 hour'::INTERVAL) AS bucket, avg(cpu) FROM metrics GROUP BY bucket ORDER BY bucket DESC;Calculate the time bucket of a single value
Time buckets are usually used together with
GROUP BYto aggregate data. But you can also runtime_bucketon a single time value. This is useful for testing and learning, because you can see what bucket a value falls into.For example, to see the 1-week time bucket into which January 5, 2021 would fall, run:
SELECT time_bucket(INTERVAL '1 week', TIMESTAMP '2021-01-05');The function returns
2021-01-04 00:00:00. The start time of the time bucket is the Monday of that week, at midnight.===== PAGE: https://docs.tigerdata.com/use-timescale/time-buckets/about-time-buckets/ =====
About time buckets
Time bucketing is essential for real-time analytics. The
time_bucketfunction enables you to aggregate data in a hypertable into buckets of time. For example, 5 minutes, 1 hour, or 3 days. It's similar to Postgres'sdate_binfunction, but it gives you more flexibility in the bucket size and start time.You can use it to roll up data for analysis or downsampling. For example, you can calculate 5-minute averages for a sensor reading over the last day. You can perform these rollups as needed, or pre-calculate them in continuous aggregates.
This section explains how time bucketing works. For examples of the
time_bucketfunction, see the section on Aggregate time-series data withtime_bucket.How time bucketing works
Time bucketing groups data into time intervals. With
time_bucket, the interval length can be any number of microseconds, milliseconds, seconds, minutes, hours, days, weeks, months, years, or centuries.The
time_bucketfunction is usually used in combination withGROUP BYto aggregate data. For example, you can calculate the average, maximum, minimum, or sum of values within a bucket.
Origin
The origin determines when time buckets start and end. By default, a time bucket doesn't start at the earliest timestamp in your data. There is often a more logical time. For example, you might collect your first data point at
00:37, but you probably want your daily buckets to start at midnight. Similarly, you might collect your first data point on a Wednesday, but you might want your weekly buckets calculated from Sunday or Monday.Instead, time is divided into buckets based on intervals from the origin. The following diagram shows how, using the example of 2-week buckets. The first possible start date for a bucket is
origin. The next possible start date for a bucket isorigin + bucket interval. If your first timestamp does not fall exactly on a possible start date, the immediately preceding start date is used for the beginning of the bucket.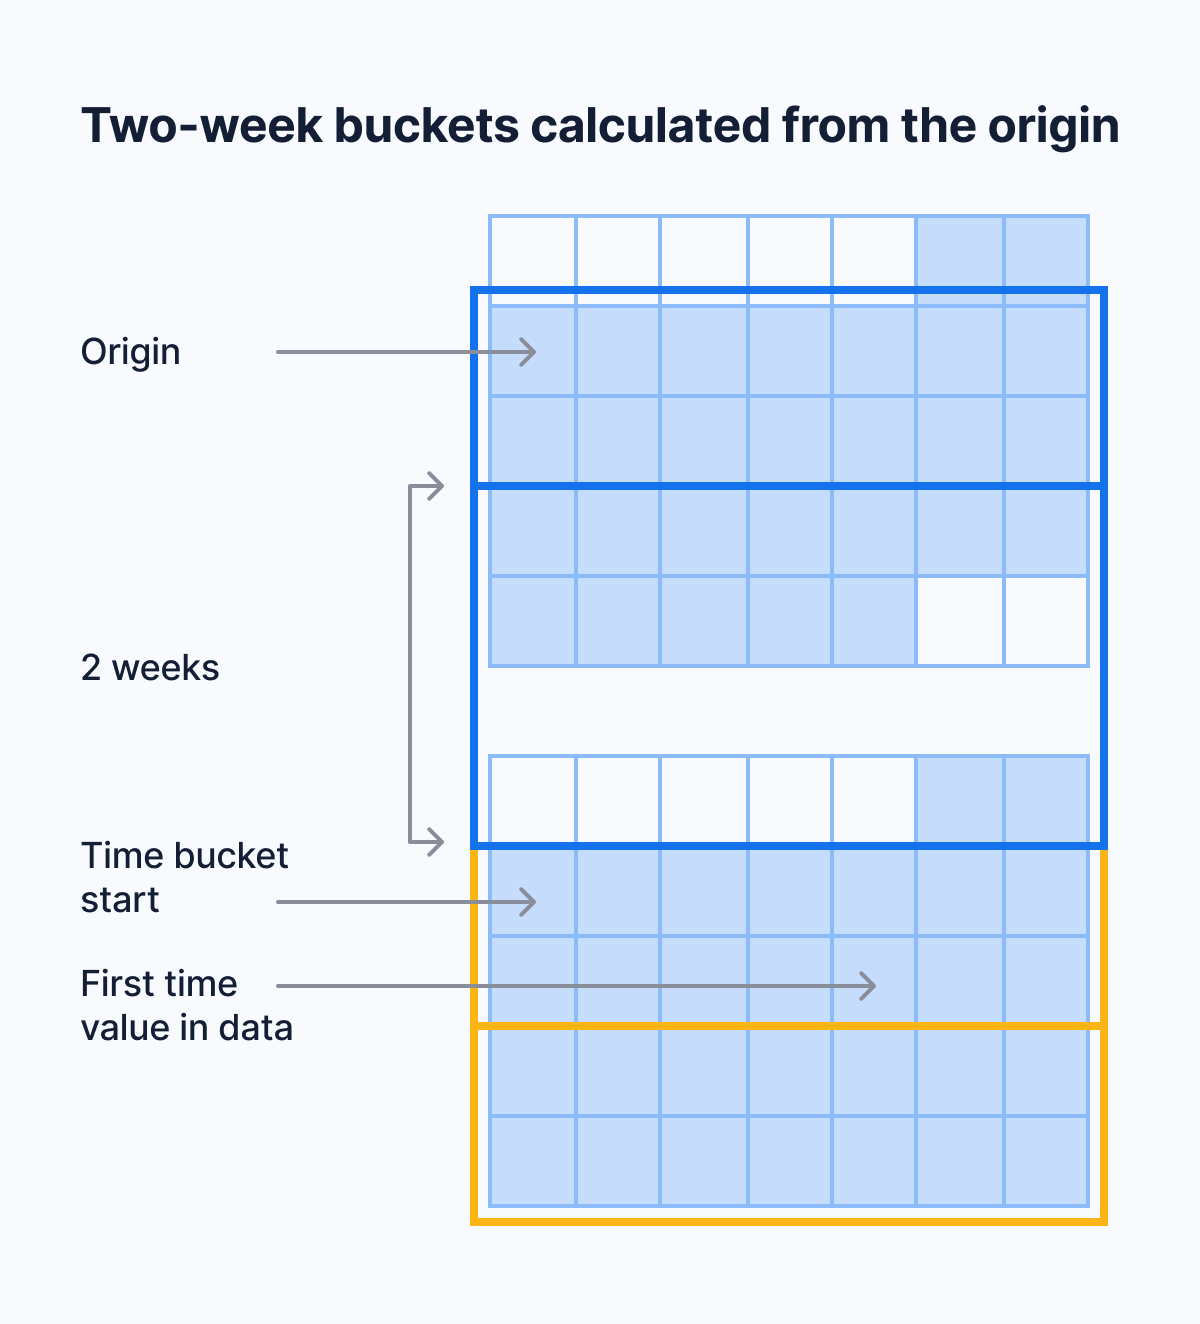
For example, say that your data's earliest timestamp is April 24, 2020. If you bucket by an interval of two weeks, the first bucket doesn't start on April 24, which is a Friday. It also doesn't start on April 20, which is the immediately preceding Monday. It starts on April 13, because you can get to April 13, 2020, by counting in two-week increments from January 3, 2000, which is the default origin in this case.
Default origins
For intervals that don't include months or years, the default origin is January 3, 2000. For month, year, or century intervals, the default origin is January 1,
- For integer time values, the default origin is 0.
These choices make the time ranges of time buckets more intuitive. Because January 3, 2000, is a Monday, weekly time buckets start on Monday. This is compliant with the ISO standard for calculating calendar weeks. Monthly and yearly time buckets use January 1, 2000, as an origin. This allows them to start on the first day of the calendar month or year.
If you prefer another origin, you can set it yourself using the
originparameter. For example, to start weeks on Sunday, set the origin to Sunday, January 2, 2000.Timezones
The origin time depends on the data type of your time values.
If you use
TIMESTAMP, by default, bucket start times are aligned with00:00:00. Daily and weekly buckets start at00:00:00. Shorter buckets start at a time that you can get to by counting in bucket increments from00:00:00on the origin date.If you use
TIMESTAMPTZ, by default, bucket start times are aligned with00:00:00 UTC. To align time buckets to another timezone, set thetimezoneparameter.===== PAGE: https://docs.tigerdata.com/mst/vpc-peering/vpc-peering-gcp/ =====
Set up Virtual Private Cloud (VPC) peering on GCP
You can configure VPC peering for your Managed Service for TimescaleDB project, using VPC provided by GCP.
Before you begin
- Set up a VPC peering for your project in MST.
- In your GCP console, click the project name and make a note of the
Project ID. - In your GCP console, go to
VPC Networks, find the VPC that you want to connect, and make a note of the network name for that VPC.
Configuring a VPC peering on GCP
To set up VPC peering for your project:
In MST Console, click
VPCand select the VPC connection that you created.Type the project ID of your GCP project in
GCP Project ID.Type the network name of the VPC in GCP in
GCP VPC network name.Click
Add peering connection.A new connection with a status of
Pending Peeris listed in your GCP console. Make a note of the project name and the network name.In the GCP console, go to
VPC>VPC network peeringand selectCreate Connection.Type a name for the peering connection and type the project ID and network name that you made a note of.
Click
Create.
After the peering is successful, it is active in both MST_CONSOLE_SHORT and your GCP console.
===== PAGE: https://docs.tigerdata.com/mst/vpc-peering/vpc-peering/ =====
Configure VPC peering
You can Configure VPC peering for your Managed Service for TimescaleDB project, using the VPC section of the dashboard for your project. VPC peering setup is a per project and per region setting. This means that all services created and running utilize the same VPC peering connection. If needed, you can have multiple projects that peer with different connections.
Configuring a VPC peering
You can configure VPC peering as a project and region-specific setting. This means that all services created and running use the same VPC peering connection. If necessary, you can use different connections for VPC peering across multiple projects. Only Admin and operator user roles can create a VPC.
To set up VPC peering for your project:
In MST Console, click
VPC.Click
Create VPC.Choose a cloud provider in the
Cloudlist.In the
IP rangefield, type the IP range that you want to use for the VPC connection. Use an IP range that does not overlap with any networks that you want to connect through VPC peering. For example, if your own networks use the range 10.0.0.0/8, you could set the range for your Managed Service for TimescaleDB project VPC to 192.168.0.0/24.Click
Create VPC.
The state of the VPC is listed in the table.
===== PAGE: https://docs.tigerdata.com/mst/vpc-peering/vpc-peering-aws-transit/ =====
Set up Transit Gateway on AWS
AWS Transit Gateway (TGW) enables transitive routing from on-premises networks through VPN and from other VPC. By creating a Transit Gateway VPC attachment, services in an MST Project VPC can route traffic to all other networks attached - directly or indirectly - to the Transit Gateway.
Before you begin
- Set up a VPC peering for your project in MST.
- In your AWS console, go to
My Accountand make a note of youraccount ID. - In your AWS console, go to
Transit Gateways, find the transit gateway that you want to attach, and make a note of the ID.
Attaching a VPC to an AWS Transit Gateway
To set up VPC peering for your project:
- In MST Console, click
VPCand select the VPC connection that you created. In the
VPC Peering connectionspage selectTransit Gateway VPC Attachment.Type the account ID of your AWS account in
AWS Account ID.Type the ID of the Transit Gateway of AWS in
Transit Gateway ID.Type the IP range in the
Network cidrsfield.Each Transit Gateway has a route table of its own, and by default routes traffic to each attached network directly to attached VPCs or indirectly through VPN attachments. The attached VPCs' route tables need to be updated to include the TGW as a target for any IP range (CIDR) that should be routed using the VPC attachment. These IP ranges must be configured when creating the attachment for an MST Project VPC.
Click
Add peering connection.A new connection with a status of
Pending Acceptanceis listed in your AWS console. Verify that the account ID and transit gateway ID match those listed in MST Console.In the AWS console, go to
Actionsand selectAccept Request. Update your AWS route tables to match your Managed Service for TimescaleDB CIDR settings.
After you accept the request in AWS Console, the peering connection is active in the MST Console.
===== PAGE: https://docs.tigerdata.com/mst/vpc-peering/vpc-peering-aws/ =====
Set up Virtual Private Cloud (VPC) peering on AWS
You can configure VPC peering for your Managed Service for TimescaleDB project, using the VPC on AWS.
Before you begin
- Set up a VPC peering for your project in MST.
- In your AWS console, go to
My Accountand make a note of youraccount ID. - In your AWS console, go to
Peering connections, find the VPC that you want to connect, and make a note of the ID for that VPC.
Configuring a VPC peering
To set up VPC peering for your project:
In MST Console, click
VPCand select the VPC connection that you created.Type the account ID of your AWS account in
AWS Account ID.Type the ID of the VPC in AWS in
AWS VPC ID.Click
Add peering connection.A new connection with a status of
Pending Acceptanceis listed in your AWS console. Verify that the account ID and VPC ID match those listed in MST Console.In the AWS console, go to
Actionsand selectAccept Request. Update your AWS route tables to match your Aiven CIDR settings.
After you accept the request in AWS Console, the peering connection is active in the MST portal.
===== PAGE: https://docs.tigerdata.com/mst/vpc-peering/vpc-peering-azure/ =====
Set up Virtual Private Cloud (VPC) peering on Azure
You can Configure VPC peering for your Managed Service for TimescaleDB project, using the VPC on Azure.
Before you begin
- Installed Aiven Client.
- Signed in to MST Console.
- Set up a VPC peering for your project in MST.
Configuring a VPC peering on Azure
Log in with an Azure administration account, using the Azure CLI:
az account clear az loginThis should open a window in your browser prompting you to choose an Azure account to log in with. You need an account with at least the Application administrator role to create VPC peering. If you manage multiple Azure subscriptions, configure the Azure CLI to default to the correct subscription using the command:
az account set --subscription <subscription name or id>Create an application object in your AD tenant, using the Azure CLI:
az ad app create --display-name "<NAME>" --sign-in-audience AzureADMultipleOrgs --key-type PasswordThis creates an entity to your AD that can be used to log into multiple AD tenants (
--sign-in-audience AzureADMultipleOrgs), but only the home tenant (the tenant the app was created in) has the credentials to authenticate the app. Save theappIdfield from the output - this is referred to as$user_app_id.Create a service principal for your app object. Ensure that the service principal is created to the Azure subscription containing the VNet you wish to peer:
az ad sp create --id $user_app_idThis creates a service principal to your subscription that may have permissions to peer your VNet. Save the
objectIdfield from the output - this is referred to as$user_sp_id.Set a password for your app object:
az ad app credential reset --id $user_app_idSave the password field from the output - this is referred to as
$user_app_secret.Find the ID properties of your virtual network:
az network vnet listMake a note of these:
- The id field, which is referred to as
$user_vnet_id - The Azure Subscription ID, which is the part after
/subscriptions/in theresource ID. This is referred to as$user_subscription_id. - The resource group name or the
resourceGroupfield in the output. This is referred to as$user_resource_group. The Vnet name or the name field from the output as
$user_vnet_nameThe$user_vnet_idshould have the format:/subscriptions/$user_subscription_id/resourceGroups/$user_resource_group/providers/Microsoft.Network/virtualNetworks/$user_vnet_name.
- The id field, which is referred to as
Grant your service principal permissions to peer. The service principal that you created needs to be assigned a role that has permission for the
Microsoft.Network/virtualNetworks/virtualNetworkPeerings/writeaction on the scope of your VNet. To limit the permissions granted to the app object and service principal, you can create a custom role with just that permission. The built-inNetwork Contributorrole includes that permission, and can be found usingaz role definition list --name "Network Contributor"The id field from the output is used as$network_contributor_role_idto assign the service principal that role:az role assignment create --role $network_contributor_role_id --assignee-object-id $user_sp_id --scope $user_vnet_idThis allows the application object to manage the network in the
--scope. Because you control the application object, it may also be given permission for the scope of an entire resource group, or the whole subscription to allow create other peerings later without assigning the role again for each VNet separately.Create a service principal for the Managed Service for TimescaleDB application object
The Managed Service for TimescaleDB AD tenant contains an application object similar to the one you created, and Managed Service for TimescaleDB uses it to create a peering from the Project VPC VNet in Managed Service for TimescaleDB to the VNet in Azure. For this, the Managed Service for TimescaleDB app object needs a service principal in your subscription:
az ad sp create --id <ID_OF_THE_TIMESCALE_APPLICATION_OBJECT>Save the
objectIdfield from the output - it is referred to as$aiven_sp_id.If this fails with the error "When using this permission, the backing application of the service principal being created must in the local tenant" then your account does not have the correct permissions. Use an account with at least the Application administrator role assigned.
Create a custom role for the Managed Service for TimescaleDB application object
The Managed Service for TimescaleDB application now has a service principal that can be given permissions. In order to target a network in your subscription with a peering and nothing else, you can create a custom role definition, with only a single action allowing to do that and only that:
az role definition create --role-definition '{"Name": "<name of your choosing>", "Description": "Allows creating a peering to vnets in scope (but not from)", "Actions": ["Microsoft.Network/virtualNetworks/peer/action"], "AssignableScopes": ["/subscriptions/'$user_subscription_id'"]}'Creating a custom role must include your subscription's id in
AssignableScopes. This in itself does not give permissions to your subscription - it merely restricts which scopes a role assignment can include. Save the id field from the output - this is referred to as$aiven_role_id.Assign the custom role to the service principal to peer with your VNet. Assign the role that you created in the previous step to the Managed Service for TimescaleDB service principal with the scope of your VNet:
az role assignment create --role $aiven_role_id --assignee-object-id $aiven_sp_id --scope $user_vnet_idGet your Azure Active Directory (AD) tenant id:
az account list
Make note of the
tenantIdfield from the output. It is referred to as$user_tenant_id.Create a peering connection from the Managed Service for TimescaleDB Project VPC using Aiven CLI:
avn vpc peering-connection create --project-vpc-id $aiven_project_vpc_id --peer-cloud-account $user_subscription_id --peer-resource-group $user_resource_group --peer-vpc $user_vnet_name --peer-azure-app-id $user_app_id --peer-azure-tenant-id $user_tenant_id$aiven_project_vpc_idis the ID of the Managed Service for TimescaleDB project VPC, and can be found using theavn vpc listcommand.
Managed Service for TimescaleDB creates a peering from the VNet in the Managed Service for TimescaleDB
Project VPC to the VNet in your subscription. In addition, it creates a service principal for the application object in your tenant `--peer-azure-app-id $user_app_id`, giving it permission to target the Managed Service for TimescaleDB subscription VNet with a peering. Your AD tenant ID is also needed in order for the Managed Service for TimescaleDB application object to authenticate with your tenant to give it access to the service principal that you created `--peer-azure-tenant-id $user_tenant_id`. Ensure that the arguments starting with `$user_` are in lower case. Azure resource names are case-agnostic, but the Aiven API currently only accepts names in lower case. If no error is shown, the peering connection is being set up by Managed Service for TimescaleDB.Run the following command until the state is no longer
APPROVED, butPENDING_PEER:avn vpc peering-connection get -v --project-vpc-id $aiven_project_vpc_id --peer-cloud-account $user_subscription_id --peer-resource-group $user_resource_group --peer-vpc $user_vnet_nameA state such as
INVALID_SPECIFICATIONorREJECTED_BY_PEERmay be shown if the VNet specified did not exist, or the Managed Service for TimescaleDB app object wasn't given permissions to peer with it. If that occurs, check your configuration and then recreate the peering connection. If everything went as expected, the state changes toPENDING_PEERwithin a couple of minutes showing details to set up the peering connection from your VNet to the Project VPC's VNet in Managed Service for TimescaleDB.Save the
to-tenant-idfield in the output. It is referred to as theaiven_tenant_id. Theto-network-idfield from the output is referred to as the$aiven_vnet_id.Log out the Azure user you logged in using:
az account clearLog in the application object you created to your AD tenant using:
az login --service-principal -u $user_app_id -p $user_app_secret --tenant $user_tenant_idLog in the same application object to the Managed Service for TimescaleDB AD tenant:
az login --service-principal -u $user_app_id -p $user_app_secret --tenant $aiven_tenant_idNow your application object has a session with both AD tenants
Create a peering from your VNet to the VNet in the Managed Service for TimescaleDB subscription:
az network vnet peering create --name <peering name of your choosing> --remote-vnet $aiven_vnet_id --vnet-name $user_vnet_name --resource-group $user_resource_group --subscription $user_subscription_id --allow-vnet-accessIf you do not specify
--allow-vnet-accessno traffic is allowed to flow from the peered VNet and services cannot be reached through the peering. After the peering has been created, the peering should be in the stateconnected.In case you get the following error, it's possible the role assignment hasn't taken effect yet. If that is the case, try logging in again and creating the peering again after waiting a bit by repeating the commands in this step. If the error message persists, check the role assignment was correct.
The client `<random uuid>` with object id `<another random uuid>` does not have authorization to perform action `Microsoft.Network/virtualNetworks/virtualNetworkPeerings/write` over scope '$user_vnet_id' If access was recently granted, refresh your credentials.In the Aiven CLI, check if the peering connection is
ACTIVE:avn vpc peering-connection get -v --project-vpc-id $aiven_project_vpc_id --peer-cl
Managed Service for TimescaleDB polls peering connections in state
PENDING_PEERregularly to see if your subscription has created a peering connection to the Managed Service for TimescaleDB Project VPC's VNet. After this is detected, the state changes from `PENDING_PEER` to `ACTIVE`. After this services in the Project VPC can be reached through the peering.===== PAGE: https://docs.tigerdata.com/mst/integrations/grafana-mst/ =====
Integrate Managed Service for TimescaleDB as a data source in Grafana
You can integrate Managed Service for TimescaleDB with Grafana to visualize your data. Grafana service in MST has built-in Prometheus, Postgres, Jaeger, and other data source plugins that allow you to query and visualize data from a compatible database.
Prerequisites
Before you begin, make sure you have:
- Created a service
- Created a Grafana service
Configure Managed Service for TimescaleDB as a data source
You can configure a service as a data source to a Grafana service to query and visualize the data from the database.
Configuring Managed Service for TimescaleDB as a data source
- In MST Console, click the service that you want to add as a data source for the Grafana service.
- In the
Overviewtab for the service go to theService Integrationssection. - Click the
Set up integrationbutton. - In the
Available service integrations for TimescaleDBdialog, click theUse Integrationbutton forDatasource. - In the dialog that appears, choose the Grafana service in the drop-down menu,
and click the
Enablebutton. - In the
Servicesview, click the Grafana service to which you added the MST service as a data source. - In the
Overviewtab for the Grafana service, make a note of theUserandPasswordfields. - In the
Overviewtab for the Grafana service, click the link in theService URIfield to open Grafana. - Log in to Grafana with your service credentials.
- Navigate to
Configuration→Data sources. The data sources page lists Managed Service for TimescaleDB as a configured data source for the Grafana instance.
When you have configured Managed Service for TimescaleDB as a data source in Grafana, you can create panels that are populated with data using SQL.
===== PAGE: https://docs.tigerdata.com/mst/integrations/google-data-studio-mst/ =====
Integrate Managed Service for TimescaleDB and Google Data Studio
You can create reports or perform some analysis on data you have in Managed Service for TimescaleDB using Google Data Studio. You can use Data Studio to integrate other data sources, such as YouTube Analytics, MySQL, BigQuery, AdWords, and others.
Before you begin
- You should also have a Google account.
- In the overview page of your service:
- Download the CA certificate named
ca.pemfor your service. - Make a note of the
Host,Port,Database name,User, andPasswordfields for the service.
- Download the CA certificate named
Connecting to a Managed Service for TimescaleDB data source from Data Studio
- Log in to Google and open Google Data Studio.
- Click the
Create +button and chooseData source. - Select
PostgreSQLas the Google Connector. - In the
Database Authenticationtab, type details for theHost Name,Port,Database,Username, andPasswordfields. - Select
Enable SSLand upload your server certificate file,ca.pem. - Click
AUTHENTICATE. - Choose the table to be queried, or select
CUSTOM QUERYto create an SQL query. - Click
CONNECT.
===== PAGE: https://docs.tigerdata.com/mst/integrations/logging/ =====
Logging
There are a number of different ways to review logs and metrics for your services. You can use the native logging tool in MST Console, retrieve details logs using the Aiven CLI tool, or integrate a third-party service, such as SolarWinds Loggly.
Native logging
To see the most recent logged events for your service.
- In MST Console, in the
Servicestab, find the service you want to review, and check it is marked asRunning. Navigate to the
Logstab to see a constantly updated list of logged events.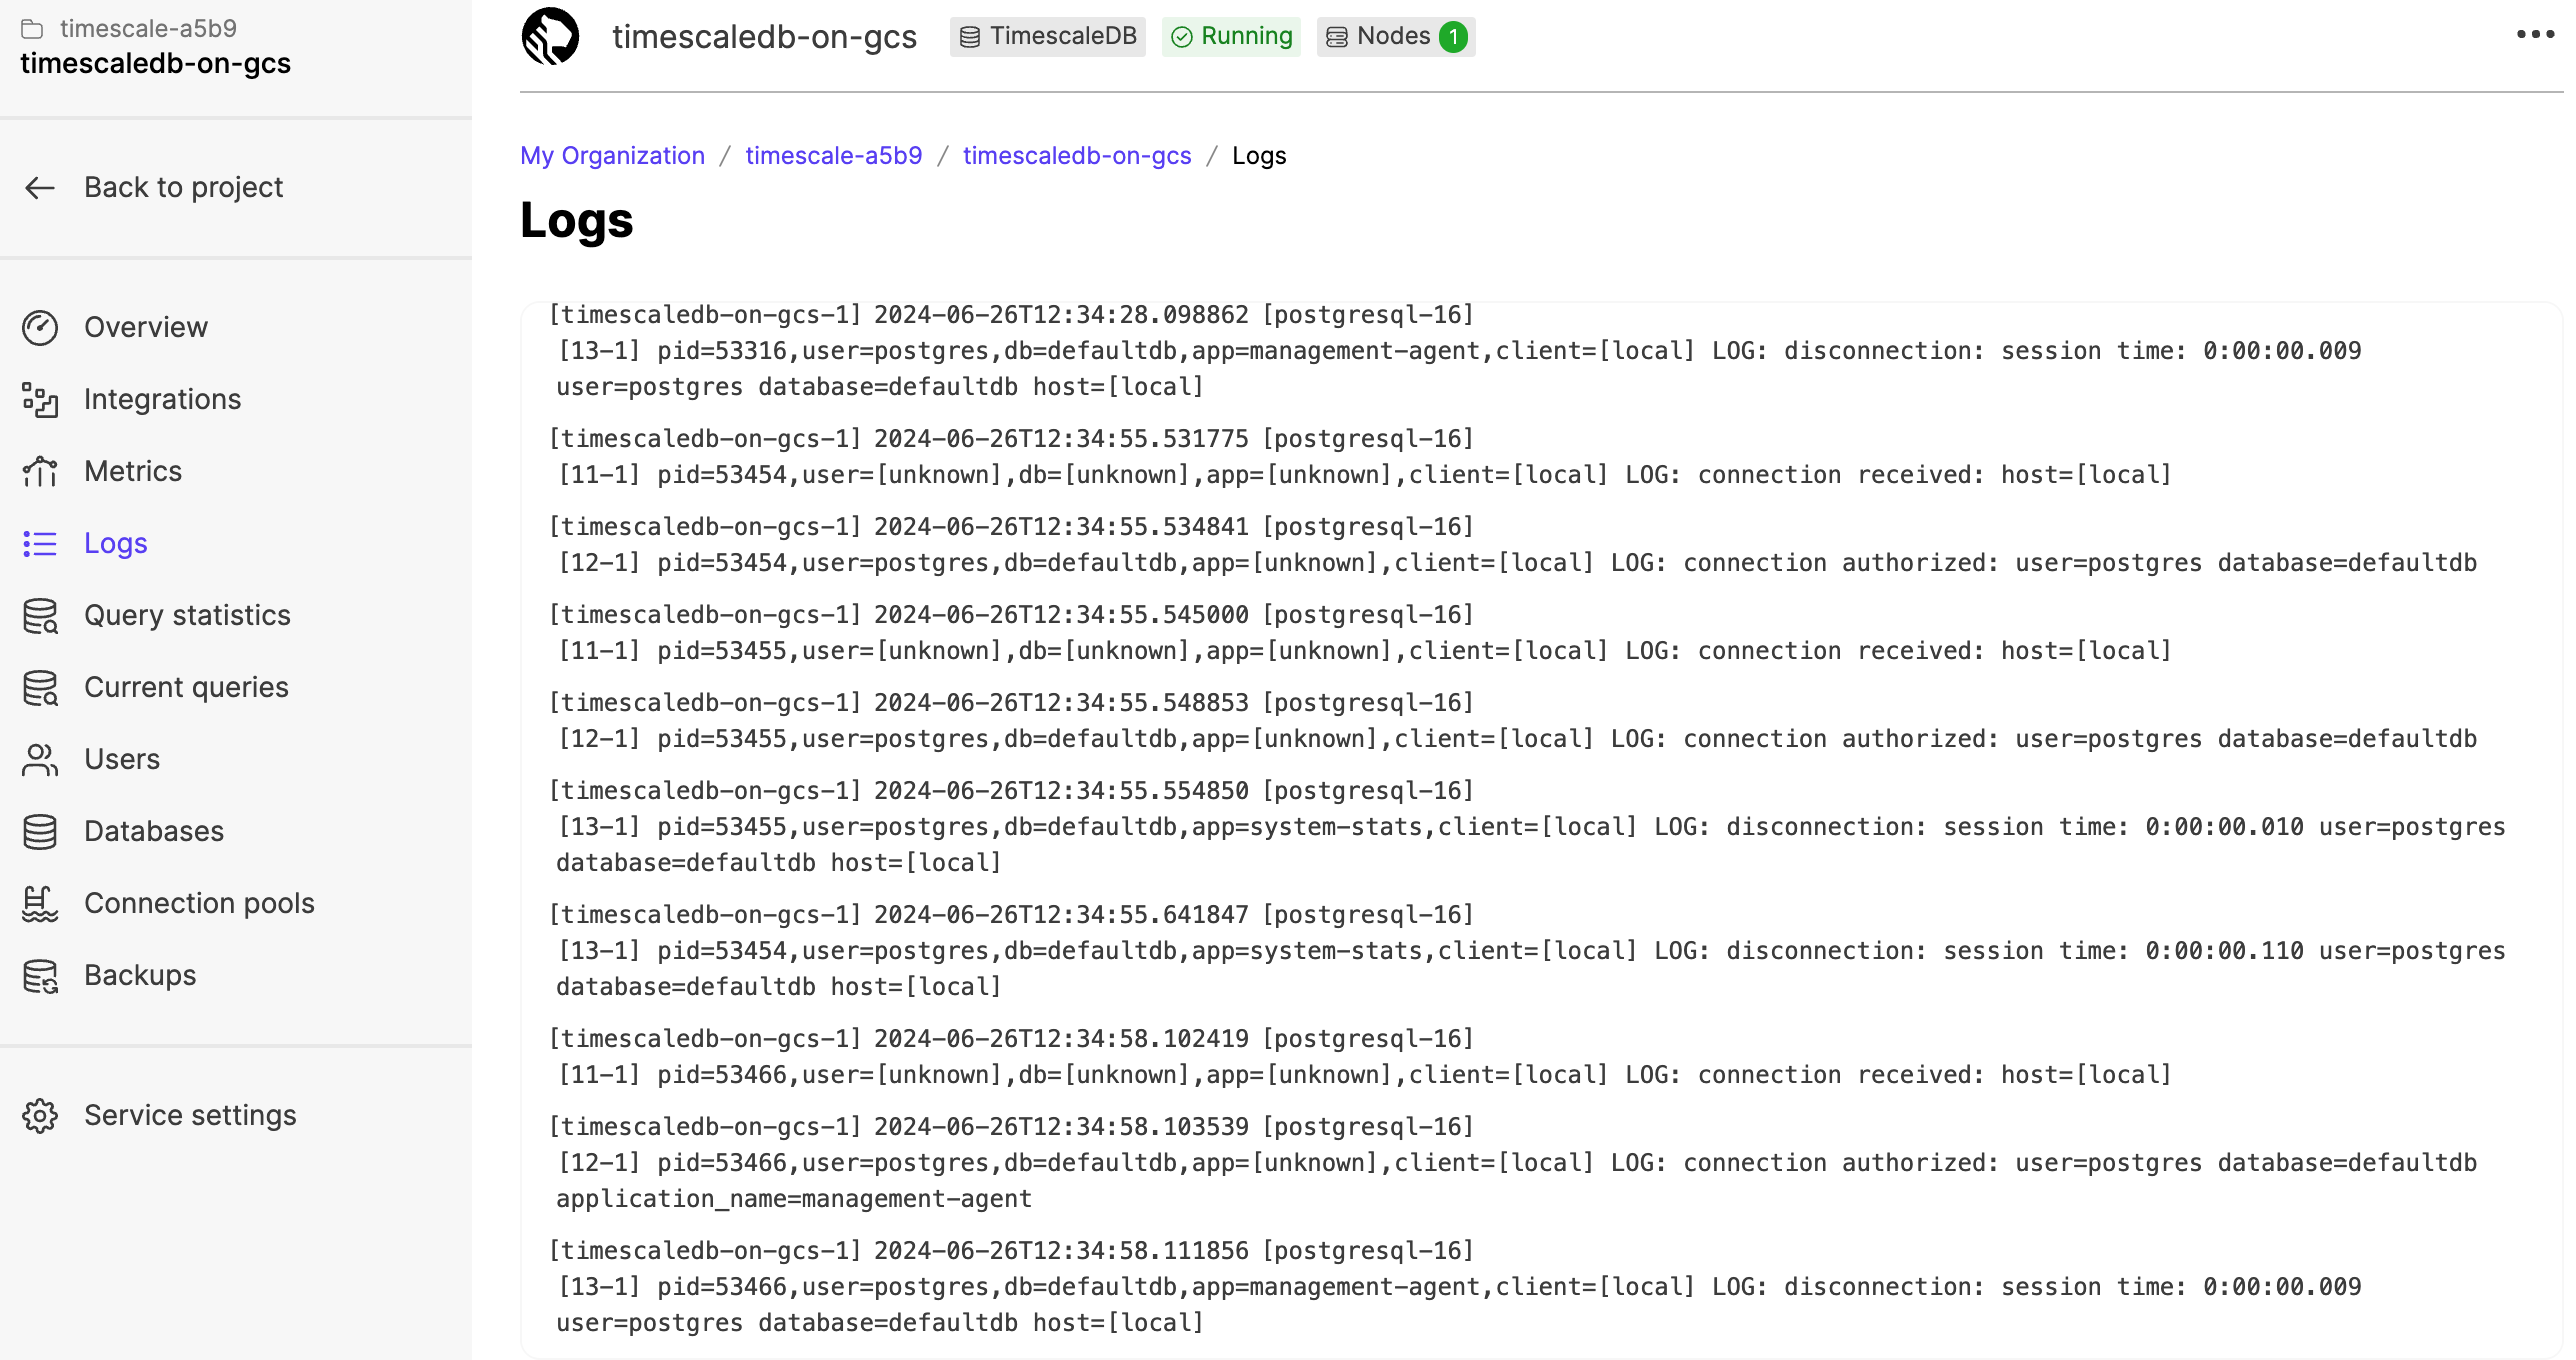
Dump logs to a text file with the Aiven CLI
If you want to dump your Managed Service for TimescaleDB logs to a text file or an archive for use later on, you can use the Aiven CLI.
Sign in to your Managed Service for TimescaleDB account from the Aiven CLI tool, and use this command to dump your logs to a text file called
tslogs.txt:avn service logs -S desc -f --project <project name> <service_name> > tslogs.txtFor more information about the Aiven CLI tool, see the Aiven CLI section.
Logging integrations
If you need to access logs for your services regularly, or if you need more detailed logging than Managed Service for TimescaleDB can provide in MST Console, you can connect your Managed Service for TimescaleDB to a logging service such as SolarWinds Loggly.
This section covers how to create a service integration to Loggly with Managed Service for TimescaleDB.
Creating a Loggly service integration
- Navigate to SolarWinds Loggly and create or log in to your account.
- From the Loggly Home screen, navigate to
Logs→Source Setup. ClickCustomer Tokensfrom the top menu bar. - On the
Customer Tokenspage, clickAdd Newto create a new token. Give your token a name, and clickSave. Copy your new token to your clipboard. - Log in to your Managed Service for TimescaleDB account, and navigate
to
Service Integrations. - In the
Service Integrationspage, navigate toSyslog, and clickAdd new endpoint. In the
Create new syslog endpointdialog, complete these fields:- In the
Endpoint namefield, type a name for your endpoint. - In the
Serverfield, typelogs-01.loggly.com. - In the
Portfield, type514. - Uncheck the
TLScheckbox. - In the
Formatfield, selectrfc5425. - In the
Structured Datafield, type<LOGGLY_TOKEN>@41058, using the Loggly token you copied earlier. You can also add a tag here, which you can use to more easily search for your logs in Loggly. For example,8480330f5-aa09-46b0-b220-a0efa372b17b@41058 TAG="example-tag".
Click
Createto create the endpoint. When the endpoint has been created, it shows as an enabled service integration, with a greenactiveindicator.- In the
In the Loggly dashboard, navigate to
Searchto see your incoming logs. From here, you can create custom dashboards and view reports for your logs.
===== PAGE: https://docs.tigerdata.com/mst/integrations/metrics-datadog/ =====
Metrics and Datadog
Datadog is a popular cloud-based monitoring service. You can send metrics to Datadog using a metrics collection agent for graphing, service dashboards, alerting, and logging. Managed Service for TimescaleDB (MST) can send data directly to Datadog for monitoring. Datadog integrations are provided free of charge on Managed Service for TimescaleDB.
You need to create a Datadog API key, and use the key to enable metrics for your service.
Datadog logging is not currently supported on MST.
Prerequisites
Before you begin, make sure you have:
- Created a service.
- Signed up for Datadog, and can log in to your Datadog dashboard.
- Created an API key in your Datadog account. For more information about creating a Datadog API key, see Datadog API and Application Keys.
Upload a Datadog API key
To integrate MST with Datadog you need to upload the API key that you generated in your Datadog account to MST.
Uploading a Datadog API key to MST
- In MST Console, choose the project you want to connect to Datadog,
and click
Integration Endpoints. - Select
Datadog, then chooseCreate new. - In
Add new Datadog service integration. complete these details:- In the
Endpoint integrationsection, give your endpoint a name, and paste the API key from your Datadog dashboard. Ensure you choose the site location that matches where your Datadog service is hosted. - Optional: In the
Endpoint tagssection, you can add custom tags to help you manage your integrations.
- In the
- Click
Add endpointto save the integration.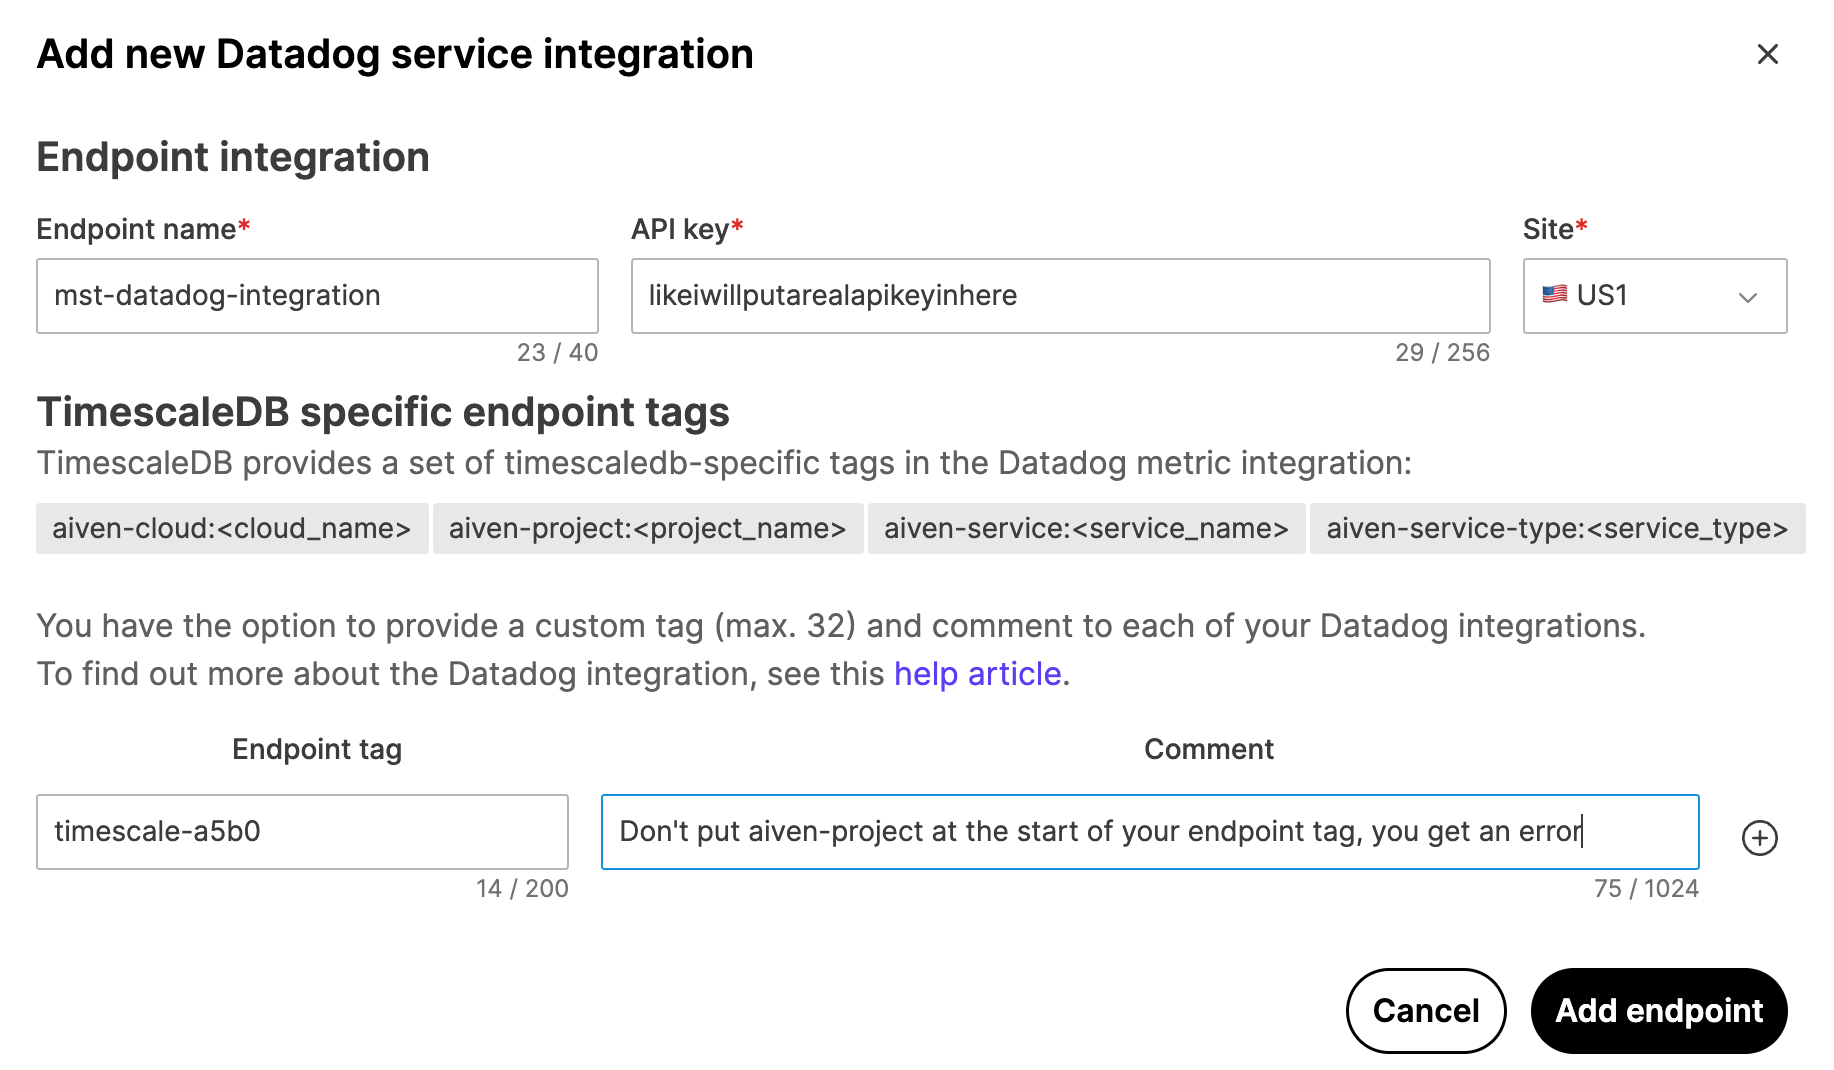
Activate Datadog integration for a service
When you have successfully added the endpoint, you can set up one of your service to send data to Datadog.
Activating Datadog integration for a service
- Sign in to MST Console, navigate to
Services, and select the service you want to monitor. - In the
Integrationstab, go toExternal integrationssection and selectDatadog Metrics. - In the
Datadog integrationdialog, select the Datadog endpoint that you created. Click
Enable.The Datadog endpoint is listed under
Enabled integrationsfor the service.
Datadog dashboards
When you have your Datadog integration set up successfully, you can use the Datadog dashboard editor to configure your visualizations. For more information, see the Datadog Dashboard documentation.
===== PAGE: https://docs.tigerdata.com/mst/integrations/prometheus-mst/ =====
Prometheus endpoint for Managed Service for TimescaleDB
You can get more insights into the performance of your service by monitoring it using Prometheus, a popular open source metrics-based systems monitoring solution.
Prerequisites
Before you begin, make sure you have:
- Created a service.
- Made a note of the
PortandHostfor your service.
Enabling Prometheus service integration
- In MST Console, choose a project and navigate to
Integration Endpoints. - In the
Integration endpointspage, navigate toPrometheus, and clickCreate new. In the
Create new Prometheus endpointdialog, complete these fields:- In the
Endpoint namefield, type a name for your endpoint. - In the
Usernamefield, type your username. - In the
Passwordfield, type your password. - Click
Createto create the endpoint.
These details are used when setting up your Prometheus installation, in the
prometheus.ymlconfiguration file. This allows you to make this Managed Service for TimescaleDB endpoint a target for Prometheus to scrape.- In the
Use this sample configuration file to set up your Prometheus installation, by substituting
<PORT>,<HOST>,<USER>, and<PASSWORD>with those of your service:global: scrape_interval: 10s evaluation_interval: 10s scrape_configs: - job_name: prometheus scheme: https static_configs: - targets: ['<HOST>:<PORT>'] tls_config: insecure_skip_verify: true basic_auth: username: <USER> password: <PASSWORD> remote_write: - url: "http://<HOST>:9201/write" remote_read: - url: "http://<HOST>:9201/read"In the MST Console, navigate to
Servicesand select the service you want to monitor.In the
Integrationstab, go toExternal integrationssection and selectPrometheus.In the
Prometheus integrationsdialog, select the Prometheus endpoint that you created.Click
Enable.The Prometheus endpoint is listed under
Enabled integrationsfor the service.
===== PAGE: https://docs.tigerdata.com/mst/aiven-client/replicas-cli/ =====
Create a read-only replica using Aiven client
Read-only replicas enable you to perform read-only queries against the replica and reduce the load on the primary server. It is also a good way to optimize query response times across different geographical locations, because the replica can be placed in different regions or even different cloud providers.
Prerequisites
Before you begin, make sure you have:
- Created a service.
- Installed Aiven Client.
Creating a read-only replica of your service
In the Aiven client, connect to your service.
Switch to the project that contains the service you want to create a read-only replica for:
avn project switch <PROJECT>List the MST_SERVICE_SHORTs in the project, and make a note of the service that you want to create a read-only replica for. It is listed under the
SERVICE_NAMEcolumn in the output:avn service listGet the details of the service that you want to fork:
avn service get <SERVICE_NAME>Create a read-only replica:
avn service create <NAME_OF_REPLICA> --project <PROJECT_ID>\ -t pg --plan <PLAN_TYPE> --cloud timescale-aws-us-east-1\ -c pg_read_replica=true\ -c service_to_fork_from=<NAME_OF_SERVICE_TO_FORK>\ -c pg_version=11 -c variant=timescale
Example
To create a fork named
replica-forkfor a service namedtimescaledbwith these parameters:PROJECT_ID:fork-projectCLOUD_NAME:timescale-aws-us-east-1PLAN_TYPE:timescale-basic-100-compute-optimizedavn service create replica-fork --project fork-project\ -t pg --plan timescale-basic-100-compute-optimized\ --cloud timescale-aws-us-east-1 -c pg_read_replica=true\ -c service_to_fork_from=timescaledb -c\ pg_version=11 -c variant=timescale
You can switch to
project-forkand view the newly createdreplica-forkusing:avn service list===== PAGE: https://docs.tigerdata.com/_partials/_install-self-hosted-docker-based/ =====
Run the TimescaleDB Docker image
The TimescaleDB HA Docker image offers the most complete TimescaleDB experience. It uses Ubuntu, includes TimescaleDB Toolkit, and support for PostGIS and Patroni.
To install the latest release based on Postgres 17:
docker pull timescale/timescaledb-ha:pg17TimescaleDB is pre-created in the default Postgres database and is added by default to any new database you create in this image.
Run the container
Replace
</a/local/data/folder>with the path to the folder you want to keep your data in the following command.docker run -d --name timescaledb -p 5432:5432 -v </a/local/data/folder>:/pgdata -e PGDATA=/pgdata -e POSTGRES_PASSWORD=password timescale/timescaledb-ha:pg17If you are running multiple container instances, change the port each Docker instance runs on.
On UNIX-based systems, Docker modifies Linux IP tables to bind the container. If your system uses Linux Uncomplicated Firewall (UFW), Docker may override your UFW port binding settings. To prevent this, add
DOCKER_OPTS="--iptables=false"to/etc/default/docker.Connect to a database on your Postgres instance
The default user and database are both
postgres. You set the password inPOSTGRES_PASSWORDin the previous step. The default command to connect to Postgres is:psql -d "postgres://postgres:password@localhost/postgres"Check that TimescaleDB is installed
\dxYou see the list of installed extensions:
Name | Version | Schema | Description ---------------------+---------+------------+--------------------------------------------------------------------------------------- plpgsql | 1.0 | pg_catalog | PL/pgSQL procedural language timescaledb | 2.20.3 | public | Enables scalable inserts and complex queries for time-series data (Community Edition) timescaledb_toolkit | 1.21.0 | public | Library of analytical hyperfunctions, time-series pipelining, and other SQL utilities (3 rows)Press
qto exit the list of extensions.
More Docker options
If you want to access the container from the host but avoid exposing it to the outside world, you can bind to
127.0.0.1instead of the public interface, using this command:docker run -d --name timescaledb -p 127.0.0.1:5432:5432 \ -v </a/local/data/folder>:/pgdata -e PGDATA=/pgdata -e POSTGRES_PASSWORD=password timescale/timescaledb-ha:pg17If you don't want to install
psqland other Postgres client tools locally, or if you are using a Microsoft Windows host system, you can connect using the version ofpsqlthat is bundled within the container with this command:docker exec -it timescaledb psql -U postgresWhen you install TimescaleDB using a Docker container, the Postgres settings are inherited from the container. In most cases, you do not need to adjust them. However, if you need to change a setting, you can add
-c setting=valueto your Dockerruncommand. For more information, see the Docker documentation.The link provided in these instructions is for the latest version of TimescaleDB on Postgres 17. To find other Docker tags you can use, see the Dockerhub repository.
View logs in Docker
If you have TimescaleDB installed in a Docker container, you can view your logs using Docker, instead of looking in
/var/lib/logsor/var/logs. For more information, see the Docker documentation on logs.Run the TimescaleDB Docker image
The light-weight TimescaleDB Docker image uses Alpine and does not contain TimescaleDB Toolkit or support for PostGIS and Patroni.
To install the latest release based on Postgres 17:
docker pull timescale/timescaledb:latest-pg17TimescaleDB is pre-created in the default Postgres database and added by default to any new database you create in this image.
Run the container
docker run -v </a/local/data/folder>:/pgdata -e PGDATA=/pgdata \ -d --name timescaledb -p 5432:5432 -e POSTGRES_PASSWORD=password timescale/timescaledb:latest-pg17If you are running multiple container instances, change the port each Docker instance runs on.
On UNIX-based systems, Docker modifies Linux IP tables to bind the container. If your system uses Linux Uncomplicated Firewall (UFW), Docker may override your UFW port binding settings. To prevent this, add
DOCKER_OPTS="--iptables=false"to/etc/default/docker.Connect to a database on your Postgres instance
The default user and database are both
postgres. You set the password inPOSTGRES_PASSWORDin the previous step. The default command to connect to Postgres in this image is:psql -d "postgres://postgres:password@localhost/postgres"Check that TimescaleDB is installed
\dx
You see the list of installed extensions:
```sql Name | Version | Schema | Description ---------------------+---------+------------+--------------------------------------------------------------------------------------- plpgsql | 1.0 | pg_catalog | PL/pgSQL procedural language timescaledb | 2.20.3 | public | Enables scalable inserts and complex queries for time-series data (Community Edition) ``` Press `q` to exit the list of extensions.More Docker options
If you want to access the container from the host but avoid exposing it to the outside world, you can bind to
127.0.0.1instead of the public interface, using this command:docker run -v </a/local/data/folder>:/pgdata -e PGDATA=/pgdata \ -d --name timescaledb -p 127.0.0.1:5432:5432 \ -e POSTGRES_PASSWORD=password timescale/timescaledb:latest-pg17If you don't want to install
psqland other Postgres client tools locally, or if you are using a Microsoft Windows host system, you can connect using the version ofpsqlthat is bundled within the container with this command:docker exec -it timescaledb psql -U postgresExisting containers can be stopped using
docker stopand started again withdocker startwhile retaining their volumes and data. When you create a new container using thedocker runcommand, by default you also create a new data volume. When you remove a Docker container withdocker rm, the data volume persists on disk until you explicitly delete it. You can use thedocker volume lscommand to list existing docker volumes. If you want to store the data from your Docker container in a host directory, or you want to run the Docker image on top of an existing data directory, you can specify the directory to mount a data volume using the-vflag:docker run -d --name timescaledb -p 5432:5432 \ -v </your/data/dir>:/pgdata -e PGDATA=/pgdata \ -e POSTGRES_PASSWORD=password timescale/timescaledb:latest-pg17When you install TimescaleDB using a Docker container, the Postgres settings are inherited from the container. In most cases, you do not need to adjust them. However, if you need to change a setting, you can add
-c setting=valueto your Dockerruncommand. For more information, see the Docker documentation.The link provided in these instructions is for the latest version of TimescaleDB on Postgres 16. To find other Docker tags you can use, see the Dockerhub repository.
View logs in Docker
If you have TimescaleDB installed in a Docker container, you can view your logs using Docker, instead of looking in
/var/log. For more information, see the Docker documentation on logs.===== PAGE: https://docs.tigerdata.com/_partials/_install-self-hosted-source-based/ =====
Install the latest Postgres source
At the command prompt, clone the TimescaleDB GitHub repository:
git clone https://github.com/timescale/timescaledbChange into the cloned directory:
cd timescaledbCheckout the latest release. You can find the latest release tag on our Releases page:
git checkout 2.17.2This command produces an error that you are now in
detached headstate. It is expected behavior, and it occurs because you have checked out a tag, and not a branch. Continue with the steps in this procedure as normal.
Build the source
Bootstrap the build system:
./bootstrapbootstrap.batFor installation on Microsoft Windows, you might need to add the
pg_configandcmakefile locations to your path. In the Windows Search tool, search forsystem environment variables. The path forpg_configshould beC:\Program Files\PostgreSQL\<version>\bin. The path forcmakeis within the Visual Studio directory.Build the extension:
cd build && makecmake --build ./build --config Release
Install TimescaleDB
make installcmake --build ./build --config Release --target installConfigure Postgres
If you have more than one version of Postgres installed, TimescaleDB can only be associated with one of them. The TimescaleDB build scripts use
pg_configto find out where Postgres stores its extension files, so you can usepg_configto find out which Postgres installation TimescaleDB is using.Locate the
postgresql.confconfiguration file:psql -d postgres -c "SHOW config_file;"Open the
postgresql.conffile and updateshared_preload_librariesto:shared_preload_libraries = 'timescaledb'If you use other preloaded libraries, make sure they are comma separated.
Tune your Postgres instance for TimescaleDB
sudo timescaledb-tuneThis script is included with the
timescaledb-toolspackage when you install TimescaleDB. For more information, see configuration.Restart the Postgres instance:
service postgresql restartpg_ctl restart
Set the user password
Log in to Postgres as
postgressudo -u postgres psqlYou are in the psql shell.
Set the password for
postgres\password postgresWhen you have set the password, type
\qto exit psql.
===== PAGE: https://docs.tigerdata.com/_partials/_install-self-hosted-homebrew-based/ =====
Install Homebrew, if you don't already have it:
/bin/bash -c "$(curl -fsSL https://raw.githubusercontent.com/Homebrew/install/HEAD/install.sh)"For more information about Homebrew, including installation instructions, see the Homebrew documentation.
At the command prompt, add the TimescaleDB Homebrew tap:
brew tap timescale/tapInstall TimescaleDB and psql:
brew install timescaledb libpqUpdate your path to include psql.
brew link --force libpqOn Intel chips, the symbolic link is added to
/usr/local/bin. On Apple Silicon, the symbolic link is added to/opt/homebrew/bin.Run the
timescaledb-tunescript to configure your database:timescaledb-tune --quiet --yesChange to the directory where the setup script is located. It is typically, located at
/opt/homebrew/Cellar/timescaledb/<VERSION>/bin/, where<VERSION>is the version oftimescaledbthat you installed:cd /opt/homebrew/Cellar/timescaledb/<VERSION>/bin/Run the setup script to complete installation.
./timescaledb_move.shLog in to Postgres as
postgressudo -u postgres psqlYou are in the psql shell.
Set the password for
postgres\password postgresWhen you have set the password, type
\qto exit psql.
===== PAGE: https://docs.tigerdata.com/_partials/_install-self-hosted-macports-based/ =====
Install MacPorts by downloading and running the package installer.
For more information about MacPorts, including installation instructions, see the MacPorts documentation.
Install TimescaleDB and psql:
sudo port install timescaledb libpqxxTo view the files installed, run:
port contents timescaledb libpqxxMacPorts does not install the
timescaledb-toolspackage or run thetimescaledb-tunescript. For more information about tuning your database, see the TimescaleDB tuning tool.Log in to Postgres as
postgressudo -u postgres psqlYou are in the psql shell.
Set the password for
postgres\password postgresWhen you have set the password, type
\qto exit psql.
===== PAGE: https://docs.tigerdata.com/_partials/_install-self-hosted-windows-based/ =====
Install the latest version of Postgres and psql
Download Postgres, then run the installer.
In the
Select Componentsdialog, checkCommand Line Tools, along with any other components you want to install, and clickNext.Complete the installation wizard.
Check that you can run
pg_config. If you cannot runpg_configfrom the command line, in the Windows Search tool, entersystem environment variables. The path should beC:\Program Files\PostgreSQL\<version>\bin.
Install TimescaleDB
Unzip the TimescaleDB installer to
<install_dir>, that is, your selected directory.Best practice is to use the latest version.
In
<install_dir>\timescaledb, right-clicksetup.exe, then chooseRun as Administrator.Complete the installation wizard.
If you see an error like
could not load library "C:/Program Files/PostgreSQL/17/lib/timescaledb-2.17.2.dll": The specified module could not be found., use Dependencies to ensure that your system can find the compatible DLLs for this release of TimescaleDB.
Tune your Postgres instance for TimescaleDB
Run the
timescaledb-tunescript included in thetimescaledb-toolspackage with TimescaleDB. For moreinformation, see [configuration][config].Log in to Postgres as
postgressudo -u postgres psqlYou are in the psql shell.
Set the password for
postgres\password postgresWhen you have set the password, type
\qto exit psql.
===== LINK REFERENCES =====
===== PAGE: https://docs.tigerdata.com/_partials/_migrate_live_tune_source_database_awsrds/ =====
Updating parameters on a Postgres instance will cause an outage. Choose a time that will cause the least issues to tune this database.
Replica identity assists data replication by identifying the rows being modified. Your options are that each table and hypertable in the source database should either have:
For each table, set
REPLICA IDENTITYto the viable unique index:psql -X -d source -c 'ALTER TABLE REPLICA IDENTITY USING INDEX <_index_name>'For each table, set
REPLICA IDENTITYtoFULL:psql -X -d source -c 'ALTER TABLE {table_name} REPLICA IDENTITY FULL'For each
UPDATEorDELETEstatement, Postgres reads the whole table to find all matching rows. This results in significantly slower replication. If you are expecting a large number ofUPDATEorDELETEoperations on the table, best practice is to not useFULL.===== PAGE: https://docs.tigerdata.com/_partials/_foreign-data-wrappers/ =====
You use Postgres foreign data wrappers (FDWs) to query external data sources from a Tiger Cloud service. These external data sources can be one of the following:
If you are using VPC peering, you can create FDWs in your Customer VPC to query a service in your Tiger Cloud project. However, you can't create FDWs in your Tiger Cloud services to query a data source in your Customer VPC. This is because Tiger Cloud VPC peering uses AWS PrivateLink for increased security. See VPC peering documentation for additional details.
Postgres FDWs are particularly useful if you manage multiple Tiger Cloud services with different capabilities, and need to seamlessly access and merge regular and time-series data.
Prerequisites
To follow the steps on this page:
You need your connection details. This procedure also works for self-hosted TimescaleDB.
Query another data source
To query another data source:
You create Postgres FDWs with the
postgres_fdwextension, which is enabled by default in Tiger Cloud.See how to connect.
Run the following command using your connection details:
CREATE SERVER myserver FOREIGN DATA WRAPPER postgres_fdw OPTIONS (host '<host>', dbname 'tsdb', port '<port>');Run the following command using your connection details:
CREATE USER MAPPING FOR tsdbadmin SERVER myserver OPTIONS (user 'tsdbadmin', password '<password>');A user with the
tsdbadminrole assigned already has the requiredUSAGEpermission to create Postgres FDWs. You can enable another user, without thetsdbadminrole assigned, to query foreign data. To do so, explicitly grant the permission. For example, for a newgrafanauser:CREATE USER grafana; GRANT grafana TO tsdbadmin; CREATE SCHEMA fdw AUTHORIZATION grafana; CREATE SERVER db1 FOREIGN DATA WRAPPER postgres_fdw OPTIONS (host '<host>', dbname 'tsdb', port '<port>'); CREATE USER MAPPING FOR grafana SERVER db1 OPTIONS (user 'tsdbadmin', password '<password>'); GRANT USAGE ON FOREIGN SERVER db1 TO grafana; SET ROLE grafana; IMPORT FOREIGN SCHEMA public FROM SERVER db1 INTO fdw;You create Postgres FDWs with the
postgres_fdwextension. See documenation on how to enable it.Use
psqlto connect to your database.Run the following command using your connection details:
CREATE SERVER myserver FOREIGN DATA WRAPPER postgres_fdw OPTIONS (host '<host>', dbname '<database_name>', port '<port>');Run the following command using your connection details:
CREATE USER MAPPING FOR postgres SERVER myserver OPTIONS (user 'postgres', password '<password>');===== PAGE: https://docs.tigerdata.com/_partials/_cookbook-iot/ =====
IoT recipes
This section contains recipes for IoT issues:
Work with columnar IoT data
Narrow and medium width tables are a great way to store IoT data. A lot of reasons are outlined in Designing Your Database Schema: Wide vs. Narrow Postgres Tables.
One of the key advantages of narrow tables is that the schema does not have to change when you add new sensors. Another big advantage is that each sensor can sample at different rates and times. This helps support things like hysteresis, where new values are written infrequently unless the value changes by a certain amount.
Narrow table format example
Working with narrow table data structures presents a few challenges. In the IoT world one concern is that many data analysis approaches - including machine learning as well as more traditional data analysis - require that your data is resampled and synchronized to a common time basis. Fortunately, TimescaleDB provides you with hyperfunctions and other tools to help you work with this data.
An example of a narrow table format is:
ts sensor_id value 2024-10-31 11:17:30.000 1007 23.45 Typically you would couple this with a sensor table:
sensor_id sensor_name units 1007 temperature degreesC 1012 heat_mode on/off 1013 cooling_mode on/off 1041 occupancy number of people in room A medium table retains the generic structure but adds columns of various types so that you can use the same table to store float, int, bool, or even JSON (jsonb) data:
ts sensor_id d i b t j 2024-10-31 11:17:30.000 1007 23.45 null null null null 2024-10-31 11:17:47.000 1012 null null TRUE null null 2024-10-31 11:18:01.000 1041 null 4 null null null To remove all-null entries, use an optional constraint such as:
CONSTRAINT at_least_one_not_null CHECK ((d IS NOT NULL) OR (i IS NOT NULL) OR (b IS NOT NULL) OR (j IS NOT NULL) OR (t IS NOT NULL))Get the last value of every sensor
There are several ways to get the latest value of every sensor. The following examples use the structure defined in Narrow table format example as a reference:
SELECT DISTINCT ON
If you have a list of sensors, the easy way to get the latest value of every sensor is to use
SELECT DISTINCT ON:WITH latest_data AS ( SELECT DISTINCT ON (sensor_id) ts, sensor_id, d FROM iot_data WHERE d is not null AND ts > CURRENT_TIMESTAMP - INTERVAL '1 week' -- important ORDER BY sensor_id, ts DESC ) SELECT sensor_id, sensors.name, ts, d FROM latest_data LEFT OUTER JOIN sensors ON latest_data.sensor_id = sensors.id WHERE latest_data.d is not null ORDER BY sensor_id, ts; -- Optional, for displaying results ordered by sensor_idThe common table expression (CTE) used above is not strictly necessary. However, it is an elegant way to join to the sensor list to get a sensor name in the output. If this is not something you care about, you can leave it out:
SELECT DISTINCT ON (sensor_id) ts, sensor_id, d FROM iot_data WHERE d is not null AND ts > CURRENT_TIMESTAMP - INTERVAL '1 week' -- important ORDER BY sensor_id, ts DESCIt is important to take care when down-selecting this data. In the previous examples, the time that the query would scan back was limited. However, if there any sensors that have either not reported in a long time or in the worst case, never reported, this query devolves to a full table scan. In a database with 1000+ sensors and 41 million rows, an unconstrained query takes over an hour.
JOIN LATERAL
An alternative to SELECT DISTINCT ON is to use a
JOIN LATERAL. By selecting your entire sensor list from the sensors table rather than pulling the IDs out usingSELECT DISTINCT,JOIN LATERALcan offer some improvements in performance:SELECT sensor_list.id, latest_data.ts, latest_data.d FROM sensors sensor_list -- Add a WHERE clause here to downselect the sensor list, if you wish LEFT JOIN LATERAL ( SELECT ts, d FROM iot_data raw_data WHERE sensor_id = sensor_list.id ORDER BY ts DESC LIMIT 1 ) latest_data ON true WHERE latest_data.d is not null -- only pulling out float values ("d" column) in this example AND latest_data.ts > CURRENT_TIMESTAMP - interval '1 week' -- important ORDER BY sensor_list.id, latest_data.ts;Limiting the time range is important, especially if you have a lot of data. Best practice is to use these kinds of queries for dashboards and quick status checks. To query over a much larger time range, encapsulate the previous example into a materialized query that refreshes infrequently, perhaps once a day.
Shoutout to Christopher Piggott for this recipe.
===== PAGE: https://docs.tigerdata.com/_partials/_migrate_from_timescaledb_version/ =====
It is very important that the version of the TimescaleDB extension is the same in the source and target databases. This requires upgrading the TimescaleDB extension in the source database before migrating.
You can determine the version of TimescaleDB in the target database with the following command:
psql target -c "SELECT extversion FROM pg_extension WHERE extname = 'timescaledb';"To update the TimescaleDB extension in your source database, first ensure that the desired version is installed from your package repository. Then you can upgrade the extension with the following query:
psql source -c "ALTER EXTENSION timescaledb UPDATE TO '<version here>';"For more information and guidance, consult the Upgrade TimescaleDB page.
===== PAGE: https://docs.tigerdata.com/_partials/_since_2_18_0/ =====
Since TimescaleDB v2.18.0
===== PAGE: https://docs.tigerdata.com/_partials/_add-data-nyctaxis/ =====
Load trip data
When you have your database set up, you can load the taxi trip data into the
rideshypertable.This is a large dataset, so it might take a long time, depending on your network connection.
You can check that the data has been copied successfully with this command:
SELECT * FROM rides LIMIT 5;You should get five records that look like this:
-[ RECORD 1 ]---------+-------------------- vendor_id | 1 pickup_datetime | 2016-01-01 00:00:01 dropoff_datetime | 2016-01-01 00:11:55 passenger_count | 1 trip_distance | 1.20 pickup_longitude | -73.979423522949219 pickup_latitude | 40.744613647460938 rate_code | 1 dropoff_longitude | -73.992034912109375 dropoff_latitude | 40.753944396972656 payment_type | 2 fare_amount | 9 extra | 0.5 mta_tax | 0.5 tip_amount | 0 tolls_amount | 0 improvement_surcharge | 0.3 total_amount | 10.3===== PAGE: https://docs.tigerdata.com/_partials/_cloud-create-service/ =====
Create a Tiger Cloud service
===== PAGE: https://docs.tigerdata.com/_partials/_caggs-real-time-historical-data-refreshes/ =====
Real-time aggregates automatically add the most recent data when you query your continuous aggregate. In other words, they include data more recent than your last materialized bucket.
If you add new historical data to an already-materialized bucket, it won't be reflected in a real-time aggregate. You should wait for the next scheduled refresh, or manually refresh by calling
refresh_continuous_aggregate. You can think of real-time aggregates as being eventually consistent for historical data.===== PAGE: https://docs.tigerdata.com/_partials/_migrate_awsrds_connect_intermediary/ =====
Create an intermediary EC2 Ubuntu instance
Install the psql client tools on the intermediary instance
Keep this terminal open, you need it to connect to the RDS/Aurora Postgres instance for migration.
Set up secure connectivity between your RDS/Aurora Postgres and EC2 instances
Test the connection between your RDS/Aurora Postgres and EC2 instances
export SOURCE="postgres://<Master username>:<Master password>@<Endpoint>:<Port>/<DB name>"The value of
Master passwordwas supplied when this RDS/Aurora Postgres instance was created.===== PAGE: https://docs.tigerdata.com/_partials/_transit-gateway/ =====
Once your peering connection appears as
Processing, you can accept and configure it in AWS:You cannot attach a Tiger Cloud service to multiple Tiger Cloud VPCs at the same time.
===== PAGE: https://docs.tigerdata.com/_partials/_cloud-intro-short/ =====
A Tiger Cloud service is a single optimised Postgres instance extended with innovations in the database engine such as TimescaleDB, in a cloud infrastructure that delivers speed without sacrifice.
A Tiger Cloud service is a radically faster Postgres database for transactional, analytical, and agentic workloads at scale.
It’s not a fork. It’s not a wrapper. It is Postgres—extended with innovations in the database engine and cloud infrastructure to deliver speed (10-1000x faster at scale) without sacrifice. A Tiger Cloud service brings together the familiarity and reliability of Postgres with the performance of purpose-built engines.
Tiger Cloud is the fastest Postgres cloud. It includes everything you need to run Postgres in a production-reliable, scalable, observable environment.
===== PAGE: https://docs.tigerdata.com/_partials/_since_2_22_0/ =====
Since TimescaleDB v2.22.0
===== PAGE: https://docs.tigerdata.com/_partials/_integration-prereqs/ =====
To follow the steps on this page:
You need your connection details. This procedure also works for self-hosted TimescaleDB.
===== PAGE: https://docs.tigerdata.com/_partials/_cloud_self_configuration/ =====
Please refer to the Grand Unified Configuration (GUC) parameters for a complete list.
Policies
timescaledb.max_background_workers (int)Max background worker processes allocated to TimescaleDB. Set to at least 1 + the number of databases loaded with the TimescaleDB extension in a Postgres instance. Default value is 16.
Tiger Cloud service tuning
timescaledb.disable_load (bool)Disable the loading of the actual extension
===== PAGE: https://docs.tigerdata.com/_partials/_migrate_dual_write_step2/ =====
2. Modify the application to write to the target database
How exactly to do this is dependent on the language that your application is written in, and on how exactly your ingestion and application function. In the simplest case, you simply execute two inserts in parallel. In the general case, you must think about how to handle the failure to write to either the source or target database, and what mechanism you want to or can build to recover from such a failure.
Should your time-series data have foreign-key references into a plain table, you must ensure that your application correctly maintains the foreign key relations. If the referenced column is a
*SERIALtype, the same row inserted into the source and target may not obtain the same autogenerated id. If this happens, the data backfilled from the source to the target is internally inconsistent. In the best case it causes a foreign key violation, in the worst case, the foreign key constraint is maintained, but the data references the wrong foreign key. To avoid these issues, best practice is to follow live migration.You may also want to execute the same read queries on the source and target database to evaluate the correctness and performance of the results which the queries deliver. Bear in mind that the target database spends a certain amount of time without all data being present, so you should expect that the results are not the same for some period (potentially a number of days).
===== PAGE: https://docs.tigerdata.com/_partials/_timescaledb_supported_linux/ =====
Operation system Version Debian 13 Trixe, 12 Bookworm, 11 Bullseye Ubuntu 24.04 Noble Numbat, 22.04 LTS Jammy Jellyfish Red Hat Enterprise Linux 9, Linux 8 Fedora Fedora 35, Fedora 34, Fedora 33 Rocky Linux Rocky Linux 9 (x86_64), Rocky Linux 8 ArchLinux (community-supported) Check the available packages ===== PAGE: https://docs.tigerdata.com/_partials/_add-data-twelvedata-stocks/ =====
Load financial data
This tutorial uses real-time stock trade data, also known as tick data, from Twelve Data. A direct download link is provided below.
To ingest data into the tables that you created, you need to download the dataset and copy the data to your database.
===== PAGE: https://docs.tigerdata.com/_partials/_hypercore_policy_workflow/ =====
In Tiger Cloud Console open an SQL editor. You can also connect to your service using psql.
Create a hypertable for your time-series data using CREATE TABLE. For efficient queries on data in the columnstore, remember to
segmentbythe column you will use most often to filter your data. For example:Create a columnstore_policy that automatically converts chunks in a hypertable to the columnstore at a specific time interval. For example, convert yesterday's crypto trading data to the columnstore:
CALL add_columnstore_policy('crypto_ticks', after => INTERVAL '1d');TimescaleDB is optimized for fast updates on compressed data in the columnstore. To modify data in the columnstore, use standard SQL.
See alter_job.
See alter_job.
See remove_columnstore_policy.
If your table has chunks in the columnstore, you have to convert the chunks back to the rowstore before you disable the columnstore.
ALTER TABLE crypto_ticks SET (timescaledb.enable_columnstore = false);===== PAGE: https://docs.tigerdata.com/_partials/_migrate_dual_write_switch_production_workload/ =====
Once you've validated that all the data is present, and that the target database can handle the production workload, the final step is to switch to the target database as your primary. You may want to continue writing to the source database for a period, until you are certain that the target database is holding up to all production traffic.
===== PAGE: https://docs.tigerdata.com/_partials/_migrate_dump_roles_schema_data_multi_node/ =====
Export your role-based security hierarchy. If you only use the default
postgresrole, this step is not necessary.pg_dumpall -d "source" \ --quote-all-identifiers \ --roles-only \ --no-role-passwords \ --file=roles.sqlMST does not allow you to export passwords with roles. You assign passwords to these roles when you have uploaded them to your Tiger Cloud service.
Tiger Cloud services do not support roles with superuser access. Run the following script to remove statements, permissions and clauses that require superuser permissions from
roles.sql:sed -i -E \ -e '/CREATE ROLE "postgres";/d' \ -e '/ALTER ROLE "postgres"/d' \ -e 's/(NO)*SUPERUSER//g' \ -e 's/(NO)*REPLICATION//g' \ -e 's/(NO)*BYPASSRLS//g' \ -e 's/GRANTED BY "[^"]*"//g' \ roles.sql===== PAGE: https://docs.tigerdata.com/_partials/_cloud-create-connect-tutorials/ =====
A service in Tiger Cloud is a cloud instance which contains your database. Each service contains a single database, named
tsdb. You can connect to a service from your local system using thepsqlcommand-line utility. If you've used Postgres before, you might already havepsqlinstalled. If not, check out the installing psql section.===== PAGE: https://docs.tigerdata.com/_partials/_integration-prereqs-cloud-only/ =====
To follow the steps on this page:
You need your connection details.
===== PAGE: https://docs.tigerdata.com/_partials/_grafana-connect/ =====
Connect Grafana to Tiger Cloud
To visualize the results of your queries, enable Grafana to read the data in your service:
In your browser, log in to either:
- Self-hosted Grafana: at `http://localhost:3000/`. The default credentials are `admin`, `admin`. - Grafana Cloud: use the URL and credentials you set when you created your account.===== PAGE: https://docs.tigerdata.com/_partials/_prereqs-cloud-project-and-self/ =====
To follow the procedure on this page you need to:
This procedure also works for self-hosted TimescaleDB.
===== PAGE: https://docs.tigerdata.com/_partials/_caggs-function-support/ =====
The following table summarizes the aggregate functions supported in continuous aggregates:
| Function, clause, or feature |TimescaleDB 2.6 and earlier|TimescaleDB 2.7, 2.8, and 2.9|TimescaleDB 2.10 and later| |------------------------------------------------------------|-|-|-| | Parallelizable aggregate functions |✅|✅|✅| | Non-parallelizable SQL aggregates |❌|✅|✅| |
ORDER BY|❌|✅|✅| | Ordered-set aggregates |❌|✅|✅| | Hypothetical-set aggregates |❌|✅|✅| |DISTINCTin aggregate functions |❌|✅|✅| |FILTERin aggregate functions |❌|✅|✅| |FROMclause supportsJOINS|❌|❌|✅|DISTINCT works in aggregate functions, not in the query definition. For example, for the table:
CREATE TABLE public.candle( symbol_id uuid NOT NULL, symbol text NOT NULL, "time" timestamp with time zone NOT NULL, open double precision NOT NULL, high double precision NOT NULL, low double precision NOT NULL, close double precision NOT NULL, volume double precision NOT NULL );===== PAGE: https://docs.tigerdata.com/_partials/_psql-installation-macports/ =====
Installing psql using MacPorts
===== PAGE: https://docs.tigerdata.com/_partials/_toolkit-install-update-redhat-base/ =====
Prerequisites
To follow this procedure:
Install TimescaleDB Toolkit
These instructions use the
yumpackage manager.Update TimescaleDB Toolkit
Update Toolkit by installing the latest version and running
ALTER EXTENSION.===== PAGE: https://docs.tigerdata.com/_partials/_cookbook-hypertables/ =====
Hypertable recipes
This section contains recipes about hypertables.
Remove duplicates from an existing hypertable
Looking to remove duplicates from an existing hypertable? One method is to run a
PARTITION BYquery to getROW_NUMBER()and then thectidof rows whererow_number>1. You then delete these rows. However, you need to checktableoidandctid. This is becausectidis not unique and might be duplicated in different chunks. The following code example took 17 hours to process a table with 40 million rows:CREATE OR REPLACE FUNCTION deduplicate_chunks(ht_name TEXT, partition_columns TEXT, bot_id INT DEFAULT NULL) RETURNS TABLE ( chunk_schema name, chunk_name name, deleted_count INT ) AS $$ DECLARE chunk RECORD; where_clause TEXT := ''; deleted_count INT; BEGIN IF bot_id IS NOT NULL THEN where_clause := FORMAT('WHERE bot_id = %s', bot_id); END IF; FOR chunk IN SELECT c.chunk_schema, c.chunk_name FROM timescaledb_information.chunks c WHERE c.hypertable_name = ht_name LOOP EXECUTE FORMAT(' WITH cte AS ( SELECT ctid, ROW_NUMBER() OVER (PARTITION BY %s ORDER BY %s ASC) AS row_num, * FROM %I.%I %s ) DELETE FROM %I.%I WHERE ctid IN ( SELECT ctid FROM cte WHERE row_num > 1 ) RETURNING 1; ', partition_columns, partition_columns, chunk.chunk_schema, chunk.chunk_name, where_clause, chunk.chunk_schema, chunk.chunk_name) INTO deleted_count; RETURN QUERY SELECT chunk.chunk_schema, chunk.chunk_name, COALESCE(deleted_count, 0); END LOOP; END $$ LANGUAGE plpgsql; SELECT * FROM deduplicate_chunks('nudge_events', 'bot_id, session_id, nudge_id, time', 2540);Shoutout to Mathias Ose and Christopher Piggott for this recipe.
Get faster JOIN queries with Common Table Expressions
Imagine there is a query that joins a hypertable to another table on a shared key:
SELECT timestamp, FROM hypertable as h JOIN related_table as rt ON rt.id = h.related_table_id WHERE h.timestamp BETWEEN '2024-10-10 00:00:00' AND '2024-10-17 00:00:00'If you run
EXPLAINon this query, you see that the query planner performs aNestedJoinbetween these two tables, which means querying the hypertable multiple times. Even if the hypertable is well indexed, if it is also large, the query will be slow. How do you force a once-only lookup? Use materialized Common Table Expressions (CTEs).If you split the query into two parts using CTEs, you can
materializethe hypertable lookup and force Postgres to perform it only once.WITH cached_query AS materialized ( SELECT * FROM hypertable WHERE BETWEEN '2024-10-10 00:00:00' AND '2024-10-17 00:00:00' ) SELECT * FROM cached_query as c JOIN related_table as rt ON rt.id = h.related_table_idNow if you run
EXPLAINonce again, you see that this query performs only one lookup. Depending on the size of your hypertable, this could result in a multi-hour query taking mere seconds.Shoutout to Rowan Molony for this recipe.
===== PAGE: https://docs.tigerdata.com/_partials/_experimental-private-beta/ =====
This feature is experimental and offered as part of a private beta. Do not use this feature in production.
===== PAGE: https://docs.tigerdata.com/_partials/_hypershift-alternatively/ =====
Alternatively, if you have data in an existing database, you can migrate it directly into your new Tiger Cloud service using hypershift. For more information about hypershift, including instructions for how to migrate your data, see the Migrate and sync data to Tiger Cloud.
===== PAGE: https://docs.tigerdata.com/_partials/_timescaledb_supported_windows/ =====
Operation system Version Microsoft Windows 10, 11 Microsoft Windows Server 2019, 2020 ===== PAGE: https://docs.tigerdata.com/_partials/_migrate_post_data_dump_source_schema/ =====
pg_dump -d "source" \ --format=plain \ --quote-all-identifiers \ --no-tablespaces \ --no-owner \ --no-privileges \ --section=post-data \ --file=post-data-dump.sql \ --snapshot=$(cat /tmp/pgcopydb/snapshot)===== PAGE: https://docs.tigerdata.com/_partials/_create-hypertable/ =====
Hypertables are Postgres tables in TimescaleDB that automatically partition your time-series data by time. Time-series data represents the way a system, process, or behavior changes over time. Hypertables enable TimescaleDB to work efficiently with time-series data. Each hypertable is made up of child tables called chunks. Each chunk is assigned a range of time, and only contains data from that range. When you run a query, TimescaleDB identifies the correct chunk and runs the query on it, instead of going through the entire table.
Hypercore is the hybrid row-columnar storage engine in TimescaleDB used by hypertables. Traditional databases force a trade-off between fast inserts (row-based storage) and efficient analytics (columnar storage). Hypercore eliminates this trade-off, allowing real-time analytics without sacrificing transactional capabilities.
Hypercore dynamically stores data in the most efficient format for its lifecycle:
Unlike traditional columnar databases, hypercore allows data to be inserted or modified at any stage, making it a flexible solution for both high-ingest transactional workloads and real-time analytics—within a single database.
Because TimescaleDB is 100% Postgres, you can use all the standard Postgres tables, indexes, stored procedures, and other objects alongside your hypertables. This makes creating and working with hypertables similar to standard Postgres.
To create a hypertable:
If you are self-hosting TimescaleDB v2.19.3 and below, create a Postgres relational table, then convert it using create_hypertable. You then enable hypercore with a call to ALTER TABLE.
You see the result immediately:
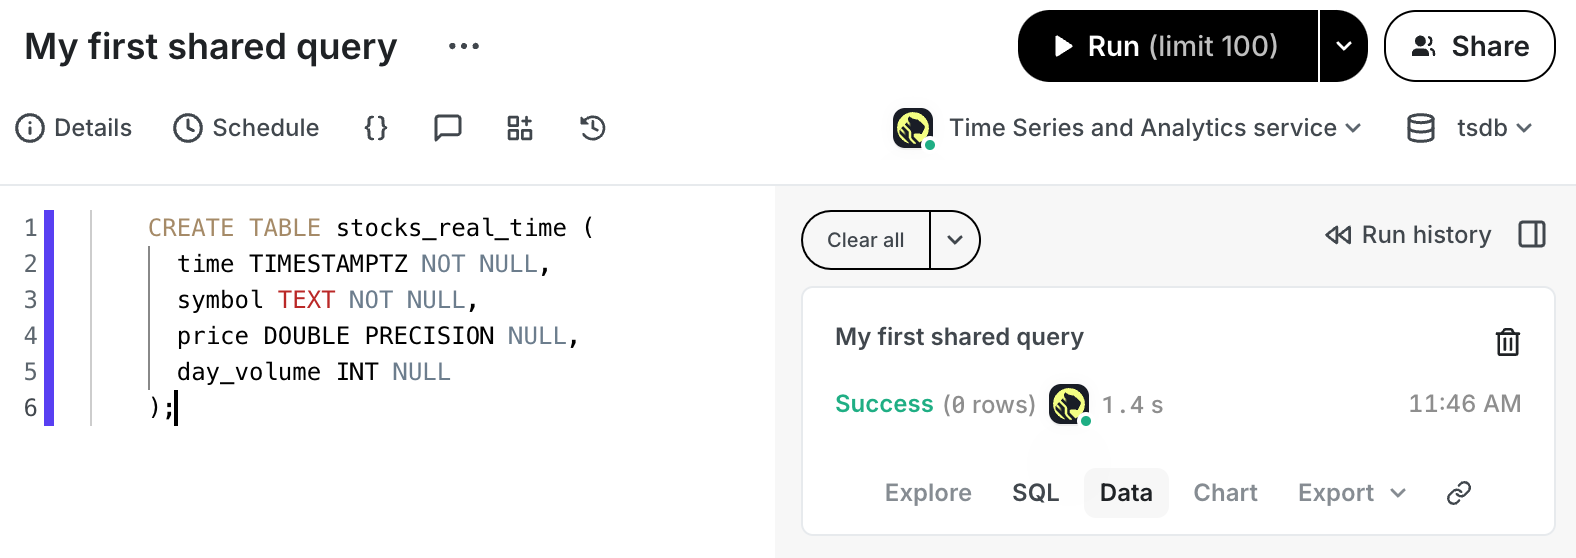
===== PAGE: https://docs.tigerdata.com/_partials/_migrate_pre_data_dump_source_schema/ =====
pg_dump -d "source" \ --format=plain \ --quote-all-identifiers \ --no-tablespaces \ --no-owner \ --no-privileges \ --section=pre-data \ --file=pre-data-dump.sql \ --snapshot=$(cat /tmp/pgcopydb/snapshot)===== PAGE: https://docs.tigerdata.com/_partials/_hypertable-detailed-size-api/ =====
hypertable_detailed_size()
Get detailed information about disk space used by a hypertable or continuous aggregate, returning size information for the table itself, any indexes on the table, any toast tables, and the total size of all. All sizes are reported in bytes. If the function is executed on a distributed hypertable, it returns size information as a separate row per node, including the access node.
When a continuous aggregate name is provided, the function transparently looks up the backing hypertable and returns its statistics instead.
For more information about using hypertables, including chunk size partitioning, see the hypertable section.
Samples
Get the size information for a hypertable.
-- disttable is a distributed hypertable -- SELECT * FROM hypertable_detailed_size('disttable') ORDER BY node_name; table_bytes | index_bytes | toast_bytes | total_bytes | node_name -------------+-------------+-------------+-------------+------------- 16384 | 40960 | 0 | 57344 | data_node_1 8192 | 24576 | 0 | 32768 | data_node_2 0 | 8192 | 0 | 8192 |The access node is listed without a user-given node name. Normally, the access node holds no data, but still maintains, for example, index information that occupies a small amount of disk space.
Required arguments
Name Type Description hypertableREGCLASS Hypertable or continuous aggregate to show detailed size of. Returns
|Column|Type|Description| |-|-|-| |table_bytes|BIGINT|Disk space used by main_table (like
pg_relation_size(main_table))| |index_bytes|BIGINT|Disk space used by indexes| |toast_bytes|BIGINT|Disk space of toast tables| |total_bytes|BIGINT|Total disk space used by the specified table, including all indexes and TOAST data| |node_name|TEXT|For distributed hypertables, this is the user-given name of the node for which the size is reported.NULLis returned for the access node and non-distributed hypertables.|If executed on a relation that is not a hypertable, the function returns
NULL.===== PAGE: https://docs.tigerdata.com/_partials/_billing-for-inactive-services/ =====
You are charged for all active services in your account, even if you are not actively using them. To reduce costs, pause or delete your unused services.
===== PAGE: https://docs.tigerdata.com/_partials/_devops-cli-install/ =====
Use the terminal to install the CLI:
```shell curl -s https://packagecloud.io/install/repositories/timescale/tiger-cli/script.deb.sh | sudo os=any dist=any bash sudo apt-get install tiger-cli ``` ```shell curl -s https://packagecloud.io/install/repositories/timescale/tiger-cli/script.deb.sh | sudo os=any dist=any bash sudo apt-get install tiger-cli ``` ```shell curl -s https://packagecloud.io/install/repositories/timescale/tiger-cli/script.rpm.sh | sudo os=rpm_any dist=rpm_any bash sudo yum install tiger-cli ``` ```shell curl -s https://packagecloud.io/install/repositories/timescale/tiger-cli/script.rpm.sh | sudo os=rpm_any dist=rpm_any bash sudo yum install tiger-cli ``` ```shell brew install --cask timescale/tap/tiger-cli ``` ```shell curl -fsSL https://cli.tigerdata.com | sh ```This call returns something like:
- No services: ```terminaloutput 🏜️ No services found! Your project is looking a bit empty. 🚀 Ready to get started? Create your first service with: tiger service create ``` - One or more services: ```terminaloutput ┌────────────┬─────────────────────┬────────┬─────────────┬──────────────┬──────────────────┐ │ SERVICE ID │ NAME │ STATUS │ TYPE │ REGION │ CREATED │ ├────────────┼─────────────────────┼────────┼─────────────┼──────────────┼──────────────────┤ │ tgrservice │ tiger-agent-service │ READY │ TIMESCALEDB │ eu-central-1 │ 2025-09-25 16:09 │ └────────────┴─────────────────────┴────────┴─────────────┴──────────────┴──────────────────┘ ```===== PAGE: https://docs.tigerdata.com/_partials/_graphing-ohlcv-data/ =====
Graph OHLCV data
When you have extracted the raw OHLCV data, you can use it to graph the result in a candlestick chart, using Grafana. To do this, you need to have Grafana set up to connect to your self-hosted TimescaleDB instance.
Graphing OHLCV data
===== PAGE: https://docs.tigerdata.com/_partials/_create-hypertable-nyctaxis/ =====
Optimize time-series data in hypertables
Time-series data represents how a system, process, or behavior changes over time. Hypertables are Postgres tables that help you improve insert and query performance by automatically partitioning your data by time. Each hypertable is made up of child tables called chunks. Each chunk is assigned a range of time, and only contains data from that range.
Hypertables exist alongside regular Postgres tables. You interact with hypertables and regular Postgres tables in the same way. You use regular Postgres tables for relational data.
Create standard Postgres tables for relational data
When you have other relational data that enhances your time-series data, you can create standard Postgres tables just as you would normally. For this dataset, there are two other tables of data, called
payment_typesandrates.You can confirm that the scripts were successful by running the
\dtcommand in thepsqlcommand line. You should see this:List of relations Schema | Name | Type | Owner --------+---------------+-------+---------- public | payment_types | table | tsdbadmin public | rates | table | tsdbadmin public | rides | table | tsdbadmin (3 rows)===== PAGE: https://docs.tigerdata.com/_partials/_integration-debezium-docker/ =====
In another Terminal window, run the following command:
docker run -it --rm --name zookeeper -p 2181:2181 -p 2888:2888 -p 3888:3888 quay.io/debezium/zookeeper:3.0Check the output log to see that zookeeper is running.
In another Terminal window, run the following command:
docker run -it --rm --name kafka -p 9092:9092 --link zookeeper:zookeeper quay.io/debezium/kafka:3.0Check the output log to see that Kafka is running.
In another Terminal window, run the following command:
docker run -it --rm --name connect \ -p 8083:8083 \ -e GROUP_ID=1 \ -e CONFIG_STORAGE_TOPIC=accounts \ -e OFFSET_STORAGE_TOPIC=offsets \ -e STATUS_STORAGE_TOPIC=storage \ --link kafka:kafka \ --link timescaledb:timescaledb \ quay.io/debezium/connect:3.0Check the output log to see that Kafka Connect is running.
Update the
<properties>for the<debezium-user>you created in your self-hosted TimescaleDB instance in the following command. Then run the command in another Terminal window:curl -X POST http://localhost:8083/connectors \ -H "Content-Type: application/json" \ -d '{ "name": "timescaledb-connector", "config": { "connector.class": "io.debezium.connector.postgresql.PostgresConnector", "database.hostname": "timescaledb", "database.port": "5432", "database.user": "<debezium-user>", "database.password": "<debezium-password>", "database.dbname" : "postgres", "topic.prefix": "accounts", "plugin.name": "pgoutput", "schema.include.list": "public,_timescaledb_internal", "transforms": "timescaledb", "transforms.timescaledb.type": "io.debezium.connector.postgresql.transforms.timescaledb.TimescaleDb", "transforms.timescaledb.database.hostname": "timescaledb", "transforms.timescaledb.database.port": "5432", "transforms.timescaledb.database.user": "<debezium-user>", "transforms.timescaledb.database.password": "<debezium-password>", "transforms.timescaledb.database.dbname": "postgres" } }'===== PAGE: https://docs.tigerdata.com/_partials/_integration-debezium-cloud-config-service/ =====
For Tiger Cloud, open an SQL editor in Tiger Cloud Console. For self-hosted, use
psql.Create a table to test the integration. For example:
```sql CREATE TABLE sensor_data ( id SERIAL PRIMARY KEY, device_id TEXT NOT NULL, temperature FLOAT NOT NULL, recorded_at TIMESTAMPTZ DEFAULT now() ); ```===== PAGE: https://docs.tigerdata.com/_partials/_hypercore-direct-compress/ =====
When you set
timescaledb.enable_direct_compress_copyyour data gets compressed in memory during ingestion withCOPYstatements. By writing the compressed batches immediately in the columnstore, the IO footprint is significantly lower. Also, the columnstore policy you set is less important,INSERTalready produces compressed chunks.Please note that this feature is a tech preview and not production-ready. Using this feature could lead to regressed query performance and/or storage ratio, if the ingested batches are not correctly ordered or are of too high cardinality.
To enable in-memory data compression during ingestion:
SET timescaledb.enable_direct_compress_copy=on;Important facts
===== PAGE: https://docs.tigerdata.com/_partials/_hypertable-size-api/ =====
hypertable_size()
Get the total disk space used by a hypertable or continuous aggregate, that is, the sum of the size for the table itself including chunks, any indexes on the table, and any toast tables. The size is reported in bytes. This is equivalent to computing the sum of
total_bytescolumn from the output ofhypertable_detailed_sizefunction.When a continuous aggregate name is provided, the function transparently looks up the backing hypertable and returns its statistics instead.
For more information about using hypertables, including chunk size partitioning, see the hypertable section.
Samples
Get the size information for a hypertable.
SELECT hypertable_size('devices'); hypertable_size ----------------- 73728Get the size information for all hypertables.
SELECT hypertable_name, hypertable_size(format('%I.%I', hypertable_schema, hypertable_name)::regclass) FROM timescaledb_information.hypertables;Get the size information for a continuous aggregate.
SELECT hypertable_size('device_stats_15m'); hypertable_size ----------------- 73728Required arguments
|Name|Type|Description| |-|-|-| |
hypertable|REGCLASS|Hypertable or continuous aggregate to show size of.|Returns
|Name|Type|Description| |-|-|-| |hypertable_size|BIGINT|Total disk space used by the specified hypertable, including all indexes and TOAST data|
NULLis returned if the function is executed on a non-hypertable relation.===== PAGE: https://docs.tigerdata.com/_partials/_migrate_explain_pg_dump_flags/ =====
===== PAGE: https://docs.tigerdata.com/_partials/_livesync-configure-source-database-awsrds/ =====
Updating parameters on a Postgres instance will cause an outage. Choose a time that will cause the least issues to tune this database.
Replica identity assists data replication by identifying the rows being modified. Your options are that each table and hypertable in the source database should either have:
For each table, set
REPLICA IDENTITYto the viable unique index:psql -X -d source -c 'ALTER TABLE REPLICA IDENTITY USING INDEX <_index_name>'For each table, set
REPLICA IDENTITYtoFULL:psql -X -d source -c 'ALTER TABLE {table_name} REPLICA IDENTITY FULL'For each
UPDATEorDELETEstatement, Postgres reads the whole table to find all matching rows. This results in significantly slower replication. If you are expecting a large number ofUPDATEorDELETEoperations on the table, best practice is to not useFULL.===== PAGE: https://docs.tigerdata.com/_partials/_migrate_dual_write_step1/ =====
1. Set up a target database instance in Tiger Cloud
If you intend on migrating more than 400 GB, open a support request to ensure that enough disk is pre-provisioned on your Tiger Cloud service.
You can open a support request directly from Tiger Cloud Console, or by email to support@tigerdata.com.
===== PAGE: https://docs.tigerdata.com/_partials/_quickstart-intro/ =====
Easily integrate your app with Tiger Cloud. Use your favorite programming language to connect to your Tiger Cloud service, create and manage hypertables, then ingest and query data.
===== PAGE: https://docs.tigerdata.com/_partials/_start-coding-node/ =====
Prerequisites
To follow the steps on this page:
You need your connection details. This procedure also works for self-hosted TimescaleDB.
Connect to TimescaleDB
In this section, you create a connection to TimescaleDB with a common Node.js ORM (object relational mapper) called Sequelize.
In your web browser, navigate to
http://localhost:3000. If the connection is successful, it shows "Hello World!"Create a relational table
In this section, you create a relational table called
page_loads.Create a hypertable
When you have created the relational table, you can create a hypertable. Creating tables and indexes, altering tables, inserting data, selecting data, and most other tasks are executed on the hypertable.
Insert rows of data
This section covers how to insert data into your hypertables.
Execute a query
This section covers how to execute queries against your database. In this example, every time the page is reloaded, all information currently in the table is displayed.
Now, when you reload the page, you should see all of the rows currently in the
page_loadstable.===== PAGE: https://docs.tigerdata.com/_partials/_release_notification/ =====
To be notified about the latest releases, in Github click
Watch>Custom, then enableReleases.===== PAGE: https://docs.tigerdata.com/_partials/_migrate_set_up_align_db_extensions_postgres_based/ =====
===== PAGE: https://docs.tigerdata.com/_partials/_selfhosted_cta/ =====
Deploy a Tiger Cloud service. We tune your database for performance and handle scalability, high availability, backups and management so you can relax.
===== PAGE: https://docs.tigerdata.com/_partials/_preloaded-data/ =====
If you have been provided with a pre-loaded dataset on your Tiger Cloud service, go directly to the queries section.
===== PAGE: https://docs.tigerdata.com/_partials/_cloudtrial/ =====
Your Tiger Cloud trial is completely free for you to use for the first thirty days. This gives you enough time to complete all the tutorials and run a few test projects of your own.
===== PAGE: https://docs.tigerdata.com/_partials/_data_model_metadata/ =====
You might also notice that the metadata fields are missing. Because this is a relational database, metadata can be stored in a secondary table and
JOINed at query time. Learn more about TimescaleDB's support forJOINs.===== PAGE: https://docs.tigerdata.com/_partials/_usage-based-storage-intro/ =====
Tiger Cloud charges are based on the amount of storage you use. You don't pay for fixed storage size, and you don't need to worry about scaling disk size as your data grows—we handle it all for you. To reduce your data costs further, combine hypercore, a data retention policy, and tiered storage.
===== PAGE: https://docs.tigerdata.com/_partials/_migrate_using_parallel_copy/ =====
Restoring data into a Tiger Cloud service with timescaledb-parallel-copy
===== PAGE: https://docs.tigerdata.com/_partials/_migrate_dual_write_step5/ =====
5. Determine the completion point
TAfter dual-writes have been executing for a while, the target hypertable contains data in three time ranges: missing writes, late-arriving data, and the "consistency" range
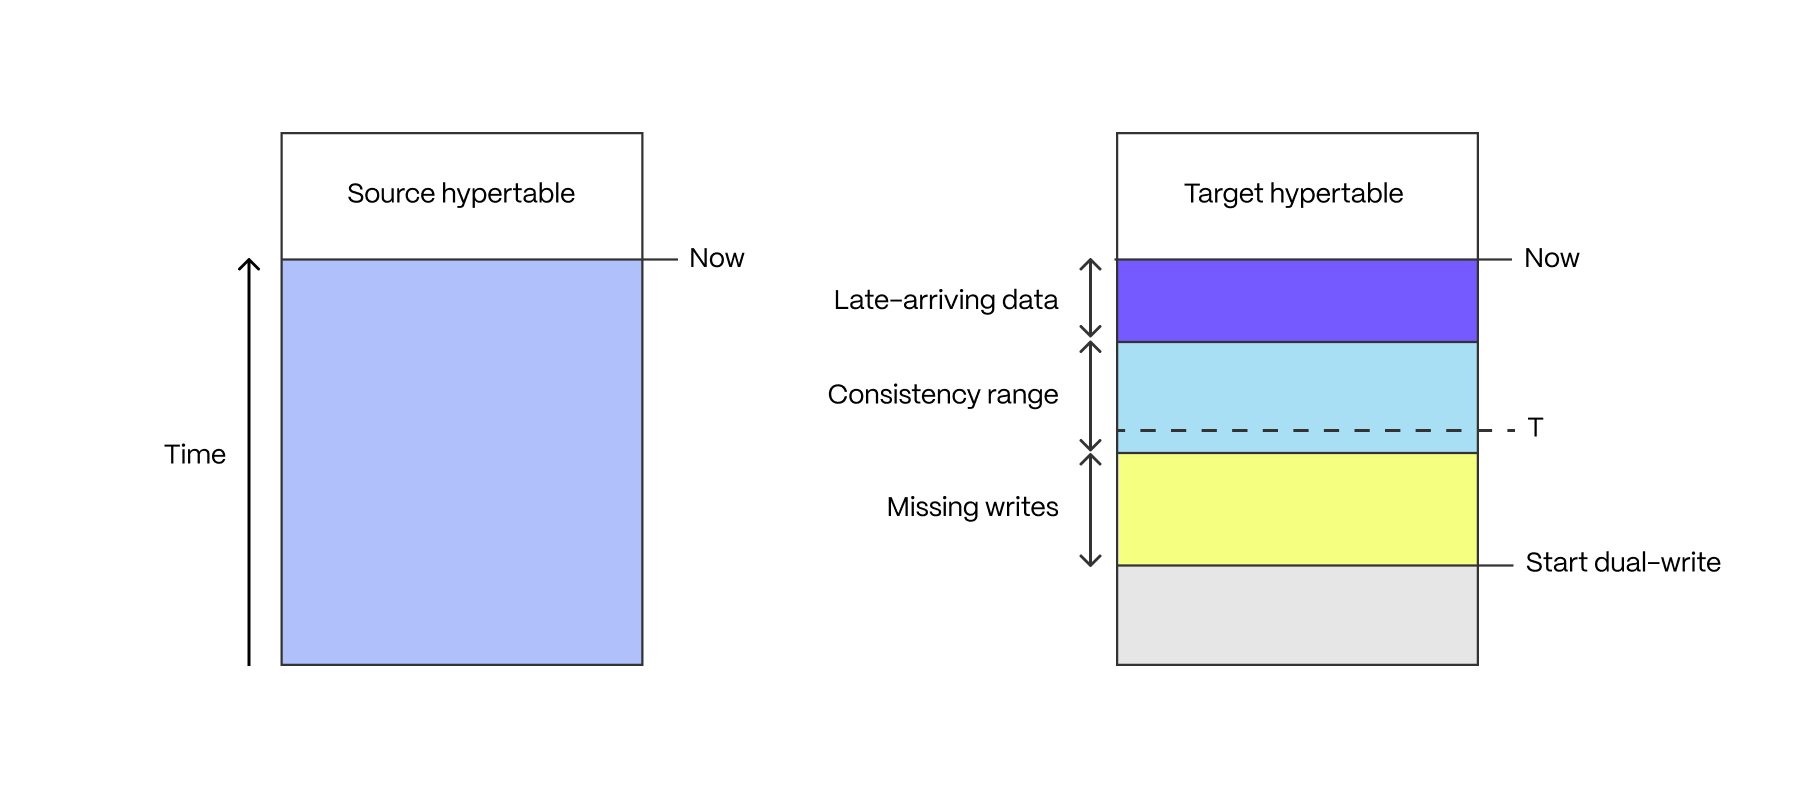
Missing writes
If the application is made up of multiple writers, and these writers did not all simultaneously start writing into the target hypertable, there is a period of time in which not all writes have made it into the target hypertable. This period starts when the first writer begins dual-writing, and ends when the last writer begins dual-writing.
Late-arriving data
Some applications have late-arriving data: measurements which have a timestamp in the past, but which weren't written yet (for example from devices which had intermittent connectivity issues). The window of late-arriving data is between the present moment, and the maximum lateness.
Consistency range
The consistency range is the range in which there are no missing writes, and in which all data has arrived, that is between the end of the missing writes range and the beginning of the late-arriving data range.
The length of these ranges is defined by the properties of the application, there is no one-size-fits-all way to determine what they are.
Completion point
The completion point
Tis an arbitrarily chosen time in the consistency range. It is the point in time to which data can safely be backfilled, ensuring that there is no data loss.The completion point should be expressed as the type of the
timecolumn of the hypertables to be backfilled. For instance, if you're using aTIMESTAMPTZtimecolumn, then the completion point may be2023-08-10T12:00:00.00Z. If you're using aBIGINTcolumn it may be1695036737000.If you are using a mix of types for the
timecolumns of your hypertables, you must determine the completion point for each type individually, and backfill each set of hypertables with the same type independently from those of other types.===== PAGE: https://docs.tigerdata.com/_partials/_install-self-hosted-archlinux-based/ =====
ArchLinux packages are built by the community.
===== PAGE: https://docs.tigerdata.com/_partials/_since_2_20_0/ =====
Since TimescaleDB v2.20.0
===== PAGE: https://docs.tigerdata.com/_partials/_consider-cloud/ =====
Tiger Cloud is a fully managed service with automatic backup and restore, high availability with replication, seamless scaling and resizing, and much more. You can try Tiger Cloud free for thirty days.
===== PAGE: https://docs.tigerdata.com/_partials/_migrate_dump_roles_schema_data_postgres/ =====
Export your role-based security hierarchy.
<db_name>has the same value as<db_name>insource. I know, it confuses me as well.pg_dumpall -d "source" \ -l <db_name> --quote-all-identifiers \ --roles-only \ --file=roles.sqlIf you only use the default
postgresrole, this step is not necessary.Tiger Cloud service do not support roles with superuser access. Run the following script to remove statements, permissions and clauses that require superuser permissions from
roles.sql:sed -i -E \ -e '/CREATE ROLE "postgres";/d' \ -e '/ALTER ROLE "postgres"/d' \ -e '/CREATE ROLE "tsdbadmin";/d' \ -e '/ALTER ROLE "tsdbadmin"/d' \ -e 's/(NO)*SUPERUSER//g' \ -e 's/(NO)*REPLICATION//g' \ -e 's/(NO)*BYPASSRLS//g' \ -e 's/GRANTED BY "[^"]*"//g' \ roles.sqlThe
pg_dumpflags remove superuser access and tablespaces from your data. When you runpgdump, check the run time, a long-runningpg_dumpcan cause issues.pg_dump -d "source" \ --format=plain \ --quote-all-identifiers \ --no-tablespaces \ --no-owner \ --no-privileges \ --file=dump.sqlTo dramatically reduce the time taken to dump the source database, using multiple connections. For more information, see dumping with concurrency and restoring with concurrency.
===== PAGE: https://docs.tigerdata.com/_partials/_timeseries-intro/ =====
Time-series data represents how a system, process, or behavior changes over time. For example, if you are taking measurements from a temperature gauge every five minutes, you are collecting time-series data. Another common example is stock price changes, or even the battery life of your smart phone. As these measurements change over time, each data point is recorded alongside its timestamp, allowing it to be measured, analyzed, and visualized.
Time-series data can be collected very frequently, such as financial data, or infrequently, such as weather or system measurements. It can also be collected regularly, such as every millisecond or every hour, or irregularly, such as only when a change occurs.
Databases have always had time fields, but using a special database for handling time-series data can make your database work much more effectively. Specialized time-series databases, like Timescale, are designed to handle large amounts of database writes, so they work much faster. They are also optimized to handle schema changes, and use more flexible indexing, so you don't need to spend time migrating your data whenever you make a change.
Time-series data is everywhere, but there are some environments where it is especially important to use a specialized time-series database, like Timescale:
===== PAGE: https://docs.tigerdata.com/_partials/_timescaledb_supported_macos/ =====
Operation system Version macOS From 10.15 Catalina to 14 Sonoma ===== PAGE: https://docs.tigerdata.com/_partials/_migrate_live_setup_environment/ =====
Set your connection strings
These variables hold the connection information for the source database and target Tiger Cloud service. In Terminal on your migration machine, set the following:
export SOURCE="postgres://<user>:<password>@<source host>:<source port>/<db_name>" export TARGET="postgres://tsdbadmin:<PASSWORD>@<HOST>:<PORT>/tsdb?sslmode=require"You find the connection information for your Tiger Cloud service in the configuration file you downloaded when you created the service.
Avoid using connection strings that route through connection poolers like PgBouncer or similar tools. This tool requires a direct connection to the database to function properly.
Align the version of TimescaleDB on the source and target
Tune your source database
You need admin rights to to update the configuration on your source database. If you are using a managed service, follow the instructions in the
From MSTtab on this page.Install wal2json on your source database.
This is not applicable if the source database is Postgres 17 or later.
Your configuration changes are now active. However, verify that the settings are live in your database.
Replica identity assists data replication by identifying the rows being modified. Your options are that each table and hypertable in the source database should either have:
For each table, set
REPLICA IDENTITYto the viable unique index:psql -X -d source -c 'ALTER TABLE REPLICA IDENTITY USING INDEX <_index_name>'For each table, set
REPLICA IDENTITYtoFULL:psql -X -d source -c 'ALTER TABLE {table_name} REPLICA IDENTITY FULL'For each
UPDATEorDELETEstatement, Postgres reads the whole table to find all matching rows. This results in significantly slower replication. If you are expecting a large number ofUPDATEorDELETEoperations on the table, best practice is to not useFULL.===== PAGE: https://docs.tigerdata.com/_partials/_integration-prereqs-self-only/ =====
To follow the steps on this page:
===== PAGE: https://docs.tigerdata.com/_partials/_migrate_live_run_cleanup_postgres/ =====
The contents of both databases should be the same. To check this you could compare the number of rows, or an aggregate of columns. However, the best validation method depends on your app.
Once you are confident that your data is successfully replicated, configure your apps to use your Tiger Cloud service.
This command removes all resources and temporary files used in the migration process. When you run this command, you can no longer resume live-migration.
docker run --rm -it --name live-migration-clean \ -e PGCOPYDB_SOURCE_PGURI=source \ -e PGCOPYDB_TARGET_PGURI=target \ --pid=host \ -v ~/live-migration:/opt/timescale/ts_cdc \ timescale/live-migration:latest1 clean --prune===== PAGE: https://docs.tigerdata.com/_partials/_create-hypertable-twelvedata-crypto/ =====
Optimize time-series data in a hypertable
Hypertables are Postgres tables in TimescaleDB that automatically partition your time-series data by time. Time-series data represents the way a system, process, or behavior changes over time. Hypertables enable TimescaleDB to work efficiently with time-series data. Each hypertable is made up of child tables called chunks. Each chunk is assigned a range of time, and only contains data from that range. When you run a query, TimescaleDB identifies the correct chunk and runs the query on it, instead of going through the entire table.
Hypercore is the hybrid row-columnar storage engine in TimescaleDB used by hypertables. Traditional databases force a trade-off between fast inserts (row-based storage) and efficient analytics (columnar storage). Hypercore eliminates this trade-off, allowing real-time analytics without sacrificing transactional capabilities.
Hypercore dynamically stores data in the most efficient format for its lifecycle:
Unlike traditional columnar databases, hypercore allows data to be inserted or modified at any stage, making it a flexible solution for both high-ingest transactional workloads and real-time analytics—within a single database.
Because TimescaleDB is 100% Postgres, you can use all the standard Postgres tables, indexes, stored procedures, and other objects alongside your hypertables. This makes creating and working with hypertables similar to standard Postgres.
In Tiger Cloud Console open an SQL editor. You can also connect to your service using psql.
Create a hypertable for your time-series data using CREATE TABLE. For efficient queries on data in the columnstore, remember to
segmentbythe column you will use most often to filter your data:```sql CREATE TABLE crypto_ticks ( "time" TIMESTAMPTZ, symbol TEXT, price DOUBLE PRECISION, day_volume NUMERIC ) WITH ( tsdb.hypertable, tsdb.partition_column='time', tsdb.segmentby='symbol', tsdb.orderby='time DESC' ); ```If you are self-hosting TimescaleDB v2.19.3 and below, create a Postgres relational table, then convert it using create_hypertable. You then enable hypercore with a call to ALTER TABLE.
Create a standard Postgres table for relational data
When you have relational data that enhances your time-series data, store that data in standard Postgres relational tables.
You now have two tables within your Tiger Cloud service. A hypertable named
crypto_ticks, and a normal Postgres table namedcrypto_assets.===== PAGE: https://docs.tigerdata.com/_partials/_cloud-installation/ =====
Create a Tiger Data account
You create a Tiger Data account to manage your services and data in a centralized and efficient manner in Tiger Cloud Console. From there, you can create and delete services, run queries, manage access and billing, integrate other services, contact support, and more.
You create a standalone account to manage Tiger Cloud as a separate unit in your infrastructure, which includes separate billing and invoicing.
To set up Tiger Cloud:
Open Sign up for Tiger Cloud and add your details, then click
Start your free trial. You receive a confirmation email in your inbox.You are now logged into Tiger Cloud Console. You can change the pricing plan to better accommodate your growing needs on the
Billingpage.To have Tiger Cloud as a part of your AWS infrastructure, you create a Tiger Data account through AWS Marketplace. In this case, Tiger Cloud is a line item in your AWS invoice.
To set up Tiger Cloud via AWS:
You see two pricing options, pay-as-you-go and annual commit.
You are redirected to Tiger Cloud Console.
Add your details, then click
Start your free trial. If you want to link an existing Tiger Data account to AWS, log in with your existing credentials.You are now logged into Tiger Cloud Console. You can change the pricing plan later to better accommodate your growing needs on the
Billingpage.===== PAGE: https://docs.tigerdata.com/_partials/_cloud-connect-service/ =====
In Tiger Cloud Console, check that your service is marked as
Running.Connect using data mode or SQL editor in Tiger Cloud Console, or psql in the command line:
This feature is not available under the Free pricing plan.
And that is it, you are up and running. Enjoy developing with Tiger Data.
And that is it, you are up and running. Enjoy developing with Tiger Data.
And that is it, you are up and running. Enjoy developing with Tiger Data.
Quick recap. You:
===== PAGE: https://docs.tigerdata.com/_partials/_migrate_dual_write_step4/ =====
4. Start application in dual-write mode
With the target database set up, your application can now be started in dual-write mode.
===== PAGE: https://docs.tigerdata.com/_partials/_migrate_post_schema_caggs_etal/ =====
Migrate schema post-data
When you have migrated your table and hypertable data, migrate your Postgres schema post-data. This includes information about constraints.
Migrating schema post-data
Troubleshooting
If you see these errors during the migration process, you can safely ignore them. The migration still occurs successfully.
pg_restore: error: could not execute query: ERROR: relation "<relation_name>" already existspg_restore: error: could not execute query: ERROR: trigger "ts_insert_blocker" for relation "<relation_name>" already existsRecreate continuous aggregates
Continuous aggregates aren't migrated by default when you transfer your schema and data separately. You can restore them by recreating the continuous aggregate definitions and recomputing the results on your Tiger Cloud service. The recomputed continuous aggregates only aggregate existing data in your Tiger Cloud service. They don't include deleted raw data.
Recreating continuous aggregates
Recreate policies
By default, policies aren't migrated when you transfer your schema and data separately. Recreate them on your Tiger Cloud service.
Recreating policies
Update table statistics
Update your table statistics by running
ANALYZEon your entire dataset. Note that this might take some time depending on the size of your database:ANALYZE;Troubleshooting
If you see errors of the following form when you run
ANALYZE, you can safely ignore them:WARNING: skipping "" --- only superuser can analyze itThe skipped tables and indexes correspond to system catalogs that can't be accessed. Skipping them does not affect statistics on your data.
===== PAGE: https://docs.tigerdata.com/_partials/_tutorials-hypercore-intro/ =====
Over time you end up with a lot of data. Since this data is mostly immutable, you can compress it to save space and avoid incurring additional cost.
TimescaleDB is built for handling event-oriented data such as time-series and fast analytical queries, it comes with support of hypercore featuring the columnstore.
Hypercore enables you to store the data in a vastly more efficient format allowing up to 90x compression ratio compared to a normal Postgres table. However, this is highly dependent on the data and configuration.
Hypercore is implemented natively in Postgres and does not require special storage formats. When you convert your data from the rowstore to the columnstore, TimescaleDB uses Postgres features to transform the data into columnar format. The use of a columnar format allows a better compression ratio since similar data is stored adjacently. For more details on the columnar format, see hypercore.
A beneficial side effect of compressing data is that certain queries are significantly faster, since less data has to be read into memory.
===== PAGE: https://docs.tigerdata.com/_partials/_migrate_awsrds_migrate_data_downtime/ =====
Prepare to migrate
The duration of the migration is proportional to the amount of data stored in your database. By disconnection your app from your database you avoid and possible data loss. You should also ensure that your source RDS instance is not receiving any DML queries.
For example:
ssh -i "<key-pair>.pem" ubuntu@<EC2 instance's Public IPv4>These variables hold the connection information for the RDS instance and target Tiger Cloud service:
export SOURCE="postgres://<Master username>:<Master password>@<Endpoint>:<Port>/<DB name>" export TARGET=postgres://tsdbadmin:<PASSWORD>@<HOST>:<PORT>/tsdb?sslmode=requireYou find the connection information for
SOURCEin your RDS configuration. ForTARGETin the configuration file you downloaded when you created the Tiger Cloud service.Align the extensions on the source and target
Migrate roles from RDS to your Tiger Cloud service
Roles manage database access permissions. To migrate your role-based security hierarchy to your Tiger Cloud service:
Export your role-based security hierarchy. If you only use the default
postgresrole, this step is not necessary.pg_dumpall -d "source" \ --quote-all-identifiers \ --roles-only \ --no-role-passwords \ --file=roles.sqlAWS RDS does not allow you to export passwords with roles. You assign passwords to these roles when you have uploaded them to your Tiger Cloud service.
Tiger Cloud services do not support roles with superuser access. Run the following script to remove statements, permissions and clauses that require superuser permissions from
roles.sql:sed -i -E \ -e '/CREATE ROLE "postgres";/d' \ -e '/ALTER ROLE "postgres"/d' \ -e '/CREATE ROLE "rds/d' \ -e '/ALTER ROLE "rds/d' \ -e '/TO "rds/d' \ -e '/GRANT "rds/d' \ -e 's/(NO)*SUPERUSER//g' \ -e 's/(NO)*REPLICATION//g' \ -e 's/(NO)*BYPASSRLS//g' \ -e 's/GRANTED BY "[^"]*"//g' \ roles.sqlAWS RDS did not allow you to export passwords with roles. For each role, use the following command to manually assign a password to a role:
psql target -c "ALTER ROLE <role name> WITH PASSWORD '<highly secure password>';" ``` ## Migrate data from your RDS instance to your Tiger Cloud service 1. **Dump the data from your RDS instance to your intermediary EC2 instance** The `pg_dump` flags remove superuser access and tablespaces from your data. When you run `pgdump`, check the run time, [a long-running `pg_dump` can cause issues][long-running-pgdump].bash pg_dump -d "source" \ --format=plain \ --quote-all-identifiers \ --no-tablespaces \ --no-owner \ --no-privileges \ --file=dump.sql
To dramatically reduce the time taken to dump the RDS instance, using multiple connections. For more information, see [dumping with concurrency][dumping-with-concurrency] and [restoring with concurrency][restoring-with-concurrency]. 1. **Upload your data to your Tiger Cloud service**bash psql -d target -v ON_ERROR_STOP=1 --echo-errors
-f dump.sql===== PAGE: https://docs.tigerdata.com/_partials/_migrate_live_validate_data/ ===== ## Validate your data, then restart your app 1. **Validate the migrated data** The contents of both databases should be the same. To check this you could compare the number of rows, or an aggregate of columns. However, the best validation method depends on your app. 1. **Stop app downtime** Once you are confident that your data is successfully replicated, configure your apps to use your Tiger Cloud service. 1. **Cleanup resources associated with live-migration from your migration machine** This command removes all resources and temporary files used in the migration process. When you run this command, you can no longer resume live-migration.shell docker run --rm -it --name live-migration-clean
-e PGCOPYDB_SOURCE_PGURI=source \ -e PGCOPYDB_TARGET_PGURI=target \ --pid=host \ -v ~/live-migration:/opt/timescale/ts_cdc \ timescale/live-migration:latest clean --prune===== PAGE: https://docs.tigerdata.com/_partials/_cloud-integrations-exporter-region/ ===== Your exporter must be in the same AWS region as the Tiger Cloud service it is attached to. If you have Tiger Cloud services running in multiple regions, create an exporter for each region. ===== PAGE: https://docs.tigerdata.com/_partials/_devops-cli-reference/ ===== ## Commands You can use the following commands with Tiger CLI. For more information on each command, use the `-h` flag. For example: `tiger auth login -h` | Command | Subcommand | Description | |---------|----------------------------------------------|----------------------------------------------------------------------------------------------------------------------------------------------------------------------------------------------------------------------------------------------------------------------------------------------------------------------------------------------------------------------------------------------------------------------------------------------------------------------------------------------------------------------------------------------------------------------------------------------------------------------------------------------------------------------------------------------------------------------------------------------------------------------------------------------------------------------------------------------------------------------------------------------------------------------------------------------------------------------------------------------------| | auth | | Manage authentication and credentials for your Tiger Data account | | | login | Create an authenticated connection to your Tiger Data account | | | logout | Remove the credentials used to create authenticated connections to Tiger Cloud | | | status | Show your current authentication status and project ID | | version | | Show information about the currently installed version of Tiger CLI | | config | | Manage your Tiger CLI configuration | | | show | Show the current configuration | | | set `<key>` `<value>` | Set a specific value in your configuration. For example, `tiger config set debug true` | | | unset `<key>` | Clear the value of a configuration parameter. For example, `tiger config unset debug` | | | reset | Reset the configuration to the defaults. This also logs you out from the current Tiger Cloud project | | service | | Manage the Tiger Cloud services in this project | | | create | Create a new service in this project. Possible flags are: <ul><li>`--name`: service name (auto-generated if not provided)</li><li>`--addons`: addons to enable (time-series, ai, or none for PostgreSQL-only)</li><li>`--region`: region code where the service will be deployed</li><li>`--cpu-memory`: CPU/memory allocation combination</li><li>`--replicas`: number of high-availability replicas</li><li>`--no-wait`: don't wait for the operation to complete</li><li>`--wait-timeout`: wait timeout duration (for example, 30m, 1h30m, 90s)</li><li>`--no-set-default`: don't set this service as the default service</li><li>`--with-password`: include password in output</li><li>`--output, -o`: output format (`json`, `yaml`, table)</li></ul> <br/> Possible `cpu-memory` combinations are: <ul><li>shared/shared</li><li>0.5 CPU/2 GB</li><li>1 CPU/4 GB</li><li>2 CPU/8 GB</li><li>4 CPU/16 GB</li><li>8 CPU/32 GB</li><li>16 CPU/64 GB</li><li>32 CPU/128 GB</li></ul> | | | delete `<service-id>` | Delete a service from this project. This operation is irreversible and requires confirmation by typing the service ID | | | fork `<service-id>` | Fork an existing service to create a new independent copy. Key features are: <ul><li><strong>Timing options</strong>: `--now`, `--last-snapshot`, `--to-timestamp`</li><li><strong>Resource configuration</strong>: `--cpu-memory`</li><li><strong>Naming</strong>: `--name <name>`. Defaults to `{source-service-name}-fork`</li><li><strong>Wait behavior</strong>: `--no-wait`, `--wait-timeout`</li><li><strong>Default service</strong>: `--no-set-default`</li></ul> | | | get `<service-id>` (aliases: describe, show) | Show detailed information about a specific service in this project | | | list | List all the services in this project | | | update-password `<service-id>` | Update the master password for a service | | db | | Database operations and management | | | connect `<service-id>` | Connect to a service | | | connection-string `<service-id>` | Retrieve the connection string for a service | | | save-password `<service-id>` | Save the password for a service | | | test-connection `<service-id>` | Test the connectivity to a service | | mcp | | Manage the Tiger Model Context Protocol Server for AI Assistant integration | | | install `[client]` | Install and configure Tiger Model Context Protocol Server for a specific client (`claude-code`, `cursor`, `windsurf`, or other). If no client is specified, you'll be prompted to select one interactively | | | start | Start the Tiger Model Context Protocol Server. This is the same as `tiger mcp start stdio` | | | start stdio | Start the Tiger Model Context Protocol Server with stdio transport (default) | | | start http | Start the Tiger Model Context Protocol Server with HTTP transport. Includes flags: `--port` (default: `8080`), `--host` (default: `localhost`) | ## Global flags You can use the following global flags with Tiger CLI: | Flag | Default | Description | |-------------------------------|-------------------|-----------------------------------------------------------------------------| | `--analytics` | `true` | Set to `false` to disable usage analytics | | `--color ` | `true` | Set to `false` to disable colored output | | `--config-dir` string | `.config/tiger` | Set the directory that holds `config.yaml` | | `--debug` | No debugging | Enable debug logging | | `--help` | - | Print help about the current command. For example, `tiger service --help` | | `--password-storage` string | keyring | Set the password storage method. Options are `keyring`, `pgpass`, or `none` | | `--service-id` string | - | Set the Tiger Cloud service to manage | | ` --skip-update-check ` | - | Do not check if a new version of Tiger CLI is available| ## Configuration parameters By default, Tiger CLI stores your configuration in `~/.config/tiger/config.yaml`. The name of these variables matches the flags you use to update them. However, you can override them using the following environmental variables: - **Configuration parameters** - `TIGER_CONFIG_DIR`: path to configuration directory (default: `~/.config/tiger`) - `TIGER_API_URL`: Tiger REST API base endpoint (default: https://console.cloud.timescale.com/public/api/v1) - `TIGER_CONSOLE_URL`: URL to Tiger Cloud Console (default: https://console.cloud.timescale.com) - `TIGER_GATEWAY_URL`: URL to the Tiger Cloud Console gateway (default: https://console.cloud.timescale.com/api) - `TIGER_DOCS_MCP`: enable/disable docs MCP proxy (default: `true`) - `TIGER_DOCS_MCP_URL`: URL to the Tiger MCP Server for Tiger Data docs (default: https://mcp.tigerdata.com/docs) - `TIGER_SERVICE_ID`: ID for the service updated when you call CLI commands - `TIGER_ANALYTICS`: enable or disable analytics (default: `true`) - `TIGER_PASSWORD_STORAGE`: password storage method (keyring, pgpass, or none) - `TIGER_DEBUG`: enable/disable debug logging (default: `false`) - `TIGER_COLOR`: set to `false` to disable colored output (default: `true`) - **Authentication parameters** To authenticate without using the interactive login, either: - Set the following parameters with your [client credentials][rest-api-credentials], then `login`: ```shell TIGER_PUBLIC_KEY=<public_key> TIGER_SECRET_KEY=<secret_key> TIGER_PROJECT_ID=<project_id>\ tiger auth login ``` - Add your [client credentials][rest-api-credentials] to the `login` command: ```shell tiger auth login --public-key=<public_key> --secret-key=<secret-key> --project-id=<project_id> ``` ===== PAGE: https://docs.tigerdata.com/_partials/_psql-installation-linux/ ===== ### Install psql on Linux You can use the `apt` on Debian-based systems, `yum` on Red Hat-based systems, and `pacman` package manager to install the `psql` tool. ### Installing psql using the apt package manager 1. Make sure your `apt` repository is up to date: ```bash apt-get update ``` 1. Install the `postgresql-client` package: ```bash apt-get install postgresql-client ``` ### Installing psql using the yum package manager 1. Make sure your `yum` repository is up to date: ```bash yum update ``` 1. Install the `postgresql-client` package: ```bash dnf install postgresql14 ``` ### Installing psql using the pacman package manager 1. Make sure your `pacman` repository is up to date: ```bash pacman -Syu ``` 1. Install the `postgresql-client` package: ```bash pacman -S postgresql-libs ``` ===== PAGE: https://docs.tigerdata.com/_partials/_migrate_live_setup_environment_mst/ ===== ## Set your connection strings These variables hold the connection information for the source database and target Tiger Cloud service. In Terminal on your migration machine, set the following:bash export SOURCE="postgres://:@:/" export TARGET="postgres://tsdbadmin:@:/tsdb?sslmode=require"
You find the connection information for your Tiger Cloud service in the configuration file you downloaded when you created the service. Avoid using connection strings that route through connection poolers like PgBouncer or similar tools. This tool requires a direct connection to the database to function properly. ## Align the version of TimescaleDB on the source and target 1. Ensure that the source and target databases are running the same version of TimescaleDB. 1. Check the version of TimescaleDB running on your Tiger Cloud service: ```bash psql target -c "SELECT extversion FROM pg_extension WHERE extname = 'timescaledb';" ``` 1. Update the TimescaleDB extension in your source database to match the target service: If the TimescaleDB extension is the same version on the source database and target service, you do not need to do this. ```bash psql source -c "ALTER EXTENSION timescaledb UPDATE TO '<version here>';" ``` For more information and guidance, see [Upgrade TimescaleDB](https://docs.tigerdata.com/self-hosted/latest/upgrades/). 1. Ensure that the Tiger Cloud service is running the Postgres extensions used in your source database. 1. Check the extensions on the source database: ```bash psql source -c "SELECT * FROM pg_extension;" ``` 1. For each extension, enable it on your target Tiger Cloud service: ```bash psql target -c "CREATE EXTENSION IF NOT EXISTS <extension name> CASCADE;" ``` ## Tune your source database 1. **Enable live-migration to replicate `DELETE` and`UPDATE` operations** Replica identity assists data replication by identifying the rows being modified. Your options are that each table and hypertable in the source database should either have: - **A primary key**: data replication defaults to the primary key of the table being replicated. Nothing to do. - **A viable unique index**: each table has a unique, non-partial, non-deferrable index that includes only columns marked as `NOT NULL`. If a UNIQUE index does not exist, create one to assist the migration. You can delete if after migration. For each table, set `REPLICA IDENTITY` to the viable unique index:shell psql -X -d source -c 'ALTER TABLE REPLICA IDENTITY USING INDEX <_index_name>'
- **No primary key or viable unique index**: use brute force. For each table, set `REPLICA IDENTITY` to `FULL`:shell psql -X -d source -c 'ALTER TABLE {table_name} REPLICA IDENTITY FULL'
For each `UPDATE` or `DELETE` statement, Postgres reads the whole table to find all matching rows. This results in significantly slower replication. If you are expecting a large number of `UPDATE` or `DELETE` operations on the table, best practice is to not use `FULL`. ===== PAGE: https://docs.tigerdata.com/_partials/_install-self-hosted-debian/ ===== 1. **Install the latest Postgres packages** ```bash sudo apt install gnupg postgresql-common apt-transport-https lsb-release wget ``` 1. **Run the Postgres package setup script** ```bash sudo /usr/share/postgresql-common/pgdg/apt.postgresql.org.sh ``` 1. **Add the TimescaleDB package** ```bash echo "deb https://packagecloud.io/timescale/timescaledb/debian/ $(lsb_release -c -s) main" | sudo tee /etc/apt/sources.list.d/timescaledb.list ``` 1. **Install the TimescaleDB GPG key** ```bash wget --quiet -O - https://packagecloud.io/timescale/timescaledb/gpgkey | sudo gpg --dearmor -o /etc/apt/trusted.gpg.d/timescaledb.gpg ``` 1. **Update your local repository list** ```bash sudo apt update ``` 1. **Install TimescaleDB** ```bash sudo apt install timescaledb-2-postgresql-17 postgresql-client-17 ``` To install a specific TimescaleDB [release][releases-page], set the version. For example: `sudo apt-get install timescaledb-2-postgresql-14='2.6.0*' timescaledb-2-loader-postgresql-14='2.6.0*'` Older versions of TimescaleDB may not support all the OS versions listed on this page. 1. **Tune your Postgres instance for TimescaleDB** ```bash sudo timescaledb-tune ``` By default, this script is included with the `timescaledb-tools` package when you install TimescaleDB. Use the prompts to tune your development or production environment. For more information on manual configuration, see [Configuration][config]. If you have an issue, run `sudo apt install timescaledb-tools`. 1. **Restart Postgres** ```bash sudo systemctl restart postgresql ``` 1. **Log in to Postgres as `postgres`** ```bash sudo -u postgres psql ``` You are in the psql shell. 1. **Set the password for `postgres`** ```bash \password postgres ``` When you have set the password, type `\q` to exit psql. ===== PAGE: https://docs.tigerdata.com/_partials/_since_2_21_0/ ===== Since [TimescaleDB v2.21.0](https://github.com/timescale/timescaledb/releases/tag/2.21.0) ===== PAGE: https://docs.tigerdata.com/_partials/_where-to-next/ ===== What next? [Try the key features offered by Tiger Data][try-timescale-features], see the [tutorials][tutorials], interact with the data in your Tiger Cloud service using [your favorite programming language][connect-with-code], integrate your Tiger Cloud service with a range of [third-party tools][integrations], plain old [Use Tiger Data products][use-timescale], or dive into the [API reference][use-the-api]. ===== PAGE: https://docs.tigerdata.com/_partials/_migrate_dual_write_backfill_getting_help/ ===== If you get stuck, you can get help by either opening a support request, or take your issue to the `#migration` channel in the [community slack](https://slack.timescale.com/), where the developers of this migration method are there to help. You can open a support request directly from [Tiger Cloud Console][support-link], or by email to [support@tigerdata.com](mailto:support@tigerdata.com). ===== PAGE: https://docs.tigerdata.com/_partials/_timescaledb/ ===== TimescaleDB is an extension for Postgres that enables time-series workloads, increasing ingest, query, storage and analytics performance. Best practice is to run TimescaleDB in a [Tiger Cloud service](https://console.cloud.timescale.com/signup), but if you want to self-host you can run TimescaleDB yourself. ===== PAGE: https://docs.tigerdata.com/_partials/_migrate_live_tune_source_database_postgres/ ===== You need admin rights to to update the configuration on your source database. If you are using a managed service, follow the instructions in the `From AWS RDS/Aurora` tab on this page. 1. **Install the `wal2json` extension on your source database** [Install wal2json][install-wal2json] on your source database. 1. **Prevent Postgres from treating the data in a snapshot as outdated**shell psql -X -d source -c 'alter system set old_snapshot_threshold=-1'
This is not applicable if the source database is Postgres 17 or later. 1. **Set the write-Ahead Log (WAL) to record the information needed for logical decoding**shell psql -X -d source -c 'alter system set wal_level=logical'
1. **Restart the source database** Your configuration changes are now active. However, verify that the settings are live in your database. 1. **Enable live-migration to replicate `DELETE` and`UPDATE` operations** Replica identity assists data replication by identifying the rows being modified. Your options are that each table and hypertable in the source database should either have: - **A primary key**: data replication defaults to the primary key of the table being replicated. Nothing to do. - **A viable unique index**: each table has a unique, non-partial, non-deferrable index that includes only columns marked as `NOT NULL`. If a UNIQUE index does not exist, create one to assist the migration. You can delete if after migration. For each table, set `REPLICA IDENTITY` to the viable unique index:shell psql -X -d source -c 'ALTER TABLE REPLICA IDENTITY USING INDEX <_index_name>'
- **No primary key or viable unique index**: use brute force. For each table, set `REPLICA IDENTITY` to `FULL`:shell psql -X -d source -c 'ALTER TABLE {table_name} REPLICA IDENTITY FULL'
For each `UPDATE` or `DELETE` statement, Postgres reads the whole table to find all matching rows. This results in significantly slower replication. If you are expecting a large number of `UPDATE` or `DELETE` operations on the table, best practice is to not use `FULL`. ===== PAGE: https://docs.tigerdata.com/_partials/_migrate_live_tune_source_database/ ===== You need admin rights to to update the configuration on your source database. If you are using a managed service, follow the instructions in the `From MST` tab on this page. 1. **Install the `wal2json` extension on your source database** [Install wal2json][install-wal2json] on your source database. 1. **Prevent Postgres from treating the data in a snapshot as outdated**shell psql -X -d source -c 'alter system set old_snapshot_threshold=-1'
This is not applicable if the source database is Postgres 17 or later. 1. **Set the write-Ahead Log (WAL) to record the information needed for logical decoding**shell psql -X -d source -c 'alter system set wal_level=logical'
1. **Restart the source database** Your configuration changes are now active. However, verify that the settings are live in your database. 1. **Enable live-migration to replicate `DELETE` and`UPDATE` operations** Replica identity assists data replication by identifying the rows being modified. Your options are that each table and hypertable in the source database should either have: - **A primary key**: data replication defaults to the primary key of the table being replicated. Nothing to do. - **A viable unique index**: each table has a unique, non-partial, non-deferrable index that includes only columns marked as `NOT NULL`. If a UNIQUE index does not exist, create one to assist the migration. You can delete if after migration. For each table, set `REPLICA IDENTITY` to the viable unique index:shell psql -X -d source -c 'ALTER TABLE REPLICA IDENTITY USING INDEX <_index_name>'
- **No primary key or viable unique index**: use brute force. For each table, set `REPLICA IDENTITY` to `FULL`:shell psql -X -d source -c 'ALTER TABLE {table_name} REPLICA IDENTITY FULL'
For each `UPDATE` or `DELETE` statement, Postgres reads the whole table to find all matching rows. This results in significantly slower replication. If you are expecting a large number of `UPDATE` or `DELETE` operations on the table, best practice is to not use `FULL`. ===== PAGE: https://docs.tigerdata.com/_partials/_timescaledb-config/ ===== Just as you can tune settings in Postgres, TimescaleDB provides a number of configuration settings that may be useful to your specific installation and performance needs. These can also be set within the `postgresql.conf` file or as command-line parameters when starting Postgres. ## Query Planning and Execution ### `timescaledb.enable_chunkwise_aggregation (bool)` If enabled, aggregations are converted into partial aggregations during query planning. The first part of the aggregation is executed on a per-chunk basis. Then, these partial results are combined and finalized. Splitting aggregations decreases the size of the created hash tables and increases data locality, which speeds up queries. ### `timescaledb.vectorized_aggregation (bool)` Enables or disables the vectorized optimizations in the query executor. For example, the `sum()` aggregation function on compressed chunks can be optimized in this way. ### `timescaledb.enable_merge_on_cagg_refresh (bool)` Set to `ON` to dramatically decrease the amount of data written on a continuous aggregate in the presence of a small number of changes, reduce the i/o cost of refreshing a [continuous aggregate][continuous-aggregates], and generate fewer Write-Ahead Logs (WAL). Only works for continuous aggregates that don't have compression enabled. Please refer to the [Grand Unified Configuration (GUC) parameters][gucs] for a complete list. ## Policies ### `timescaledb.max_background_workers (int)` Max background worker processes allocated to TimescaleDB. Set to at least 1 + the number of databases loaded with the TimescaleDB extension in a Postgres instance. Default value is 16. ## Tiger Cloud service tuning ### `timescaledb.disable_load (bool)` Disable the loading of the actual extension ## Administration ### `timescaledb.restoring (bool)` Set TimescaleDB in restoring mode. It is disabled by default. ### `timescaledb.license (string)` Change access to features based on the TimescaleDB license in use. For example, setting `timescaledb.license` to `apache` limits TimescaleDB to features that are implemented under the Apache 2 license. The default value is `timescale`, which allows access to all features. ### `timescaledb.telemetry_level (enum)` Telemetry settings level. Level used to determine which telemetry to send. Can be set to `off` or `basic`. Defaults to `basic`. ### `timescaledb.last_tuned (string)` Records last time `timescaledb-tune` ran. ### `timescaledb.last_tuned_version (string)` Version of `timescaledb-tune` used to tune when it runs. ===== PAGE: https://docs.tigerdata.com/_partials/_migrate_self_postgres_timescaledb_compatibility/ ===== | TimescaleDB version |Postgres 17|Postgres 16|Postgres 15|Postgres 14|Postgres 13|Postgres 12|Postgres 11|Postgres 10| |-----------------------|-|-|-|-|-|-|-|-| | 2.22.x |✅|✅|✅|❌|❌|❌|❌|❌|❌| | 2.21.x |✅|✅|✅|❌|❌|❌|❌|❌|❌| | 2.20.x |✅|✅|✅|❌|❌|❌|❌|❌|❌| | 2.17 - 2.19 |✅|✅|✅|✅|❌|❌|❌|❌|❌| | 2.16.x |❌|✅|✅|✅|❌|❌|❌|❌|❌|❌| | 2.13 - 2.15 |❌|✅|✅|✅|✅|❌|❌|❌|❌| | 2.12.x |❌|❌|✅|✅|✅|❌|❌|❌|❌| | 2.10.x |❌|❌|✅|✅|✅|✅|❌|❌|❌| | 2.5 - 2.9 |❌|❌|❌|✅|✅|✅|❌|❌|❌| | 2.4 |❌|❌|❌|❌|✅|✅|❌|❌|❌| | 2.1 - 2.3 |❌|❌|❌|❌|✅|✅|✅|❌|❌| | 2.0 |❌|❌|❌|❌|❌|✅|✅|❌|❌ | 1.7 |❌|❌|❌|❌|❌|✅|✅|✅|✅| We recommend not using TimescaleDB with Postgres 17.1, 16.5, 15.9, 14.14, 13.17, 12.21. These minor versions [introduced a breaking binary interface change][postgres-breaking-change] that, once identified, was reverted in subsequent minor Postgres versions 17.2, 16.6, 15.10, 14.15, 13.18, and 12.22. When you build from source, best practice is to build with Postgres 17.2, 16.6, etc and higher. Users of [Tiger Cloud](https://console.cloud.timescale.com/) and platform packages for Linux, Windows, MacOS, Docker, and Kubernetes are unaffected. ===== PAGE: https://docs.tigerdata.com/_partials/_devops-mcp-commands-cli/ ===== You can use the following Tiger CLI commands to run Tiger MCP Server: Usage: `tiger mcp [subcommand] --<flags>` | Command | Subcommand | Description | |---------|--------------------|--------------------------------------------------------------------------------------------------------------------------------------------------------------------------------------------------------------------------------------------------------------------------------------------------------------------------------------------------------------------------------------| | mcp | | Manage the Tiger Model Context Protocol Server | | | install `[client]` | Install and configure Tiger MCP Server for a specific client installed on your developer device. <br/>Supported clients are: `claude-code`, `cursor`, `windsurf`, `codex`, `gemini/gemini-cli`, `vscode/code/vs-code`. <br/> Flags: <ul><li>`--no-backup`: do not back up the existing configuration</li><li>`--config-path`: open the configuration file at a specific location</li></ul> | | | start | Start the Tiger MCP Server. This is the same as `tiger mcp start stdio` | | | start stdio | Start the Tiger MCP Server with stdio transport | | | start http | Start the Tiger MCP Server with HTTP transport. This option is for users who wish to access Tiger Model Context Protocol Server without using stdio. For example, your AI Assistant does not support stdio, or you do not want to run CLI on your device. <br/> Flags are: <ul><li>`--port <port number>`: the default is `8000`</li><li>`--host <hostname>`: the default is `localhost`</li></ul> | ===== PAGE: https://docs.tigerdata.com/_partials/_migrate_to_upload_to_target/ ===== 1. **Take the applications that connect to the source database offline** The duration of the migration is proportional to the amount of data stored in your database. By disconnection your app from your database you avoid and possible data loss. 1. **Set your connection strings** These variables hold the connection information for the source database and target Tiger Cloud service:bash export SOURCE="postgres://:@:/" export TARGET="postgres://tsdbadmin:@:/tsdb?sslmode=require"
You find the connection information for your Tiger Cloud service in the configuration file you downloaded when you created the service. 1. **Ensure that the source and target databases are running the same version of TimescaleDB** 1. Check the version of TimescaleDB running on your Tiger Cloud service: ```bash psql target -c "SELECT extversion FROM pg_extension WHERE extname = 'timescaledb';" ``` 1. Update the TimescaleDB extension in your source database to match the target source: If the TimescaleDB extension is the same version on the source database and target service, you do not need to do this. ```bash psql source -c "ALTER EXTENSION timescaledb UPDATE TO '<version here>';" ``` For more information and guidance, see [Upgrade TimescaleDB]. 1. **Ensure that the Tiger Cloud service is running the Postgres extensions used in your source database** 1. Check the extensions on the source database: ```bash psql source -c "SELECT * FROM pg_extension;" ``` 1. For each extension, enable it on your target Tiger Cloud service: ```bash psql target -c "CREATE EXTENSION IF NOT EXISTS <extension name> CASCADE;" ``` 1. **Dump the roles from your source database** Export your role-based security hierarchy. If you only use the default `postgres` role, this step is not necessary.bash pg_dumpall -d "source"
--quote-all-identifiers \ --roles-only \ --file=roles.sql1. **Remove roles with superuser access** Tiger Cloud services do not support roles with superuser access. Run the following script to remove statements, permissions and clauses that require superuser permissions from `roles.sql`:bash sed -i -E \ -e '/CREATE ROLE "postgres";/d' \ -e '/ALTER ROLE "postgres"/d' \ -e 's/(NO)*SUPERUSER//g' \ -e 's/(NO)*REPLICATION//g' \ -e 's/(NO)BYPASSRLS//g' \ -e 's/GRANTED BY "[^"]"//g' \ roles.sql
1. **Dump the source database schema and data** The `pg_dump` flags remove superuser access and tablespaces from your data. When you run `pgdump`, check the run time, [a long-running `pg_dump` can cause issues][long-running-pgdump].bash pg_dump -d "source" \ --format=plain \ --quote-all-identifiers \ --no-tablespaces \ --no-owner \ --no-privileges \ --file=dump.sql
To dramatically reduce the time taken to dump the source database, using multiple connections. For more information, see [dumping with concurrency][dumping-with-concurrency] and [restoring with concurrency][restoring-with-concurrency]. ===== PAGE: https://docs.tigerdata.com/_partials/_devops-cli-global-flags/ ===== | Flag | Default | Description | |-------------------------------|-------------------|-----------------------------------------------------------------------------| | `--analytics` | `true` | Set to `false` to disable usage analytics | | `--color ` | `true` | Set to `false` to disable colored output | | `--config-dir` string | `.config/tiger` | Set the directory that holds `config.yaml` | | `--debug` | No debugging | Enable debug logging | | `--help` | - | Print help about the current command. For example, `tiger service --help` | | `--password-storage` string | keyring | Set the password storage method. Options are `keyring`, `pgpass`, or `none` | | `--service-id` string | - | Set the Tiger Cloud service to manage | | ` --skip-update-check ` | - | Do not check if a new version of Tiger CLI is available| ===== PAGE: https://docs.tigerdata.com/_partials/_migrate_dump_awsrds/ ===== ## Create an intermediary EC2 Ubuntu instance 1. In [https://console.aws.amazon.com/rds/home#databases:][databases], select the RDS/Aurora Postgres instance to migrate. 1. Click `Actions` > `Set up EC2 connection`. Press `Create EC2 instance` and use the following settings: - **AMI**: Ubuntu Server. - **Key pair**: use an existing pair or create a new one that you will use to access the intermediary machine. - **VPC**: by default, this is the same as the database instance. - **Configure Storage**: adjust the volume to at least the size of RDS/Aurora Postgres instance you are migrating from. You can reduce the space used by your data on Tiger Cloud using [Hypercore][hypercore]. 1. Click `Lauch instance`. AWS creates your EC2 instance, then click `Connect to instance` > `SSH client`. Follow the instructions to create the connection to your intermediary EC2 instance. ## Install the psql client tools on the intermediary instance 1. Connect to your intermediary EC2 instance. For example:sh ssh -i ".pem" ubuntu@
1. On your intermediary EC2 instance, install the Postgres client.sh sudo sh -c 'echo "deb http://apt.postgresql.org/pub/repos/apt $(lsb_release -cs)-pgdg main" > /etc/apt/sources.list.d/pgdg.list' wget -qO- https://www.postgresql.org/media/keys/ACCC4CF8.asc | sudo tee /etc/apt/trusted.gpg.d/pgdg.asc &>/dev/null sudo apt update sudo apt install postgresql-client-16 -y # "postgresql-client-16" if your source DB is using PG 16. psql --version && pg_dump --version
Keep this terminal open, you need it to connect to the RDS/Aurora Postgres instance for migration. ## Set up secure connectivity between your RDS/Aurora Postgres and EC2 instances 1. In [https://console.aws.amazon.com/rds/home#databases:][databases], select the RDS/Aurora Postgres instance to migrate. 1. Scroll down to `Security group rules (1)` and select the `EC2 Security Group - Inbound` group. The `Security Groups (1)` window opens. Click the `Security group ID`, then click `Edit inbound rules` <img class="main-content__illustration" src="https://assets.timescale.com/docs/images/migrate/rds-add-security-rule-to-ec2-instance.svg" alt="Create security group rule to enable RDS/Aurora Postgres EC2 connection"/> 1. On your intermediary EC2 instance, get your local IP address:sh ec2metadata --local-ipv4
Bear with me on this one, you need this IP address to enable access to your RDS/Aurora Postgres instance. 1. In `Edit inbound rules`, click `Add rule`, then create a `PostgreSQL`, `TCP` rule granting access to the local IP address for your EC2 instance (told you :-)). Then click `Save rules`. <img class="main-content__illustration" src="https://assets.timescale.com/docs/images/migrate/rds-add-inbound-rule-for-ec2-instance.png" alt="Create security rule to enable RDS/Aurora Postgres EC2 connection"/> ## Test the connection between your RDS/Aurora Postgres and EC2 instances 1. In [https://console.aws.amazon.com/rds/home#databases:][databases], select the RDS/Aurora Postgres instance to migrate. 1. On your intermediary EC2 instance, use the values of `Endpoint`, `Port`, `Master username`, and `DB name` to create the postgres connectivity string to the `SOURCE` variable. <img class="main-content__illustration" src="https://assets.timescale.com/docs/images/migrate/migrate-source-rds-instance.svg" alt="Record endpoint, port, VPC details"/>sh export SOURCE="postgres://:@:/"
The value of `Master password` was supplied when this RDS/Aurora Postgres instance was created. 1. Test your connection:sh psql -d source
You are connected to your RDS/Aurora Postgres instance from your intermediary EC2 instance. ## Migrate your data to your Tiger Cloud service To securely migrate data from your RDS instance: ## Prepare to migrate 1. **Take the applications that connect to the RDS instance offline** The duration of the migration is proportional to the amount of data stored in your database. By disconnection your app from your database you avoid and possible data loss. You should also ensure that your source RDS instance is not receiving any DML queries. 1. **Connect to your intermediary EC2 instance** For example:sh ssh -i ".pem" ubuntu@
1. **Set your connection strings** These variables hold the connection information for the RDS instance and target Tiger Cloud service:bash export SOURCE="postgres://:@:/" export TARGET=postgres://tsdbadmin:@:/tsdb?sslmode=require
You find the connection information for `SOURCE` in your RDS configuration. For `TARGET` in the configuration file you downloaded when you created the Tiger Cloud service. ## Align the extensions on the source and target 1. Ensure that the Tiger Cloud service is running the Postgres extensions used in your source database. 1. Check the extensions on the source database: ```bash psql source -c "SELECT * FROM pg_extension;" ``` 1. For each extension, enable it on your target Tiger Cloud service: ```bash psql target -c "CREATE EXTENSION IF NOT EXISTS <extension name> CASCADE;" ``` ## Migrate roles from RDS to your Tiger Cloud service Roles manage database access permissions. To migrate your role-based security hierarchy to your Tiger Cloud service: 1. **Dump the roles from your RDS instance** Export your role-based security hierarchy. If you only use the default `postgres` role, this step is not necessary.bash pg_dumpall -d "source"
--quote-all-identifiers \ --roles-only \ --no-role-passwords \ --file=roles.sqlAWS RDS does not allow you to export passwords with roles. You assign passwords to these roles when you have uploaded them to your Tiger Cloud service. 1. **Remove roles with superuser access** Tiger Cloud services do not support roles with superuser access. Run the following script to remove statements, permissions and clauses that require superuser permissions from `roles.sql`:bash sed -i -E \ -e '/CREATE ROLE "postgres";/d' \ -e '/ALTER ROLE "postgres"/d' \ -e '/CREATE ROLE "rds/d' \ -e '/ALTER ROLE "rds/d' \ -e '/TO "rds/d' \ -e '/GRANT "rds/d' \ -e 's/(NO)*SUPERUSER//g' \ -e 's/(NO)*REPLICATION//g' \ -e 's/(NO)BYPASSRLS//g' \ -e 's/GRANTED BY "[^"]"//g' \ roles.sql
1. **Upload the roles to your Tiger Cloud service**bash psql -X -d "target"
-v ON_ERROR_STOP=1 \ --echo-errors \ -f roles.sql1. **Manually assign passwords to the roles** AWS RDS did not allow you to export passwords with roles. For each role, use the following command to manually assign a password to a role:bash
psql target -c "ALTER ROLE <role name> WITH PASSWORD '<highly secure password>';" ```Migrate data from your RDS instance to your Tiger Cloud service
The
pg_dumpflags remove superuser access and tablespaces from your data. When you runpgdump, check the run time, a long-runningpg_dumpcan cause issues.pg_dump -d "source" \ --format=plain \ --quote-all-identifiers \ --no-tablespaces \ --no-owner \ --no-privileges \ --file=dump.sqlTo dramatically reduce the time taken to dump the RDS instance, using multiple connections. For more information, see dumping with concurrency and restoring with concurrency.
Validate your Tiger Cloud service and restart your app
Check that your data is correct, and returns the results that you expect,
Migration from Postgres moves the data only. Now manually enable Tiger Cloud features like hypertables, hypercore or data retention while your database is offline.
===== PAGE: https://docs.tigerdata.com/_partials/_service-overview/ =====
You manage your Tiger Cloud services and interact with your data in Tiger Cloud Console using the following modes:
Ops mode Data mode You use the ops mode to: Powered by PopSQL, you use the data mode to: ===== PAGE: https://docs.tigerdata.com/_partials/_livesync-terminal/ =====
Prerequisites
Best practice is to use an Ubuntu EC2 instance hosted in the same region as your Tiger Cloud service to move data. That is, the machine you run the commands on to move your data from your source database to your target Tiger Cloud service.
Before you move your data:
Each Tiger Cloud service has a single Postgres instance that supports the most popular extensions. Tiger Cloud services do not support tablespaces, and there is no superuser associated with a service. Best practice is to create a Tiger Cloud service with at least 8 CPUs for a smoother experience. A higher-spec instance can significantly reduce the overall migration window.
The source Postgres connector does not create extensions on the target. If the table uses column types from an extension, first create the extension on the target Tiger Cloud service before syncing the table.
For a better experience, use a 4 CPU/16GB EC2 instance or greater to run the source Postgres connector.
This includes
psql,pg_dump,pg_dumpall, andvacuumdbcommands.Limitations
Make compatible changes to the schema in your Tiger Cloud service first, then make the same changes to the source Postgres instance.
The source Postgres connector does not create extensions on the target. If the table uses column types from an extension, first create the extension on the target Tiger Cloud service before syncing the table.
The connector uses
session_replication_role=replicaduring data replication, which prevents table triggers from firing. This includes the internal triggers that mark continuous aggregates as invalid when underlying data changes.If you have continuous aggregates on your target database, they do not automatically refresh for data inserted during the migration. This limitation only applies to data below the continuous aggregate's materialization watermark. For example, backfilled data. New rows synced above the continuous aggregate watermark are used correctly when refreshing.
This can lead to:
If the continuous aggregate exists in the source database, best practice is to add it to the Postgres connector publication. If it only exists on the target database, manually refresh the continuous aggregate using the
forceoption of refresh_continuous_aggregate.Set your connection strings
The
<user>in theSOURCEconnection must have the replication role granted in order to create a replication slot.These variables hold the connection information for the source database and target Tiger Cloud service. In Terminal on your migration machine, set the following:
export SOURCE="postgres://<user>:<password>@<source host>:<source port>/<db_name>" export TARGET="postgres://tsdbadmin:<PASSWORD>@<HOST>:<PORT>/tsdb?sslmode=require"You find the connection information for your Tiger Cloud service in the configuration file you downloaded when you created the service.
Avoid using connection strings that route through connection poolers like PgBouncer or similar tools. This tool requires a direct connection to the database to function properly.
Tune your source database
Updating parameters on a Postgres instance will cause an outage. Choose a time that will cause the least issues to tune this database.
Replica identity assists data replication by identifying the rows being modified. Your options are that each table and hypertable in the source database should either have:
For each table, set
REPLICA IDENTITYto the viable unique index:psql -X -d source -c 'ALTER TABLE REPLICA IDENTITY USING INDEX <_index_name>'For each table, set
REPLICA IDENTITYtoFULL:psql -X -d source -c 'ALTER TABLE {table_name} REPLICA IDENTITY FULL'For each
UPDATEorDELETEstatement, Postgres reads the whole table to find all matching rows. This results in significantly slower replication. If you are expecting a large number ofUPDATEorDELETEoperations on the table, best practice is to not useFULL.This will require a restart of the Postgres source database.
Replica identity assists data replication by identifying the rows being modified. Your options are that each table and hypertable in the source database should either have:
For each table, set
REPLICA IDENTITYto the viable unique index:psql -X -d source -c 'ALTER TABLE REPLICA IDENTITY USING INDEX <_index_name>'For each table, set
REPLICA IDENTITYtoFULL:psql -X -d source -c 'ALTER TABLE {table_name} REPLICA IDENTITY FULL'For each
UPDATEorDELETEstatement, Postgres reads the whole table to find all matching rows. This results in significantly slower replication. If you are expecting a large number ofUPDATEorDELETEoperations on the table, best practice is to not useFULL.Migrate the table schema to the Tiger Cloud service
Use
pg_dumpto:Convert partitions and tables with time-series data into hypertables
For efficient querying and analysis, you can convert tables which contain time-series or events data, and tables that are already partitioned using Postgres declarative partition into hypertables.
Run the following on each table in the target Tiger Cloud service to convert it to a hypertable:
psql -X -d target -c "SELECT public.create_hypertable('', by_range('<partition column>', '<chunk interval>'::interval));"For example, to convert the metrics table into a hypertable with time as a partition column and 1 day as a partition interval:
psql -X -d target -c "SELECT public.create_hypertable('public.metrics', by_range('time', '1 day'::interval));"Rename the partition and create a new regular table with the same name as the partitioned table, then convert to a hypertable:
psql target -f - <<'EOF' BEGIN; ALTER TABLE public.events RENAME TO events_part; CREATE TABLE public.events(LIKE public.events_part INCLUDING ALL); SELECT create_hypertable('public.events', by_range('time', '1 day'::interval)); COMMIT; EOFSpecify the tables to synchronize
After the schema is migrated, you
CREATE PUBLICATIONon the source database that specifies the tables to synchronize.A
PUBLICATIONenables you to synchronize some or all the tables in the schema or database.CREATE PUBLICATION <publication_name> FOR TABLE , ;To add tables after to an existing publication, use [ALTER PUBLICATION][alter-publication]**ALTER PUBLICATION <publication_name> ADD TABLE ;To convert partitioned table to hypertable, follow Convert partitions and tables with time-series data into hypertables.
Synchronize data to your Tiger Cloud service
You use the source Postgres connector docker image to synchronize changes in real time from a Postgres database instance to a Tiger Cloud service:
As you run the source Postgres connector continuously, best practice is to run it as a Docker daemon.
docker run -d --rm --name livesync timescale/live-sync:v0.1.25 run \ --publication <publication_name> --subscription <subscription_name> \ --source source --target target --table-map--publication: The name of the publication as you created in the previous step. To use multiple publications, repeat the--publicationflag.--subscription: The name that identifies the subscription on the target Tiger Cloud service.--source: The connection string to the source Postgres database.--target: The connection string to the target Tiger Cloud service.--table-map: (Optional) A JSON string that maps source tables to target tables. If not provided, the source and target table names are assumed to be the same. For example, to map the source tablemetricsto the target tablemetrics_data:--table-map '{"source": {"schema": "public", "table": "metrics"}, "target": {"schema": "public", "table": "metrics_data"}}'To map only the schema, use:
--table-map '{"source": {"schema": "public"}, "target": {"schema": "analytics"}}'This flag can be repeated for multiple table mappings.
Once the source Postgres connector is running as a docker daemon, you can also capture the logs:
docker logs -f livesyncList the tables being synchronized by the source Postgres connector using the
_ts_live_sync.subscription_reltable in the target Tiger Cloud service:psql target -c "SELECT * FROM _ts_live_sync.subscription_rel"You see something like the following:
| subname | pubname | schemaname | tablename | rrelid | state | lsn | updated_at | last_error | created_at | rows_copied | approximate_rows | bytes_copied | approximate_size | target_schema | target_table | |----------|---------|-------------|-----------|--------|-------|------------|-------------------------------|-------------------------------------------------------------------------------|-------------------------------|-------------|------------------|--------------|------------------|---------------|-------------| |livesync | analytics | public | metrics | 20856 | r | 6/1A8CBA48 | 2025-06-24 06:16:21.434898+00 | | 2025-06-24 06:03:58.172946+00 | 18225440 | 18225440 | 1387359359 | 1387359359 | public | metrics |
The
statecolumn indicates the current state of the table synchronization. Possible values forstateare:| state | description | |-------|-------------| | d | initial table data sync | | f | initial table data sync completed | | s | catching up with the latest changes | | r | table is ready, syncing live changes |
To see the replication lag, run the following against the SOURCE database:
psql source -f - <<'EOF' SELECT slot_name, pg_size_pretty(pg_current_wal_flush_lsn() - confirmed_flush_lsn) AS lag FROM pg_replication_slots WHERE slot_name LIKE 'live_sync_%' AND slot_type = 'logical' EOFTo add tables, use ALTER PUBLICATION .. ADD TABLE**
ALTER PUBLICATION <publication_name> ADD TABLE ;To remove tables, use ALTER PUBLICATION .. DROP TABLE**
ALTER PUBLICATION <publication_name> DROP TABLE ;If you have a large table, you can run
ANALYZEon the target Tiger Cloud service to update the table statistics after the initial sync is complete.This helps the query planner make better decisions for query execution plans.
vacuumdb --analyze --verbose --dbname=targetThe source Postgres connector does not automatically reset the sequence nextval on the target Tiger Cloud service.
Run the following script to reset the sequence for all tables that have a serial or identity column in the target Tiger Cloud service:
psql target -f - <<'EOF' DO $$ DECLARE rec RECORD; BEGIN FOR rec IN ( SELECT sr.target_schema AS table_schema, sr.target_table AS table_name, col.column_name, pg_get_serial_sequence( sr.target_schema || '.' || sr.target_table, col.column_name ) AS seqname FROM _ts_live_sync.subscription_rel AS sr JOIN information_schema.columns AS col ON col.table_schema = sr.target_schema AND col.table_name = sr.target_table WHERE col.column_default LIKE 'nextval(%' -- only serial/identity columns ) LOOP EXECUTE format( 'SELECT setval(%L, COALESCE((SELECT MAX(%I) FROM %I.%I), 0) + 1, false );', rec.seqname, -- the sequence identifier rec.column_name, -- the column to MAX() rec.table_schema, -- schema for MAX() rec.table_name -- table for MAX() ); END LOOP; END; $$ LANGUAGE plpgsql; EOFUse the
--dropflag to remove the replication slots created by the source Postgres connector on the source database.docker run -it --rm --name livesync timescale/live-sync:v0.1.25 run \ --publication <publication_name> --subscription <subscription_name> \ --source source --target target \ --drop===== PAGE: https://docs.tigerdata.com/_partials/_migrate_dump_mst/ =====
Prepare to migrate
The duration of the migration is proportional to the amount of data stored in your database. By disconnection your app from your database you avoid and possible data loss.
These variables hold the connection information for the source database and target Tiger Cloud service:
export SOURCE="postgres://<user>:<password>@<source host>:<source port>/<db_name>" export TARGET="postgres://tsdbadmin:<PASSWORD>@<HOST>:<PORT>/tsdb?sslmode=require"You find the connection information for your Tiger Cloud service in the configuration file you downloaded when you created the service.
Align the version of TimescaleDB on the source and target
Migrate the roles from TimescaleDB to your Tiger Cloud service
Roles manage database access permissions. To migrate your role-based security hierarchy to your Tiger Cloud service:
Export your role-based security hierarchy.
<db_name>has the same value as<db_name>insource. I know, it confuses me as well.pg_dumpall -d "source" \ -l <db_name> \ --quote-all-identifiers \ --roles-only \ --no-role-passwords \ --file=roles.sqlMST does not allow you to export passwords with roles. You assign passwords to these roles when you have uploaded them to your Tiger Cloud service.
Tiger Cloud services do not support roles with superuser access. Run the following script to remove statements, permissions and clauses that require superuser permissions from
roles.sql:sed -i -E \ -e '/DROP ROLE IF EXISTS "postgres";/d' \ -e '/DROP ROLE IF EXISTS "tsdbadmin";/d' \ -e '/CREATE ROLE "postgres";/d' \ -e '/ALTER ROLE "postgres"/d' \ -e '/CREATE ROLE "rds/d' \ -e '/ALTER ROLE "rds/d' \ -e '/TO "rds/d' \ -e '/GRANT "rds/d' \ -e '/GRANT "pg_read_all_stats" TO "tsdbadmin"/d' \ -e 's/(NO)*SUPERUSER//g' \ -e 's/(NO)*REPLICATION//g' \ -e 's/(NO)*BYPASSRLS//g' \ -e 's/GRANTED BY "[^"]*"//g' \ -e '/CREATE ROLE "tsdbadmin";/d' \ -e '/ALTER ROLE "tsdbadmin"/d' \ -e 's/WITH ADMIN OPTION,/WITH /g' \ -e 's/WITH ADMIN OPTION//g' \ -e 's/GRANTED BY ".*"//g' \ -e '/GRANT "pg_.*" TO/d' \ -e '/CREATE ROLE "_aiven";/d' \ -e '/ALTER ROLE "_aiven"/d' \ -e '/GRANT SET ON PARAMETER "pgaudit\.[^"]+" TO "_tsdbadmin_auditing"/d' \ -e '/GRANT SET ON PARAMETER "anon\.[^"]+" TO "tsdbadmin_group"/d' \ roles.sqlThe
pg_dumpflags remove superuser access and tablespaces from your data. When you runpgdump, check the run time, a long-runningpg_dumpcan cause issues.pg_dump -d "source" \ --format=plain \ --quote-all-identifiers \ --no-tablespaces \ --no-owner \ --no-privileges \ --file=dump.sqlTo dramatically reduce the time taken to dump the source database, using multiple connections. For more information, see dumping with concurrency and restoring with concurrency.
Upload your data to the target Tiger Cloud service
This command uses the timescaledb_pre_restore and timescaledb_post_restore functions to put your database in the correct state.
MST did not allow you to export passwords with roles. For each role, use the following command to manually assign a password to a role:
psql target -c "ALTER ROLE <role name> WITH PASSWORD '<highly secure password>';" ``` ## Validate your Tiger Cloud service and restart your app 1. Update the table statistics. ```bash psql target -c "ANALYZE;" ``` 1. Verify the data in the target Tiger Cloud service. Check that your data is correct, and returns the results that you expect, 1. Enable any Tiger Cloud features you want to use. Migration from Postgres moves the data only. Now manually enable Tiger Cloud features like [hypertables][about-hypertables], [hypercore][data-compression] or [data retention][data-retention] while your database is offline. 1. Reconfigure your app to use the target database, then restart it. ===== PAGE: https://docs.tigerdata.com/_partials/_install-self-hosted-rocky/ ===== Tiger Data supports Rocky Linux 8 and 9 on amd64 only. 1. **Update your local repository list** ```bash sudo dnf update -y sudo dnf install -y epel-release ``` 1. **Install the latest Postgres packages** ```bash sudo dnf install -y https://download.postgresql.org/pub/repos/yum/reporpms/EL-9-x86_64/pgdg-redhat-repo-latest.noarch.rpm ``` 1. **Add the TimescaleDB repository** ```bash sudo tee /etc/yum.repos.d/timescale_timescaledb.repo <<EOL [timescale_timescaledb] name=timescale_timescaledb baseurl=https://packagecloud.io/timescale/timescaledb/el/9/\$basearch repo_gpgcheck=1 gpgcheck=0 enabled=1 gpgkey=https://packagecloud.io/timescale/timescaledb/gpgkey sslverify=1 sslcacert=/etc/pki/tls/certs/ca-bundle.crt metadata_expire=300 EOL ``` 1. **Disable the built-in PostgreSQL module** This is for Rocky Linux 9 only. ```bash sudo dnf module disable postgresql -y ``` 1. **Install TimescaleDB** To avoid errors, **do not** install TimescaleDB Apache 2 Edition and TimescaleDB Community Edition at the same time. ```bash sudo dnf install -y postgresql16-server postgresql16-contrib timescaledb-2-postgresql-16 ``` 1. **Initialize the Postgres instance** ```bash sudo /usr/pgsql-16/bin/postgresql-16-setup initdb ``` 1. **Tune your Postgres instance for TimescaleDB** ```bash sudo timescaledb-tune --pg-config=/usr/pgsql-16/bin/pg_config ``` This script is included with the `timescaledb-tools` package when you install TimescaleDB. For more information, see [configuration][config]. 1. **Enable and start Postgres** ```bash sudo systemctl enable postgresql-16 sudo systemctl start postgresql-16 ``` 1. **Log in to Postgres as `postgres`** ```bash sudo -u postgres psql ``` You are now in the psql shell. 1. **Set the password for `postgres`** ```bash \password postgres ``` When you have set the password, type `\q` to exit psql. ===== PAGE: https://docs.tigerdata.com/_partials/_migrate_validate_and_restart_app/ ===== 1. Update the table statistics. ```bash psql target -c "ANALYZE;" ``` 1. Verify the data in the target Tiger Cloud service. Check that your data is correct, and returns the results that you expect, 1. Enable any Tiger Cloud features you want to use. Migration from Postgres moves the data only. Now manually enable Tiger Cloud features like [hypertables][about-hypertables], [hypercore][data-compression] or [data retention][data-retention] while your database is offline. 1. Reconfigure your app to use the target database, then restart it. ===== PAGE: https://docs.tigerdata.com/_partials/_install-self-hosted-redhat-based/ ===== 1. **Install the latest Postgres packages** <Terminal persistKey="os-redhat"> ```bash sudo yum install https://download.postgresql.org/pub/repos/yum/reporpms/EL-$(rpm -E %{rhel})-x86_64/pgdg-redhat-repo-latest.noarch.rpm ``` ```bash sudo yum install https://download.postgresql.org/pub/repos/yum/reporpms/F-$(rpm -E %{fedora})-x86_64/pgdg-fedora-repo-latest.noarch.rpm ``` </Terminal> 1. **Add the TimescaleDB repository** <Terminal persistKey="os-redhat"> ```bash sudo tee /etc/yum.repos.d/timescale_timescaledb.repo <<EOL [timescale_timescaledb] name=timescale_timescaledb baseurl=https://packagecloud.io/timescale/timescaledb/el/$(rpm -E %{rhel})/\$basearch repo_gpgcheck=1 gpgcheck=0 enabled=1 gpgkey=https://packagecloud.io/timescale/timescaledb/gpgkey sslverify=1 sslcacert=/etc/pki/tls/certs/ca-bundle.crt metadata_expire=300 EOL ``` ```bash sudo tee /etc/yum.repos.d/timescale_timescaledb.repo <<EOL [timescale_timescaledb] name=timescale_timescaledb baseurl=https://packagecloud.io/timescale/timescaledb/el/9/\$basearch repo_gpgcheck=1 gpgcheck=0 enabled=1 gpgkey=https://packagecloud.io/timescale/timescaledb/gpgkey sslverify=1 sslcacert=/etc/pki/tls/certs/ca-bundle.crt metadata_expire=300 EOL ``` </Terminal> 1. **Update your local repository list** ```bash sudo yum update ``` 1. **Install TimescaleDB** To avoid errors, **do not** install TimescaleDB Apache 2 Edition and TimescaleDB Community Edition at the same time. ```bash sudo yum install timescaledb-2-postgresql-17 postgresql17 ``` <!-- hack until we have bandwidth to rewrite this linting rule --> <!-- markdownlint-disable TS007 --> On Red Hat Enterprise Linux 8 and later, disable the built-in Postgres module: `sudo dnf -qy module disable postgresql` <!-- markdownlint-enable TS007 --> 1. **Initialize the Postgres instance** ```bash sudo /usr/pgsql-17/bin/postgresql-17-setup initdb ``` 1. **Tune your Postgres instance for TimescaleDB** ```bash sudo timescaledb-tune --pg-config=/usr/pgsql-17/bin/pg_config ``` This script is included with the `timescaledb-tools` package when you install TimescaleDB. For more information, see [configuration][config]. 1. **Enable and start Postgres** ```bash sudo systemctl enable postgresql-17 sudo systemctl start postgresql-17 ``` 1. **Log in to Postgres as `postgres`** ```bash sudo -u postgres psql ``` You are now in the psql shell. 1. **Set the password for `postgres`** ```bash \password postgres ``` When you have set the password, type `\q` to exit psql. ===== PAGE: https://docs.tigerdata.com/_partials/_sunsetted_2_14_0/ ===== Sunsetted since TimescaleDB v2.14.0 ===== PAGE: https://docs.tigerdata.com/_partials/_real-time-aggregates/ ===== In TimescaleDB v2.13 and later, real-time aggregates are **DISABLED** by default. In earlier versions, real-time aggregates are **ENABLED** by default; when you create a continuous aggregate, queries to that view include the results from the most recent raw data. ===== PAGE: https://docs.tigerdata.com/_partials/_install-self-hosted-ubuntu/ ===== 1. **Install the latest Postgres packages** ```bash sudo apt install gnupg postgresql-common apt-transport-https lsb-release wget ``` 1. **Run the Postgres package setup script** ```bash sudo /usr/share/postgresql-common/pgdg/apt.postgresql.org.sh ``` ```bash echo "deb https://packagecloud.io/timescale/timescaledb/ubuntu/ $(lsb_release -c -s) main" | sudo tee /etc/apt/sources.list.d/timescaledb.list ``` 1. **Install the TimescaleDB GPG key** ```bash wget --quiet -O - https://packagecloud.io/timescale/timescaledb/gpgkey | sudo gpg --dearmor -o /etc/apt/trusted.gpg.d/timescaledb.gpg ``` For Ubuntu 21.10 and earlier use the following command: `wget --quiet -O - https://packagecloud.io/timescale/timescaledb/gpgkey | sudo apt-key add -` 1. **Update your local repository list** ```bash sudo apt update ``` 1. **Install TimescaleDB** ```bash sudo apt install timescaledb-2-postgresql-17 postgresql-client-17 ``` To install a specific TimescaleDB [release][releases-page], set the version. For example: `sudo apt-get install timescaledb-2-postgresql-14='2.6.0*' timescaledb-2-loader-postgresql-14='2.6.0*'` Older versions of TimescaleDB may not support all the OS versions listed on this page. 1. **Tune your Postgres instance for TimescaleDB** ```bash sudo timescaledb-tune ``` By default, this script is included with the `timescaledb-tools` package when you install TimescaleDB. Use the prompts to tune your development or production environment. For more information on manual configuration, see [Configuration][config]. If you have an issue, run `sudo apt install timescaledb-tools`. 1. **Restart Postgres** ```bash sudo systemctl restart postgresql ``` 1. **Log in to Postgres as `postgres`** ```bash sudo -u postgres psql ``` You are in the psql shell. 1. **Set the password for `postgres`** ```bash \password postgres ``` When you have set the password, type `\q` to exit psql. ===== PAGE: https://docs.tigerdata.com/_partials/_caggs-one-step-policy/ ===== <h2> Use a one-step policy definition to set a {props.policyType} policy on a continuous aggregate </h2> In TimescaleDB 2.8 and above, policy management on continuous aggregates is simplified. You can add, change, or remove the refresh, compression, and data retention policies on a continuous aggregate using a one-step API. For more information, see the APIs for [adding policies][add-policies], [altering policies][alter-policies], and [removing policies][remove-policies]. Note that this feature is experimental. Experimental features could have bugs. They might not be backwards compatible, and could be removed in future releases. Use these features at your own risk, and do not use any experimental features in production. When you change policies with this API, the changes apply to the continuous aggregate, not to the original hypertable. For example, if you use this API to set a retention policy of 20 days, chunks older than 20 days are dropped from the continuous aggregate. The retention policy of the original hypertable remains unchanged. ===== PAGE: https://docs.tigerdata.com/_partials/_start-coding-golang/ ===== ## Prerequisites To follow the steps on this page: * Create a target [Tiger Cloud service][create-service] with the Real-time analytics capability. You need [your connection details][connection-info]. This procedure also works for [self-hosted TimescaleDB][enable-timescaledb]. - Install [Go][golang-install]. - Install the [PGX driver for Go][pgx-driver-github]. ## Connect to your Tiger Cloud service In this section, you create a connection to Tiger Cloud using the PGX driver. PGX is a toolkit designed to help Go developers work directly with Postgres. You can use it to help your Go application interact directly with TimescaleDB. 1. Locate your TimescaleDB credentials and use them to compose a connection string for PGX. You'll need: * password * username * host URL * port number * database name 1. Compose your connection string variable as a [libpq connection string][libpq-docs], using this format: ```go connStr := "postgres://username:password@host:port/dbname" ``` If you're using a hosted version of TimescaleDB, or if you need an SSL connection, use this format instead: ```go connStr := "postgres://username:password@host:port/dbname?sslmode=require" ``` 1. [](#)You can check that you're connected to your database with this hello world program: ```go package main import ( "context" "fmt" "os" "github.com/jackc/pgx/v5" ) //connect to database using a single connection func main() { /***********************************************/ /* Single Connection to TimescaleDB/ PostgreSQL */ /***********************************************/ ctx := context.Background() connStr := "yourConnectionStringHere" conn, err := pgx.Connect(ctx, connStr) if err != nil { fmt.Fprintf(os.Stderr, "Unable to connect to database: %v\n", err) os.Exit(1) } defer conn.Close(ctx) //run a simple query to check our connection var greeting string err = conn.QueryRow(ctx, "select 'Hello, Timescale!'").Scan(&greeting) if err != nil { fmt.Fprintf(os.Stderr, "QueryRow failed: %v\n", err) os.Exit(1) } fmt.Println(greeting) } ``` If you'd like to specify your connection string as an environment variable, you can use this syntax to access it in place of the `connStr` variable: ```go os.Getenv("DATABASE_CONNECTION_STRING") ``` Alternatively, you can connect to TimescaleDB using a connection pool. Connection pooling is useful to conserve computing resources, and can also result in faster database queries: 1. To create a connection pool that can be used for concurrent connections to your database, use the `pgxpool.New()` function instead of `pgx.Connect()`. Also note that this script imports `github.com/jackc/pgx/v5/pgxpool`, instead of `pgx/v5` which was used to create a single connection: ```go package main import ( "context" "fmt" "os" "github.com/jackc/pgx/v5/pgxpool" ) func main() { ctx := context.Background() connStr := "yourConnectionStringHere" dbpool, err := pgxpool.New(ctx, connStr) if err != nil { fmt.Fprintf(os.Stderr, "Unable to connect to database: %v\n", err) os.Exit(1) } defer dbpool.Close() //run a simple query to check our connection var greeting string err = dbpool.QueryRow(ctx, "select 'Hello, Tiger Data (but concurrently)'").Scan(&greeting) if err != nil { fmt.Fprintf(os.Stderr, "QueryRow failed: %v\n", err) os.Exit(1) } fmt.Println(greeting) } ``` ## Create a relational table In this section, you create a table called `sensors` which holds the ID, type, and location of your fictional sensors. Additionally, you create a hypertable called `sensor_data` which holds the measurements of those sensors. The measurements contain the time, sensor_id, temperature reading, and CPU percentage of the sensors. 1. Compose a string that contains the SQL statement to create a relational table. This example creates a table called `sensors`, with columns for ID, type, and location: ```go queryCreateTable := `CREATE TABLE sensors (id SERIAL PRIMARY KEY, type VARCHAR(50), location VARCHAR(50));` ``` 1. Execute the `CREATE TABLE` statement with the `Exec()` function on the `dbpool` object, using the arguments of the current context and the statement string you created: ```go package main import ( "context" "fmt" "os" "github.com/jackc/pgx/v5/pgxpool" ) func main() { ctx := context.Background() connStr := "yourConnectionStringHere" dbpool, err := pgxpool.New(ctx, connStr) if err != nil { fmt.Fprintf(os.Stderr, "Unable to connect to database: %v\n", err) os.Exit(1) } defer dbpool.Close() /********************************************/ /* Create relational table */ /********************************************/ //Create relational table called sensors queryCreateTable := `CREATE TABLE sensors (id SERIAL PRIMARY KEY, type VARCHAR(50), location VARCHAR(50));` _, err = dbpool.Exec(ctx, queryCreateTable) if err != nil { fmt.Fprintf(os.Stderr, "Unable to create SENSORS table: %v\n", err) os.Exit(1) } fmt.Println("Successfully created relational table SENSORS") } ``` ## Generate a hypertable When you have created the relational table, you can create a hypertable. Creating tables and indexes, altering tables, inserting data, selecting data, and most other tasks are executed on the hypertable. 1. Create a variable for the `CREATE TABLE SQL` statement for your hypertable. Notice how the hypertable has the compulsory time column: ```go queryCreateTable := `CREATE TABLE sensor_data ( time TIMESTAMPTZ NOT NULL, sensor_id INTEGER, temperature DOUBLE PRECISION, cpu DOUBLE PRECISION, FOREIGN KEY (sensor_id) REFERENCES sensors (id)); ` ``` 1. Formulate the `SELECT` statement to convert the table into a hypertable. You must specify the table name to convert to a hypertable, and its time column name as the second argument. For more information, see the [`create_hypertable` docs][create-hypertable-docs]: ```go queryCreateHypertable := `SELECT create_hypertable('sensor_data', by_range('time'));` ``` The `by_range` dimension builder is an addition to TimescaleDB 2.13. 1. Execute the `CREATE TABLE` statement and `SELECT` statement which converts the table into a hypertable. You can do this by calling the `Exec()` function on the `dbpool` object, using the arguments of the current context, and the `queryCreateTable` and `queryCreateHypertable` statement strings: ```go package main import ( "context" "fmt" "os" "github.com/jackc/pgx/v5/pgxpool" ) func main() { ctx := context.Background() connStr := "yourConnectionStringHere" dbpool, err := pgxpool.New(ctx, connStr) if err != nil { fmt.Fprintf(os.Stderr, "Unable to connect to database: %v\n", err) os.Exit(1) } defer dbpool.Close() /********************************************/ /* Create Hypertable */ /********************************************/ // Create hypertable of time-series data called sensor_data queryCreateTable := `CREATE TABLE sensor_data ( time TIMESTAMPTZ NOT NULL, sensor_id INTEGER, temperature DOUBLE PRECISION, cpu DOUBLE PRECISION, FOREIGN KEY (sensor_id) REFERENCES sensors (id)); ` queryCreateHypertable := `SELECT create_hypertable('sensor_data', by_range('time'));` //execute statement _, err = dbpool.Exec(ctx, queryCreateTable+queryCreateHypertable) if err != nil { fmt.Fprintf(os.Stderr, "Unable to create the `sensor_data` hypertable: %v\n", err) os.Exit(1) } fmt.Println("Successfully created hypertable `sensor_data`") } ``` ## Insert rows of data You can insert rows into your database in a couple of different ways. Each of these example inserts the data from the two arrays, `sensorTypes` and `sensorLocations`, into the relational table named `sensors`. The first example inserts a single row of data at a time. The second example inserts multiple rows of data. The third example uses batch inserts to speed up the process. 1. Open a connection pool to the database, then use the prepared statements to formulate an `INSERT` SQL statement, and execute it: ```go package main import ( "context" "fmt" "os" "github.com/jackc/pgx/v5/pgxpool" ) func main() { ctx := context.Background() connStr := "yourConnectionStringHere" dbpool, err := pgxpool.New(ctx, connStr) if err != nil { fmt.Fprintf(os.Stderr, "Unable to connect to database: %v\n", err) os.Exit(1) } defer dbpool.Close() /********************************************/ /* INSERT into relational table */ /********************************************/ //Insert data into relational table // Slices of sample data to insert // observation i has type sensorTypes[i] and location sensorLocations[i] sensorTypes := []string{"a", "a", "b", "b"} sensorLocations := []string{"floor", "ceiling", "floor", "ceiling"} for i := range sensorTypes { //INSERT statement in SQL queryInsertMetadata := `INSERT INTO sensors (type, location) VALUES ($1, $2);` //Execute INSERT command _, err := dbpool.Exec(ctx, queryInsertMetadata, sensorTypes[i], sensorLocations[i]) if err != nil { fmt.Fprintf(os.Stderr, "Unable to insert data into database: %v\n", err) os.Exit(1) } fmt.Printf("Inserted sensor (%s, %s) into database \n", sensorTypes[i], sensorLocations[i]) } fmt.Println("Successfully inserted all sensors into database") } ``` Instead of inserting a single row of data at a time, you can use this procedure to insert multiple rows of data, instead: 1. This example uses Postgres to generate some sample time-series to insert into the `sensor_data` hypertable. Define the SQL statement to generate the data, called `queryDataGeneration`. Then use the `.Query()` function to execute the statement and return the sample data. The data returned by the query is stored in `results`, a slice of structs, which is then used as a source to insert data into the hypertable: ```go package main import ( "context" "fmt" "os" "time" "github.com/jackc/pgx/v5/pgxpool" ) func main() { ctx := context.Background() connStr := "yourConnectionStringHere" dbpool, err := pgxpool.New(ctx, connStr) if err != nil { fmt.Fprintf(os.Stderr, "Unable to connect to database: %v\n", err) os.Exit(1) } defer dbpool.Close() // Generate data to insert //SQL query to generate sample data queryDataGeneration := ` SELECT generate_series(now() - interval '24 hour', now(), interval '5 minute') AS time, floor(random() * (3) + 1)::int as sensor_id, random()*100 AS temperature, random() AS cpu ` //Execute query to generate samples for sensor_data hypertable rows, err := dbpool.Query(ctx, queryDataGeneration) if err != nil { fmt.Fprintf(os.Stderr, "Unable to generate sensor data: %v\n", err) os.Exit(1) } defer rows.Close() fmt.Println("Successfully generated sensor data") //Store data generated in slice results type result struct { Time time.Time SensorId int Temperature float64 CPU float64 } var results []result for rows.Next() { var r result err = rows.Scan(&r.Time, &r.SensorId, &r.Temperature, &r.CPU) if err != nil { fmt.Fprintf(os.Stderr, "Unable to scan %v\n", err) os.Exit(1) } results = append(results, r) } // Any errors encountered by rows.Next or rows.Scan are returned here if rows.Err() != nil { fmt.Fprintf(os.Stderr, "rows Error: %v\n", rows.Err()) os.Exit(1) } // Check contents of results slice fmt.Println("Contents of RESULTS slice") for i := range results { var r result r = results[i] fmt.Printf("Time: %s | ID: %d | Temperature: %f | CPU: %f |\n", &r.Time, r.SensorId, r.Temperature, r.CPU) } } ``` 1. Formulate an SQL insert statement for the `sensor_data` hypertable: ```go //SQL query to generate sample data queryInsertTimeseriesData := ` INSERT INTO sensor_data (time, sensor_id, temperature, cpu) VALUES ($1, $2, $3, $4); ` ``` 1. Execute the SQL statement for each sample in the results slice: ```go //Insert contents of results slice into TimescaleDB for i := range results { var r result r = results[i] _, err := dbpool.Exec(ctx, queryInsertTimeseriesData, r.Time, r.SensorId, r.Temperature, r.CPU) if err != nil { fmt.Fprintf(os.Stderr, "Unable to insert sample into TimescaleDB %v\n", err) os.Exit(1) } defer rows.Close() } fmt.Println("Successfully inserted samples into sensor_data hypertable") ``` 1. [](#)This example `main.go` generates sample data and inserts it into the `sensor_data` hypertable: ```go package main import ( "context" "fmt" "os" "time" "github.com/jackc/pgx/v5/pgxpool" ) func main() { /********************************************/ /* Connect using Connection Pool */ /********************************************/ ctx := context.Background() connStr := "yourConnectionStringHere" dbpool, err := pgxpool.New(ctx, connStr) if err != nil { fmt.Fprintf(os.Stderr, "Unable to connect to database: %v\n", err) os.Exit(1) } defer dbpool.Close() /********************************************/ /* Insert data into hypertable */ /********************************************/ // Generate data to insert //SQL query to generate sample data queryDataGeneration := ` SELECT generate_series(now() - interval '24 hour', now(), interval '5 minute') AS time, floor(random() * (3) + 1)::int as sensor_id, random()*100 AS temperature, random() AS cpu ` //Execute query to generate samples for sensor_data hypertable rows, err := dbpool.Query(ctx, queryDataGeneration) if err != nil { fmt.Fprintf(os.Stderr, "Unable to generate sensor data: %v\n", err) os.Exit(1) } defer rows.Close() fmt.Println("Successfully generated sensor data") //Store data generated in slice results type result struct { Time time.Time SensorId int Temperature float64 CPU float64 } var results []result for rows.Next() { var r result err = rows.Scan(&r.Time, &r.SensorId, &r.Temperature, &r.CPU) if err != nil { fmt.Fprintf(os.Stderr, "Unable to scan %v\n", err) os.Exit(1) } results = append(results, r) } // Any errors encountered by rows.Next or rows.Scan are returned here if rows.Err() != nil { fmt.Fprintf(os.Stderr, "rows Error: %v\n", rows.Err()) os.Exit(1) } // Check contents of results slice fmt.Println("Contents of RESULTS slice") for i := range results { var r result r = results[i] fmt.Printf("Time: %s | ID: %d | Temperature: %f | CPU: %f |\n", &r.Time, r.SensorId, r.Temperature, r.CPU) } //Insert contents of results slice into TimescaleDB //SQL query to generate sample data queryInsertTimeseriesData := ` INSERT INTO sensor_data (time, sensor_id, temperature, cpu) VALUES ($1, $2, $3, $4); ` //Insert contents of results slice into TimescaleDB for i := range results { var r result r = results[i] _, err := dbpool.Exec(ctx, queryInsertTimeseriesData, r.Time, r.SensorId, r.Temperature, r.CPU) if err != nil { fmt.Fprintf(os.Stderr, "Unable to insert sample into TimescaleDB %v\n", err) os.Exit(1) } defer rows.Close() } fmt.Println("Successfully inserted samples into sensor_data hypertable") } ``` Inserting multiple rows of data using this method executes as many `insert` statements as there are samples to be inserted. This can make ingestion of data slow. To speed up ingestion, you can batch insert data instead. Here's a sample pattern for how to do so, using the sample data you generated in the previous procedure. It uses the pgx `Batch` object: 1. This example batch inserts data into the database: ```go package main import ( "context" "fmt" "os" "time" "github.com/jackc/pgx/v5" "github.com/jackc/pgx/v5/pgxpool" ) func main() { /********************************************/ /* Connect using Connection Pool */ /********************************************/ ctx := context.Background() connStr := "yourConnectionStringHere" dbpool, err := pgxpool.New(ctx, connStr) if err != nil { fmt.Fprintf(os.Stderr, "Unable to connect to database: %v\n", err) os.Exit(1) } defer dbpool.Close() // Generate data to insert //SQL query to generate sample data queryDataGeneration := ` SELECT generate_series(now() - interval '24 hour', now(), interval '5 minute') AS time, floor(random() * (3) + 1)::int as sensor_id, random()*100 AS temperature, random() AS cpu ` //Execute query to generate samples for sensor_data hypertable rows, err := dbpool.Query(ctx, queryDataGeneration) if err != nil { fmt.Fprintf(os.Stderr, "Unable to generate sensor data: %v\n", err) os.Exit(1) } defer rows.Close() fmt.Println("Successfully generated sensor data") //Store data generated in slice results type result struct { Time time.Time SensorId int Temperature float64 CPU float64 } var results []result for rows.Next() { var r result err = rows.Scan(&r.Time, &r.SensorId, &r.Temperature, &r.CPU) if err != nil { fmt.Fprintf(os.Stderr, "Unable to scan %v\n", err) os.Exit(1) } results = append(results, r) } // Any errors encountered by rows.Next or rows.Scan are returned here if rows.Err() != nil { fmt.Fprintf(os.Stderr, "rows Error: %v\n", rows.Err()) os.Exit(1) } // Check contents of results slice /*fmt.Println("Contents of RESULTS slice") for i := range results { var r result r = results[i] fmt.Printf("Time: %s | ID: %d | Temperature: %f | CPU: %f |\n", &r.Time, r.SensorId, r.Temperature, r.CPU) }*/ //Insert contents of results slice into TimescaleDB //SQL query to generate sample data queryInsertTimeseriesData := ` INSERT INTO sensor_data (time, sensor_id, temperature, cpu) VALUES ($1, $2, $3, $4); ` /********************************************/ /* Batch Insert into TimescaleDB */ /********************************************/ //create batch batch := &pgx.Batch{} //load insert statements into batch queue for i := range results { var r result r = results[i] batch.Queue(queryInsertTimeseriesData, r.Time, r.SensorId, r.Temperature, r.CPU) } batch.Queue("select count(*) from sensor_data") //send batch to connection pool br := dbpool.SendBatch(ctx, batch) //execute statements in batch queue _, err = br.Exec() if err != nil { fmt.Fprintf(os.Stderr, "Unable to execute statement in batch queue %v\n", err) os.Exit(1) } fmt.Println("Successfully batch inserted data") //Compare length of results slice to size of table fmt.Printf("size of results: %d\n", len(results)) //check size of table for number of rows inserted // result of last SELECT statement var rowsInserted int err = br.QueryRow().Scan(&rowsInserted) fmt.Printf("size of table: %d\n", rowsInserted) err = br.Close() if err != nil { fmt.Fprintf(os.Stderr, "Unable to closer batch %v\n", err) os.Exit(1) } } ``` ## Execute a query This section covers how to execute queries against your database. 1. Define the SQL query you'd like to run on the database. This example uses a SQL query that combines time-series and relational data. It returns the average CPU values for every 5 minute interval, for sensors located on location `ceiling` and of type `a`: ```go // Formulate query in SQL // Note the use of prepared statement placeholders $1 and $2 queryTimebucketFiveMin := ` SELECT time_bucket('5 minutes', time) AS five_min, avg(cpu) FROM sensor_data JOIN sensors ON sensors.id = sensor_data.sensor_id WHERE sensors.location = $1 AND sensors.type = $2 GROUP BY five_min ORDER BY five_min DESC; ` ``` 1. Use the `.Query()` function to execute the query string. Make sure you specify the relevant placeholders: ```go //Execute query on TimescaleDB rows, err := dbpool.Query(ctx, queryTimebucketFiveMin, "ceiling", "a") if err != nil { fmt.Fprintf(os.Stderr, "Unable to execute query %v\n", err) os.Exit(1) } defer rows.Close() fmt.Println("Successfully executed query") ``` 1. Access the rows returned by `.Query()`. Create a struct with fields representing the columns that you expect to be returned, then use the `rows.Next()` function to iterate through the rows returned and fill `results` with the array of structs. This uses the `rows.Scan()` function, passing in pointers to the fields that you want to scan for results. This example prints out the results returned from the query, but you might want to use those results for some other purpose. Once you've scanned through all the rows returned you can then use the results array however you like. ```go //Do something with the results of query // Struct for results type result2 struct { Bucket time.Time Avg float64 } // Print rows returned and fill up results slice for later use var results []result2 for rows.Next() { var r result2 err = rows.Scan(&r.Bucket, &r.Avg) if err != nil { fmt.Fprintf(os.Stderr, "Unable to scan %v\n", err) os.Exit(1) } results = append(results, r) fmt.Printf("Time bucket: %s | Avg: %f\n", &r.Bucket, r.Avg) } // Any errors encountered by rows.Next or rows.Scan are returned here if rows.Err() != nil { fmt.Fprintf(os.Stderr, "rows Error: %v\n", rows.Err()) os.Exit(1) } // use results here… ``` 1. [](#)This example program runs a query, and accesses the results of that query: ```go package main import ( "context" "fmt" "os" "time" "github.com/jackc/pgx/v5/pgxpool" ) func main() { ctx := context.Background() connStr := "yourConnectionStringHere" dbpool, err := pgxpool.New(ctx, connStr) if err != nil { fmt.Fprintf(os.Stderr, "Unable to connect to database: %v\n", err) os.Exit(1) } defer dbpool.Close() /********************************************/ /* Execute a query */ /********************************************/ // Formulate query in SQL // Note the use of prepared statement placeholders $1 and $2 queryTimebucketFiveMin := ` SELECT time_bucket('5 minutes', time) AS five_min, avg(cpu) FROM sensor_data JOIN sensors ON sensors.id = sensor_data.sensor_id WHERE sensors.location = $1 AND sensors.type = $2 GROUP BY five_min ORDER BY five_min DESC; ` //Execute query on TimescaleDB rows, err := dbpool.Query(ctx, queryTimebucketFiveMin, "ceiling", "a") if err != nil { fmt.Fprintf(os.Stderr, "Unable to execute query %v\n", err) os.Exit(1) } defer rows.Close() fmt.Println("Successfully executed query") //Do something with the results of query // Struct for results type result2 struct { Bucket time.Time Avg float64 } // Print rows returned and fill up results slice for later use var results []result2 for rows.Next() { var r result2 err = rows.Scan(&r.Bucket, &r.Avg) if err != nil { fmt.Fprintf(os.Stderr, "Unable to scan %v\n", err) os.Exit(1) } results = append(results, r) fmt.Printf("Time bucket: %s | Avg: %f\n", &r.Bucket, r.Avg) } // Any errors encountered by rows.Next or rows.Scan are returned here if rows.Err() != nil { fmt.Fprintf(os.Stderr, "rows Error: %v\n", rows.Err()) os.Exit(1) } } ``` ## Next steps Now that you're able to connect, read, and write to a TimescaleDB instance from your Go application, be sure to check out these advanced TimescaleDB tutorials: * Refer to the [pgx documentation][pgx-docs] for more information about pgx. * Get up and running with TimescaleDB with the [Getting Started][getting-started] tutorial. * Want fast inserts on CSV data? Check out [TimescaleDB parallel copy][parallel-copy-tool], a tool for fast inserts, written in Go. ===== PAGE: https://docs.tigerdata.com/_partials/_start-coding-python/ ===== ## Prerequisites To follow the steps on this page: * Create a target [Tiger Cloud service][create-service] with the Real-time analytics capability. You need [your connection details][connection-info]. This procedure also works for [self-hosted TimescaleDB][enable-timescaledb]. * Install the `psycopg2` library. For more information, see the [psycopg2 documentation][psycopg2-docs]. * Create a [Python virtual environment][virtual-env]. [](#) ## Connect to TimescaleDB In this section, you create a connection to TimescaleDB using the `psycopg2` library. This library is one of the most popular Postgres libraries for Python. It allows you to execute raw SQL queries efficiently and safely, and prevents common attacks such as SQL injection. 1. Import the psycogpg2 library: ```python import psycopg2 ``` 1. Locate your TimescaleDB credentials and use them to compose a connection string for `psycopg2`. You'll need: * password * username * host URL * port * database name 1. Compose your connection string variable as a [libpq connection string][pg-libpq-string], using this format: ```python CONNECTION = "postgres://username:password@host:port/dbname" ``` If you're using a hosted version of TimescaleDB, or generally require an SSL connection, use this version instead: ```python CONNECTION = "postgres://username:password@host:port/dbname?sslmode=require" ``` Alternatively you can specify each parameter in the connection string as follows ```python CONNECTION = "dbname=tsdb user=tsdbadmin password=secret host=host.com port=5432 sslmode=require" ``` This method of composing a connection string is for test or development purposes only. For production, use environment variables for sensitive details like your password, hostname, and port number. 1. Use the `psycopg2` [connect function][psycopg2-connect] to create a new database session and create a new [cursor object][psycopg2-cursor] to interact with the database. In your `main` function, add these lines: ```python CONNECTION = "postgres://username:password@host:port/dbname" with psycopg2.connect(CONNECTION) as conn: cursor = conn.cursor() # use the cursor to interact with your database # cursor.execute("SELECT * FROM table") ``` Alternatively, you can create a connection object and pass the object around as needed, like opening a cursor to perform database operations: ```python CONNECTION = "postgres://username:password@host:port/dbname" conn = psycopg2.connect(CONNECTION) cursor = conn.cursor() # use the cursor to interact with your database cursor.execute("SELECT 'hello world'") print(cursor.fetchone()) ``` ## Create a relational table In this section, you create a table called `sensors` which holds the ID, type, and location of your fictional sensors. Additionally, you create a hypertable called `sensor_data` which holds the measurements of those sensors. The measurements contain the time, sensor_id, temperature reading, and CPU percentage of the sensors. 1. Compose a string which contains the SQL statement to create a relational table. This example creates a table called `sensors`, with columns `id`, `type` and `location`: ```python query_create_sensors_table = """CREATE TABLE sensors ( id SERIAL PRIMARY KEY, type VARCHAR(50), location VARCHAR(50) ); """ ``` 1. Open a cursor, execute the query you created in the previous step, and commit the query to make the changes persistent. Afterward, close the cursor to clean up: ```python cursor = conn.cursor() # see definition in Step 1 cursor.execute(query_create_sensors_table) conn.commit() cursor.close() ``` ## Create a hypertable When you have created the relational table, you can create a hypertable. Creating tables and indexes, altering tables, inserting data, selecting data, and most other tasks are executed on the hypertable. 1. Create a string variable that contains the `CREATE TABLE` SQL statement for your hypertable. Notice how the hypertable has the compulsory time column: ```python # create sensor data hypertable query_create_sensordata_table = """CREATE TABLE sensor_data ( time TIMESTAMPTZ NOT NULL, sensor_id INTEGER, temperature DOUBLE PRECISION, cpu DOUBLE PRECISION, FOREIGN KEY (sensor_id) REFERENCES sensors (id) ); """ ``` 2. Formulate a `SELECT` statement that converts the `sensor_data` table to a hypertable. You must specify the table name to convert to a hypertable, and the name of the time column as the two arguments. For more information, see the [`create_hypertable` docs][create-hypertable-docs]: ```python query_create_sensordata_hypertable = "SELECT create_hypertable('sensor_data', by_range('time'));" ``` The `by_range` dimension builder is an addition to TimescaleDB 2.13. 3. Open a cursor with the connection, execute the statements from the previous steps, commit your changes, and close the cursor: ```python cursor = conn.cursor() cursor.execute(query_create_sensordata_table) cursor.execute(query_create_sensordata_hypertable) # commit changes to the database to make changes persistent conn.commit() cursor.close() ``` ## Insert rows of data You can insert data into your hypertables in several different ways. In this section, you can use `psycopg2` with prepared statements, or you can use `pgcopy` for a faster insert. 1. This example inserts a list of tuples, or relational data, called `sensors`, into the relational table named `sensors`. Open a cursor with a connection to the database, use prepared statements to formulate the `INSERT` SQL statement, and then execute that statement: ```python sensors = [('a', 'floor'), ('a', 'ceiling'), ('b', 'floor'), ('b', 'ceiling')] cursor = conn.cursor() for sensor in sensors: try: cursor.execute("INSERT INTO sensors (type, location) VALUES (%s, %s);", (sensor[0], sensor[1])) except (Exception, psycopg2.Error) as error: print(error.pgerror) conn.commit() ``` 1. [](#)Alternatively, you can pass variables to the `cursor.execute` function and separate the formulation of the SQL statement, `SQL`, from the data being passed with it into the prepared statement, `data`: ```python SQL = "INSERT INTO sensors (type, location) VALUES (%s, %s);" sensors = [('a', 'floor'), ('a', 'ceiling'), ('b', 'floor'), ('b', 'ceiling')] cursor = conn.cursor() for sensor in sensors: try: data = (sensor[0], sensor[1]) cursor.execute(SQL, data) except (Exception, psycopg2.Error) as error: print(error.pgerror) conn.commit() ``` If you choose to use `pgcopy` instead, install the `pgcopy` package [using pip][pgcopy-install], and then add this line to your list of `import` statements:python from pgcopy import CopyManager
1. Generate some random sensor data using the `generate_series` function provided by Postgres. This example inserts a total of 480 rows of data (4 readings, every 5 minutes, for 24 hours). In your application, this would be the query that saves your time-series data into the hypertable: ```python # for sensors with ids 1-4 for id in range(1, 4, 1): data = (id,) # create random data simulate_query = """SELECT generate_series(now() - interval '24 hour', now(), interval '5 minute') AS time, %s as sensor_id, random()*100 AS temperature, random() AS cpu; """ cursor.execute(simulate_query, data) values = cursor.fetchall() ``` 1. Define the column names of the table you want to insert data into. This example uses the `sensor_data` hypertable created earlier. This hypertable consists of columns named `time`, `sensor_id`, `temperature` and `cpu`. The column names are defined in a list of strings called `cols`: ```python cols = ['time', 'sensor_id', 'temperature', 'cpu'] ``` 1. Create an instance of the `pgcopy` CopyManager, `mgr`, and pass the connection variable, hypertable name, and list of column names. Then use the `copy` function of the CopyManager to insert the data into the database quickly using `pgcopy`. ```python mgr = CopyManager(conn, 'sensor_data', cols) mgr.copy(values) ``` 1. Commit to persist changes: ```python conn.commit() ``` 1. [](#)The full sample code to insert data into TimescaleDB using `pgcopy`, using the example of sensor data from four sensors: ```python # insert using pgcopy def fast_insert(conn): cursor = conn.cursor() # for sensors with ids 1-4 for id in range(1, 4, 1): data = (id,) # create random data simulate_query = """SELECT generate_series(now() - interval '24 hour', now(), interval '5 minute') AS time, %s as sensor_id, random()*100 AS temperature, random() AS cpu; """ cursor.execute(simulate_query, data) values = cursor.fetchall() # column names of the table you're inserting into cols = ['time', 'sensor_id', 'temperature', 'cpu'] # create copy manager with the target table and insert mgr = CopyManager(conn, 'sensor_data', cols) mgr.copy(values) # commit after all sensor data is inserted # could also commit after each sensor insert is done conn.commit() ``` 1. [](#)You can also check if the insertion worked: ```python cursor.execute("SELECT * FROM sensor_data LIMIT 5;") print(cursor.fetchall()) ``` ## Execute a query This section covers how to execute queries against your database. The first procedure shows a simple `SELECT *` query. For more complex queries, you can use prepared statements to ensure queries are executed safely against the database. For more information about properly using placeholders in `psycopg2`, see the [basic module usage document][psycopg2-docs-basics]. For more information about how to execute more complex queries in `psycopg2`, see the [psycopg2 documentation][psycopg2-docs-basics]. ### Execute a query 1. Define the SQL query you'd like to run on the database. This example is a simple `SELECT` statement querying each row from the previously created `sensor_data` table. ```python query = "SELECT * FROM sensor_data;" ``` 1. Open a cursor from the existing database connection, `conn`, and then execute the query you defined: ```python cursor = conn.cursor() query = "SELECT * FROM sensor_data;" cursor.execute(query) ``` 1. To access all resulting rows returned by your query, use one of `pyscopg2`'s [results retrieval methods][results-retrieval-methods], such as `fetchall()` or `fetchmany()`. This example prints the results of the query, row by row. Note that the result of `fetchall()` is a list of tuples, so you can handle them accordingly: ```python cursor = conn.cursor() query = "SELECT * FROM sensor_data;" cursor.execute(query) for row in cursor.fetchall(): print(row) cursor.close() ``` 1. [](#)If you want a list of dictionaries instead, you can define the cursor using [`DictCursor`][dictcursor-docs]: ```python cursor = conn.cursor(cursor_factory=psycopg2.extras.DictCursor) ``` Using this cursor, `cursor.fetchall()` returns a list of dictionary-like objects. For more complex queries, you can use prepared statements to ensure queries are executed safely against the database. ### Execute queries using prepared statements 1. Write the query using prepared statements: ```python # query with placeholders cursor = conn.cursor() query = """ SELECT time_bucket('5 minutes', time) AS five_min, avg(cpu) FROM sensor_data JOIN sensors ON sensors.id = sensor_data.sensor_id WHERE sensors.location = %s AND sensors.type = %s GROUP BY five_min ORDER BY five_min DESC; """ location = "floor" sensor_type = "a" data = (location, sensor_type) cursor.execute(query, data) results = cursor.fetchall() ``` ===== PAGE: https://docs.tigerdata.com/_partials/_migrate_pg_dump_do_not_recommend_for_large_migration/ ===== If you want to migrate more than 400GB of data, create a [Tiger Cloud Console support request](https://console.cloud.timescale.com/dashboard/support), or send us an email at [support@tigerdata.com](mailto:support@tigerdata.com) saying how much data you want to migrate. We pre-provision your Tiger Cloud service for you. ===== PAGE: https://docs.tigerdata.com/_partials/_livesync-console/ ===== ## Prerequisites To follow the steps on this page: * Create a target [Tiger Cloud service][create-service] with real-time analytics enabled. You need your [connection details][connection-info]. - Install the [Postgres client tools][install-psql] on your sync machine. - Ensure that the source Postgres instance and the target Tiger Cloud service have the same extensions installed. The source Postgres connector does not create extensions on the target. If the table uses column types from an extension, first create the extension on the target Tiger Cloud service before syncing the table. ## Limitations * The source Postgres instance must be accessible from the Internet. Services hosted behind a firewall or VPC are not supported. This functionality is on the roadmap. * Indexes, including the primary key and unique constraints, are not migrated to the target Tiger Cloud service. We recommend that, depending on your query patterns, you create only the necessary indexes on the target Tiger Cloud service. * This works for Postgres databases only as source. TimescaleDB is not yet supported. * The source must be running Postgres 13 or later. * Schema changes must be co-ordinated. Make compatible changes to the schema in your Tiger Cloud service first, then make the same changes to the source Postgres instance. * Ensure that the source Postgres instance and the target Tiger Cloud service have the same extensions installed. The source Postgres connector does not create extensions on the target. If the table uses column types from an extension, first create the extension on the target Tiger Cloud service before syncing the table. * There is WAL volume growth on the source Postgres instance during large table copy. * Continuous aggregate invalidation The connector uses `session_replication_role=replica` during data replication, which prevents table triggers from firing. This includes the internal triggers that mark continuous aggregates as invalid when underlying data changes. If you have continuous aggregates on your target database, they do not automatically refresh for data inserted during the migration. This limitation only applies to data below the continuous aggregate's materialization watermark. For example, backfilled data. New rows synced above the continuous aggregate watermark are used correctly when refreshing. This can lead to: - Missing data in continuous aggregates for the migration period. - Stale aggregate data. - Queries returning incomplete results. If the continuous aggregate exists in the source database, best practice is to add it to the Postgres connector publication. If it only exists on the target database, manually refresh the continuous aggregate using the `force` option of [refresh_continuous_aggregate][refresh-caggs]. ## Set your connection string This variable holds the connection information for the source database. In the terminal on your migration machine, set the following:bash export SOURCE="postgres://:@:/"
Avoid using connection strings that route through connection poolers like PgBouncer or similar tools. This tool requires a direct connection to the database to function properly. ## Tune your source database Updating parameters on a Postgres instance will cause an outage. Choose a time that will cause the least issues to tune this database. 1. **Tune the Write Ahead Log (WAL) on the RDS/Aurora Postgres source database** 1. In [https://console.aws.amazon.com/rds/home#databases:][databases], select the RDS instance to migrate. 1. Click `Configuration`, scroll down and note the `DB instance parameter group`, then click `Parameter Groups` <img class="main-content__illustration" src="https://assets.timescale.com/docs/images/migrate/awsrds-parameter-groups.png" alt="Create security rule to enable RDS EC2 connection"/> 1. Click `Create parameter group`, fill in the form with the following values, then click `Create`. - **Parameter group name** - whatever suits your fancy. - **Description** - knock yourself out with this one. - **Engine type** - `PostgreSQL` - **Parameter group family** - the same as `DB instance parameter group` in your `Configuration`. 1. In `Parameter groups`, select the parameter group you created, then click `Edit`. 1. Update the following parameters, then click `Save changes`. - `rds.logical_replication` set to `1`: record the information needed for logical decoding. - `wal_sender_timeout` set to `0`: disable the timeout for the sender process. 1. In RDS, navigate back to your [databases][databases], select the RDS instance to migrate, and click `Modify`. 1. Scroll down to `Database options`, select your new parameter group, and click `Continue`. 1. Click `Apply immediately` or choose a maintenance window, then click `Modify DB instance`. Changing parameters will cause an outage. Wait for the database instance to reboot before continuing. 1. Verify that the settings are live in your database. 1. **Create a user for the source Postgres connector and assign permissions** 1. Create `<pg connector username>`: ```sql psql source -c "CREATE USER <pg connector username> PASSWORD '<password>'" ``` You can use an existing user. However, you must ensure that the user has the following permissions. 1. Grant permissions to create a replication slot: ```sql psql source -c "GRANT rds_replication TO <pg connector username>" ``` 1. Grant permissions to create a publication: ```sql psql source -c "GRANT CREATE ON DATABASE <database name> TO <pg connector username>" ``` 1. Assign the user permissions on the source database: ```sql psql source <<EOF GRANT USAGE ON SCHEMA "public" TO <pg connector username>; GRANT SELECT ON ALL TABLES IN SCHEMA "public" TO <pg connector username>; ALTER DEFAULT PRIVILEGES IN SCHEMA "public" GRANT SELECT ON TABLES TO <pg connector username>; EOF ``` If the tables you are syncing are not in the `public` schema, grant the user permissions for each schema you are syncing: ```sql psql source <<EOF GRANT USAGE ON SCHEMA <schema> TO <pg connector username>; GRANT SELECT ON ALL TABLES IN SCHEMA <schema> TO <pg connector username>; ALTER DEFAULT PRIVILEGES IN SCHEMA <schema> GRANT SELECT ON TABLES TO <pg connector username>; EOF ``` 1. On each table you want to sync, make `<pg connector username>` the owner: ```sql psql source -c 'ALTER TABLE OWNER TO <pg connector username>;' ``` You can skip this step if the replicating user is already the owner of the tables. 1. **Enable replication `DELETE` and`UPDATE` operations** Replica identity assists data replication by identifying the rows being modified. Your options are that each table and hypertable in the source database should either have: - **A primary key**: data replication defaults to the primary key of the table being replicated. Nothing to do. - **A viable unique index**: each table has a unique, non-partial, non-deferrable index that includes only columns marked as `NOT NULL`. If a UNIQUE index does not exist, create one to assist the migration. You can delete if after migration. For each table, set `REPLICA IDENTITY` to the viable unique index:shell psql -X -d source -c 'ALTER TABLE REPLICA IDENTITY USING INDEX <_index_name>'
- **No primary key or viable unique index**: use brute force. For each table, set `REPLICA IDENTITY` to `FULL`:shell psql -X -d source -c 'ALTER TABLE {table_name} REPLICA IDENTITY FULL'
For each `UPDATE` or `DELETE` statement, Postgres reads the whole table to find all matching rows. This results in significantly slower replication. If you are expecting a large number of `UPDATE` or `DELETE` operations on the table, best practice is to not use `FULL`. 1. **Tune the Write Ahead Log (WAL) on the Postgres source database**sql psql source <<EOF ALTER SYSTEM SET wal_level='logical'; ALTER SYSTEM SET max_wal_senders=10; ALTER SYSTEM SET wal_sender_timeout=0; EOF
* [GUC “wal_level” as “logical”](https://www.postgresql.org/docs/current/runtime-config-wal.html#GUC-WAL-LEVEL) * [GUC “max_wal_senders” as 10](https://www.postgresql.org/docs/current/runtime-config-replication.html#GUC-MAX-WAL-SENDERS) * [GUC “wal_sender_timeout” as 0](https://www.postgresql.org/docs/current/runtime-config-replication.html#GUC-WAL-SENDER-TIMEOUT) This will require a restart of the Postgres source database. 1. **Create a user for the connector and assign permissions** 1. Create `<pg connector username>`: ```sql psql source -c "CREATE USER <pg connector username> PASSWORD '<password>'" ``` You can use an existing user. However, you must ensure that the user has the following permissions. 1. Grant permissions to create a replication slot: ```sql psql source -c "ALTER ROLE <pg connector username> REPLICATION" ``` 1. Grant permissions to create a publication: ```sql psql source -c "GRANT CREATE ON DATABASE <database name> TO <pg connector username>" ``` 1. Assign the user permissions on the source database: ```sql psql source <<EOF GRANT USAGE ON SCHEMA "public" TO <pg connector username>; GRANT SELECT ON ALL TABLES IN SCHEMA "public" TO <pg connector username>; ALTER DEFAULT PRIVILEGES IN SCHEMA "public" GRANT SELECT ON TABLES TO <pg connector username>; EOF ``` If the tables you are syncing are not in the `public` schema, grant the user permissions for each schema you are syncing: ```sql psql source <<EOF GRANT USAGE ON SCHEMA <schema> TO <pg connector username>; GRANT SELECT ON ALL TABLES IN SCHEMA <schema> TO <pg connector username>; ALTER DEFAULT PRIVILEGES IN SCHEMA <schema> GRANT SELECT ON TABLES TO <pg connector username>; EOF ``` 1. On each table you want to sync, make `<pg connector username>` the owner: ```sql psql source -c 'ALTER TABLE OWNER TO <pg connector username>;' ``` You can skip this step if the replicating user is already the owner of the tables. 1. **Enable replication `DELETE` and`UPDATE` operations** Replica identity assists data replication by identifying the rows being modified. Your options are that each table and hypertable in the source database should either have: - **A primary key**: data replication defaults to the primary key of the table being replicated. Nothing to do. - **A viable unique index**: each table has a unique, non-partial, non-deferrable index that includes only columns marked as `NOT NULL`. If a UNIQUE index does not exist, create one to assist the migration. You can delete if after migration. For each table, set `REPLICA IDENTITY` to the viable unique index:shell psql -X -d source -c 'ALTER TABLE REPLICA IDENTITY USING INDEX <_index_name>'
- **No primary key or viable unique index**: use brute force. For each table, set `REPLICA IDENTITY` to `FULL`:shell psql -X -d source -c 'ALTER TABLE {table_name} REPLICA IDENTITY FULL'
For each `UPDATE` or `DELETE` statement, Postgres reads the whole table to find all matching rows. This results in significantly slower replication. If you are expecting a large number of `UPDATE` or `DELETE` operations on the table, best practice is to not use `FULL`. ## Synchronize data to your Tiger Cloud service To sync data from your Postgres database to your Tiger Cloud service using Tiger Cloud Console: 1. **Connect to your Tiger Cloud service** In [Tiger Cloud Console][portal-ops-mode], select the service to sync live data to. 1. **Connect the source database and the target service**  1. Click `Connectors` > `PostgreSQL`. 1. Set the name for the new connector by clicking the pencil icon. 1. Check the boxes for `Set wal_level to logical` and `Update your credentials`, then click `Continue`. 1. Enter your database credentials or a Postgres connection string, then click `Connect to database`. This is the connection string for [`<pg connector username>`][livesync-tune-source-db]. Tiger Cloud Console connects to the source database and retrieves the schema information. 1. **Optimize the data to synchronize in hypertables**  1. In the `Select table` dropdown, select the tables to sync. 1. Click `Select tables +` . Tiger Cloud Console checks the table schema and, if possible, suggests the column to use as the time dimension in a hypertable. 1. Click `Create Connector`. Tiger Cloud Console starts source Postgres connector between the source database and the target service and displays the progress. 1. **Monitor synchronization**  1. To view the amount of data replicated, click `Connectors`. The diagram in `Connector data flow` gives you an overview of the connectors you have created, their status, and how much data has been replicated. 1. To review the syncing progress for each table, click `Connectors` > `Source connectors`, then select the name of your connector in the table. 1. **Manage the connector**  1. To edit the connector, click `Connectors` > `Source connectors`, then select the name of your connector in the table. You can rename the connector, delete or add new tables for syncing. 1. To pause a connector, click `Connectors` > `Source connectors`, then open the three-dot menu on the right and select `Pause`. 1. To delete a connector, click `Connectors` > `Source connectors`, then open the three-dot menu on the right and select `Delete`. You must pause the connector before deleting it. And that is it, you are using the source Postgres connector to synchronize all the data, or specific tables, from a Postgres database instance to your Tiger Cloud service, in real time. ===== PAGE: https://docs.tigerdata.com/_partials/_2-step-aggregation/ ===== This group of functions uses the two-step aggregation pattern. Rather than calculating the final result in one step, you first create an intermediate aggregate by using the aggregate function. Then, use any of the accessors on the intermediate aggregate to calculate a final result. You can also roll up multiple intermediate aggregates with the rollup functions. The two-step aggregation pattern has several advantages: 1. More efficient because multiple accessors can reuse the same aggregate 1. Easier to reason about performance, because aggregation is separate from final computation 1. Easier to understand when calculations can be rolled up into larger intervals, especially in window functions and [continuous aggregates][caggs] 1. Can perform retrospective analysis even when underlying data is dropped, because the intermediate aggregate stores extra information not available in the final result To learn more, see the [blog post on two-step aggregates][blog-two-step-aggregates]. ===== PAGE: https://docs.tigerdata.com/_partials/_timescaledb-gucs/ ===== | Name | Type | Default | Description | | -- | -- | -- | -- | --------------------------------------------------------------------------------------------------------------------------------------------------------------------------------------------------------------------------| | `GUC_CAGG_HIGH_WORK_MEM_NAME` | `INTEGER` | `GUC_CAGG_HIGH_WORK_MEM_VALUE` | The high working memory limit for the continuous aggregate invalidation processing.<br />min: `64`, max: `MAX_KILOBYTES` | | `GUC_CAGG_LOW_WORK_MEM_NAME` | `INTEGER` | `GUC_CAGG_LOW_WORK_MEM_VALUE` | The low working memory limit for the continuous aggregate invalidation processing.<br />min: `64`, max: `MAX_KILOBYTES` | | `auto_sparse_indexes` | `BOOLEAN` | `true` | The hypertable columns that are used as index keys will have suitable sparse indexes when compressed. Must be set at the moment of chunk compression, e.g. when the `compress_chunk()` is called. | | `bgw_log_level` | `ENUM` | `WARNING` | Log level for the scheduler and workers of the background worker subsystem. Requires configuration reload to change. | | `cagg_processing_wal_batch_size` | `INTEGER` | `10000` | Number of entries processed from the WAL at a go. Larger values take more memory but might be more efficient.<br />min: `1000`, max: `10000000` | | `compress_truncate_behaviour` | `ENUM` | `COMPRESS_TRUNCATE_ONLY` | Defines how truncate behaves at the end of compression. 'truncate_only' forces truncation. 'truncate_disabled' deletes rows instead of truncate. 'truncate_or_delete' allows falling back to deletion. | | `compression_batch_size_limit` | `INTEGER` | `1000` | Setting this option to a number between 1 and 999 will force compression to limit the size of compressed batches to that amount of uncompressed tuples.Setting this to 0 defaults to the max batch size of 1000.<br />min: `1`, max: `1000` | | `compression_orderby_default_function` | `STRING` | `"_timescaledb_functions.get_orderby_defaults"` | Function to use for calculating default order_by setting for compression | | `compression_segmentby_default_function` | `STRING` | `"_timescaledb_functions.get_segmentby_defaults"` | Function to use for calculating default segment_by setting for compression | | `current_timestamp_mock` | `STRING` | `NULL` | this is for debugging purposes | | `debug_allow_cagg_with_deprecated_funcs` | `BOOLEAN` | `false` | this is for debugging/testing purposes | | `debug_bgw_scheduler_exit_status` | `INTEGER` | `0` | this is for debugging purposes<br />min: `0`, max: `255` | | `debug_compression_path_info` | `BOOLEAN` | `false` | this is for debugging/information purposes | | `debug_have_int128` | `BOOLEAN` | `#ifdef HAVE_INT128 true` | this is for debugging purposes | | `debug_require_batch_sorted_merge` | `ENUM` | `DRO_Allow` | this is for debugging purposes | | `debug_require_vector_agg` | `ENUM` | `DRO_Allow` | this is for debugging purposes | | `debug_require_vector_qual` | `ENUM` | `DRO_Allow` | this is for debugging purposes, to let us check if the vectorized quals are used or not. EXPLAIN differs after PG15 for custom nodes, and using the test templates is a pain | | `debug_skip_scan_info` | `BOOLEAN` | `false` | Print debug info about SkipScan distinct columns | | `debug_toast_tuple_target` | `INTEGER` | `/* bootValue = */ 128` | this is for debugging purposes<br />min: `/* minValue = */ 1`, max: `/* maxValue = */ 65535` | | `enable_bool_compression` | `BOOLEAN` | `true` | Enable bool compression | | `enable_bulk_decompression` | `BOOLEAN` | `true` | Increases throughput of decompression, but might increase query memory usage | | `enable_cagg_reorder_groupby` | `BOOLEAN` | `true` | Enable group by clause reordering for continuous aggregates | | `enable_cagg_sort_pushdown` | `BOOLEAN` | `true` | Enable pushdown of ORDER BY clause for continuous aggregates | | `enable_cagg_watermark_constify` | `BOOLEAN` | `true` | Enable constifying cagg watermark for real-time caggs | | `enable_cagg_window_functions` | `BOOLEAN` | `false` | Allow window functions in continuous aggregate views | | `enable_chunk_append` | `BOOLEAN` | `true` | Enable using chunk append node | | `enable_chunk_skipping` | `BOOLEAN` | `false` | Enable using chunk column stats to filter chunks based on column filters | | `enable_chunkwise_aggregation` | `BOOLEAN` | `true` | Enable the pushdown of aggregations to the chunk level | | `enable_columnarscan` | `BOOLEAN` | `true` | A columnar scan replaces sequence scans for columnar-oriented storage and enables storage-specific optimizations like vectorized filters. Disabling columnar scan will make PostgreSQL fall back to regular sequence scans. | | `enable_compressed_direct_batch_delete` | `BOOLEAN` | `true` | Enable direct batch deletion in compressed chunks | | `enable_compressed_skipscan` | `BOOLEAN` | `true` | Enable SkipScan for distinct inputs over compressed chunks | | `enable_compression_indexscan` | `BOOLEAN` | `false` | Enable indexscan during compression, if matching index is found | | `enable_compression_ratio_warnings` | `BOOLEAN` | `true` | Enable warnings for poor compression ratio | | `enable_compression_wal_markers` | `BOOLEAN` | `true` | Enable the generation of markers in the WAL stream which mark the start and end of compression operations | | `enable_compressor_batch_limit` | `BOOLEAN` | `false` | Enable compressor batch limit for compressors which can go over the allocation limit (1 GB). This feature willlimit those compressors by reducing the size of the batch and thus avoid hitting the limit. | | `enable_constraint_aware_append` | `BOOLEAN` | `true` | Enable constraint exclusion at execution time | | `enable_constraint_exclusion` | `BOOLEAN` | `true` | Enable planner constraint exclusion | | `enable_custom_hashagg` | `BOOLEAN` | `false` | Enable creating custom hash aggregation plans | | `enable_decompression_sorted_merge` | `BOOLEAN` | `true` | Enable the merge of compressed batches to preserve the compression order by | | `enable_delete_after_compression` | `BOOLEAN` | `false` | Delete all rows after compression instead of truncate | | `enable_deprecation_warnings` | `BOOLEAN` | `true` | Enable warnings when using deprecated functionality | | `enable_direct_compress_copy` | `BOOLEAN` | `false` | Enable experimental support for direct compression during COPY | | `enable_direct_compress_copy_client_sorted` | `BOOLEAN` | `false` | Correct handling of data sorting by the user is required for this option. | | `enable_direct_compress_copy_sort_batches` | `BOOLEAN` | `true` | Enable batch sorting during direct compress COPY | | `enable_dml_decompression` | `BOOLEAN` | `true` | Enable DML decompression when modifying compressed hypertable | | `enable_dml_decompression_tuple_filtering` | `BOOLEAN` | `true` | Recheck tuples during DML decompression to only decompress batches with matching tuples | | `enable_event_triggers` | `BOOLEAN` | `false` | Enable event triggers for chunks creation | | `enable_exclusive_locking_recompression` | `BOOLEAN` | `false` | Enable getting exclusive lock on chunk during segmentwise recompression | | `enable_foreign_key_propagation` | `BOOLEAN` | `true` | Adjust foreign key lookup queries to target whole hypertable | | `enable_job_execution_logging` | `BOOLEAN` | `false` | Retain job run status in logging table | | `enable_merge_on_cagg_refresh` | `BOOLEAN` | `false` | Enable MERGE statement on cagg refresh | | `enable_multikey_skipscan` | `BOOLEAN` | `true` | Enable SkipScan for multiple distinct inputs | | `enable_now_constify` | `BOOLEAN` | `true` | Enable constifying now() in query constraints | | `enable_null_compression` | `BOOLEAN` | `true` | Enable null compression | | `enable_optimizations` | `BOOLEAN` | `true` | Enable TimescaleDB query optimizations | | `enable_ordered_append` | `BOOLEAN` | `true` | Enable ordered append optimization for queries that are ordered by the time dimension | | `enable_parallel_chunk_append` | `BOOLEAN` | `true` | Enable using parallel aware chunk append node | | `enable_qual_propagation` | `BOOLEAN` | `true` | Enable propagation of qualifiers in JOINs | | `enable_rowlevel_compression_locking` | `BOOLEAN` | `false` | Use only if you know what you are doing | | `enable_runtime_exclusion` | `BOOLEAN` | `true` | Enable runtime chunk exclusion in ChunkAppend node | | `enable_segmentwise_recompression` | `BOOLEAN` | `true` | Enable segmentwise recompression | | `enable_skipscan` | `BOOLEAN` | `true` | Enable SkipScan for DISTINCT queries | | `enable_skipscan_for_distinct_aggregates` | `BOOLEAN` | `true` | Enable SkipScan for DISTINCT aggregates | | `enable_sparse_index_bloom` | `BOOLEAN` | `true` | This sparse index speeds up the equality queries on compressed columns, and can be disabled when not desired. | | `enable_tiered_reads` | `BOOLEAN` | `true` | Enable reading of tiered data by including a foreign table representing the data in the object storage into the query plan | | `enable_transparent_decompression` | `BOOLEAN` | `true` | Enable transparent decompression when querying hypertable | | `enable_tss_callbacks` | `BOOLEAN` | `true` | Enable ts_stat_statements callbacks | | `enable_uuid_compression` | `BOOLEAN` | `false` | Enable uuid compression | | `enable_vectorized_aggregation` | `BOOLEAN` | `true` | Enable vectorized aggregation for compressed data | | `last_tuned` | `STRING` | `NULL` | records last time timescaledb-tune ran | | `last_tuned_version` | `STRING` | `NULL` | version of timescaledb-tune used to tune | | `license` | `STRING` | `TS_LICENSE_DEFAULT` | Determines which features are enabled | | `materializations_per_refresh_window` | `INTEGER` | `10` | The maximal number of individual refreshes per cagg refresh. If more refreshes need to be performed, they are merged into a larger single refresh.<br />min: `0`, max: `INT_MAX` | | `max_cached_chunks_per_hypertable` | `INTEGER` | `1024` | Maximum number of chunks stored in the cache<br />min: `0`, max: `65536` | | `max_open_chunks_per_insert` | `INTEGER` | `1024` | Maximum number of open chunk tables per insert<br />min: `0`, max: `PG_INT16_MAX` | | `max_tuples_decompressed_per_dml_transaction` | `INTEGER` | `100000` | If the number of tuples exceeds this value, an error will be thrown and transaction rolled back. Setting this to 0 sets this value to unlimited number of tuples decompressed.<br />min: `0`, max: `2147483647` | | `restoring` | `BOOLEAN` | `false` | In restoring mode all timescaledb internal hooks are disabled. This mode is required for restoring logical dumps of databases with timescaledb. | | `shutdown_bgw_scheduler` | `BOOLEAN` | `false` | this is for debugging purposes | | `skip_scan_run_cost_multiplier` | `REAL` | `1.0` | Default is 1.0 i.e. regularly estimated SkipScan run cost, 0.0 will make SkipScan to have run cost = 0<br />min: `0.0`, max: `1.0` | | `telemetry_level` | `ENUM` | `TELEMETRY_DEFAULT` | Level used to determine which telemetry to send | Version: [2.22.1](https://github.com/timescale/timescaledb/releases/tag/2.22.1) ===== PAGE: https://docs.tigerdata.com/_partials/_migrate_live_run_live_migration_timescaledb/ ===== 2. **Pull the live-migration docker image to you migration machine**shell sudo docker pull timescale/live-migration:latest
To list the available commands, run:shell sudo docker run --rm -it -e PGCOPYDB_SOURCE_PGURI=source timescale/live-migration:latest --help
To see the available flags for each command, run `--help` for that command. For example:shell sudo docker run --rm -it -e PGCOPYDB_SOURCE_PGURI=source timescale/live-migration:latest migrate --help
1. **Create a snapshot image of your source database in your Tiger Cloud service** This process checks that you have tuned your source database and target service correctly for replication, then creates a snapshot of your data on the migration machine:shell docker run --rm -it --name live-migration-snapshot
-e PGCOPYDB_SOURCE_PGURI=source \ -e PGCOPYDB_TARGET_PGURI=target \ --pid=host \ -v ~/live-migration:/opt/timescale/ts_cdc \ timescale/live-migration:latest snapshotLive-migration supplies information about updates you need to make to the source database and target service. For example:shell 2024-03-25T12:40:40.884 WARNING: The following tables in the Source DB have neither a primary key nor a REPLICA IDENTITY (FULL/INDEX) 2024-03-25T12:40:40.884 WARNING: UPDATE and DELETE statements on these tables will not be replicated to the Target DB 2024-03-25T12:40:40.884 WARNING: - public.metrics
If you have warnings, stop live-migration, make the suggested changes and start again. 1. **Synchronize data between your source database and your Tiger Cloud service** This command migrates data from the snapshot to your Tiger Cloud service, then streams transactions from the source to the target.shell docker run --rm -it --name live-migration-migrate
-e PGCOPYDB_SOURCE_PGURI=source \ -e PGCOPYDB_TARGET_PGURI=target \ --pid=host \ -v ~/live-migration:/opt/timescale/ts_cdc \ timescale/live-migration:latest migrateIf the source Postgres version is 17 or later, you need to pass additional flag `-e PGVERSION=17` to the `migrate` command. During this process, you see the migration process:shell Live-replay will complete in 1 minute 38.631 seconds (source_wal_rate: 106.0B/s, target_replay_rate: 589.0KiB/s, replay_lag: 56MiB)
If `migrate` stops add `--resume` to start from where it left off. Once the data in your target Tiger Cloud service has almost caught up with the source database, you see the following message:shell Target has caught up with source (source_wal_rate: 751.0B/s, target_replay_rate: 0B/s, replay_lag: 7KiB)
To stop replication, hit 'c' and then ENTERWait until `replay_lag` is down to a few kilobytes before you move to the next step. Otherwise, data replication may not have finished. 1. **Start app downtime** 1. Stop your app writing to the source database, then let the the remaining transactions finish to fully sync with the target. You can use tools like the `pg_top` CLI or `pg_stat_activity` to view the current transaction on the source database. 1. Stop Live-migration. ```shell hit 'c' and then ENTER ``` Live-migration continues the remaining work. This includes copying TimescaleDB metadata, sequences, and run policies. When the migration completes, you see the following message: ```sh Migration successfully completed ``` ===== PAGE: https://docs.tigerdata.com/_partials/_caggs-types/ ===== There are three main ways to make aggregation easier: materialized views, continuous aggregates, and real-time aggregates. [Materialized views][pg-materialized views] are a standard Postgres function. They are used to cache the result of a complex query so that you can reuse it later on. Materialized views do not update regularly, although you can manually refresh them as required. [Continuous aggregates][about-caggs] are a TimescaleDB-only feature. They work in a similar way to a materialized view, but they are updated automatically in the background, as new data is added to your database. Continuous aggregates are updated continuously and incrementally, which means they are less resource intensive to maintain than materialized views. Continuous aggregates are based on hypertables, and you can query them in the same way as you do your other tables. [Real-time aggregates][real-time-aggs] are a TimescaleDB-only feature. They are the same as continuous aggregates, but they add the most recent raw data to the previously aggregated data to provide accurate and up-to-date results, without needing to aggregate data as it is being written. ===== PAGE: https://docs.tigerdata.com/_partials/_devops-rest-api-get-started/ ===== [Tiger REST API][rest-api-reference] is a comprehensive RESTful API you use to manage Tiger Cloud resources including VPCs, services, and read replicas. This page shows you how to set up secure authentication for the Tiger REST API and create your first service. ## Prerequisites To follow the steps on this page: * Create a target [Tiger Data account][create-account]. * Install [curl][curl]. ## Configure secure authentication Tiger REST API uses HTTP Basic Authentication with access keys and secret keys. All API requests must include proper authentication headers. 1. **Set up API credentials** 1. In Tiger Cloud Console [copy your project ID][get-project-id] and store it securely using an environment variable: ```bash export TIGERDATA_PROJECT_ID="your-project-id" ``` 1. In Tiger Cloud Console [create your client credentials][create-client-credentials] and store them securely using environment variables: ```bash export TIGERDATA_ACCESS_KEY="Public key" export TIGERDATA_SECRET_KEY="Secret key" ``` 1. **Configure the API endpoint** Set the base URL in your environment: ```bash export API_BASE_URL="https://console.cloud.timescale.com/public/api/v1" ``` 1. **Test your authenticated connection to Tiger REST API by listing the services in the current Tiger Cloud project** ```bash curl -X GET "${API_BASE_URL}/projects/${TIGERDATA_PROJECT_ID}/services" \ -u "${TIGERDATA_ACCESS_KEY}:${TIGERDATA_SECRET_KEY}" \ -H "Content-Type: application/json" ``` This call returns something like: - No services: ```terminaloutput []% ``` - One or more services: ```terminaloutput [{"service_id":"tgrservice","project_id":"tgrproject","name":"tiger-eon", "region_code":"us-east-1","service_type":"TIMESCALEDB", "created":"2025-10-20T12:21:28.216172Z","paused":false,"status":"READY", "resources":[{"id":"104977","spec":{"cpu_millis":500,"memory_gbs":2,"volume_type":""}}], "metadata":{"environment":"DEV"}, "endpoint":{"host":"tgrservice.tgrproject.tsdb.cloud.timescale.com","port":11111}}] ``` ## Create your first Tiger Cloud service Create a new service using the Tiger REST API: 1. **Create a service using the POST endpoint**bash curl -X POST "${API_BASE_URL}/projects/${TIGERDATA_PROJECT_ID}/services"
-u "${TIGERDATA_ACCESS_KEY}:${TIGERDATA_SECRET_KEY}" \ -H "Content-Type: application/json" \ -d '{ "name": "my-first-service", "addons": ["time-series"], "region_code": "us-east-1", "replica_count": 1, "cpu_millis": "1000", "memory_gbs": "4" }'Tiger Cloud creates a Development environment for you. That is, no delete protection, high-availability, spooling or read replication. You see something like:terminaloutput
{"service_id":"tgrservice","project_id":"tgrproject","name":"my-first-service", "region_code":"us-east-1","service_type":"TIMESCALEDB", "created":"2025-10-20T22:29:33.052075713Z","paused":false,"status":"QUEUED", "resources":[{"id":"105120","spec":{"cpu_millis":1000,"memory_gbs":4,"volume_type":""}}], "metadata":{"environment":"PROD"}, "endpoint":{"host":"tgrservice.tgrproject.tsdb.cloud.timescale.com","port":00001}, "initial_password":"notTellingYou", "ha_replicas":{"sync_replica_count":0,"replica_count":1}}1. Save `service_id` from the response to a variable:bash # Extract service_id from the JSON response export SERVICE_ID="service_id-from-response"
1. **Check the configuration for the service**bash
curl -X GET "${API_BASE_URL}/projects/${TIGERDATA_PROJECT_ID}/services/${SERVICE_ID}" \
  -u "${TIGERDATA_ACCESS_KEY}:${TIGERDATA_SECRET_KEY}" \
  -H "Content-Type: application/json"
You see something like:terminaloutput
    {"service_id":"tgrservice","project_id":"tgrproject","name":"my-first-service",
    "region_code":"us-east-1","service_type":"TIMESCALEDB",
    "created":"2025-10-20T22:29:33.052075Z","paused":false,"status":"READY",
    "resources":[{"id":"105120","spec":{"cpu_millis":1000,"memory_gbs":4,"volume_type":""}}],
    "metadata":{"environment":"DEV"},
    "endpoint":{"host":"tgrservice.tgrproject.tsdb.cloud.timescale.com","port":11111},
    "ha_replicas":{"sync_replica_count":0,"replica_count":1}}
And that is it, you are ready to use the [Tiger REST API][rest-api-reference] to manage your services in Tiger Cloud. ## Security best practices Follow these security guidelines when working with the Tiger REST API: - **Credential management** - Store API credentials as environment variables, not in code - Use credential rotation policies for production environments - Never commit credentials to version control systems - **Network security** - Use HTTPS endpoints exclusively for API communication - Implement proper certificate validation in your HTTP clients - **Data protection** - Use secure storage for service connection strings and passwords - Implement proper backup and recovery procedures for created services - Follow data residency requirements for your region ===== PAGE: https://docs.tigerdata.com/_partials/_dimensions_info/ ===== ### Dimension info To create a `_timescaledb_internal.dimension_info` instance, you call [add_dimension][add_dimension] to an existing hypertable. #### Samples Hypertables must always have a primary range dimension, followed by an arbitrary number of additional dimensions that can be either range or hash, Typically this is just one hash. For example:sql SELECT add_dimension('conditions', by_range('time')); SELECT add_dimension('conditions', by_hash('location', 2));
For incompatible data types such as `jsonb`, you can specify a function to the `partition_func` argument of the dimension build to extract a compatible data type. Look in the example section below. #### Custom partitioning By default, TimescaleDB calls Postgres's internal hash function for the given type. You use a custom partitioning function for value types that do not have a native Postgres hash function. You can specify a custom partitioning function for both range and hash partitioning. A partitioning function should take a `anyelement` argument as the only parameter and return a positive `integer` hash value. This hash value is _not_ a partition identifier, but rather the inserted value's position in the dimension's key space, which is then divided across the partitions. #### by_range() Create a by-range dimension builder. You can partition `by_range` on it's own. ##### Samples - Partition on time using `CREATE TABLE` The simplest usage is to partition on a time column:sql CREATE TABLE conditions (
time TIMESTAMPTZ NOT NULL, location TEXT NOT NULL, device TEXT NOT NULL, temperature DOUBLE PRECISION NULL, humidity DOUBLE PRECISION NULL) WITH (
tsdb.hypertable, tsdb.partition_column='time');
If you are self-hosting TimescaleDB v2.19.3 and below, create a [Postgres relational table][pg-create-table], then convert it using [create_hypertable][create_hypertable]. You then enable hypercore with a call to [ALTER TABLE][alter_table_hypercore]. This is the default partition, you do not need to add it explicitly. - Extract time from a non-time column using `create_hypertable` If you have a table with a non-time column containing the time, such as a JSON column, add a partition function to extract the time:sql CREATE TABLE my_table (
metric_id serial not null, data jsonb,);
CREATE FUNCTION get_time(jsonb) RETURNS timestamptz AS $$
SELECT ($1->>'time')::timestamptz$$ LANGUAGE sql IMMUTABLE;
SELECT create_hypertable('my_table', by_range('data', '1 day', 'get_time'));
##### Arguments | Name | Type | Default | Required | Description | |-|----------|---------|-|-| |`column_name`| `NAME` | - |✔|Name of column to partition on.| |`partition_func`| `REGPROC` | - |✖|The function to use for calculating the partition of a value.| |`partition_interval`|`ANYELEMENT` | - |✖|Interval to partition column on.| If the column to be partitioned is a: - `TIMESTAMP`, `TIMESTAMPTZ`, or `DATE`: specify `partition_interval` either as an `INTERVAL` type or an integer value in *microseconds*. - Another integer type: specify `partition_interval` as an integer that reflects the column's underlying semantics. For example, if this column is in UNIX time, specify `partition_interval` in milliseconds. The partition type and default value depending on column type is:<a id="partition-types" href=""></a> | Column Type | Partition Type | Default value | |------------------------------|------------------|---------------| | `TIMESTAMP WITHOUT TIMEZONE` | INTERVAL/INTEGER | 1 week | | `TIMESTAMP WITH TIMEZONE` | INTERVAL/INTEGER | 1 week | | `DATE` | INTERVAL/INTEGER | 1 week | | `SMALLINT` | SMALLINT | 10000 | | `INT` | INT | 100000 | | `BIGINT` | BIGINT | 1000000 | #### by_hash() The main purpose of hash partitioning is to enable parallelization across multiple disks within the same time interval. Every distinct item in hash partitioning is hashed to one of *N* buckets. By default, TimescaleDB uses flexible range intervals to manage chunk sizes. ### Parallelizing disk I/O You use Parallel I/O in the following scenarios: - Two or more concurrent queries should be able to read from different disks in parallel. - A single query should be able to use query parallelization to read from multiple disks in parallel. For the following options: - **RAID**: use a RAID setup across multiple physical disks, and expose a single logical disk to the hypertable. That is, using a single tablespace. Best practice is to use RAID when possible, as you do not need to manually manage tablespaces in the database. - **Multiple tablespaces**: for each physical disk, add a separate tablespace to the database. TimescaleDB allows you to add multiple tablespaces to a *single* hypertable. However, although under the hood, a hypertable's chunks are spread across the tablespaces associated with that hypertable. When using multiple tablespaces, a best practice is to also add a second hash-partitioned dimension to your hypertable and to have at least one hash partition per disk. While a single time dimension would also work, it would mean that the first chunk is written to one tablespace, the second to another, and so on, and thus would parallelize only if a query's time range exceeds a single chunk. When adding a hash partitioned dimension, set the number of partitions to a multiple of number of disks. For example, the number of partitions P=N*Pd where N is the number of disks and Pd is the number of partitions per disk. This enables you to add more disks later and move partitions to the new disk from other disks. TimescaleDB does *not* benefit from a very large number of hash partitions, such as the number of unique items you expect in partition field. A very large number of hash partitions leads both to poorer per-partition load balancing (the mapping of items to partitions using hashing), as well as much increased planning latency for some types of queries. ##### Samplessql CREATE TABLE conditions ( "time" TIMESTAMPTZ NOT NULL, location TEXT NOT NULL, device TEXT NOT NULL, temperature DOUBLE PRECISION NULL, humidity DOUBLE PRECISION NULL ) WITH ( tsdb.hypertable, tsdb.partition_column='time', tsdb.chunk_interval='1 day' );
SELECT add_dimension('conditions', by_hash('location', 2));
##### Arguments | Name | Type | Default | Required | Description | |-|----------|---------|-|----------------------------------------------------------| |`column_name`| `NAME` | - |✔| Name of column to partition on. | |`partition_func`| `REGPROC` | - |✖| The function to use to calcule the partition of a value. | |`number_partitions`|`ANYELEMENT` | - |✔| Number of hash partitions to use for `partitioning_column`. Must be greater than 0. | #### Returns `by_range` and `by-hash` return an opaque `_timescaledb_internal.dimension_info` instance, holding the dimension information used by this function. ===== PAGE: https://docs.tigerdata.com/_partials/_selfhosted_production_alert/ ===== The following instructions are for development and testing installations. For a production environment, we strongly recommend that you implement the following, many of which you can achieve using Postgres tooling: - Incremental backup and database snapshots, with efficient point-in-time recovery. - High availability replication, ideally with nodes across multiple availability zones. - Automatic failure detection with fast restarts, for both non-replicated and replicated deployments. - Asynchronous replicas for scaling reads when needed. - Connection poolers for scaling client connections. - Zero-down-time minor version and extension upgrades. - Forking workflows for major version upgrades and other feature testing. - Monitoring and observability. Deploying for production? With a Tiger Cloud service we tune your database for performance and handle scalability, high availability, backups, and management, so you can relax. ===== PAGE: https://docs.tigerdata.com/_partials/_install-self-hosted-redhat-x-platform/ ===== 1. **Update your local repository list** ```bash sudo yum update ``` 1. **Install TimescaleDB** To avoid errors, **do not** install TimescaleDB Apache 2 Edition and TimescaleDB Community Edition at the same time. ```bash sudo yum install timescaledb-2-postgresql-17 postgresql17 ``` <!-- hack until we have bandwidth to rewrite this linting rule --> <!-- markdownlint-disable TS007 --> On Red Hat Enterprise Linux 8 and later, disable the built-in Postgres module: `sudo dnf -qy module disable postgresql` <!-- markdownlint-enable TS007 --> 1. **Initialize the Postgres instance** ```bash sudo /usr/pgsql-17/bin/postgresql-17-setup initdb ``` 1. **Tune your Postgres instance for TimescaleDB** ```bash sudo timescaledb-tune --pg-config=/usr/pgsql-17/bin/pg_config ``` This script is included with the `timescaledb-tools` package when you install TimescaleDB. For more information, see [configuration][config]. 1. **Enable and start Postgres** ```bash sudo systemctl enable postgresql-17 sudo systemctl start postgresql-17 ``` 1. **Log in to Postgres as `postgres`** ```bash sudo -u postgres psql ``` You are now in the psql shell. 1. **Set the password for `postgres`** ```bash \password postgres ``` When you have set the password, type `\q` to exit psql. ===== PAGE: https://docs.tigerdata.com/_partials/_since_2_2_0/ ===== Since [TimescaleDB v2.2.0](https://github.com/timescale/timescaledb/releases/tag/2.2.0) ===== PAGE: https://docs.tigerdata.com/_partials/_migrate_dual_write_6a_through_c/ ===== Dump the data from your source database on a per-table basis into CSV format, and restore those CSVs into the target database using the `timescaledb-parallel-copy` tool. ### 6a. Determine the time range of data to be copied Determine the window of data that to be copied from the source database to the target. Depending on the volume of data in the source table, it may be sensible to split the source table into multiple chunks of data to move independently. In the following steps, this time range is called `<start>` and `<end>`. Usually the `time` column is of type `timestamp with time zone`, so the values of `<start>` and `<end>` must be something like `2023-08-01T00:00:00Z`. If the `time` column is not a `timestamp with time zone` then the values of `<start>` and `<end>` must be the correct type for the column. If you intend to copy all historic data from the source table, then the value of `<start>` can be `'-infinity'`, and the `<end>` value is the value of the completion point `T` that you determined. ### 6b. Remove overlapping data in the target The dual-write process may have already written data into the target database in the time range that you want to move. In this case, the dual-written data must be removed. This can be achieved with a `DELETE` statement, as follows:bash psql target -c "DELETE FROM WHERE time >= AND time < );"
The BETWEEN operator is inclusive of both the start and end ranges, so it is not recommended to use it. ===== PAGE: https://docs.tigerdata.com/_partials/_psql-installation-homebrew/ ===== #### Installing psql using Homebrew 1. Install `psql`: ```bash brew install libpq ``` 1. Update your path to include the `psql` tool. ```bash brew link --force libpq ``` On Intel chips, the symbolic link is added to `/usr/local/bin`. On Apple Silicon, the symbolic link is added to `/opt/homebrew/bin`. ===== PAGE: https://docs.tigerdata.com/_partials/_early_access_2_17_1/ ===== Early access: TimescaleDB v2.17.1 ===== PAGE: https://docs.tigerdata.com/_partials/_migrate_dump_postgresql/ ===== ## Prepare to migrate 1. **Take the applications that connect to the source database offline** The duration of the migration is proportional to the amount of data stored in your database. By disconnection your app from your database you avoid and possible data loss. 1. **Set your connection strings** These variables hold the connection information for the source database and target Tiger Cloud service:bash export SOURCE="postgres://:@:/" export TARGET="postgres://tsdbadmin:@:/tsdb?sslmode=require"
You find the connection information for your Tiger Cloud service in the configuration file you downloaded when you created the service. ## Align the extensions on the source and target 1. Ensure that the Tiger Cloud service is running the Postgres extensions used in your source database. 1. Check the extensions on the source database: ```bash psql source -c "SELECT * FROM pg_extension;" ``` 1. For each extension, enable it on your target Tiger Cloud service: ```bash psql target -c "CREATE EXTENSION IF NOT EXISTS <extension name> CASCADE;" ``` ## Migrate the roles from TimescaleDB to your Tiger Cloud service Roles manage database access permissions. To migrate your role-based security hierarchy to your Tiger Cloud service: 1. **Dump the roles from your source database** Export your role-based security hierarchy. `<db_name>` has the same value as `<db_name>` in `source`. I know, it confuses me as well.bash pg_dumpall -d "source"
-l <db_name> --quote-all-identifiers \ --roles-only \ --file=roles.sqlIf you only use the default `postgres` role, this step is not necessary. 1. **Remove roles with superuser access** Tiger Cloud service do not support roles with superuser access. Run the following script to remove statements, permissions and clauses that require superuser permissions from `roles.sql`:bash sed -i -E \ -e '/CREATE ROLE "postgres";/d' \ -e '/ALTER ROLE "postgres"/d' \ -e '/CREATE ROLE "tsdbadmin";/d' \ -e '/ALTER ROLE "tsdbadmin"/d' \ -e 's/(NO)*SUPERUSER//g' \ -e 's/(NO)*REPLICATION//g' \ -e 's/(NO)BYPASSRLS//g' \ -e 's/GRANTED BY "[^"]"//g' \ roles.sql
1. **Dump the source database schema and data** The `pg_dump` flags remove superuser access and tablespaces from your data. When you run `pgdump`, check the run time, [a long-running `pg_dump` can cause issues][long-running-pgdump].bash pg_dump -d "source" \ --format=plain \ --quote-all-identifiers \ --no-tablespaces \ --no-owner \ --no-privileges \ --file=dump.sql
To dramatically reduce the time taken to dump the source database, using multiple connections. For more information, see [dumping with concurrency][dumping-with-concurrency] and [restoring with concurrency][restoring-with-concurrency]. ## Upload your data to the target Tiger Cloud servicebash psql target -v ON_ERROR_STOP=1 --echo-errors \ -f roles.sql \ -f dump.sql
## Validate your Tiger Cloud service and restart your app 1. Update the table statistics. ```bash psql target -c "ANALYZE;" ``` 1. Verify the data in the target Tiger Cloud service. Check that your data is correct, and returns the results that you expect, 1. Enable any Tiger Cloud features you want to use. Migration from Postgres moves the data only. Now manually enable Tiger Cloud features like [hypertables][about-hypertables], [hypercore][data-compression] or [data retention][data-retention] while your database is offline. 1. Reconfigure your app to use the target database, then restart it. ===== PAGE: https://docs.tigerdata.com/_partials/_hypercore-conversion-overview/ ===== When you convert chunks from the rowstore to the columnstore, multiple records are grouped into a single row. The columns of this row hold an array-like structure that stores all the data. For example, data in the following rowstore chunk: | Timestamp | Device ID | Device Type | CPU |Disk IO| |---|---|---|---|---| |12:00:01|A|SSD|70.11|13.4| |12:00:01|B|HDD|69.70|20.5| |12:00:02|A|SSD|70.12|13.2| |12:00:02|B|HDD|69.69|23.4| |12:00:03|A|SSD|70.14|13.0| |12:00:03|B|HDD|69.70|25.2| Is converted and compressed into arrays in a row in the columnstore: |Timestamp|Device ID|Device Type|CPU|Disk IO| |-|-|-|-|-| |[12:00:01, 12:00:01, 12:00:02, 12:00:02, 12:00:03, 12:00:03]|[A, B, A, B, A, B]|[SSD, HDD, SSD, HDD, SSD, HDD]|[70.11, 69.70, 70.12, 69.69, 70.14, 69.70]|[13.4, 20.5, 13.2, 23.4, 13.0, 25.2]| Because a single row takes up less disk space, you can reduce your chunk size by up to 98%, and can also speed up your queries. This saves on storage costs, and keeps your queries operating at lightning speed. ===== PAGE: https://docs.tigerdata.com/_partials/_migrate_live_migration_cleanup/ ===== To clean up resources associated with live migration, use the following command:sh docker run --rm -it --name live-migration-clean
-e PGCOPYDB_SOURCE_PGURI=source \ -e PGCOPYDB_TARGET_PGURI=target \ --pid=host \ -v ~/live-migration:/opt/timescale/ts_cdc \ timescale/live-migration:latest clean --pruneThe `--prune` flag is used to delete temporary files in the `~/live-migration` directory that were needed for the migration process. It's important to note that executing the `clean` command means you cannot resume the interrupted live migration. ===== PAGE: https://docs.tigerdata.com/_partials/_devops-cli-get-started/ ===== Tiger CLI is a command-line interface that you use to manage Tiger Cloud resources including VPCs, services, read replicas, and related infrastructure. Tiger CLI calls Tiger REST API to communicate with Tiger Cloud. This page shows you how to install and set up secure authentication for Tiger CLI, then create your first service. ## Prerequisites To follow the steps on this page: * Create a target [Tiger Data account][create-account]. ## Install and configure Tiger CLI 1. **Install Tiger CLI** Use the terminal to install the CLI: ```shell curl -s https://packagecloud.io/install/repositories/timescale/tiger-cli/script.deb.sh | sudo os=any dist=any bash sudo apt-get install tiger-cli ``` ```shell curl -s https://packagecloud.io/install/repositories/timescale/tiger-cli/script.deb.sh | sudo os=any dist=any bash sudo apt-get install tiger-cli ``` ```shell curl -s https://packagecloud.io/install/repositories/timescale/tiger-cli/script.rpm.sh | sudo os=rpm_any dist=rpm_any bash sudo yum install tiger-cli ``` ```shell curl -s https://packagecloud.io/install/repositories/timescale/tiger-cli/script.rpm.sh | sudo os=rpm_any dist=rpm_any bash sudo yum install tiger-cli ``` ```shell brew install --cask timescale/tap/tiger-cli ``` ```shell curl -fsSL https://cli.tigerdata.com | sh ``` 1. **Set up API credentials** 1. Log Tiger CLI into your Tiger Data account: ```shell tiger auth login ``` Tiger CLI opens Console in your browser. Log in, then click `Authorize`. You can have a maximum of 10 active client credentials. If you get an error, open [credentials][rest-api-credentials] and delete an unused credential. 1. Select a Tiger Cloud project: ```terminaloutput Auth URL is: https://console.cloud.timescale.com/oauth/authorize?client_id=lotsOfURLstuff Opening browser for authentication... Select a project: > 1. Tiger Project (tgrproject) 2. YourCompany (Company wide project) (cpnproject) 3. YourCompany Department (dptproject) Use ↑/↓ arrows or number keys to navigate, enter to select, q to quit ``` If only one project is associated with your account, this step is not shown. Where possible, Tiger CLI stores your authentication information in the system keychain/credential manager. If that fails, the credentials are stored in `~/.config/tiger/credentials` with restricted file permissions (600). By default, Tiger CLI stores your configuration in `~/.config/tiger/config.yaml`. 1. **Test your authenticated connection to Tiger Cloud by listing services** ```bash tiger service list ``` This call returns something like: - No services: ```terminaloutput 🏜️ No services found! Your project is looking a bit empty. 🚀 Ready to get started? Create your first service with: tiger service create ``` - One or more services: ```terminaloutput ┌────────────┬─────────────────────┬────────┬─────────────┬──────────────┬──────────────────┐ │ SERVICE ID │ NAME │ STATUS │ TYPE │ REGION │ CREATED │ ├────────────┼─────────────────────┼────────┼─────────────┼──────────────┼──────────────────┤ │ tgrservice │ tiger-agent-service │ READY │ TIMESCALEDB │ eu-central-1 │ 2025-09-25 16:09 │ └────────────┴─────────────────────┴────────┴─────────────┴──────────────┴──────────────────┘ ``` ## Create your first Tiger Cloud service Create a new Tiger Cloud service using Tiger CLI: 1. **Submit a service creation request** By default, Tiger CLI creates a service for you that matches your [pricing plan][pricing-plans]: * **Free plan**: shared CPU/memory and the `time-series` and `ai` capabilities * **Paid plan**: 0.5 CPU and 2 GB memory with the `time-series` capabilityshell tiger service create
Tiger Cloud creates a Development environment for you. That is, no delete protection, high-availability, spooling or read replication. You see something like:terminaloutput
🚀 Creating service 'db-11111' (auto-generated name)... ✅ Service creation request accepted! 📋 Service ID: tgrservice 🔐 Password saved to system keyring for automatic authentication 🎯 Set service 'tgrservice' as default service. ⏳ Waiting for service to be ready (wait timeout: 30m0s)... 🎉 Service is ready and running!🔌 Run 'tiger db connect' to connect to your new service ┌───────────────────┬──────────────────────────────────────────────────────────────────────────────────────────────────┐ │ PROPERTY │ VALUE │ ├───────────────────┼──────────────────────────────────────────────────────────────────────────────────────────────────┤ │ Service ID │ tgrservice │ │ Name │ db-11111 │ │ Status │ READY │ │ Type │ TIMESCALEDB │ │ Region │ us-east-1 │ │ CPU │ 0.5 cores (500m) │ │ Memory │ 2 GB │ │ Direct Endpoint │ tgrservice.tgrproject.tsdb.cloud.timescale.com:39004 │ │ Created │ 2025-10-20 20:33:46 UTC │ │ Connection String │ postgresql://tsdbadmin@tgrservice.tgrproject.tsdb.cloud.timescale.com:0007/tsdb?sslmode=require │ │ Console URL │ https://console.cloud.timescale.com/dashboard/services/tgrservice │ └───────────────────┴──────────────────────────────────────────────────────────────────────────────────────────────────┘
This service is set as default by the CLI. 1. **Check the CLI configuration**shell tiger config show
You see something like:terminaloutput api_url: https://console.cloud.timescale.com/public/api/v1 console_url: https://console.cloud.timescale.com gateway_url: https://console.cloud.timescale.com/api docs_mcp: true docs_mcp_url: https://mcp.tigerdata.com/docs project_id: tgrproject service_id: tgrservice output: table analytics: true password_storage: keyring debug: false config_dir: /Users//.config/tiger
And that is it, you are ready to use Tiger CLI to manage your services in Tiger Cloud. ## Commands You can use the following commands with Tiger CLI. For more information on each command, use the `-h` flag. For example: `tiger auth login -h` | Command | Subcommand | Description | |---------|----------------------------------------------|----------------------------------------------------------------------------------------------------------------------------------------------------------------------------------------------------------------------------------------------------------------------------------------------------------------------------------------------------------------------------------------------------------------------------------------------------------------------------------------------------------------------------------------------------------------------------------------------------------------------------------------------------------------------------------------------------------------------------------------------------------------------------------------------------------------------------------------------------------------------------------------------------------------------------------------------------------------------------------------------------| | auth | | Manage authentication and credentials for your Tiger Data account | | | login | Create an authenticated connection to your Tiger Data account | | | logout | Remove the credentials used to create authenticated connections to Tiger Cloud | | | status | Show your current authentication status and project ID | | version | | Show information about the currently installed version of Tiger CLI | | config | | Manage your Tiger CLI configuration | | | show | Show the current configuration | | | set `<key>` `<value>` | Set a specific value in your configuration. For example, `tiger config set debug true` | | | unset `<key>` | Clear the value of a configuration parameter. For example, `tiger config unset debug` | | | reset | Reset the configuration to the defaults. This also logs you out from the current Tiger Cloud project | | service | | Manage the Tiger Cloud services in this project | | | create | Create a new service in this project. Possible flags are: <ul><li>`--name`: service name (auto-generated if not provided)</li><li>`--addons`: addons to enable (time-series, ai, or none for PostgreSQL-only)</li><li>`--region`: region code where the service will be deployed</li><li>`--cpu-memory`: CPU/memory allocation combination</li><li>`--replicas`: number of high-availability replicas</li><li>`--no-wait`: don't wait for the operation to complete</li><li>`--wait-timeout`: wait timeout duration (for example, 30m, 1h30m, 90s)</li><li>`--no-set-default`: don't set this service as the default service</li><li>`--with-password`: include password in output</li><li>`--output, -o`: output format (`json`, `yaml`, table)</li></ul> <br/> Possible `cpu-memory` combinations are: <ul><li>shared/shared</li><li>0.5 CPU/2 GB</li><li>1 CPU/4 GB</li><li>2 CPU/8 GB</li><li>4 CPU/16 GB</li><li>8 CPU/32 GB</li><li>16 CPU/64 GB</li><li>32 CPU/128 GB</li></ul> | | | delete `<service-id>` | Delete a service from this project. This operation is irreversible and requires confirmation by typing the service ID | | | fork `<service-id>` | Fork an existing service to create a new independent copy. Key features are: <ul><li><strong>Timing options</strong>: `--now`, `--last-snapshot`, `--to-timestamp`</li><li><strong>Resource configuration</strong>: `--cpu-memory`</li><li><strong>Naming</strong>: `--name <name>`. Defaults to `{source-service-name}-fork`</li><li><strong>Wait behavior</strong>: `--no-wait`, `--wait-timeout`</li><li><strong>Default service</strong>: `--no-set-default`</li></ul> | | | get `<service-id>` (aliases: describe, show) | Show detailed information about a specific service in this project | | | list | List all the services in this project | | | update-password `<service-id>` | Update the master password for a service | | db | | Database operations and management | | | connect `<service-id>` | Connect to a service | | | connection-string `<service-id>` | Retrieve the connection string for a service | | | save-password `<service-id>` | Save the password for a service | | | test-connection `<service-id>` | Test the connectivity to a service | | mcp | | Manage the Tiger Model Context Protocol Server for AI Assistant integration | | | install `[client]` | Install and configure Tiger Model Context Protocol Server for a specific client (`claude-code`, `cursor`, `windsurf`, or other). If no client is specified, you'll be prompted to select one interactively | | | start | Start the Tiger Model Context Protocol Server. This is the same as `tiger mcp start stdio` | | | start stdio | Start the Tiger Model Context Protocol Server with stdio transport (default) | | | start http | Start the Tiger Model Context Protocol Server with HTTP transport. Includes flags: `--port` (default: `8080`), `--host` (default: `localhost`) | ## Global flags You can use the following global flags with Tiger CLI: | Flag | Default | Description | |-------------------------------|-------------------|-----------------------------------------------------------------------------| | `--analytics` | `true` | Set to `false` to disable usage analytics | | `--color ` | `true` | Set to `false` to disable colored output | | `--config-dir` string | `.config/tiger` | Set the directory that holds `config.yaml` | | `--debug` | No debugging | Enable debug logging | | `--help` | - | Print help about the current command. For example, `tiger service --help` | | `--password-storage` string | keyring | Set the password storage method. Options are `keyring`, `pgpass`, or `none` | | `--service-id` string | - | Set the Tiger Cloud service to manage | | ` --skip-update-check ` | - | Do not check if a new version of Tiger CLI is available| ## Configuration parameters By default, Tiger CLI stores your configuration in `~/.config/tiger/config.yaml`. The name of these variables matches the flags you use to update them. However, you can override them using the following environmental variables: - **Configuration parameters** - `TIGER_CONFIG_DIR`: path to configuration directory (default: `~/.config/tiger`) - `TIGER_API_URL`: Tiger REST API base endpoint (default: https://console.cloud.timescale.com/public/api/v1) - `TIGER_CONSOLE_URL`: URL to Tiger Cloud Console (default: https://console.cloud.timescale.com) - `TIGER_GATEWAY_URL`: URL to the Tiger Cloud Console gateway (default: https://console.cloud.timescale.com/api) - `TIGER_DOCS_MCP`: enable/disable docs MCP proxy (default: `true`) - `TIGER_DOCS_MCP_URL`: URL to the Tiger MCP Server for Tiger Data docs (default: https://mcp.tigerdata.com/docs) - `TIGER_SERVICE_ID`: ID for the service updated when you call CLI commands - `TIGER_ANALYTICS`: enable or disable analytics (default: `true`) - `TIGER_PASSWORD_STORAGE`: password storage method (keyring, pgpass, or none) - `TIGER_DEBUG`: enable/disable debug logging (default: `false`) - `TIGER_COLOR`: set to `false` to disable colored output (default: `true`) - **Authentication parameters** To authenticate without using the interactive login, either: - Set the following parameters with your [client credentials][rest-api-credentials], then `login`: ```shell TIGER_PUBLIC_KEY=<public_key> TIGER_SECRET_KEY=<secret_key> TIGER_PROJECT_ID=<project_id>\ tiger auth login ``` - Add your [client credentials][rest-api-credentials] to the `login` command: ```shell tiger auth login --public-key=<public_key> --secret-key=<secret-key> --project-id=<project_id> ``` ===== PAGE: https://docs.tigerdata.com/_partials/_migrate_self_postgres_plan_migration_path/ ===== Best practice is to always use the latest version of TimescaleDB. Subscribe to our releases on GitHub or use Tiger Cloud and always run the latest update without any hassle. Check the following support matrix against the versions of TimescaleDB and Postgres that you are running currently and the versions you want to update to, then choose your upgrade path. For example, to upgrade from TimescaleDB 2.13 on Postgres 13 to TimescaleDB 2.18.2 you need to: 1. Upgrade TimescaleDB to 2.15 1. Upgrade Postgres to 14, 15 or 16. 1. Upgrade TimescaleDB to 2.18.2. You may need to [upgrade to the latest Postgres version][upgrade-pg] before you upgrade TimescaleDB. Also, if you use [TimescaleDB Toolkit][toolkit-install], ensure the `timescaledb_toolkit` extension is >= v1.6.0 before you upgrade TimescaleDB extension. | TimescaleDB version |Postgres 17|Postgres 16|Postgres 15|Postgres 14|Postgres 13|Postgres 12|Postgres 11|Postgres 10| |-----------------------|-|-|-|-|-|-|-|-| | 2.22.x |✅|✅|✅|❌|❌|❌|❌|❌|❌| | 2.21.x |✅|✅|✅|❌|❌|❌|❌|❌|❌| | 2.20.x |✅|✅|✅|❌|❌|❌|❌|❌|❌| | 2.17 - 2.19 |✅|✅|✅|✅|❌|❌|❌|❌|❌| | 2.16.x |❌|✅|✅|✅|❌|❌|❌|❌|❌|❌| | 2.13 - 2.15 |❌|✅|✅|✅|✅|❌|❌|❌|❌| | 2.12.x |❌|❌|✅|✅|✅|❌|❌|❌|❌| | 2.10.x |❌|❌|✅|✅|✅|✅|❌|❌|❌| | 2.5 - 2.9 |❌|❌|❌|✅|✅|✅|❌|❌|❌| | 2.4 |❌|❌|❌|❌|✅|✅|❌|❌|❌| | 2.1 - 2.3 |❌|❌|❌|❌|✅|✅|✅|❌|❌| | 2.0 |❌|❌|❌|❌|❌|✅|✅|❌|❌ | 1.7 |❌|❌|❌|❌|❌|✅|✅|✅|✅| We recommend not using TimescaleDB with Postgres 17.1, 16.5, 15.9, 14.14, 13.17, 12.21. These minor versions [introduced a breaking binary interface change][postgres-breaking-change] that, once identified, was reverted in subsequent minor Postgres versions 17.2, 16.6, 15.10, 14.15, 13.18, and 12.22. When you build from source, best practice is to build with Postgres 17.2, 16.6, etc and higher. Users of [Tiger Cloud](https://console.cloud.timescale.com/) and platform packages for Linux, Windows, MacOS, Docker, and Kubernetes are unaffected. ===== PAGE: https://docs.tigerdata.com/_partials/_migrate_dump_timescaledb/ ===== ## Prepare to migrate 1. **Take the applications that connect to the source database offline** The duration of the migration is proportional to the amount of data stored in your database. By disconnection your app from your database you avoid and possible data loss. 1. **Set your connection strings** These variables hold the connection information for the source database and target Tiger Cloud service:bash export SOURCE="postgres://:@:/" export TARGET="postgres://tsdbadmin:@:/tsdb?sslmode=require"
You find the connection information for your Tiger Cloud service in the configuration file you downloaded when you created the service. ## Align the version of TimescaleDB on the source and target 1. Ensure that the source and target databases are running the same version of TimescaleDB. 1. Check the version of TimescaleDB running on your Tiger Cloud service: ```bash psql target -c "SELECT extversion FROM pg_extension WHERE extname = 'timescaledb';" ``` 1. Update the TimescaleDB extension in your source database to match the target service: If the TimescaleDB extension is the same version on the source database and target service, you do not need to do this. ```bash psql source -c "ALTER EXTENSION timescaledb UPDATE TO '<version here>';" ``` For more information and guidance, see [Upgrade TimescaleDB](https://docs.tigerdata.com/self-hosted/latest/upgrades/). 1. Ensure that the Tiger Cloud service is running the Postgres extensions used in your source database. 1. Check the extensions on the source database: ```bash psql source -c "SELECT * FROM pg_extension;" ``` 1. For each extension, enable it on your target Tiger Cloud service: ```bash psql target -c "CREATE EXTENSION IF NOT EXISTS <extension name> CASCADE;" ``` ## Migrate the roles from TimescaleDB to your Tiger Cloud service Roles manage database access permissions. To migrate your role-based security hierarchy to your Tiger Cloud service: 1. **Dump the roles from your source database** Export your role-based security hierarchy. `<db_name>` has the same value as `<db_name>` in `source`. I know, it confuses me as well.bash pg_dumpall -d "source"
-l <db_name> --quote-all-identifiers \ --roles-only \ --file=roles.sqlIf you only use the default `postgres` role, this step is not necessary. 1. **Remove roles with superuser access** Tiger Cloud service do not support roles with superuser access. Run the following script to remove statements, permissions and clauses that require superuser permissions from `roles.sql`:bash sed -i -E \ -e '/CREATE ROLE "postgres";/d' \ -e '/ALTER ROLE "postgres"/d' \ -e '/CREATE ROLE "tsdbadmin";/d' \ -e '/ALTER ROLE "tsdbadmin"/d' \ -e 's/(NO)*SUPERUSER//g' \ -e 's/(NO)*REPLICATION//g' \ -e 's/(NO)BYPASSRLS//g' \ -e 's/GRANTED BY "[^"]"//g' \ roles.sql
1. **Dump the source database schema and data** The `pg_dump` flags remove superuser access and tablespaces from your data. When you run `pgdump`, check the run time, [a long-running `pg_dump` can cause issues][long-running-pgdump].bash pg_dump -d "source" \ --format=plain \ --quote-all-identifiers \ --no-tablespaces \ --no-owner \ --no-privileges \ --file=dump.sql
To dramatically reduce the time taken to dump the source database, using multiple connections. For more information, see [dumping with concurrency][dumping-with-concurrency] and [restoring with concurrency][restoring-with-concurrency]. ## Upload your data to the target Tiger Cloud service This command uses the [timescaledb_pre_restore] and [timescaledb_post_restore] functions to put your database in the correct state.bash psql target -v ON_ERROR_STOP=1 --echo-errors \ -f roles.sql \ -c "SELECT timescaledb_pre_restore();" \ -f dump.sql \ -c "SELECT timescaledb_post_restore();"
## Validate your Tiger Cloud service and restart your app 1. Update the table statistics. ```bash psql target -c "ANALYZE;" ``` 1. Verify the data in the target Tiger Cloud service. Check that your data is correct, and returns the results that you expect, 1. Enable any Tiger Cloud features you want to use. Migration from Postgres moves the data only. Now manually enable Tiger Cloud features like [hypertables][about-hypertables], [hypercore][data-compression] or [data retention][data-retention] while your database is offline. 1. Reconfigure your app to use the target database, then restart it. ===== PAGE: https://docs.tigerdata.com/_partials/_early_access/ ===== Early access ===== PAGE: https://docs.tigerdata.com/_partials/_add-data-twelvedata-crypto/ ===== ## Load financial data This tutorial uses real-time cryptocurrency data, also known as tick data, from [Twelve Data][twelve-data]. To ingest data into the tables that you created, you need to download the dataset, then upload the data to your Tiger Cloud service. 1. Unzip [crypto_sample.zip](https://assets.timescale.com/docs/downloads/candlestick/crypto_sample.zip) to a `<local folder>`. This test dataset contains second-by-second trade data for the most-traded crypto-assets and a regular table of asset symbols and company names. To import up to 100GB of data directly from your current Postgres-based database, [migrate with downtime][migrate-with-downtime] using native Postgres tooling. To seamlessly import 100GB-10TB+ of data, use the [live migration][migrate-live] tooling supplied by Tiger Data. To add data from non-Postgres data sources, see [Import and ingest data][data-ingest]. 1. In Terminal, navigate to `<local folder>` and connect to your service.bash psql -d "postgres://:@:/"
The connection information for a service is available in the file you downloaded when you created it. 1. At the `psql` prompt, use the `COPY` command to transfer data into your Tiger Cloud service. If the `.csv` files aren't in your current directory, specify the file paths in these commands: ```sql \COPY crypto_ticks FROM 'tutorial_sample_tick.csv' CSV HEADER; ``` ```sql \COPY crypto_assets FROM 'tutorial_sample_assets.csv' CSV HEADER; ``` Because there are millions of rows of data, the `COPY` process could take a few minutes depending on your internet connection and local client resources. ===== PAGE: https://docs.tigerdata.com/_partials/_install-self-hosted-fedora/ ===== 1. **Install the latest Postgres packages** ```bash sudo yum install https://download.postgresql.org/pub/repos/yum/reporpms/F-$(rpm -E %{fedora})-x86_64/pgdg-fedora-repo-latest.noarch.rpm ``` 1. **Add the TimescaleDB repository** ```bash sudo tee /etc/yum.repos.d/timescale_timescaledb.repo <<EOL [timescale_timescaledb] name=timescale_timescaledb baseurl=https://packagecloud.io/timescale/timescaledb/el/9/\$basearch repo_gpgcheck=1 gpgcheck=0 enabled=1 gpgkey=https://packagecloud.io/timescale/timescaledb/gpgkey sslverify=1 sslcacert=/etc/pki/tls/certs/ca-bundle.crt metadata_expire=300 EOL ``` 1. **Update your local repository list** ```bash sudo yum update ``` 1. **Install TimescaleDB** To avoid errors, **do not** install TimescaleDB Apache 2 Edition and TimescaleDB Community Edition at the same time. ```bash sudo yum install timescaledb-2-postgresql-17 postgresql17 ``` <!-- hack until we have bandwidth to rewrite this linting rule --> <!-- markdownlint-disable TS007 --> On Red Hat Enterprise Linux 8 and later, disable the built-in Postgres module: `sudo dnf -qy module disable postgresql` <!-- markdownlint-enable TS007 --> 1. **Initialize the Postgres instance** ```bash sudo /usr/pgsql-17/bin/postgresql-17-setup initdb ``` 1. **Tune your Postgres instance for TimescaleDB** ```bash sudo timescaledb-tune --pg-config=/usr/pgsql-17/bin/pg_config ``` This script is included with the `timescaledb-tools` package when you install TimescaleDB. For more information, see [configuration][config]. 1. **Enable and start Postgres** ```bash sudo systemctl enable postgresql-17 sudo systemctl start postgresql-17 ``` 1. **Log in to Postgres as `postgres`** ```bash sudo -u postgres psql ``` You are now in the psql shell. 1. **Set the password for `postgres`** ```bash \password postgres ``` When you have set the password, type `\q` to exit psql. ===== PAGE: https://docs.tigerdata.com/_partials/_add-data-blockchain/ ===== ## Load financial data The dataset contains around 1.5 million Bitcoin transactions, the trades for five days. It includes information about each transaction, along with the value in [satoshi][satoshi-def]. It also states if a trade is a [coinbase][coinbase-def] transaction, and the reward a coin miner receives for mining the coin. To ingest data into the tables that you created, you need to download the dataset and copy the data to your database. 1. Download the `bitcoin_sample.zip` file. The file contains a `.csv` file that contains Bitcoin transactions for the past five days. Download: [bitcoin_sample.zip](https://assets.timescale.com/docs/downloads/bitcoin-blockchain/bitcoin_sample.zip) 1. In a new terminal window, run this command to unzip the `.csv` files: ```bash unzip bitcoin_sample.zip ``` 1. In Terminal, navigate to the folder where you unzipped the Bitcoin transactions, then connect to your service using [psql][connect-using-psql]. 1. At the `psql` prompt, use the `COPY` command to transfer data into your Tiger Cloud service. If the `.csv` files aren't in your current directory, specify the file paths in these commands: ```sql \COPY transactions FROM 'tutorial_bitcoin_sample.csv' CSV HEADER; ``` Because there is over a million rows of data, the `COPY` process could take a few minutes depending on your internet connection and local client resources. ===== PAGE: https://docs.tigerdata.com/_partials/_hypercore-intro/ ===== Hypercore is a hybrid row-columnar storage engine in TimescaleDB. It is designed specifically for real-time analytics and powered by time-series data. The advantage of hypercore is its ability to seamlessly switch between row-oriented and column-oriented storage, delivering the best of both worlds:  Hypercore solves the key challenges in real-time analytics: - High ingest throughput - Low-latency ingestion - Fast query performance - Efficient handling of data updates and late-arriving data - Streamlined data management Hypercore’s hybrid approach combines the benefits of row-oriented and column-oriented formats: - **Fast ingest with rowstore**: new data is initially written to the rowstore, which is optimized for high-speed inserts and updates. This process ensures that real-time applications easily handle rapid streams of incoming data. Mutability—upserts, updates, and deletes happen seamlessly. - **Efficient analytics with columnstore**: as the data **cools** and becomes more suited for analytics, it is automatically converted to the columnstore. This columnar format enables fast scanning and aggregation, optimizing performance for analytical workloads while also saving significant storage space. - **Faster queries on compressed data in columnstore**: in the columnstore conversion, hypertable chunks are compressed by up to 98%, and organized for efficient, large-scale queries. Combined with [chunk skipping][chunk-skipping], this helps you save on storage costs and keeps your queries operating at lightning speed. - **Fast modification of compressed data in columnstore**: just use SQL to add or modify data in the columnstore. TimescaleDB is optimized for superfast INSERT and UPSERT performance. - **Full mutability with transactional semantics**: regardless of where data is stored, hypercore provides full ACID support. Like in a vanilla Postgres database, inserts and updates to the rowstore and columnstore are always consistent, and available to queries as soon as they are completed. For an in-depth explanation of how hypertables and hypercore work, see the [Data model][data-model]. ===== PAGE: https://docs.tigerdata.com/_partials/_experimental-schema-upgrade/ ===== When you upgrade the `timescaledb` extension, the experimental schema is removed by default. To use experimental features after an upgrade, you need to add the experimental schema again. ===== PAGE: https://docs.tigerdata.com/_partials/_migrate_import_setup_connection_strings_parquet/ ===== This variable holds the connection information for the target Tiger Cloud service. In the terminal on the source machine, set the following:bash export TARGET=postgres://tsdbadmin:@:/tsdb?sslmode=require
See where to [find your connection details][connection-info]. ===== PAGE: https://docs.tigerdata.com/_partials/_migrate_pg_dump_minimal_downtime/ ===== For minimal downtime, run the migration commands from a machine with a low-latency, high-throughput link to the source and target databases. If you are using an AWS EC2 instance to run the migration commands, use one in the same region as your target Tiger Cloud service. ===== PAGE: https://docs.tigerdata.com/_partials/_migrate_live_migrate_faq_all/ ===== ### ERROR: relation "xxx.yy" does not exist This may happen when a relation is removed after executing the `snapshot` command. A relation can be a table, index, view, or materialized view. When you see you this error: - Do not perform any explicit DDL operation on the source database during the course of migration. - If you are migrating from self-hosted TimescaleDB or MST, disable the chunk retention policy on your source database until you have finished migration. ### FATAL: remaining connection slots are reserved for non-replication superuser connections This may happen when the number of connections exhaust `max_connections` defined in your target Tiger Cloud service. By default, live-migration needs around ~6 connections on the source and ~12 connections on the target. ### Migration seems to be stuck with “x GB copied to Target DB (Source DB is y GB)” When you are migrating a lot of data involved in aggregation, or there are many materialized views taking time to complete the materialization, this may be due to `REFRESH MATERIALIZED VIEWS` happening at the end of initial data migration. To resolve this issue: 1. See what is happening on the target Tiger Cloud service:shell psql target -c "select * from pg_stat_activity where application_name ilike '%pgcopydb%';"
1. When you run the `migrate`, add the following flags to exclude specific materialized views being materialized:shell --skip-table-data ”
1. When `migrate` has finished, manually refresh the materialized views you excluded. ### Restart migration from scratch after a non-resumable failure If the migration halts due to a failure, such as a misconfiguration of the source or target database, you may need to restart the migration from scratch. In such cases, you can reuse the original target Tiger Cloud service created for the migration by utilizing the `--drop-if-exists` flag with the migrate command. This flag ensures that the existing target objects created by the previous migration are dropped, allowing the migration to proceed without trouble. Note: This flag also requires you to manually recreate the TimescaleDB extension on the target. Here’s an example command sequence to restart the migration:shell psql target -c "DROP EXTENSION timescaledb CASCADE"
psql target -c 'CREATE EXTENSION timescaledb VERSION ""'
docker run --rm -it --name live-migration-migrate
-e PGCOPYDB_SOURCE_PGURI=source \ -e PGCOPYDB_TARGET_PGURI=target \ --pid=host \ -v ~/live-migration:/opt/timescale/ts_cdc \ timescale/live-migration:latest migrate --drop-if-existsThis approach provides a clean slate for the migration process while reusing the existing target instance. ### Inactive or lagging replication slots If you encounter an “Inactive or lagging replication slots” warning on your cloud provider console after using live-migration, it might be due to lingering replication slots created by the live-migration tool on your source database. To clean up resources associated with live migration, use the following command:sh docker run --rm -it --name live-migration-clean
-e PGCOPYDB_SOURCE_PGURI=source \ -e PGCOPYDB_TARGET_PGURI=target \ --pid=host \ -v ~/live-migration:/opt/timescale/ts_cdc \ timescale/live-migration:latest clean --pruneThe `--prune` flag is used to delete temporary files in the `~/live-migration` directory that were needed for the migration process. It's important to note that executing the `clean` command means you cannot resume the interrupted live migration. ### Role passwords Because of issues dumping passwords from various managed service providers, Live-migration migrates roles without passwords. You have to migrate passwords manually. ### Table privileges Live-migration does not migrate table privileges. After completing Live-migration: 1. Grant all roles to `tsdbadmin`.shell psql -d source -t -A -c "SELECT FORMAT('GRANT %I TO tsdbadmin;', rolname) FROM pg_catalog.pgroles WHERE rolname not like 'pg%' AND rolname != 'tsdbadmin' AND NOT rolsuper" | psql -d target -f -
1. On your migration machine, edit `/tmp/grants.psql` to match table privileges on your source database.shell pg_dump --schema-only --quote-all-identifiers --exclude-schema=_timescaledb_catalog --format=plain --dbname "source" | grep "(ALTER.OWNER.|GRANT|REVOKE)" > /tmp/grants.psql
1. Run `grants.psql` on your target Tiger Cloud service.shell psql -d target -f /tmp/grants.psql
### Postgres to Tiger Cloud: “live-replay not keeping up with source load” 1. Go to Tiger Cloud Console -> `Monitoring` -> `Insights` tab and find the query which takes significant time 2. If the query is either UPDATE/DELETE, make sure the columns used on the WHERE clause have necessary indexes. 3. If the query is either UPDATE/DELETE on the tables which are converted as hypertables, make sure the REPLIDA IDENTITY(defaults to primary key) on the source is compatible with the target primary key. If not, create an UNIQUE index source database by including the hypertable partition column and make it as a REPLICA IDENTITY. Also, create the same UNIQUE index on target. ### ERROR: out of memory (or) Failed on request of size xxx in memory context "yyy" on a Tiger Cloud service This error occurs when the Out of Memory (OOM) guard is triggered due to memory allocations exceeding safe limits. It typically happens when multiple concurrent connections to the TimescaleDB instance are performing memory-intensive operations. For example, during live migrations, this error can occur when large indexes are being created simultaneously. The live-migration tool includes a retry mechanism to handle such errors. However, frequent OOM crashes may significantly delay the migration process. One of the following can be used to avoid the OOM errors: 1. Upgrade to Higher Memory Spec Instances: To mitigate memory constraints, consider using a TimescaleDB instance with higher specifications, such as an instance with 8 CPUs and 32 GB RAM (or more). Higher memory capacity can handle larger workloads and reduce the likelihood of OOM errors. 1. Reduce Concurrency: If upgrading your instance is not feasible, you can reduce the concurrency of the index migration process using the `--index-jobs=<value>` flag in the migration command. By default, the value of `--index-jobs` matches the GUC max_parallel_workers. Lowering this value reduces the memory usage during migration but may increase the total migration time. By taking these steps, you can prevent OOM errors and ensure a smoother migration experience with TimescaleDB. ===== PAGE: https://docs.tigerdata.com/_partials/_install-self-hosted-debian-based/ ===== 1. **Install the latest Postgres packages** ```bash sudo apt install gnupg postgresql-common apt-transport-https lsb-release wget ``` 1. **Run the Postgres package setup script** ```bash sudo /usr/share/postgresql-common/pgdg/apt.postgresql.org.sh ``` If you want to do some development on Postgres, add the libraries: ``` sudo apt install postgresql-server-dev-17 ``` 1. **Add the TimescaleDB package** <Terminal> ```bash echo "deb https://packagecloud.io/timescale/timescaledb/debian/ $(lsb_release -c -s) main" | sudo tee /etc/apt/sources.list.d/timescaledb.list ``` ```bash echo "deb https://packagecloud.io/timescale/timescaledb/ubuntu/ $(lsb_release -c -s) main" | sudo tee /etc/apt/sources.list.d/timescaledb.list ``` </Terminal> 1. **Install the TimescaleDB GPG key** ```bash wget --quiet -O - https://packagecloud.io/timescale/timescaledb/gpgkey | sudo gpg --dearmor -o /etc/apt/trusted.gpg.d/timescaledb.gpg ``` For Ubuntu 21.10 and earlier use the following command: `wget --quiet -O - https://packagecloud.io/timescale/timescaledb/gpgkey | sudo apt-key add -` 1. **Update your local repository list** ```bash sudo apt update ``` 1. **Install TimescaleDB** ```bash sudo apt install timescaledb-2-postgresql-17 postgresql-client-17 ``` To install a specific TimescaleDB [release][releases-page], set the version. For example: `sudo apt-get install timescaledb-2-postgresql-14='2.6.0*' timescaledb-2-loader-postgresql-14='2.6.0*'` Older versions of TimescaleDB may not support all the OS versions listed on this page. 1. **Tune your Postgres instance for TimescaleDB** ```bash sudo timescaledb-tune ``` By default, this script is included with the `timescaledb-tools` package when you install TimescaleDB. Use the prompts to tune your development or production environment. For more information on manual configuration, see [Configuration][config]. If you have an issue, run `sudo apt install timescaledb-tools`. 1. **Restart Postgres** ```bash sudo systemctl restart postgresql ``` 1. **Log in to Postgres as `postgres`** ```bash sudo -u postgres psql ``` You are in the psql shell. 1. **Set the password for `postgres`** ```bash \password postgres ``` When you have set the password, type `\q` to exit psql. ===== PAGE: https://docs.tigerdata.com/_partials/_use-case-setup-blockchain-dataset/ ===== # Ingest data into a Tiger Cloud service This tutorial uses a dataset that contains Bitcoin blockchain data for the past five days, in a hypertable named `transactions`. ## Prerequisites To follow the steps on this page: * Create a target [Tiger Cloud service][create-service] with the Real-time analytics capability. You need [your connection details][connection-info]. This procedure also works for [self-hosted TimescaleDB][enable-timescaledb]. ## Optimize time-series data using hypertables Hypertables are Postgres tables in TimescaleDB that automatically partition your time-series data by time. Time-series data represents the way a system, process, or behavior changes over time. Hypertables enable TimescaleDB to work efficiently with time-series data. Each hypertable is made up of child tables called chunks. Each chunk is assigned a range of time, and only contains data from that range. When you run a query, TimescaleDB identifies the correct chunk and runs the query on it, instead of going through the entire table. [Hypercore][hypercore] is the hybrid row-columnar storage engine in TimescaleDB used by hypertables. Traditional databases force a trade-off between fast inserts (row-based storage) and efficient analytics (columnar storage). Hypercore eliminates this trade-off, allowing real-time analytics without sacrificing transactional capabilities. Hypercore dynamically stores data in the most efficient format for its lifecycle: * **Row-based storage for recent data**: the most recent chunk (and possibly more) is always stored in the rowstore, ensuring fast inserts, updates, and low-latency single record queries. Additionally, row-based storage is used as a writethrough for inserts and updates to columnar storage. * **Columnar storage for analytical performance**: chunks are automatically compressed into the columnstore, optimizing storage efficiency and accelerating analytical queries. Unlike traditional columnar databases, hypercore allows data to be inserted or modified at any stage, making it a flexible solution for both high-ingest transactional workloads and real-time analytics—within a single database. Because TimescaleDB is 100% Postgres, you can use all the standard Postgres tables, indexes, stored procedures, and other objects alongside your hypertables. This makes creating and working with hypertables similar to standard Postgres. 1. Connect to your Tiger Cloud service In [Tiger Cloud Console][services-portal] open an [SQL editor][in-console-editors]. The in-Console editors display the query speed. You can also connect to your service using [psql][connect-using-psql]. 1. Create a [hypertable][hypertables-section] for your time-series data using [CREATE TABLE][hypertable-create-table]. For [efficient queries][secondary-indexes] on data in the columnstore, remember to `segmentby` the column you will use most often to filter your data: ```sql CREATE TABLE transactions ( time TIMESTAMPTZ NOT NULL, block_id INT, hash TEXT, size INT, weight INT, is_coinbase BOOLEAN, output_total BIGINT, output_total_usd DOUBLE PRECISION, fee BIGINT, fee_usd DOUBLE PRECISION, details JSONB ) WITH ( tsdb.hypertable, tsdb.partition_column='time', tsdb.segmentby='block_id', tsdb.orderby='time DESC' ); ``` If you are self-hosting TimescaleDB v2.19.3 and below, create a [Postgres relational table][pg-create-table], then convert it using [create_hypertable][create_hypertable]. You then enable hypercore with a call to [ALTER TABLE][alter_table_hypercore]. 1. Create an index on the `hash` column to make queries for individual transactions faster: ```sql CREATE INDEX hash_idx ON public.transactions USING HASH (hash); ``` 1. Create an index on the `block_id` column to make block-level queries faster: When you create a hypertable, it is partitioned on the time column. TimescaleDB automatically creates an index on the time column. However, you'll often filter your time-series data on other columns as well. You use [indexes][indexing] to improve query performance. ```sql CREATE INDEX block_idx ON public.transactions (block_id); ``` 1. Create a unique index on the `time` and `hash` columns to make sure you don't accidentally insert duplicate records: ```sql CREATE UNIQUE INDEX time_hash_idx ON public.transactions (time, hash); ``` ## Load financial data The dataset contains around 1.5 million Bitcoin transactions, the trades for five days. It includes information about each transaction, along with the value in [satoshi][satoshi-def]. It also states if a trade is a [coinbase][coinbase-def] transaction, and the reward a coin miner receives for mining the coin. To ingest data into the tables that you created, you need to download the dataset and copy the data to your database. 1. Download the `bitcoin_sample.zip` file. The file contains a `.csv` file that contains Bitcoin transactions for the past five days. Download: [bitcoin_sample.zip](https://assets.timescale.com/docs/downloads/bitcoin-blockchain/bitcoin_sample.zip) 1. In a new terminal window, run this command to unzip the `.csv` files: ```bash unzip bitcoin_sample.zip ``` 1. In Terminal, navigate to the folder where you unzipped the Bitcoin transactions, then connect to your service using [psql][connect-using-psql]. 1. At the `psql` prompt, use the `COPY` command to transfer data into your Tiger Cloud service. If the `.csv` files aren't in your current directory, specify the file paths in these commands: ```sql \COPY transactions FROM 'tutorial_bitcoin_sample.csv' CSV HEADER; ``` Because there is over a million rows of data, the `COPY` process could take a few minutes depending on your internet connection and local client resources. ===== PAGE: https://docs.tigerdata.com/_partials/_import-data-iot/ ===== Hypertables are Postgres tables in TimescaleDB that automatically partition your time-series data by time. Time-series data represents the way a system, process, or behavior changes over time. Hypertables enable TimescaleDB to work efficiently with time-series data. Each hypertable is made up of child tables called chunks. Each chunk is assigned a range of time, and only contains data from that range. When you run a query, TimescaleDB identifies the correct chunk and runs the query on it, instead of going through the entire table. [Hypercore][hypercore] is the hybrid row-columnar storage engine in TimescaleDB used by hypertables. Traditional databases force a trade-off between fast inserts (row-based storage) and efficient analytics (columnar storage). Hypercore eliminates this trade-off, allowing real-time analytics without sacrificing transactional capabilities. Hypercore dynamically stores data in the most efficient format for its lifecycle: * **Row-based storage for recent data**: the most recent chunk (and possibly more) is always stored in the rowstore, ensuring fast inserts, updates, and low-latency single record queries. Additionally, row-based storage is used as a writethrough for inserts and updates to columnar storage. * **Columnar storage for analytical performance**: chunks are automatically compressed into the columnstore, optimizing storage efficiency and accelerating analytical queries. Unlike traditional columnar databases, hypercore allows data to be inserted or modified at any stage, making it a flexible solution for both high-ingest transactional workloads and real-time analytics—within a single database. Because TimescaleDB is 100% Postgres, you can use all the standard Postgres tables, indexes, stored procedures, and other objects alongside your hypertables. This makes creating and working with hypertables similar to standard Postgres. 1. **Import time-series data into a hypertable** 1. Unzip [metrics.csv.gz](https://assets.timescale.com/docs/downloads/metrics.csv.gz) to a `<local folder>`. This test dataset contains energy consumption data. To import up to 100GB of data directly from your current Postgres based database, [migrate with downtime][migrate-with-downtime] using native Postgres tooling. To seamlessly import 100GB-10TB+ of data, use the [live migration][migrate-live] tooling supplied by Tiger Data. To add data from non-Postgres data sources, see [Import and ingest data][data-ingest]. 1. In Terminal, navigate to `<local folder>` and update the following string with [your connection details][connection-info] to connect to your service. ```bash psql -d "postgres://<username>:<password>@<host>:<port>/<database-name>?sslmode=require" ``` 1. Create an optimized hypertable for your time-series data: 1. Create a [hypertable][hypertables-section] with [hypercore][hypercore] enabled by default for your time-series data using [CREATE TABLE][hypertable-create-table]. For [efficient queries][secondary-indexes] on data in the columnstore, remember to `segmentby` the column you will use most often to filter your data. In your sql client, run the following command: ```sql CREATE TABLE "metrics"( created timestamp with time zone default now() not null, type_id integer not null, value double precision not null ) WITH ( tsdb.hypertable, tsdb.partition_column='created', tsdb.segmentby = 'type_id', tsdb.orderby = 'created DESC' ); ``` If you are self-hosting TimescaleDB v2.19.3 and below, create a [Postgres relational table][pg-create-table], then convert it using [create_hypertable][create_hypertable]. You then enable hypercore with a call to [ALTER TABLE][alter_table_hypercore]. 1. Upload the dataset to your service ```sql \COPY metrics FROM metrics.csv CSV; ``` 1. **Have a quick look at your data** You query hypertables in exactly the same way as you would a relational Postgres table. Use one of the following SQL editors to run a query and see the data you uploaded: - **Data mode**: write queries, visualize data, and share your results in [Tiger Cloud Console][portal-data-mode] for all your Tiger Cloud services. - **SQL editor**: write, fix, and organize SQL faster and more accurately in [Tiger Cloud Console][portal-ops-mode] for a Tiger Cloud service. - **psql**: easily run queries on your Tiger Cloud services or self-hosted TimescaleDB deployment from Terminal. ```sql SELECT time_bucket('1 day', created, 'Europe/Berlin') AS "time", round((last(value, created) - first(value, created)) * 100.) / 100. AS value FROM metrics WHERE type_id = 5 GROUP BY 1; ``` On this amount of data, this query on data in the rowstore takes about 3.6 seconds. You see something like: | Time | value | |------------------------------|-------| | 2023-05-29 22:00:00+00 | 23.1 | | 2023-05-28 22:00:00+00 | 19.5 | | 2023-05-30 22:00:00+00 | 25 | | 2023-05-31 22:00:00+00 | 8.1 | ===== PAGE: https://docs.tigerdata.com/_partials/_toolkit-install-update-debian-base/ ===== ## Prerequisites To follow this procedure: - [Install TimescaleDB][debian-install]. - Add the TimescaleDB repository and the GPG key. ## Install TimescaleDB Toolkit These instructions use the `apt` package manager. 1. Update your local repository list: ```bash sudo apt update ``` 1. Install TimescaleDB Toolkit: ```bash sudo apt install timescaledb-toolkit-postgresql-17 ``` 1. [Connect to the database][connect] where you want to use Toolkit. 1. Create the Toolkit extension in the database: ```sql CREATE EXTENSION timescaledb_toolkit; ``` ## Update TimescaleDB Toolkit Update Toolkit by installing the latest version and running `ALTER EXTENSION`. 1. Update your local repository list: ```bash apt update ``` 1. Install the latest version of TimescaleDB Toolkit: ```bash apt install timescaledb-toolkit-postgresql-17 ``` 1. [Connect to the database][connect] where you want to use the new version of Toolkit. 1. Update the Toolkit extension in the database: ```sql ALTER EXTENSION timescaledb_toolkit UPDATE; ``` For some Toolkit versions, you might need to disconnect and reconnect active sessions. ===== PAGE: https://docs.tigerdata.com/_partials/_grafana-viz-prereqs/ ===== Before you begin, make sure you have: * Created a [Timescale][cloud-login] service. * Installed a self-managed Grafana account, or signed up for [Grafana Cloud][install-grafana]. * Ingested some data to your database. You can use the stock trade data from the [Getting Started Guide][gsg-data]. The examples in this section use these variables and Grafana functions: * `$symbol`: a variable used to filter results by stock symbols. * `_timeFrom()::timestamptz` & `_timeTo()::timestamptz`: Grafana variables. You change the values of these variables by using the dashboard's date chooser when viewing your graph. * `$bucket_interval`: the interval size to pass to the `time_bucket` function when aggregating data. ===== PAGE: https://docs.tigerdata.com/_partials/_cloud-mst-comparison/ ===== Tiger Cloud is a high-performance developer focused cloud that provides Postgres services enhanced with our blazing fast vector search. You can securely integrate Tiger Cloud with your AWS, GCS or Azure infrastructure. [Create a Tiger Cloud service][timescale-service] and try for free. If you need to run TimescaleDB on GCP or Azure, you're in the right place — keep reading. ===== PAGE: https://docs.tigerdata.com/_partials/_plan_upgrade/ ===== - Install the Postgres client tools on your migration machine. This includes `psql`, and `pg_dump`. - Read [the release notes][relnotes] for the version of TimescaleDB that you are upgrading to. - [Perform a backup][backup] of your database. While TimescaleDB upgrades are performed in-place, upgrading is an intrusive operation. Always make sure you have a backup on hand, and that the backup is readable in the case of disaster. ===== PAGE: https://docs.tigerdata.com/_partials/_use-case-iot-create-cagg/ ===== 1. **Monitor energy consumption on a day-to-day basis** 1. Create a continuous aggregate `kwh_day_by_day` for energy consumption: ```sql CREATE MATERIALIZED VIEW kwh_day_by_day(time, value) with (timescaledb.continuous) as SELECT time_bucket('1 day', created, 'Europe/Berlin') AS "time", round((last(value, created) - first(value, created)) * 100.) / 100. AS value FROM metrics WHERE type_id = 5 GROUP BY 1; ``` 1. Add a refresh policy to keep `kwh_day_by_day` up-to-date: ```sql SELECT add_continuous_aggregate_policy('kwh_day_by_day', start_offset => NULL, end_offset => INTERVAL '1 hour', schedule_interval => INTERVAL '1 hour'); ``` 1. **Monitor energy consumption on an hourly basis** 1. Create a continuous aggregate `kwh_hour_by_hour` for energy consumption: ```sql CREATE MATERIALIZED VIEW kwh_hour_by_hour(time, value) with (timescaledb.continuous) as SELECT time_bucket('01:00:00', metrics.created, 'Europe/Berlin') AS "time", round((last(value, created) - first(value, created)) * 100.) / 100. AS value FROM metrics WHERE type_id = 5 GROUP BY 1; ``` 1. Add a refresh policy to keep the continuous aggregate up-to-date: ```sql SELECT add_continuous_aggregate_policy('kwh_hour_by_hour', start_offset => NULL, end_offset => INTERVAL '1 hour', schedule_interval => INTERVAL '1 hour'); ``` 1. **Analyze your data** Now you have made continuous aggregates, it could be a good idea to use them to perform analytics on your data. For example, to see how average energy consumption changes during weekdays over the last year, run the following query: ```sql WITH per_day AS ( SELECT time, value FROM kwh_day_by_day WHERE "time" at time zone 'Europe/Berlin' > date_trunc('month', time) - interval '1 year' ORDER BY 1 ), daily AS ( SELECT to_char(time, 'Dy') as day, value FROM per_day ), percentile AS ( SELECT day, approx_percentile(0.50, percentile_agg(value)) as value FROM daily GROUP BY 1 ORDER BY 1 ) SELECT d.day, d.ordinal, pd.value FROM unnest(array['Sun', 'Mon', 'Tue', 'Wed', 'Thu', 'Fri', 'Sat']) WITH ORDINALITY AS d(day, ordinal) LEFT JOIN percentile pd ON lower(pd.day) = lower(d.day); ``` You see something like: | day | ordinal | value | | --- | ------- | ----- | | Mon | 2 | 23.08078714975423 | | Sun | 1 | 19.511430831944395 | | Tue | 3 | 25.003118897837307 | | Wed | 4 | 8.09300571759772 | ===== PAGE: https://docs.tigerdata.com/_partials/_use-case-transport-geolocation/ ===== ### Set up your data for geospatial queries To add geospatial analysis to your ride count visualization, you need geospatial data to work out which trips originated where. As TimescaleDB is compatible with all Postgres extensions, use [PostGIS][postgis] to slice data by time and location. 1. Connect to your [Tiger Cloud service][in-console-editors] and add the PostGIS extension: ```sql CREATE EXTENSION postgis; ``` 1. Add geometry columns for pick up and drop off locations: ```sql ALTER TABLE rides ADD COLUMN pickup_geom geometry(POINT,2163); ALTER TABLE rides ADD COLUMN dropoff_geom geometry(POINT,2163); ``` 1. Convert the latitude and longitude points into geometry coordinates that work with PostGIS: ```sql UPDATE rides SET pickup_geom = ST_Transform(ST_SetSRID(ST_MakePoint(pickup_longitude,pickup_latitude),4326),2163), dropoff_geom = ST_Transform(ST_SetSRID(ST_MakePoint(dropoff_longitude,dropoff_latitude),4326),2163); ``` This updates 10,906,860 rows of data on both columns, it takes a while. Coffee is your friend. ### Visualize the area where you can make the most money In this section you visualize a query that returns rides longer than 5 miles for trips taken within 2 km of Times Square. The data includes the distance travelled and is `GROUP BY` `trip_distance` and location so that Grafana can plot the data properly. This enables you to see where a taxi driver is most likely to pick up a passenger who wants a longer ride, and make more money. 1. **Create a geolocalization dashboard** 1. In Grafana, create a new dashboard that is connected to your Tiger Cloud service data source with a Geomap visualization. 1. In the `Queries` section, select `Code`, then select the Time series `Format`.  1. To find rides longer than 5 miles in Manhattan, paste the following query: ```sql SELECT time_bucket('5m', rides.pickup_datetime) AS time, rides.trip_distance AS value, rides.pickup_latitude AS latitude, rides.pickup_longitude AS longitude FROM rides WHERE rides.pickup_datetime BETWEEN '2016-01-01T01:41:55.986Z' AND '2016-01-01T07:41:55.986Z' AND ST_Distance(pickup_geom, ST_Transform(ST_SetSRID(ST_MakePoint(-73.9851,40.7589),4326),2163) ) < 2000 GROUP BY time, rides.trip_distance, rides.pickup_latitude, rides.pickup_longitude ORDER BY time LIMIT 500; ``` You see a world map with a dot on New York. 1. Zoom into your map to see the visualization clearly. 1. **Customize the visualization** 1. In the Geomap options, under `Map Layers`, click `+ Add layer` and select `Heatmap`. You now see the areas where a taxi driver is most likely to pick up a passenger who wants a longer ride, and make more money.  ===== PAGE: https://docs.tigerdata.com/_partials/_old-api-create-hypertable/ ===== If you are self-hosting TimescaleDB v2.19.3 and below, create a [Postgres relational table][pg-create-table], then convert it using [create_hypertable][create_hypertable]. You then enable hypercore with a call to [ALTER TABLE][alter_table_hypercore]. ===== PAGE: https://docs.tigerdata.com/_partials/_timescale-cloud-regions/ ===== Tiger Cloud services run in the following Amazon Web Services (AWS) regions: | Region | Zone | Location | | ---------------- | ------------- | -------------- | | `ap-south-1` | Asia Pacific | Mumbai | | `ap-southeast-1` | Asia Pacific | Singapore | | `ap-southeast-2` | Asia Pacific | Sydney | | `ap-northeast-1` | Asia Pacific | Tokyo | | `ca-central-1` | Canada | Central | | `eu-central-1` | Europe | Frankfurt | | `eu-west-1` | Europe | Ireland | | `eu-west-2` | Europe | London | | `sa-east-1` | South America | São Paulo | | `us-east-1` | United States | North Virginia | | `us-east-2` | United States | Ohio | | `us-west-2` | United States | Oregon | ===== PAGE: https://docs.tigerdata.com/_partials/_timescale-intro/ ===== Tiger Data extends Postgres for all of your resource-intensive production workloads, so you can build faster, scale further, and stay under budget. ===== PAGE: https://docs.tigerdata.com/_partials/_devops-mcp-commands/ ===== Tiger Model Context Protocol Server exposes the following MCP tools to your AI Assistant: | Command | Parameter | Required | Description | |--------------------------|---------------------|----------|------------------------------------------------------------------------------------------------------------------------------------------------------------------------------------------------------------------------------------------------------------------------------------------| | `service_list` | - | - | Returns a list of the services in the current project. | | `service_get` | - | - | Returns detailed information about a service. | | | `service_id` | ✓ | The unique identifier of the service (10-character alphanumeric string). | | | `with_password` | - | Set to `true` to include the password in the response and connection string. <br/> **WARNING**: never do this unless the user explicitly requests the password. | | `service_create` | - | - | Create a new service in Tiger Cloud. <br/> **WARNING**: creates billable resources. | | | `name` | - | Set the human-readable name of up to 128 characters for this service. | | | `addons` | - | Set the array of [addons][create-service] to enable for the service. Options: <ul><li>`time-series`: enables TimescaleDB</li><li>`ai`: enables the AI and vector extensions</li></ul> Set an empty array for Postgres-only. | | | `region` | - | Set the [AWS region][cloud-regions] to deploy this service in. | | | `cpu_memory` | - | CPU and memory allocation combination. <br /> Available configurations are: <ul><li>shared/shared</li><li>0.5 CPU/2 GB</li><li>1 CPU/4 GB</li><li>2 CPU/8 GB</li><li>4 CPU/16 GB</li><li>8 CPU/32 GB</li><li>16 CPU/64 GB</li><li>32 CPU/128 GB</li></ul> | | | `replicas` | - | Set the number of [high-availability replicas][readreplica] for fault tolerance. | | | `wait` | - | Set to `true` to wait for service to be fully ready before returning. | | | `timeout_minutes` | - | Set the timeout in minutes to wait for service to be ready. Only used when `wait=true`. Default: 30 minutes | | | `set_default` | - | By default, the new service is the default for following commands in CLI. Set to `false` to keep the previous service as the default. | | | `with_password` | - | Set to `true` to include the password for this service in response and connection string. <br/> **WARNING**: never set to `true` unless user explicitly requests the password. | | `service_update_password` | - | - | Update the password for the `tsdbadmin` for this service. The password change takes effect immediately and may terminate existing connections. | | | `service_id` | ✓ | The unique identifier of the service you want to update the password for. | | | `password` | ✓ | The new password for the `tsdbadmin` user. | | `db_execute_query` | - | - | Execute a single SQL query against a service. This command returns column metadata, result rows, affected row count, and execution time. Multi-statement queries are not supported. <br/> **WARNING**: can execute destructive SQL including INSERT, UPDATE, DELETE, and DDL commands. | | | `service_id` | ✓ | The unique identifier of the service. Use `tiger_service_list` to find service IDs. | | | `query` | ✓ | The SQL query to execute. Single statement queries are supported. | | | `parameters` | - | Query parameters for parameterized queries. Values are substituted for the `$n` placeholders in the query. | | | `timeout_seconds` | - | The query timeout in seconds. Default: `30`. | | | `role` | - | The service role/username to connect as. Default: `tsdbadmin`. | | | `pooled` | - | Use [connection pooling][Connection pooling]. This is only available if you have already enabled it for the service. Default: `false`. | ===== PAGE: https://docs.tigerdata.com/_partials/_cloudwatch-data-exporter/ ===== 1. **In Tiger Cloud Console, open [Exporters][console-integrations]** 1. **Click `New exporter`** 1. **Select the data type and specify `AWS CloudWatch` for provider**  1. **Provide your AWS CloudWatch configuration** - The AWS region must be the same for your Tiger Cloud exporter and AWS CloudWatch Log group. - The exporter name appears in Tiger Cloud Console, best practice is to make this name easily understandable. - For CloudWatch credentials, either use an [existing CloudWatch Log group][console-cloudwatch-configuration] or [create a new one][console-cloudwatch-create-group]. If you're uncertain, use the default values. For more information, see [Working with log groups and log streams][cloudwatch-log-naming]. 1. **Choose the authentication method to use for the exporter**  1. In AWS, navigate to [IAM > Identity providers][create-an-iam-id-provider], then click `Add provider`. 1. Update the new identity provider with your details: Set `Provider URL` to the [region where you are creating your exporter][reference].  1. Click `Add provider`. 1. In AWS, navigate to [IAM > Roles][add-id-provider-as-wi-role], then click `Create role`. 1. Add your identity provider as a Web identity role and click `Next`.  1. Set the following permission and trust policies: - Permission policy: ```json { "Version": "2012-10-17", "Statement": [ { "Effect": "Allow", "Action": [ "logs:PutLogEvents", "logs:CreateLogGroup", "logs:CreateLogStream", "logs:DescribeLogStreams", "logs:DescribeLogGroups", "logs:PutRetentionPolicy", "xray:PutTraceSegments", "xray:PutTelemetryRecords", "xray:GetSamplingRules", "xray:GetSamplingTargets", "xray:GetSamplingStatisticSummaries", "ssm:GetParameters" ], "Resource": "*" } ] } ``` - Role with a Trust Policy: ```json { "Version": "2012-10-17", "Statement": [ { "Effect": "Allow", "Principal": { "Federated": "arn:aws:iam::12345678910:oidc-provider/irsa-oidc-discovery-prod.s3.us-east-1.amazonaws.com" }, "Action": "sts:AssumeRoleWithWebIdentity", "Condition": { "StringEquals": { "irsa-oidc-discovery-prod.s3.us-east-1.amazonaws.com:aud": "sts.amazonaws.com" } } }, { "Sid": "Statement1", "Effect": "Allow", "Principal": { "AWS": "arn:aws:iam::12345678910:role/my-exporter-role" }, "Action": "sts:AssumeRole" } ] } ``` 1. Click `Add role`. When you use CloudWatch credentials, you link an Identity and Access Management (IAM) user with access to CloudWatch only with your Tiger Cloud service: 1. Retrieve the user information from [IAM > Users in AWS console][list-iam-users]. If you do not have an AWS user with access restricted to CloudWatch only, [create one][create-an-iam-user]. For more information, see [Creating IAM users (console)][aws-access-keys]. 1. Enter the credentials for the AWS IAM user. AWS keys give access to your AWS services. To keep your AWS account secure, restrict users to the minimum required permissions. Always store your keys in a safe location. To avoid this issue, use the IAM role authentication method. 1. Select the AWS Region your CloudWatch services run in, then click `Create exporter`. ===== PAGE: https://docs.tigerdata.com/_queries/getting-started-srt-candlestick/ ===== SELECT time_bucket('1 day', "time") AS day, symbol, max(price) AS high, first(price, time) AS open, last(price, time) AS close, min(price) AS low FROM stocks_real_time srt GROUP BY day, symbol ORDER BY day DESC, symbol LIMIT 10; -- Output day | symbol | high | open | close | low -----------------------+--------+--------------+----------+----------+-------------- 2023-06-07 00:00:00+00 | AAPL | 179.25 | 178.91 | 179.04 | 178.17 2023-06-07 00:00:00+00 | ABNB | 117.99 | 117.4 | 117.9694 | 117 2023-06-07 00:00:00+00 | AMAT | 134.8964 | 133.73 | 134.8964 | 133.13 2023-06-07 00:00:00+00 | AMD | 125.33 | 124.11 | 125.13 | 123.82 2023-06-07 00:00:00+00 | AMZN | 127.45 | 126.22 | 126.69 | 125.81 ... ===== PAGE: https://docs.tigerdata.com/_queries/getting-started-crypto-cagg/ ===== SELECT * FROM assets_candlestick_daily ORDER BY day DESC, symbol LIMIT 10; -- Output day | symbol | high | open | close | low -----------------------+--------+----------+--------+----------+---------- 2025-01-30 00:00:00+00 | ADA/USD | 0.9708 | 0.9396 | 0.9607 | 0.9365 2025-01-30 00:00:00+00 | ATOM/USD | 6.114 | 5.825 | 6.063 | 5.776 2025-01-30 00:00:00+00 | AVAX/USD | 34.1 | 32.8 | 33.95 | 32.44 2025-01-30 00:00:00+00 | BNB/USD | 679.3 | 668.12 | 677.81 | 666.08 2025-01-30 00:00:00+00 | BTC/USD | 105595.65 | 103735.84 | 105157.21 | 103298.84 2025-01-30 00:00:00+00 | CRO/USD | 0.13233 | 0.12869 | 0.13138 | 0.12805 2025-01-30 00:00:00+00 | DAI/USD | 1 | 1 | 0.9999 | 0.99989998 2025-01-30 00:00:00+00 | DOGE/USD | 0.33359 | 0.32392 | 0.33172 | 0.32231 2025-01-30 00:00:00+00 | DOT/USD | 6.01 | 5.779 | 6.004 | 5.732 2025-01-30 00:00:00+00 | ETH/USD | 3228.9 | 3113.36 | 3219.25 | 3092.92 (10 rows) ===== PAGE: https://docs.tigerdata.com/_queries/getting-started-cagg-tesla/ ===== SELECT * FROM stock_candlestick_daily WHERE symbol='TSLA' ORDER BY day DESC LIMIT 10; -- Output day | symbol | high | open | close | low -----------------------+--------+----------+----------+----------+---------- 2023-07-31 00:00:00+00 | TSLA | 269 | 266.42 | 266.995 | 263.8422 2023-07-28 00:00:00+00 | TSLA | 267.4 | 259.32 | 266.8 | 258.06 2023-07-27 00:00:00+00 | TSLA | 269.98 | 268.3 | 256.8 | 241.5539 2023-07-26 00:00:00+00 | TSLA | 271.5168 | 265.48 | 265.3283 | 258.0418 2023-07-25 00:00:00+00 | TSLA | 270.22 | 267.5099 | 264.55 | 257.21 2023-07-20 00:00:00+00 | TSLA | 267.58 | 267.34 | 260.6 | 247.4588 2023-07-14 00:00:00+00 | TSLA | 285.27 | 277.29 | 281.7 | 264.7567 2023-07-13 00:00:00+00 | TSLA | 290.0683 | 274.07 | 277.4509 | 270.6127 2023-07-12 00:00:00+00 | TSLA | 277.68 | 271.26 | 272.94 | 258.0418 2023-07-11 00:00:00+00 | TSLA | 271.44 | 270.83 | 269.8303 | 266.3885 (10 rows) ===== PAGE: https://docs.tigerdata.com/_queries/getting-started-srt-4-days/ ===== SELECT * FROM stocks_real_time srt LIMIT 10; -- Output time | symbol | price | day_volume -----------------------+--------+----------+------------ 2023-07-31 16:32:16+00 | PEP | 187.755 | 1618189 2023-07-31 16:32:16+00 | TSLA | 268.275 | 51902030 2023-07-31 16:32:16+00 | INTC | 36.035 | 22736715 2023-07-31 16:32:15+00 | CHTR | 402.27 | 626719 2023-07-31 16:32:15+00 | TSLA | 268.2925 | 51899210 2023-07-31 16:32:15+00 | AMD | 113.72 | 29136618 2023-07-31 16:32:15+00 | NVDA | 467.72 | 13951198 2023-07-31 16:32:15+00 | AMD | 113.72 | 29137753 2023-07-31 16:32:15+00 | RTX | 87.74 | 4295687 2023-07-31 16:32:15+00 | RTX | 87.74 | 4295907 (10 rows) ===== PAGE: https://docs.tigerdata.com/_queries/getting-started-srt-bucket-first-last/ ===== SELECT time_bucket('1 hour', time) AS bucket, first(price,time), last(price, time) FROM stocks_real_time srt WHERE time > now() - INTERVAL '4 days' GROUP BY bucket; -- Output bucket | first | last ------------------------+--------+-------- 2023-08-07 08:00:00+00 | 88.75 | 182.87 2023-08-07 09:00:00+00 | 140.85 | 35.16 2023-08-07 10:00:00+00 | 182.89 | 52.58 2023-08-07 11:00:00+00 | 86.69 | 255.15 ===== PAGE: https://docs.tigerdata.com/_queries/getting-started-srt-orderby/ ===== SELECT * FROM stocks_real_time srt WHERE symbol='TSLA' ORDER BY time DESC LIMIT 10; -- Output time | symbol | price | day_volume -----------------------+--------+----------+------------ 2025-01-30 00:51:00+00 | TSLA | 405.32 | NULL 2025-01-30 00:41:00+00 | TSLA | 406.05 | NULL 2025-01-30 00:39:00+00 | TSLA | 406.25 | NULL 2025-01-30 00:32:00+00 | TSLA | 406.02 | NULL 2025-01-30 00:32:00+00 | TSLA | 406.10 | NULL 2025-01-30 00:25:00+00 | TSLA | 405.95 | NULL 2025-01-30 00:24:00+00 | TSLA | 406.04 | NULL 2025-01-30 00:24:00+00 | TSLA | 406.04 | NULL 2025-01-30 00:22:00+00 | TSLA | 406.38 | NULL 2025-01-30 00:21:00+00 | TSLA | 405.77 | NULL (10 rows) ===== PAGE: https://docs.tigerdata.com/_queries/getting-started-cagg/ ===== SELECT * FROM stock_candlestick_daily ORDER BY day DESC, symbol LIMIT 10; -- Output day | symbol | high | open | close | low -----------------------+--------+----------+--------+----------+---------- 2023-07-31 00:00:00+00 | AAPL | 196.71 | 195.9 | 196.1099 | 195.2699 2023-07-31 00:00:00+00 | ABBV | 151.25 | 151.25 | 148.03 | 148.02 2023-07-31 00:00:00+00 | ABNB | 154.95 | 153.43 | 152.95 | 151.65 2023-07-31 00:00:00+00 | ABT | 113 | 112.4 | 111.49 | 111.44 2023-07-31 00:00:00+00 | ADBE | 552.87 | 536.74 | 550.835 | 536.74 2023-07-31 00:00:00+00 | AMAT | 153.9786 | 152.5 | 151.84 | 150.52 2023-07-31 00:00:00+00 | AMD | 114.57 | 113.47 | 113.15 | 112.35 2023-07-31 00:00:00+00 | AMGN | 237 | 236.61 | 233.6 | 233.515 2023-07-31 00:00:00+00 | AMT | 191.69 | 189.75 | 190.55 | 188.97 2023-07-31 00:00:00+00 | AMZN | 133.89 | 132.42 | 133.055 | 132.32 (10 rows) ===== PAGE: https://docs.tigerdata.com/_queries/getting-started-srt-aggregation/ ===== SELECT time_bucket('1 day', time) AS bucket, symbol, max(price) AS high, first(price, time) AS open, last(price, time) AS close, min(price) AS low FROM stocks_real_time srt WHERE time > now() - INTERVAL '1 week' GROUP BY bucket, symbol ORDER BY bucket, symbol LIMIT 10; -- Output day | symbol | high | open | close | low -----------------------+--------+--------------+----------+----------+-------------- 2023-06-07 00:00:00+00 | AAPL | 179.25 | 178.91 | 179.04 | 178.17 2023-06-07 00:00:00+00 | ABNB | 117.99 | 117.4 | 117.9694 | 117 2023-06-07 00:00:00+00 | AMAT | 134.8964 | 133.73 | 134.8964 | 133.13 2023-06-07 00:00:00+00 | AMD | 125.33 | 124.11 | 125.13 | 123.82 2023-06-07 00:00:00+00 | AMZN | 127.45 | 126.22 | 126.69 | 125.81 ... ===== PAGE: https://docs.tigerdata.com/_queries/getting-started-srt-first-last/ ===== SELECT symbol, first(price,time), last(price, time) FROM stocks_real_time srt WHERE time > now() - INTERVAL '4 days' GROUP BY symbol ORDER BY symbol LIMIT 10; -- Output symbol | first | last -------+----------+---------- AAPL | 179.0507 | 179.04 ABNB | 118.83 | 117.9694 AMAT | 133.55 | 134.8964 AMD | 122.6476 | 125.13 AMZN | 126.5599 | 126.69 ... ===== PAGE: https://docs.tigerdata.com/_queries/getting-started-crypto-srt-orderby/ ===== SELECT * FROM crypto_ticks srt WHERE symbol='ETH/USD' ORDER BY time DESC LIMIT 10; -- Output time | symbol | price | day_volume -----------------------+--------+----------+------------ 2025-01-30 12:05:09+00 | ETH/USD | 3219.25 | 39425 2025-01-30 12:05:00+00 | ETH/USD | 3219.26 | 39425 2025-01-30 12:04:42+00 | ETH/USD | 3219.26 | 39459 2025-01-30 12:04:33+00 | ETH/USD | 3219.91 | 39458 2025-01-30 12:04:15+00 | ETH/USD | 3219.6 | 39458 2025-01-30 12:04:06+00 | ETH/USD | 3220.68 | 39458 2025-01-30 12:03:57+00 | ETH/USD | 3220.68 | 39483 2025-01-30 12:03:48+00 | ETH/USD | 3220.12 | 39483 2025-01-30 12:03:20+00 | ETH/USD | 3219.79 | 39482 2025-01-30 12:03:11+00 | ETH/USD | 3220.06 | 39472 (10 rows) ===== PAGE: https://docs.tigerdata.com/_queries/getting-started-week-average/ ===== SELECT time_bucket('1 day', time) AS bucket, symbol, avg(price) FROM stocks_real_time srt WHERE time > now() - INTERVAL '1 week' GROUP BY bucket, symbol ORDER BY bucket, symbol LIMIT 10; -- Output bucket | symbol | avg -----------------------+--------+-------------------- 2023-06-01 00:00:00+00 | AAPL | 179.3242530284364 2023-06-01 00:00:00+00 | ABNB | 112.05498586371293 2023-06-01 00:00:00+00 | AMAT | 134.41263567849518 2023-06-01 00:00:00+00 | AMD | 119.43332772033834 2023-06-01 00:00:00+00 | AMZN | 122.3446364966392 ... ===== PAGE: https://docs.tigerdata.com/integrations/corporate-data-center/ ===== # Integrate your data center with Tiger Cloud This page explains how to integrate your corporate on-premise infrastructure with Tiger Cloud using [AWS Transit Gateway][aws-transit-gateway]. ## Prerequisites To follow the steps on this page: * Create a target [Tiger Cloud service][create-service] with the Real-time analytics capability. You need your [connection details][connection-info]. - Set up [AWS Transit Gateway][gtw-setup]. ## Connect your on-premise infrastructure to your Tiger Cloud services To connect to Tiger Cloud: 1. **Connect your infrastructure to AWS Transit Gateway** Establish connectivity between your on-premise infrastructure and AWS. See the [Centralize network connectivity using AWS Transit Gateway][aws-onprem]. 1. **Create a Peering VPC in [Tiger Cloud Console][console-login]** 1. In `Security` > `VPC`, click `Create a VPC`:  1. Choose your region and IP range, name your VPC, then click `Create VPC`:  Your service and Peering VPC must be in the same AWS region. The number of Peering VPCs you can create in your project depends on your [pricing plan][pricing-plans]. If you need another Peering VPC, either contact [support@tigerdata.com](mailto:support@tigerdata.com) or change your plan in [Tiger Cloud Console][console-login]. 1. Add a peering connection: 1. In the `VPC Peering` column, click `Add`. 1. Provide your AWS account ID, Transit Gateway ID, CIDR ranges, and AWS region. Tiger Cloud creates a new isolated connection for every unique Transit Gateway ID.  1. Click `Add connection`. 1. **Accept and configure peering connection in your AWS account** Once your peering connection appears as `Processing`, you can accept and configure it in AWS: 1. Accept the peering request coming from Tiger Cloud. The request can take up to 5 min to arrive. Within 5 more minutes after accepting, the peering should appear as `Connected` in Tiger Cloud Console. 1. Configure at least the following in your AWS account networking: - Your subnet route table to route traffic to your Transit Gateway for the Peering VPC CIDRs. - Your Transit Gateway route table to route traffic to the newly created Transit Gateway peering attachment for the Peering VPC CIDRs. - Security groups to allow outbound TCP 5432. 1. **Attach a Tiger Cloud service to the Peering VPC In [Tiger Cloud Console][console-services]** 1. Select the service you want to connect to the Peering VPC. 1. Click `Operations` > `Security` > `VPC`. 1. Select the VPC, then click `Attach VPC`. You cannot attach a Tiger Cloud service to multiple Tiger Cloud VPCs at the same time. You have successfully integrated your Microsoft Azure infrastructure with Tiger Cloud. ===== PAGE: https://docs.tigerdata.com/integrations/cloudwatch/ ===== # Integrate Amazon CloudWatch with Tiger Cloud [Amazon CloudWatch][cloudwatch] is a monitoring and observability service designed to help collect, analyze, and act on data from applications, infrastructure, and services running in AWS and on-premises environments. You can export telemetry data from your Tiger Cloud services with the time-series and analytics capability enabled to CloudWatch. The available metrics include CPU usage, RAM usage, and storage. This integration is available for [Scale and Enterprise][pricing-plan-features] pricing tiers. This pages explains how to export telemetry data from your Tiger Cloud service into CloudWatch by creating a Tiger Cloud data exporter, then attaching it to the service. ## Prerequisites To follow the steps on this page: * Create a target [Tiger Cloud service][create-service] with the Real-time analytics capability. You need your [connection details][connection-info]. - Sign up for [Amazon CloudWatch][cloudwatch-signup]. ## Create a data exporter A Tiger Cloud data exporter sends telemetry data from a Tiger Cloud service to a third-party monitoring tool. You create an exporter on the [project level][projects], in the same AWS region as your service: 1. **In Tiger Cloud Console, open [Exporters][console-integrations]** 1. **Click `New exporter`** 1. **Select the data type and specify `AWS CloudWatch` for provider**  1. **Provide your AWS CloudWatch configuration** - The AWS region must be the same for your Tiger Cloud exporter and AWS CloudWatch Log group. - The exporter name appears in Tiger Cloud Console, best practice is to make this name easily understandable. - For CloudWatch credentials, either use an [existing CloudWatch Log group][console-cloudwatch-configuration] or [create a new one][console-cloudwatch-create-group]. If you're uncertain, use the default values. For more information, see [Working with log groups and log streams][cloudwatch-log-naming]. 1. **Choose the authentication method to use for the exporter**  1. In AWS, navigate to [IAM > Identity providers][create-an-iam-id-provider], then click `Add provider`. 1. Update the new identity provider with your details: Set `Provider URL` to the [region where you are creating your exporter][reference].  1. Click `Add provider`. 1. In AWS, navigate to [IAM > Roles][add-id-provider-as-wi-role], then click `Create role`. 1. Add your identity provider as a Web identity role and click `Next`.  1. Set the following permission and trust policies: - Permission policy: ```json { "Version": "2012-10-17", "Statement": [ { "Effect": "Allow", "Action": [ "logs:PutLogEvents", "logs:CreateLogGroup", "logs:CreateLogStream", "logs:DescribeLogStreams", "logs:DescribeLogGroups", "logs:PutRetentionPolicy", "xray:PutTraceSegments", "xray:PutTelemetryRecords", "xray:GetSamplingRules", "xray:GetSamplingTargets", "xray:GetSamplingStatisticSummaries", "ssm:GetParameters" ], "Resource": "*" } ] } ``` - Role with a Trust Policy: ```json { "Version": "2012-10-17", "Statement": [ { "Effect": "Allow", "Principal": { "Federated": "arn:aws:iam::12345678910:oidc-provider/irsa-oidc-discovery-prod.s3.us-east-1.amazonaws.com" }, "Action": "sts:AssumeRoleWithWebIdentity", "Condition": { "StringEquals": { "irsa-oidc-discovery-prod.s3.us-east-1.amazonaws.com:aud": "sts.amazonaws.com" } } }, { "Sid": "Statement1", "Effect": "Allow", "Principal": { "AWS": "arn:aws:iam::12345678910:role/my-exporter-role" }, "Action": "sts:AssumeRole" } ] } ``` 1. Click `Add role`. When you use CloudWatch credentials, you link an Identity and Access Management (IAM) user with access to CloudWatch only with your Tiger Cloud service: 1. Retrieve the user information from [IAM > Users in AWS console][list-iam-users]. If you do not have an AWS user with access restricted to CloudWatch only, [create one][create-an-iam-user]. For more information, see [Creating IAM users (console)][aws-access-keys]. 1. Enter the credentials for the AWS IAM user. AWS keys give access to your AWS services. To keep your AWS account secure, restrict users to the minimum required permissions. Always store your keys in a safe location. To avoid this issue, use the IAM role authentication method. 1. Select the AWS Region your CloudWatch services run in, then click `Create exporter`. ### Attach a data exporter to a Tiger Cloud service To send telemetry data to an external monitoring tool, you attach a data exporter to your Tiger Cloud service. You can attach only one exporter to a service. To attach an exporter: 1. **In [Tiger Cloud Console][console-services], choose the service** 1. **Click `Operations` > `Exporters`** 1. **Select the exporter, then click `Attach exporter`** 1. **If you are attaching a first `Logs` data type exporter, restart the service** ### Monitor Tiger Cloud service metrics You can now monitor your service metrics. Use the following metrics to check the service is running correctly: * `timescale.cloud.system.cpu.usage.millicores` * `timescale.cloud.system.cpu.total.millicores` * `timescale.cloud.system.memory.usage.bytes` * `timescale.cloud.system.memory.total.bytes` * `timescale.cloud.system.disk.usage.bytes` * `timescale.cloud.system.disk.total.bytes` Additionally, use the following tags to filter your results. |Tag|Example variable| Description | |-|-|----------------------------| |`host`|`us-east-1.timescale.cloud`| | |`project-id`|| | |`service-id`|| | |`region`|`us-east-1`| AWS region | |`role`|`replica` or `primary`| For service with replicas | |`node-id`|| For multi-node services | ### Edit a data exporter To update a data exporter: 1. **In Tiger Cloud Console, open [Exporters][console-integrations]** 1. **Next to the exporter you want to edit, click the menu > `Edit`** 1. **Edit the exporter fields and save your changes** You cannot change fields such as the provider or the AWS region. ### Delete a data exporter To remove a data exporter that you no longer need: 1. **Disconnect the data exporter from your Tiger Cloud services** 1. In [Tiger Cloud Console][console-services], choose the service. 1. Click `Operations` > `Exporters`. 1. Click the trash can icon. 1. Repeat for every service attached to the exporter you want to remove. The data exporter is now unattached from all services. However, it still exists in your project. 1. **Delete the exporter on the project level** 1. In Tiger Cloud Console, open [Exporters][console-integrations] 1. Next to the exporter you want to edit, click menu > `Delete` 1. Confirm that you want to delete the data exporter. ### Reference When you create the IAM OIDC provider, the URL must match the region you create the exporter in. It must be one of the following: | Region | Zone | Location | URL |------------------|---------------|----------------|--------------------| | `ap-southeast-1` | Asia Pacific | Singapore | `irsa-oidc-discovery-prod-ap-southeast-1.s3.ap-southeast-1.amazonaws.com` | `ap-southeast-2` | Asia Pacific | Sydney | `irsa-oidc-discovery-prod-ap-southeast-2.s3.ap-southeast-2.amazonaws.com` | `ap-northeast-1` | Asia Pacific | Tokyo | `irsa-oidc-discovery-prod-ap-northeast-1.s3.ap-northeast-1.amazonaws.com` | `ca-central-1` | Canada | Central | `irsa-oidc-discovery-prod-ca-central-1.s3.ca-central-1.amazonaws.com` | `eu-central-1` | Europe | Frankfurt | `irsa-oidc-discovery-prod-eu-central-1.s3.eu-central-1.amazonaws.com` | `eu-west-1` | Europe | Ireland | `irsa-oidc-discovery-prod-eu-west-1.s3.eu-west-1.amazonaws.com` | `eu-west-2` | Europe | London | `irsa-oidc-discovery-prod-eu-west-2.s3.eu-west-2.amazonaws.com` | `sa-east-1` | South America | São Paulo | `irsa-oidc-discovery-prod-sa-east-1.s3.sa-east-1.amazonaws.com` | `us-east-1` | United States | North Virginia | `irsa-oidc-discovery-prod.s3.us-east-1.amazonaws.com` | `us-east-2` | United States | Ohio | `irsa-oidc-discovery-prod-us-east-2.s3.us-east-2.amazonaws.com` | `us-west-2` | United States | Oregon | `irsa-oidc-discovery-prod-us-west-2.s3.us-west-2.amazonaws.com` ===== PAGE: https://docs.tigerdata.com/integrations/pgadmin/ ===== # Integrate pgAdmin with Tiger [pgAdmin][pgadmin] is a feature-rich open-source administration and development platform for Postgres. It is available for Chrome, Firefox, Edge, and Safari browsers, or can be installed on Microsoft Windows, Apple macOS, or various Linux flavors.  This page explains how to integrate pgAdmin with your Tiger Cloud service. ## Prerequisites To follow the steps on this page: * Create a target [Tiger Cloud service][create-service] with the Real-time analytics capability. You need [your connection details][connection-info]. This procedure also works for [self-hosted TimescaleDB][enable-timescaledb]. - [Download][download-pgadmin] and install pgAdmin. ## Connect pgAdmin to your Tiger Cloud service To connect to Tiger Cloud: 1. **Start pgAdmin** 1. **In the `Quick Links` section of the `Dashboard` tab, click `Add New Server`** 1. **In `Register - Server` > `General`, fill in the `Name` and `Comments` fields with the server name and description, respectively** 1. **Configure the connection** 1. In the `Connection` tab, configure the connection using your [connection details][connection-info]. 1. If you configured your service to connect using a [stricter SSL mode][ssl-mode], then in the `SSL` tab check `Use SSL`, set `SSL mode` to the configured mode, and in the `CA Certificate` field type the location of the SSL root CA certificate to use. 1. **Click `Save`** You have successfully integrated pgAdmin with Tiger Cloud. ===== PAGE: https://docs.tigerdata.com/integrations/kubernetes/ ===== # Integrate Kubernetes with Tiger [Kubernetes][kubernetes] is an open-source container orchestration system that automates the deployment, scaling, and management of containerized applications. You can connect Kubernetes to Tiger Cloud, and deploy TimescaleDB within your Kubernetes clusters. This guide explains how to connect a Kubernetes cluster to Tiger Cloud, configure persistent storage, and deploy TimescaleDB in your kubernetes cluster. ## Prerequisites To follow the steps on this page: - Install [self-managed Kubernetes][kubernetes-install] or sign up for a Kubernetes [Turnkey Cloud Solution][kubernetes-managed]. - Install [kubectl][kubectl] for command-line interaction with your cluster. ## Integrate TimescaleDB in a Kubernetes cluster To connect your Kubernetes cluster to your Tiger Cloud service: 1. **Create a default namespace for your Tiger Cloud components** 1. Create a namespace: ```shell kubectl create namespace timescale ``` 1. Set this namespace as the default for your session: ```shell kubectl config set-context --current --namespace=timescale ``` For more information, see [Kubernetes Namespaces][kubernetes-namespace]. 1. **Create a Kubernetes secret that stores your Tiger Cloud service credentials** Update the following command with your [connection details][connection-info], then run it: ```shell kubectl create secret generic timescale-secret \ --from-literal=PGHOST=<host> \ --from-literal=PGPORT=<port> \ --from-literal=PGDATABASE=<dbname> \ --from-literal=PGUSER=<user> \ --from-literal=PGPASSWORD=<password> ``` 1. **Configure network access to Tiger Cloud** - **Managed Kubernetes**: outbound connections to external databases like Tiger Cloud work by default. Make sure your cluster’s security group or firewall rules allow outbound traffic to Tiger Cloud IP. - **Self-hosted Kubernetes**: If your cluster is behind a firewall or running on-premise, you may need to allow egress traffic to Tiger Cloud. Test connectivity using your [connection details][connection-info]: ```shell nc -zv <host> <port> ``` If the connection fails, check your firewall rules. 1. **Create a Kubernetes deployment that can access your Tiger Cloud** Run the following command to apply the deployment: ```shell kubectl apply -f - <<EOF apiVersion: apps/v1 kind: Deployment metadata: name: timescale-app spec: replicas: 1 selector: matchLabels: app: timescale-app template: metadata: labels: app: timescale-app spec: containers: - name: timescale-container image: postgres:latest envFrom: - secretRef: name: timescale-secret EOF ``` 1. **Test the connection** 1. Create and run a pod that uses the [connection details][connection-info] you added to `timescale-secret` in the `timescale` namespace: ```shell kubectl run test-pod --image=postgres --restart=Never \ --env="PGHOST=$(kubectl get secret timescale-secret -o=jsonpath='{.data.PGHOST}' | base64 --decode)" \ --env="PGPORT=$(kubectl get secret timescale-secret -o=jsonpath='{.data.PGPORT}' | base64 --decode)" \ --env="PGDATABASE=$(kubectl get secret timescale-secret -o=jsonpath='{.data.PGDATABASE}' | base64 --decode)" \ --env="PGUSER=$(kubectl get secret timescale-secret -o=jsonpath='{.data.PGUSER}' | base64 --decode)" \ --env="PGPASSWORD=$(kubectl get secret timescale-secret -o=jsonpath='{.data.PGPASSWORD}' | base64 --decode)" \ -- sleep infinity ``` 2. Launch a psql shell in the `test-pod` you just created: ```shell kubectl exec -it test-pod -- bash -c "psql -h \$PGHOST -U \$PGUSER -d \$PGDATABASE" ``` You start a `psql` session connected to your Tiger Cloud service. Running TimescaleDB on Kubernetes is similar to running Postgres. This procedure outlines the steps for a non-distributed system. To connect your Kubernetes cluster to self-hosted TimescaleDB running in the cluster: 1. **Create a default namespace for Tiger Data components** 1. Create the Tiger Data namespace: ```shell kubectl create namespace timescale ``` 1. Set this namespace as the default for your session: ```shell kubectl config set-context --current --namespace=timescale ``` For more information, see [Kubernetes Namespaces][kubernetes-namespace]. 1. **Set up a persistent volume claim (PVC) storage** To manually set up a persistent volume and claim for self-hosted Kubernetes, run the following command:yaml kubectl apply -f - <<EOF apiVersion: v1 kind: PersistentVolumeClaim metadata:
name: timescale-pvcspec:
accessModes: - ReadWriteOnce resources: requests: storage: 10GiEOF
1. **Deploy TimescaleDB as a StatefulSet** By default, the [TimescaleDB Docker image][timescale-docker-image] you are installing on Kubernetes uses the default Postgres database, user and password. To deploy TimescaleDB on Kubernetes, run the following command: ```yaml kubectl apply -f - <<EOF apiVersion: apps/v1 kind: StatefulSet metadata: name: timescaledb spec: serviceName: timescaledb replicas: 1 selector: matchLabels: app: timescaledb template: metadata: labels: app: timescaledb spec: containers: - name: timescaledb image: 'timescale/timescaledb:latest-pg17' env: - name: POSTGRES_USER value: postgres - name: POSTGRES_PASSWORD value: postgres - name: POSTGRES_DB value: postgres - name: PGDATA value: /var/lib/postgresql/data/pgdata ports: - containerPort: 5432 volumeMounts: - mountPath: /var/lib/postgresql/data name: timescale-storage volumes: - name: timescale-storage persistentVolumeClaim: claimName: timescale-pvc EOF ``` 1. **Allow applications to connect by exposing TimescaleDB within Kubernetes**yaml kubectl apply -f - <<EOF apiVersion: v1 kind: Service metadata:
name: timescaledbspec:
selector: app: timescaledb ports: - protocol: TCP port: 5432 targetPort: 5432 type: ClusterIPEOF
1. **Create a Kubernetes secret to store the database credentials**shell kubectl create secret generic timescale-secret \ --from-literal=PGHOST=timescaledb \ --from-literal=PGPORT=5432 \ --from-literal=PGDATABASE=postgres \ --from-literal=PGUSER=postgres \ --from-literal=PGPASSWORD=postgres
1. **Deploy an application that connects to TimescaleDB** ```shell kubectl apply -f - <<EOF apiVersion: apps/v1 kind: Deployment metadata: name: timescale-app spec: replicas: 1 selector: matchLabels: app: timescale-app template: metadata: labels: app: timescale-app spec: containers: - name: timescale-container image: postgres:latest envFrom: - secretRef: name: timescale-secret EOF ``` 1. **Test the database connection** 1. Create and run a pod to verify database connectivity using your [connection details][connection-info] saved in `timescale-secret`: ```shell kubectl run test-pod --image=postgres --restart=Never \ --env="PGHOST=$(kubectl get secret timescale-secret -o=jsonpath='{.data.PGHOST}' | base64 --decode)" \ --env="PGPORT=$(kubectl get secret timescale-secret -o=jsonpath='{.data.PGPORT}' | base64 --decode)" \ --env="PGDATABASE=$(kubectl get secret timescale-secret -o=jsonpath='{.data.PGDATABASE}' | base64 --decode)" \ --env="PGUSER=$(kubectl get secret timescale-secret -o=jsonpath='{.data.PGUSER}' | base64 --decode)" \ --env="PGPASSWORD=$(kubectl get secret timescale-secret -o=jsonpath='{.data.PGPASSWORD}' | base64 --decode)" \ -- sleep infinity ``` 1. Launch the Postgres interactive shell within the created `test-pod`: ```shell kubectl exec -it test-pod -- bash -c "psql -h \$PGHOST -U \$PGUSER -d \$PGDATABASE" ``` You see the Postgres interactive terminal. You have successfully integrated Kubernetes with Tiger Cloud. ===== PAGE: https://docs.tigerdata.com/integrations/prometheus/ ===== # Integrate Prometheus with Tiger [Prometheus][prometheus] is an open-source monitoring system with a dimensional data model, flexible query language, and a modern alerting approach. This page shows you how to export your service telemetry to Prometheus: - For Tiger Cloud, using a dedicated Prometheus exporter in Tiger Cloud Console. - For self-hosted TimescaleDB, using [Postgres Exporter][postgresql-exporter]. ## Prerequisites To follow the steps on this page: - [Download and run Prometheus][install-prometheus]. - For Tiger Cloud: Create a target [Tiger Cloud service][create-service] with the time-series and analytics capability enabled. - For self-hosted TimescaleDB: - Create a target [self-hosted TimescaleDB][enable-timescaledb] instance. You need your [connection details][connection-info]. - [Install Postgres Exporter][install-exporter]. To reduce latency and potential data transfer costs, install Prometheus and Postgres Exporter on a machine in the same AWS region as your Tiger Cloud service. ## Export Tiger Cloud service telemetry to Prometheus To export your data, do the following: To export metrics from a Tiger Cloud service, you create a dedicated Prometheus exporter in Tiger Cloud Console, attach it to your service, then configure Prometheus to scrape metrics using the exposed URL. The Prometheus exporter exposes the metrics related to the Tiger Cloud service like CPU, memory, and storage. To scrape other metrics, use Postgres Exporter as described for self-hosted TimescaleDB. The Prometheus exporter is available for [Scale and Enterprise][pricing-plan-features] pricing plans. 1. **Create a Prometheus exporter** 1. In [Tiger Cloud Console][open-console], click `Exporters` > `+ New exporter`. 1. Select `Metrics` for data type and `Prometheus` for provider.  1. Choose the region for the exporter. Only services in the same project and region can be attached to this exporter. 1. Name your exporter. 1. Change the auto-generated Prometheus credentials, if needed. See [official documentation][prometheus-authentication] on basic authentication in Prometheus. 1. **Attach the exporter to a service** 1. Select a service, then click `Operations` > `Exporters`. 1. Select the exporter in the drop-down, then click `Attach exporter`.  The exporter is now attached to your service. To unattach it, click the trash icon in the exporter list.  1. **Configure the Prometheus scrape target** 1. Select your service, then click `Operations` > `Exporters` and click the information icon next to the exporter. You see the exporter details.  1. Copy the exporter URL. 1. In your Prometheus installation, update `prometheus.yml` to point to the exporter URL as a scrape target: ```yml scrape_configs: - job_name: "timescaledb-exporter" scheme: https static_configs: - targets: ["my-exporter-url"] basic_auth: username: "user" password: "pass" ``` See the [Prometheus documentation][scrape-targets] for details on configuring scrape targets. You can now monitor your service metrics. Use the following metrics to check the service is running correctly: * `timescale.cloud.system.cpu.usage.millicores` * `timescale.cloud.system.cpu.total.millicores` * `timescale.cloud.system.memory.usage.bytes` * `timescale.cloud.system.memory.total.bytes` * `timescale.cloud.system.disk.usage.bytes` * `timescale.cloud.system.disk.total.bytes` Additionally, use the following tags to filter your results. |Tag|Example variable| Description | |-|-|----------------------------| |`host`|`us-east-1.timescale.cloud`| | |`project-id`|| | |`service-id`|| | |`region`|`us-east-1`| AWS region | |`role`|`replica` or `primary`| For service with replicas | To export metrics from self-hosted TimescaleDB, you import telemetry data about your database to Postgres Exporter, then configure Prometheus to scrape metrics from it. Postgres Exporter exposes metrics that you define, excluding the system metrics. 1. **Create a user to access telemetry data about your database** 1. Connect to your database in [`psql`][psql] using your [connection details][connection-info]. 1. Create a user named `monitoring` with a secure password: ```sql CREATE USER monitoring WITH PASSWORD '<password>'; ``` 1. Grant the `pg_read_all_stats` permission to the `monitoring` user: ```sql GRANT pg_read_all_stats to monitoring; ``` 1. **Import telemetry data about your database to Postgres Exporter** 1. Connect Postgres Exporter to your database: Use your [connection details][connection-info] to import telemetry data about your database. You connect as the `monitoring` user: - Local installation: ```shell export DATA_SOURCE_NAME="postgres://<user>:<password>@<host>:<port>/<database>?sslmode=<sslmode>" ./postgres_exporter ``` - Docker: ```shell docker run -d \ -e DATA_SOURCE_NAME="postgres://<user>:<password>@<host>:<port>/<database>?sslmode=<sslmode>" \ -p 9187:9187 \ prometheuscommunity/postgres-exporter ``` 1. Check the metrics for your database in the Prometheus format: - Browser: Navigate to `http://<exporter-host>:9187/metrics`. - Command line: ```shell curl http://<exporter-host>:9187/metrics ``` 1. **Configure Prometheus to scrape metrics** 1. In your Prometheus installation, update `prometheus.yml` to point to your Postgres Exporter instance as a scrape target. In the following example, you replace `<exporter-host>` with the hostname or IP address of the PostgreSQL Exporter. ```yaml global: scrape_interval: 15s scrape_configs: - job_name: 'postgresql' static_configs: - targets: ['<exporter-host>:9187'] ``` If `prometheus.yml` has not been created during installation, create it manually. If you are using Docker, you can find the IPAddress in `Inspect` > `Networks` for the container running Postgres Exporter. 1. Restart Prometheus. 1. Check the Prometheus UI at `http://<prometheus-host>:9090/targets` and `http://<prometheus-host>:9090/tsdb-status`. You see the Postgres Exporter target and the metrics scraped from it. You can further [visualize your data][grafana-prometheus] with Grafana. Use the [Grafana Postgres dashboard][postgresql-exporter-dashboard] or [create a custom dashboard][grafana] that suits your needs. ===== PAGE: https://docs.tigerdata.com/integrations/psql/ ===== # Connect to a Tiger Cloud service with psql [`psql`][psql-docs] is a terminal-based frontend to Postgres that enables you to type in queries interactively, issue them to Postgres, and see the query results. This page shows you how to use the `psql` command line tool to interact with your Tiger Cloud service. ## Prerequisites To follow the steps on this page: * Create a target [Tiger Cloud service][create-service] with the Real-time analytics capability. You need [your connection details][connection-info]. This procedure also works for [self-hosted TimescaleDB][enable-timescaledb]. ## Check for an existing installation On many operating systems, `psql` is installed by default. To use the functionality described in this page, best practice is to use the latest version of `psql`. To check the version running on your system: <Terminal>bash psql --version
powershell wmic /output:C:\list.txt product get name, version
</Terminal> If you already have the latest version of `psql` installed, proceed to the [Connect to your service][connect-database] section. ## Install psql If there is no existing installation, take the following steps to install `psql`: Install using Homebrew. `libpqxx` is the official C++ client API for Postgres. 1. Install Homebrew, if you don't already have it: ```bash /bin/bash -c "$(curl -fsSL https://raw.githubusercontent.com/Homebrew/install/HEAD/install.sh)" ``` For more information about Homebrew, including installation instructions, see the [Homebrew documentation][homebrew]. 1. Make sure your Homebrew repository is up to date: ```bash brew doctor brew update ``` 1. Install `psql`: ```bash brew install libpq ``` 1. Update your path to include the `psql` tool: ```bash brew link --force libpq ``` On Intel chips, the symbolic link is added to `/usr/local/bin`. On Apple Silicon, the symbolic link is added to `/opt/homebrew/bin`. Install using MacPorts. `libpqxx` is the official C++ client API for Postgres. 1. [Install MacPorts][macports] by downloading and running the package installer. 1. Make sure MacPorts is up to date: ```bash sudo port selfupdate ``` 1. Install the latest version of `libpqxx`: ```bash sudo port install libpqxx ``` 1. View the files that were installed by `libpqxx`: ```bash port contents libpqxx ``` Install `psql` on Debian and Ubuntu with the `apt` package manager. 1. Make sure your `apt` repository is up to date: ```bash sudo apt-get update ``` 1. Install the `postgresql-client` package: ```bash sudo apt-get install postgresql-client ``` `psql` is installed by default when you install Postgres. This procedure uses the interactive installer provided by Postgres and EnterpriseDB. 1. Download and run the Postgres installer from [www.enterprisedb.com][windows-installer]. 1. In the `Select Components` dialog, check `Command Line Tools`, along with any other components you want to install, and click `Next`. 1. Complete the installation wizard to install the package. ## Connect to your service To use `psql` to connect to your service, you need the connection details. See [Find your connection details][connection-info]. Connect to your service with either: - The parameter flags:bash psql -h -p -U -W -d
- The service URL:bash psql "postgres://@:/?sslmode=require"
You are prompted to provide the password. - The service URL with the password already included and [a stricter SSL mode][ssl-mode] enabled:bash psql "postgres://:@:/?sslmode=verify-full"
## Useful psql commands When you start using `psql`, these are the commands you are likely to use most frequently: |Command|Description| |-|-| |`\c <DB_NAME>`|Connect to a new database| |`\d `|Show the details of a table| |`\df`|List functions in the current database| |`\df+`|List all functions with more details| |`\di`|List all indexes from all tables| |`\dn`|List all schemas in the current database| |`\dt`|List available tables| |`\du`|List Postgres database roles| |`\dv`|List views in current schema| |`\dv+`|List all views with more details| |`\dx`|Show all installed extensions| |`ef <FUNCTION_NAME>`|Edit a function| |`\h`|Show help on syntax of SQL commands| |`\l`|List available databases| |`\password <USERNAME>`|Change the password for the user| |`\q`|Quit `psql`| |`\set`|Show system variables list| |`\timing`|Show how long a query took to execute| |`\x`|Show expanded query results| |`\?`|List all `psql` slash commands| For more on `psql` commands, see the [Tiger Data psql cheat sheet][psql-cheat-sheet] and [psql documentation][psql-docs]. ## Save query results to a file When you run queries in `psql`, the results are shown in the terminal by default. If you are running queries that have a lot of results, you might like to save the results into a comma-separated `.csv` file instead. You can do this using the `COPY` command. For example:sql \copy (SELECT * FROM ...) TO '/tmp/output.csv' (format CSV);
This command sends the results of the query to a new file called `output.csv` in the `/tmp/` directory. You can open the file using any spreadsheet program. ## Run long queries To run multi-line queries in `psql`, use the `EOF` delimiter. For example:sql psql -d target -f -v hypertable= - <<'EOF' SELECT public.alter_job(j.id, scheduled=>true) FROM _timescaledb_config.bgw_job j JOIN _timescaledb_catalog.hypertable h ON h.id = j.hypertable_id WHERE j.proc_schema IN ('_timescaledb_internal', '_timescaledb_functions') AND j.proc_name = 'policy_columnstore' AND j.id >= 1000 AND format('%I.%I', h.schema_name, h.table_name)::text::regclass = :'hypertable'::text::regclass; EOF
## Edit queries in a text editor Sometimes, queries can get very long, and you might make a mistake when you try typing it the first time around. If you have made a mistake in a long query, instead of retyping it, you can use a built-in text editor, which is based on `Vim`. Launch the query editor with the `\e` command. Your previous query is loaded into the editor. When you have made your changes, press `Esc`, then type `:`+`w`+`q` to save the changes, and return to the command prompt. Access the edited query by pressing `↑`, and press `Enter` to run it. ===== PAGE: https://docs.tigerdata.com/integrations/google-cloud/ ===== # Integrate Google Cloud with Tiger Cloud [Google Cloud][google-cloud] is a suite of cloud computing services, offering scalable infrastructure, AI, analytics, databases, security, and developer tools to help businesses build, deploy, and manage applications. This page explains how to integrate your Google Cloud infrastructure with Tiger Cloud using [AWS Transit Gateway][aws-transit-gateway]. ## Prerequisites To follow the steps on this page: * Create a target [Tiger Cloud service][create-service] with the Real-time analytics capability. You need your [connection details][connection-info]. - Set up [AWS Transit Gateway][gtw-setup]. ## Connect your Google Cloud infrastructure to your Tiger Cloud services To connect to Tiger Cloud: 1. **Connect your infrastructure to AWS Transit Gateway** Establish connectivity between Google Cloud and AWS. See [Connect HA VPN to AWS peer gateways][gcp-aws]. 1. **Create a Peering VPC in [Tiger Cloud Console][console-login]** 1. In `Security` > `VPC`, click `Create a VPC`:  1. Choose your region and IP range, name your VPC, then click `Create VPC`:  Your service and Peering VPC must be in the same AWS region. The number of Peering VPCs you can create in your project depends on your [pricing plan][pricing-plans]. If you need another Peering VPC, either contact [support@tigerdata.com](mailto:support@tigerdata.com) or change your plan in [Tiger Cloud Console][console-login]. 1. Add a peering connection: 1. In the `VPC Peering` column, click `Add`. 1. Provide your AWS account ID, Transit Gateway ID, CIDR ranges, and AWS region. Tiger Cloud creates a new isolated connection for every unique Transit Gateway ID.  1. Click `Add connection`. 1. **Accept and configure peering connection in your AWS account** Once your peering connection appears as `Processing`, you can accept and configure it in AWS: 1. Accept the peering request coming from Tiger Cloud. The request can take up to 5 min to arrive. Within 5 more minutes after accepting, the peering should appear as `Connected` in Tiger Cloud Console. 1. Configure at least the following in your AWS account networking: - Your subnet route table to route traffic to your Transit Gateway for the Peering VPC CIDRs. - Your Transit Gateway route table to route traffic to the newly created Transit Gateway peering attachment for the Peering VPC CIDRs. - Security groups to allow outbound TCP 5432. 1. **Attach a Tiger Cloud service to the Peering VPC In [Tiger Cloud Console][console-services]** 1. Select the service you want to connect to the Peering VPC. 1. Click `Operations` > `Security` > `VPC`. 1. Select the VPC, then click `Attach VPC`. You cannot attach a Tiger Cloud service to multiple Tiger Cloud VPCs at the same time. You have successfully integrated your Google Cloud infrastructure with Tiger Cloud. ===== PAGE: https://docs.tigerdata.com/integrations/troubleshooting/ ===== # Troubleshooting ## JDBC authentication type is not supported When connecting to Tiger Cloud service with a Java Database Connectivity (JDBC) driver, you might get this error message:text Check that your connection definition references your JDBC database with correct URL syntax, username, and password. The authentication type 10 is not supported.
Your Tiger Cloud authentication type doesn't match your JDBC driver's supported authentication types. The recommended approach is to upgrade your JDBC driver to a version that supports `scram-sha-256` encryption. If that isn't an option, you can change the authentication type for your Tiger Cloud service to `md5`. Note that `md5` is less secure, and is provided solely for compatibility with older clients. For information on changing your authentication type, see the documentation on [resetting your service password][password-reset]. ===== PAGE: https://docs.tigerdata.com/integrations/datadog/ ===== # Integrate Datadog with Tiger Cloud [Datadog][datadog] is a cloud-based monitoring and analytics platform that provides comprehensive visibility into applications, infrastructure, and systems through real-time monitoring, logging, and analytics. This page explains how to: - [Monitor Tiger Cloud service metrics with Datadog][datadog-monitor-cloud] This integration is available for [Scale and Enterprise][pricing-plan-features] pricing plans. - Configure Datadog Agent to collect metrics for your Tiger Cloud service This integration is available for all pricing plans. ## Prerequisites To follow the steps on this page: * Create a target [Tiger Cloud service][create-service] with the Real-time analytics capability. You need your [connection details][connection-info]. - Sign up for [Datadog][datadog-signup]. You need your [Datadog API key][datadog-api-key] to follow this procedure. - Install [Datadog Agent][datadog-agent-install]. ## Monitor Tiger Cloud service metrics with Datadog Export telemetry data from your Tiger Cloud services with the time-series and analytics capability enabled to Datadog using a Tiger Cloud data exporter. The available metrics include CPU usage, RAM usage, and storage. ### Create a data exporter A Tiger Cloud data exporter sends telemetry data from a Tiger Cloud service to a third-party monitoring tool. You create an exporter on the [project level][projects], in the same AWS region as your service: 1. **In Tiger Cloud Console, open [Exporters][console-integrations]** 1. **Click `New exporter`** 1. **Select `Metrics` for `Data type` and `Datadog` for provider**  1. **Choose your AWS region and provide the API key** The AWS region must be the same for your Tiger Cloud exporter and the Datadog provider. 1. **Set `Site` to your Datadog region, then click `Create exporter`** ### Manage a data exporter This section shows you how to attach, monitor, edit, and delete a data exporter. ### Attach a data exporter to a Tiger Cloud service To send telemetry data to an external monitoring tool, you attach a data exporter to your Tiger Cloud service. You can attach only one exporter to a service. To attach an exporter: 1. **In [Tiger Cloud Console][console-services], choose the service** 1. **Click `Operations` > `Exporters`** 1. **Select the exporter, then click `Attach exporter`** 1. **If you are attaching a first `Logs` data type exporter, restart the service** ### Monitor Tiger Cloud service metrics You can now monitor your service metrics. Use the following metrics to check the service is running correctly: * `timescale.cloud.system.cpu.usage.millicores` * `timescale.cloud.system.cpu.total.millicores` * `timescale.cloud.system.memory.usage.bytes` * `timescale.cloud.system.memory.total.bytes` * `timescale.cloud.system.disk.usage.bytes` * `timescale.cloud.system.disk.total.bytes` Additionally, use the following tags to filter your results. |Tag|Example variable| Description | |-|-|----------------------------| |`host`|`us-east-1.timescale.cloud`| | |`project-id`|| | |`service-id`|| | |`region`|`us-east-1`| AWS region | |`role`|`replica` or `primary`| For service with replicas | |`node-id`|| For multi-node services | ### Edit a data exporter To update a data exporter: 1. **In Tiger Cloud Console, open [Exporters][console-integrations]** 1. **Next to the exporter you want to edit, click the menu > `Edit`** 1. **Edit the exporter fields and save your changes** You cannot change fields such as the provider or the AWS region. ### Delete a data exporter To remove a data exporter that you no longer need: 1. **Disconnect the data exporter from your Tiger Cloud services** 1. In [Tiger Cloud Console][console-services], choose the service. 1. Click `Operations` > `Exporters`. 1. Click the trash can icon. 1. Repeat for every service attached to the exporter you want to remove. The data exporter is now unattached from all services. However, it still exists in your project. 1. **Delete the exporter on the project level** 1. In Tiger Cloud Console, open [Exporters][console-integrations] 1. Next to the exporter you want to edit, click menu > `Delete` 1. Confirm that you want to delete the data exporter. ### Reference When you create the IAM OIDC provider, the URL must match the region you create the exporter in. It must be one of the following: | Region | Zone | Location | URL |------------------|---------------|----------------|--------------------| | `ap-southeast-1` | Asia Pacific | Singapore | `irsa-oidc-discovery-prod-ap-southeast-1.s3.ap-southeast-1.amazonaws.com` | `ap-southeast-2` | Asia Pacific | Sydney | `irsa-oidc-discovery-prod-ap-southeast-2.s3.ap-southeast-2.amazonaws.com` | `ap-northeast-1` | Asia Pacific | Tokyo | `irsa-oidc-discovery-prod-ap-northeast-1.s3.ap-northeast-1.amazonaws.com` | `ca-central-1` | Canada | Central | `irsa-oidc-discovery-prod-ca-central-1.s3.ca-central-1.amazonaws.com` | `eu-central-1` | Europe | Frankfurt | `irsa-oidc-discovery-prod-eu-central-1.s3.eu-central-1.amazonaws.com` | `eu-west-1` | Europe | Ireland | `irsa-oidc-discovery-prod-eu-west-1.s3.eu-west-1.amazonaws.com` | `eu-west-2` | Europe | London | `irsa-oidc-discovery-prod-eu-west-2.s3.eu-west-2.amazonaws.com` | `sa-east-1` | South America | São Paulo | `irsa-oidc-discovery-prod-sa-east-1.s3.sa-east-1.amazonaws.com` | `us-east-1` | United States | North Virginia | `irsa-oidc-discovery-prod.s3.us-east-1.amazonaws.com` | `us-east-2` | United States | Ohio | `irsa-oidc-discovery-prod-us-east-2.s3.us-east-2.amazonaws.com` | `us-west-2` | United States | Oregon | `irsa-oidc-discovery-prod-us-west-2.s3.us-west-2.amazonaws.com` ## Configure Datadog Agent to collect metrics for your Tiger Cloud services Datadog Agent includes a [Postgres integration][datadog-postgres] that you use to collect detailed Postgres database metrics about your Tiger Cloud services. 1. **Connect to your Tiger Cloud service** For Tiger Cloud, open an [SQL editor][run-queries] in [Tiger Cloud Console][open-console]. For self-hosted TimescaleDB, use [`psql`][psql]. 1. **Add the `datadog` user to your Tiger Cloud service**sql create user datadog with password '';
sql grant pg_monitor to datadog;
sql grant SELECT ON pg_stat_database to datadog;
1. **Test the connection and rights for the datadog user** Update the following command with your [connection details][connection-info], then run it from the command line:bash
psql "postgres://datadog:<datadog password>@<host>:<port>/tsdb?sslmode=require" -c \ "select * from pg_stat_database LIMIT(1);" \ && echo -e "\e[0;32mPostgres connection - OK\e[0m" || echo -e "\e[0;31mCannot connect to Postgres\e[0m"You see the output from the `pg_stat_database` table, which means you have given the correct rights to `datadog`. 1. **Connect Datadog to your Tiger Cloud service** 1. Configure the [Datadog Agent Postgres configuration file][datadog-config]; it is usually located on the Datadog Agent host at: - **Linux**: `/etc/datadog-agent/conf.d/postgres.d/conf.yaml` - **MacOS**: `/opt/datadog-agent/etc/conf.d/postgres.d/conf.yaml` - **Windows**: `C:\ProgramData\Datadog\conf.d\postgres.d\conf.yaml` 1. Integrate Datadog Agent with your Tiger Cloud service: Use your [connection details][connection-info] to update the following and add it to the Datadog Agent Postgres configuration file: ```yaml init_config: instances: - host: <host> port: <port> username: datadog password: <datadog's password>> dbname: tsdb disable_generic_tags: true ``` 1. **Add Tiger Cloud metrics** Tags to make it easier for build Datadog dashboards that combine metrics from the Tiger Cloud data exporter and Datadog Agent. Use your [connection details][connection-info] to update the following and add it to `<datadog_home>/datadog.yaml`:yaml tags:
- project-id:<project-id> - service-id:<service-id> - region:<region>1. **Restart Datadog Agent** See how to [Start, stop, and restart Datadog Agent][datadog-agent-restart]. Metrics for your Tiger Cloud service are now visible in Datadog. Check the Datadog Postgres integration documentation for a comprehensive list of [metrics][datadog-postgres-metrics] collected. ===== PAGE: https://docs.tigerdata.com/integrations/decodable/ ===== # Integrate Decodable with Tiger Cloud [Decodable][decodable] is a real-time data platform that allows you to build, run, and manage data pipelines effortlessly. 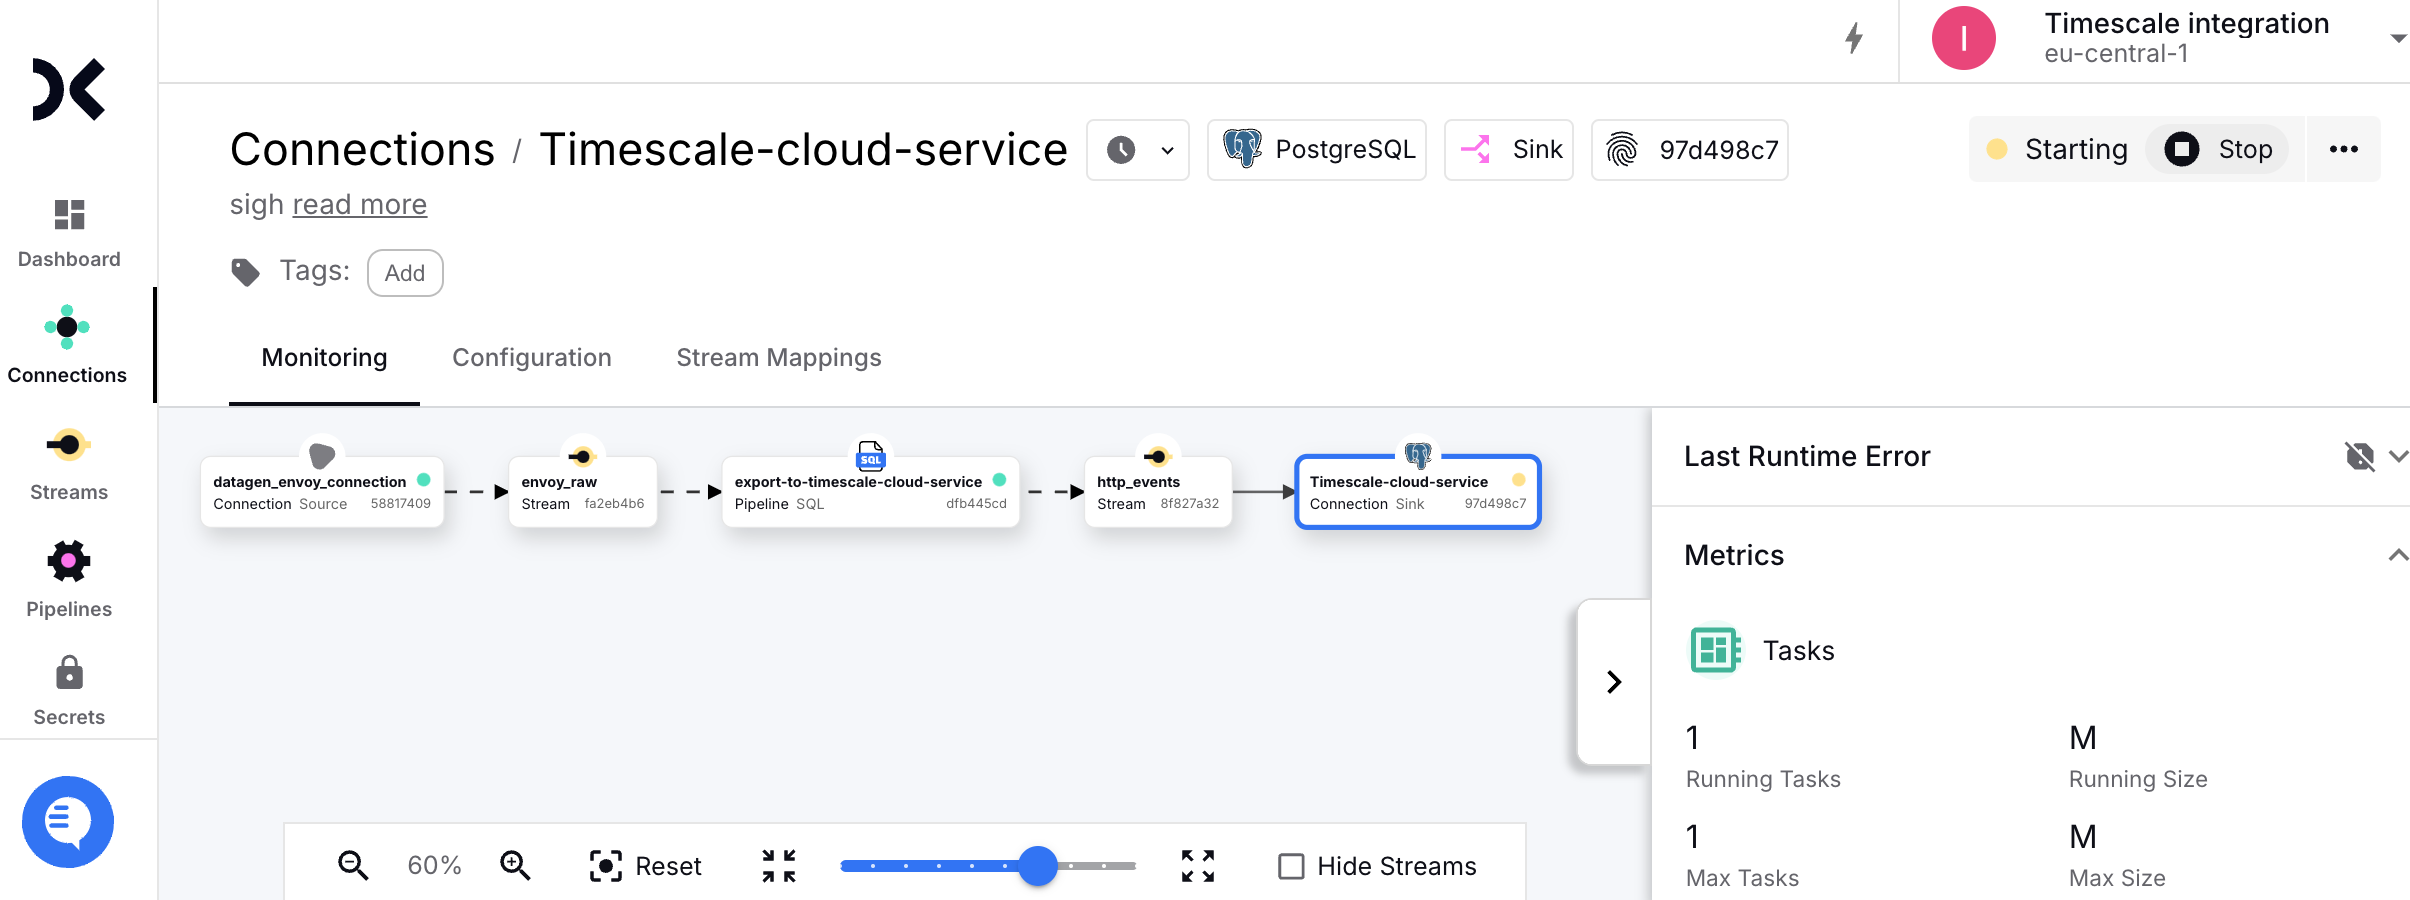 This page explains how to integrate Decodable with your Tiger Cloud service to enable efficient real-time streaming and analytics. ## Prerequisites To follow the steps on this page: * Create a target [Tiger Cloud service][create-service] with the Real-time analytics capability. You need [your connection details][connection-info]. This procedure also works for [self-hosted TimescaleDB][enable-timescaledb]. - Sign up for [Decodable][sign-up-decodable]. This page uses the pipeline you create using the [Decodable Quickstart Guide][decodable-quickstart]. ## Connect Decodable to your Tiger Cloud service To stream data gathered in Decodable to a Tiger Cloud service: 1. **Create the sync to pipe a Decodable data stream into your Tiger Cloud service** 1. Log in to your [Decodable account][decodable-app]. 1. Click `Connections`, then click `New Connection`. 1. Select a `PostgreSQL sink` connection type, then click `Connect`. 1. Using your [connection details][connection-info], fill in the connection information. Leave `schema` and `JDBC options` empty. 1. Select the `http_events` source stream, then click `Next`. Decodable creates the table in your Tiger Cloud service and starts streaming data. 1. **Test the connection** 1. Connect to your Tiger Cloud service. For Tiger Cloud, open an [SQL editor][run-queries] in [Tiger Cloud Console][open-console]. For self-hosted TimescaleDB, use [`psql`][psql]. 1. Check the data from Decodable is streaming into your Tiger Cloud service. ```sql SELECT * FROM http_events; ``` You see something like: 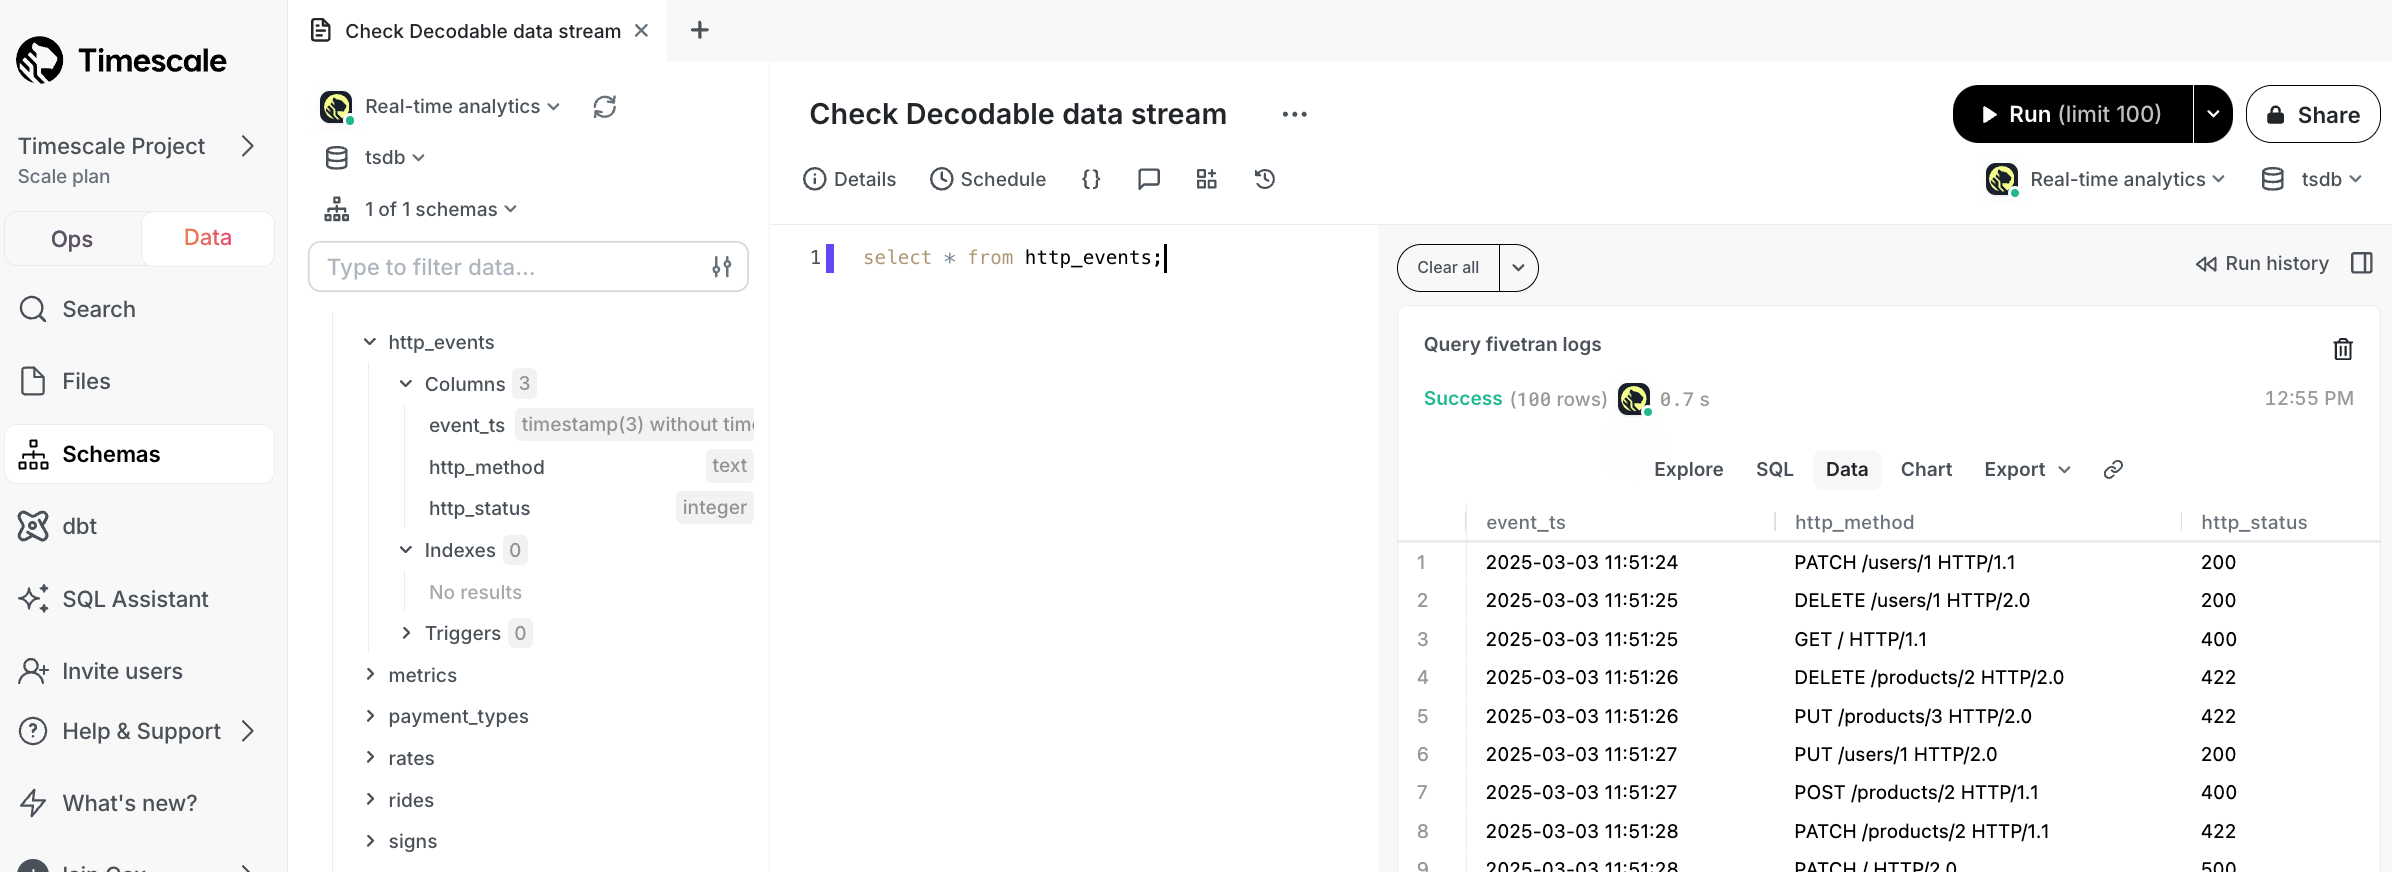 You have successfully integrated Decodable with Tiger Cloud. ===== PAGE: https://docs.tigerdata.com/integrations/debezium/ ===== # Integrate Debezium with Tiger Cloud [Debezium][debezium] is an open-source distributed platform for change data capture (CDC). It enables you to capture changes in a self-hosted TimescaleDB instance and stream them to other systems in real time. Debezium can capture events about: - [Hypertables][hypertables]: captured events are rerouted from their chunk-specific topics to a single logical topic named according to the following pattern: `<topic.prefix>.<hypertable-schema-name>.<hypertable-name>` - [Continuous aggregates][caggs]: captured events are rerouted from their chunk-specific topics to a single logical topic named according to the following pattern: `<topic.prefix>.<aggregate-schema-name>.<aggregate-name>` - [Hypercore][hypercore]: If you enable hypercore, the Debezium TimescaleDB connector does not apply any special processing to data in the columnstore. Compressed chunks are forwarded unchanged to the next downstream job in the pipeline for further processing as needed. Typically, messages with compressed chunks are dropped, and are not processed by subsequent jobs in the pipeline. This limitation only affects changes to chunks in the columnstore. Changes to data in the rowstore work correctly. This page explains how to capture changes in your database and stream them using Debezium on Apache Kafka. ## Prerequisites To follow the steps on this page: * Create a target [self-hosted TimescaleDB][enable-timescaledb] instance. - [Install Docker][install-docker] on your development machine. ## Configure your database to work with Debezium To set up self-hosted TimescaleDB to communicate with Debezium: 1. **Configure your self-hosted Postgres deployment** 1. Open `postgresql.conf`. The Postgres configuration files are usually located in: - Docker: `/home/postgres/pgdata/data/` - Linux: `/etc/postgresql/<version>/main/` or `/var/lib/pgsql/<version>/data/` - MacOS: `/opt/homebrew/var/postgresql@<version>/` - Windows: `C:\Program Files\PostgreSQL\<version>\data\` 1. Enable logical replication. Modify the following settings in `postgresql.conf`: ```ini wal_level = logical max_replication_slots = 10 max_wal_senders = 10 ``` 1. Open `pg_hba.conf` and enable host replication. To allow replication connections, add the following: ``` local replication debezium trust ``` This permission is for the `debezium` Postgres user running on a local or Docker deployment. For more about replication permissions, see [Configuring Postgres to allow replication with the Debezium connector host][debezium-replication-permissions]. 1. Restart Postgres. 1. **Connect to your self-hosted TimescaleDB instance** Use [`psql`][psql-connect]. 1. **Create a Debezium user in Postgres** Create a user with the `LOGIN` and `REPLICATION` permissions: ```sql CREATE ROLE debezium WITH LOGIN REPLICATION PASSWORD '<debeziumpassword>'; ``` 1. **Enable a replication spot for Debezium** 1. Create a table for Debezium to listen to: ```sql CREATE TABLE accounts (created_at TIMESTAMPTZ DEFAULT NOW(), name TEXT, city TEXT); ``` 1. Turn the table into a hypertable: ```sql SELECT create_hypertable('accounts', 'created_at'); ``` Debezium also works with [continuous aggregates][caggs]. 1. Create a publication and enable a replication slot: ```sql CREATE PUBLICATION dbz_publication FOR ALL TABLES WITH (publish = 'insert, update'); ``` ## Configure Debezium to work with your database Set up Kafka Connect server, plugins, drivers, and connectors: 1. **Run Zookeeper in Docker** In another Terminal window, run the following command:bash docker run -it --rm --name zookeeper -p 2181:2181 -p 2888:2888 -p 3888:3888 quay.io/debezium/zookeeper:3.0
Check the output log to see that zookeeper is running. 1. **Run Kafka in Docker** In another Terminal window, run the following command:bash docker run -it --rm --name kafka -p 9092:9092 --link zookeeper:zookeeper quay.io/debezium/kafka:3.0
Check the output log to see that Kafka is running. 1. **Run Kafka Connect in Docker** In another Terminal window, run the following command:bash docker run -it --rm --name connect \ -p 8083:8083 \ -e GROUP_ID=1 \ -e CONFIG_STORAGE_TOPIC=accounts \ -e OFFSET_STORAGE_TOPIC=offsets \ -e STATUS_STORAGE_TOPIC=storage \ --link kafka:kafka \ --link timescaledb:timescaledb \ quay.io/debezium/connect:3.0
Check the output log to see that Kafka Connect is running. 1. **Register the Debezium Postgres source connector** Update the `<properties>` for the `<debezium-user>` you created in your self-hosted TimescaleDB instance in the following command. Then run the command in another Terminal window:bash curl -X POST http://localhost:8083/connectors \ -H "Content-Type: application/json" \ -d '{
"name": "timescaledb-connector", "config": { "connector.class": "io.debezium.connector.postgresql.PostgresConnector", "database.hostname": "timescaledb", "database.port": "5432", "database.user": "<debezium-user>", "database.password": "<debezium-password>", "database.dbname" : "postgres", "topic.prefix": "accounts", "plugin.name": "pgoutput", "schema.include.list": "public,_timescaledb_internal", "transforms": "timescaledb", "transforms.timescaledb.type": "io.debezium.connector.postgresql.transforms.timescaledb.TimescaleDb", "transforms.timescaledb.database.hostname": "timescaledb", "transforms.timescaledb.database.port": "5432", "transforms.timescaledb.database.user": "<debezium-user>", "transforms.timescaledb.database.password": "<debezium-password>", "transforms.timescaledb.database.dbname": "postgres" }}'
1. **Verify `timescaledb-source-connector` is included in the connector list** 1. Check the tasks associated with `timescaledb-connector`: ```bash curl -i -X GET -H "Accept:application/json" localhost:8083/connectors/timescaledb-connector ``` You see something like: ```bash {"name":"timescaledb-connector","config": { "connector.class":"io.debezium.connector.postgresql.PostgresConnector", "transforms.timescaledb.database.hostname":"timescaledb", "transforms.timescaledb.database.password":"debeziumpassword","database.user":"debezium", "database.dbname":"postgres","transforms.timescaledb.database.dbname":"postgres", "transforms.timescaledb.database.user":"debezium", "transforms.timescaledb.type":"io.debezium.connector.postgresql.transforms.timescaledb.TimescaleDb", "transforms.timescaledb.database.port":"5432","transforms":"timescaledb", "schema.include.list":"public,_timescaledb_internal","database.port":"5432","plugin.name":"pgoutput", "topic.prefix":"accounts","database.hostname":"timescaledb","database.password":"debeziumpassword", "name":"timescaledb-connector"},"tasks":[{"connector":"timescaledb-connector","task":0}],"type":"source"} ``` 1. **Verify `timescaledb-connector` is running** 1. Open the Terminal window running Kafka Connect. When the connector is active, you see something like the following: ```bash 2025-04-30 10:40:15,168 INFO Postgres|accounts|streaming REPLICA IDENTITY for '_timescaledb_internal._hyper_1_1_chunk' is 'DEFAULT'; UPDATE and DELETE events will contain previous values only for PK columns [io.debezium.connector.postgresql.PostgresSchema] 2025-04-30 10:40:15,168 INFO Postgres|accounts|streaming REPLICA IDENTITY for '_timescaledb_internal.bgw_job_stat' is 'DEFAULT'; UPDATE and DELETE events will contain previous values only for PK columns [io.debezium.connector.postgresql.PostgresSchema] 2025-04-30 10:40:15,175 INFO Postgres|accounts|streaming SignalProcessor started. Scheduling it every 5000ms [io.debezium.pipeline.signal.SignalProcessor] 2025-04-30 10:40:15,175 INFO Postgres|accounts|streaming Creating thread debezium-postgresconnector-accounts-SignalProcessor [io.debezium.util.Threads] 2025-04-30 10:40:15,175 INFO Postgres|accounts|streaming Starting streaming [io.debezium.pipeline.ChangeEventSourceCoordinator] 2025-04-30 10:40:15,176 INFO Postgres|accounts|streaming Retrieved latest position from stored offset 'LSN{0/1FCE570}' [io.debezium.connector.postgresql.PostgresStreamingChangeEventSource] 2025-04-30 10:40:15,176 INFO Postgres|accounts|streaming Looking for WAL restart position for last commit LSN 'null' and last change LSN 'LSN{0/1FCE570}' [io.debezium.connector.postgresql.connection.WalPositionLocator] 2025-04-30 10:40:15,176 INFO Postgres|accounts|streaming Initializing PgOutput logical decoder publication [io.debezium.connector.postgresql.connection.PostgresReplicationConnection] 2025-04-30 10:40:15,189 INFO Postgres|accounts|streaming Obtained valid replication slot ReplicationSlot [active=false, latestFlushedLsn=LSN{0/1FCCFF0}, catalogXmin=884] [io.debezium.connector.postgresql.connection.PostgresConnection] 2025-04-30 10:40:15,189 INFO Postgres|accounts|streaming Connection gracefully closed [io.debezium.jdbc.JdbcConnection] 2025-04-30 10:40:15,204 INFO Postgres|accounts|streaming Requested thread factory for component PostgresConnector, id = accounts named = keep-alive [io.debezium.util.Threads] 2025-04-30 10:40:15,204 INFO Postgres|accounts|streaming Creating thread debezium-postgresconnector-accounts-keep-alive [io.debezium.util.Threads] 2025-04-30 10:40:15,216 INFO Postgres|accounts|streaming REPLICA IDENTITY for '_timescaledb_internal.bgw_policy_chunk_stats' is 'DEFAULT'; UPDATE and DELETE events will contain previous values only for PK columns [io.debezium.connector.postgresql.PostgresSchema] 2025-04-30 10:40:15,216 INFO Postgres|accounts|streaming REPLICA IDENTITY for 'public.accounts' is 'DEFAULT'; UPDATE and DELETE events will contain previous values only for PK columns [io.debezium.connector.postgresql.PostgresSchema] 2025-04-30 10:40:15,217 INFO Postgres|accounts|streaming REPLICA IDENTITY for '_timescaledb_internal.bgw_job_stat_history' is 'DEFAULT'; UPDATE and DELETE events will contain previous values only for PK columns [io.debezium.connector.postgresql.PostgresSchema] 2025-04-30 10:40:15,217 INFO Postgres|accounts|streaming REPLICA IDENTITY for '_timescaledb_internal._hyper_1_1_chunk' is 'DEFAULT'; UPDATE and DELETE events will contain previous values only for PK columns [io.debezium.connector.postgresql.PostgresSchema] 2025-04-30 10:40:15,217 INFO Postgres|accounts|streaming REPLICA IDENTITY for '_timescaledb_internal.bgw_job_stat' is 'DEFAULT'; UPDATE and DELETE events will contain previous values only for PK columns [io.debezium.connector.postgresql.PostgresSchema] 2025-04-30 10:40:15,219 INFO Postgres|accounts|streaming Processing messages [io.debezium.connector.postgresql.PostgresStreamingChangeEventSource] ``` 1. Watch the events in the accounts topic on your self-hosted TimescaleDB instance. In another Terminal instance, run the following command: ```bash docker run -it --rm --name watcher --link zookeeper:zookeeper --link kafka:kafka quay.io/debezium/kafka:3.0 watch-topic -a -k accounts ``` You see the topics being streamed. For example: ```bash status-task-timescaledb-connector-0 {"state":"RUNNING","trace":null,"worker_id":"172.17.0.5:8083","generation":31} status-topic-timescaledb.public.accounts:connector-timescaledb-connector {"topic":{"name":"timescaledb.public.accounts","connector":"timescaledb-connector","task":0,"discoverTimestamp":1746009337985}} status-topic-accounts._timescaledb_internal.bgw_job_stat:connector-timescaledb-connector {"topic":{"name":"accounts._timescaledb_internal.bgw_job_stat","connector":"timescaledb-connector","task":0,"discoverTimestamp":1746009338118}} status-topic-accounts._timescaledb_internal.bgw_job_stat:connector-timescaledb-connector {"topic":{"name":"accounts._timescaledb_internal.bgw_job_stat","connector":"timescaledb-connector","task":0,"discoverTimestamp":1746009338120}} status-topic-accounts._timescaledb_internal.bgw_job_stat_history:connector-timescaledb-connector {"topic":{"name":"accounts._timescaledb_internal.bgw_job_stat_history","connector":"timescaledb-connector","task":0,"discoverTimestamp":1746009338243}} status-topic-accounts._timescaledb_internal.bgw_job_stat_history:connector-timescaledb-connector {"topic":{"name":"accounts._timescaledb_internal.bgw_job_stat_history","connector":"timescaledb-connector","task":0,"discoverTimestamp":1746009338245}} status-topic-accounts.public.accounts:connector-timescaledb-connector {"topic":{"name":"accounts.public.accounts","connector":"timescaledb-connector","task":0,"discoverTimestamp":1746009338250}} status-topic-accounts.public.accounts:connector-timescaledb-connector {"topic":{"name":"accounts.public.accounts","connector":"timescaledb-connector","task":0,"discoverTimestamp":1746009338251}} status-topic-accounts.public.accounts:connector-timescaledb-connector {"topic":{"name":"accounts.public.accounts","connector":"timescaledb-connector","task":0,"discoverTimestamp":1746009338251}} status-topic-accounts.public.accounts:connector-timescaledb-connector {"topic":{"name":"accounts.public.accounts","connector":"timescaledb-connector","task":0,"discoverTimestamp":1746009338251}} status-topic-accounts.public.accounts:connector-timescaledb-connector {"topic":{"name":"accounts.public.accounts","connector":"timescaledb-connector","task":0,"discoverTimestamp":1746009338251}} ["timescaledb-connector",{"server":"accounts"}] {"last_snapshot_record":true,"lsn":33351024,"txId":893,"ts_usec":1746009337290783,"snapshot":"INITIAL","snapshot_completed":true} status-connector-timescaledb-connector {"state":"UNASSIGNED","trace":null,"worker_id":"172.17.0.5:8083","generation":31} status-task-timescaledb-connector-0 {"state":"UNASSIGNED","trace":null,"worker_id":"172.17.0.5:8083","generation":31} status-connector-timescaledb-connector {"state":"RUNNING","trace":null,"worker_id":"172.17.0.5:8083","generation":33} status-task-timescaledb-connector-0 {"state":"RUNNING","trace":null,"worker_id":"172.17.0.5:8083","generation":33} ``` Debezium requires logical replication to be enabled. Currently, this is not enabled by default on Tiger Cloud services. We are working on enabling this feature as you read. As soon as it is live, these docs will be updated. And that is it, you have configured Debezium to interact with Tiger Data products. ===== PAGE: https://docs.tigerdata.com/integrations/fivetran/ ===== # Integrate Fivetran with Tiger Cloud [Fivetran][fivetran] is a fully managed data pipeline platform that simplifies ETL (Extract, Transform, Load) processes by automatically syncing data from multiple sources to your data warehouse. 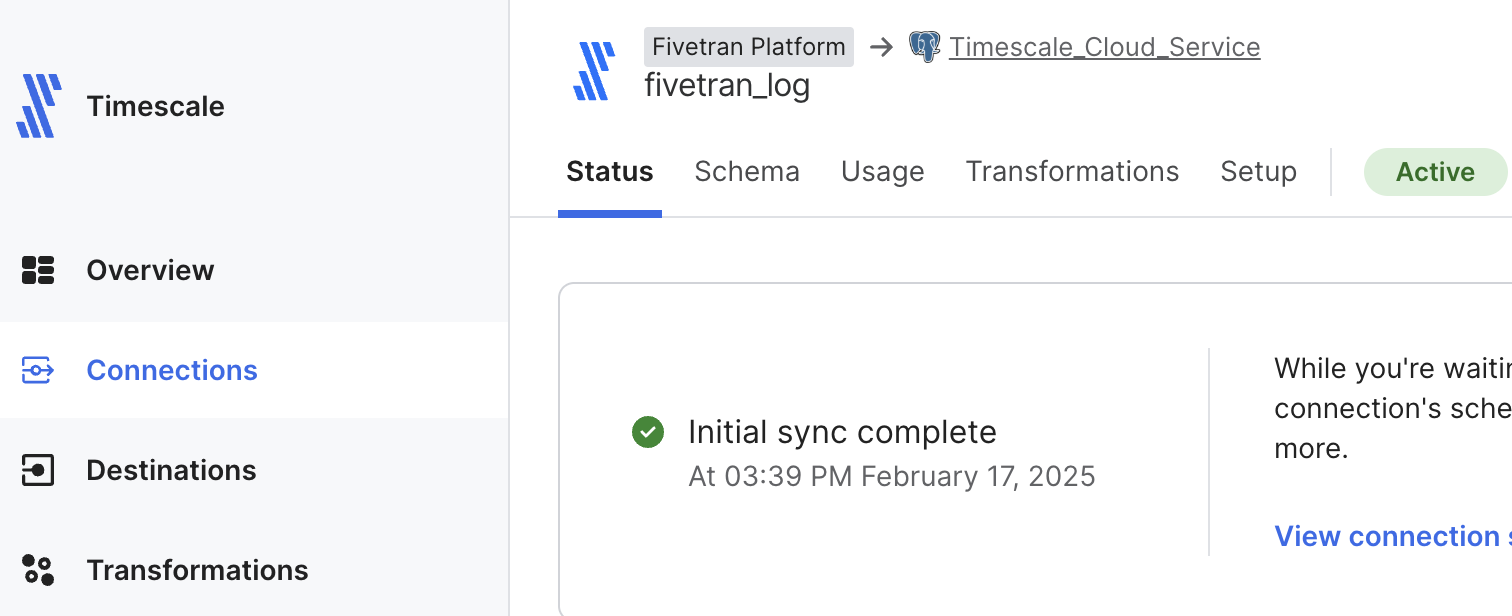 This page shows you how to inject data from data sources managed by Fivetran into a Tiger Cloud service. ## Prerequisites To follow the steps on this page: * Create a target [Tiger Cloud service][create-service] with the Real-time analytics capability. You need [your connection details][connection-info]. This procedure also works for [self-hosted TimescaleDB][enable-timescaledb]. * Sign up for [Fivetran][sign-up-fivetran] ## Set your Tiger Cloud service as a destination in Fivetran To be able to inject data into your Tiger Cloud service, set it as a destination in Fivetran: 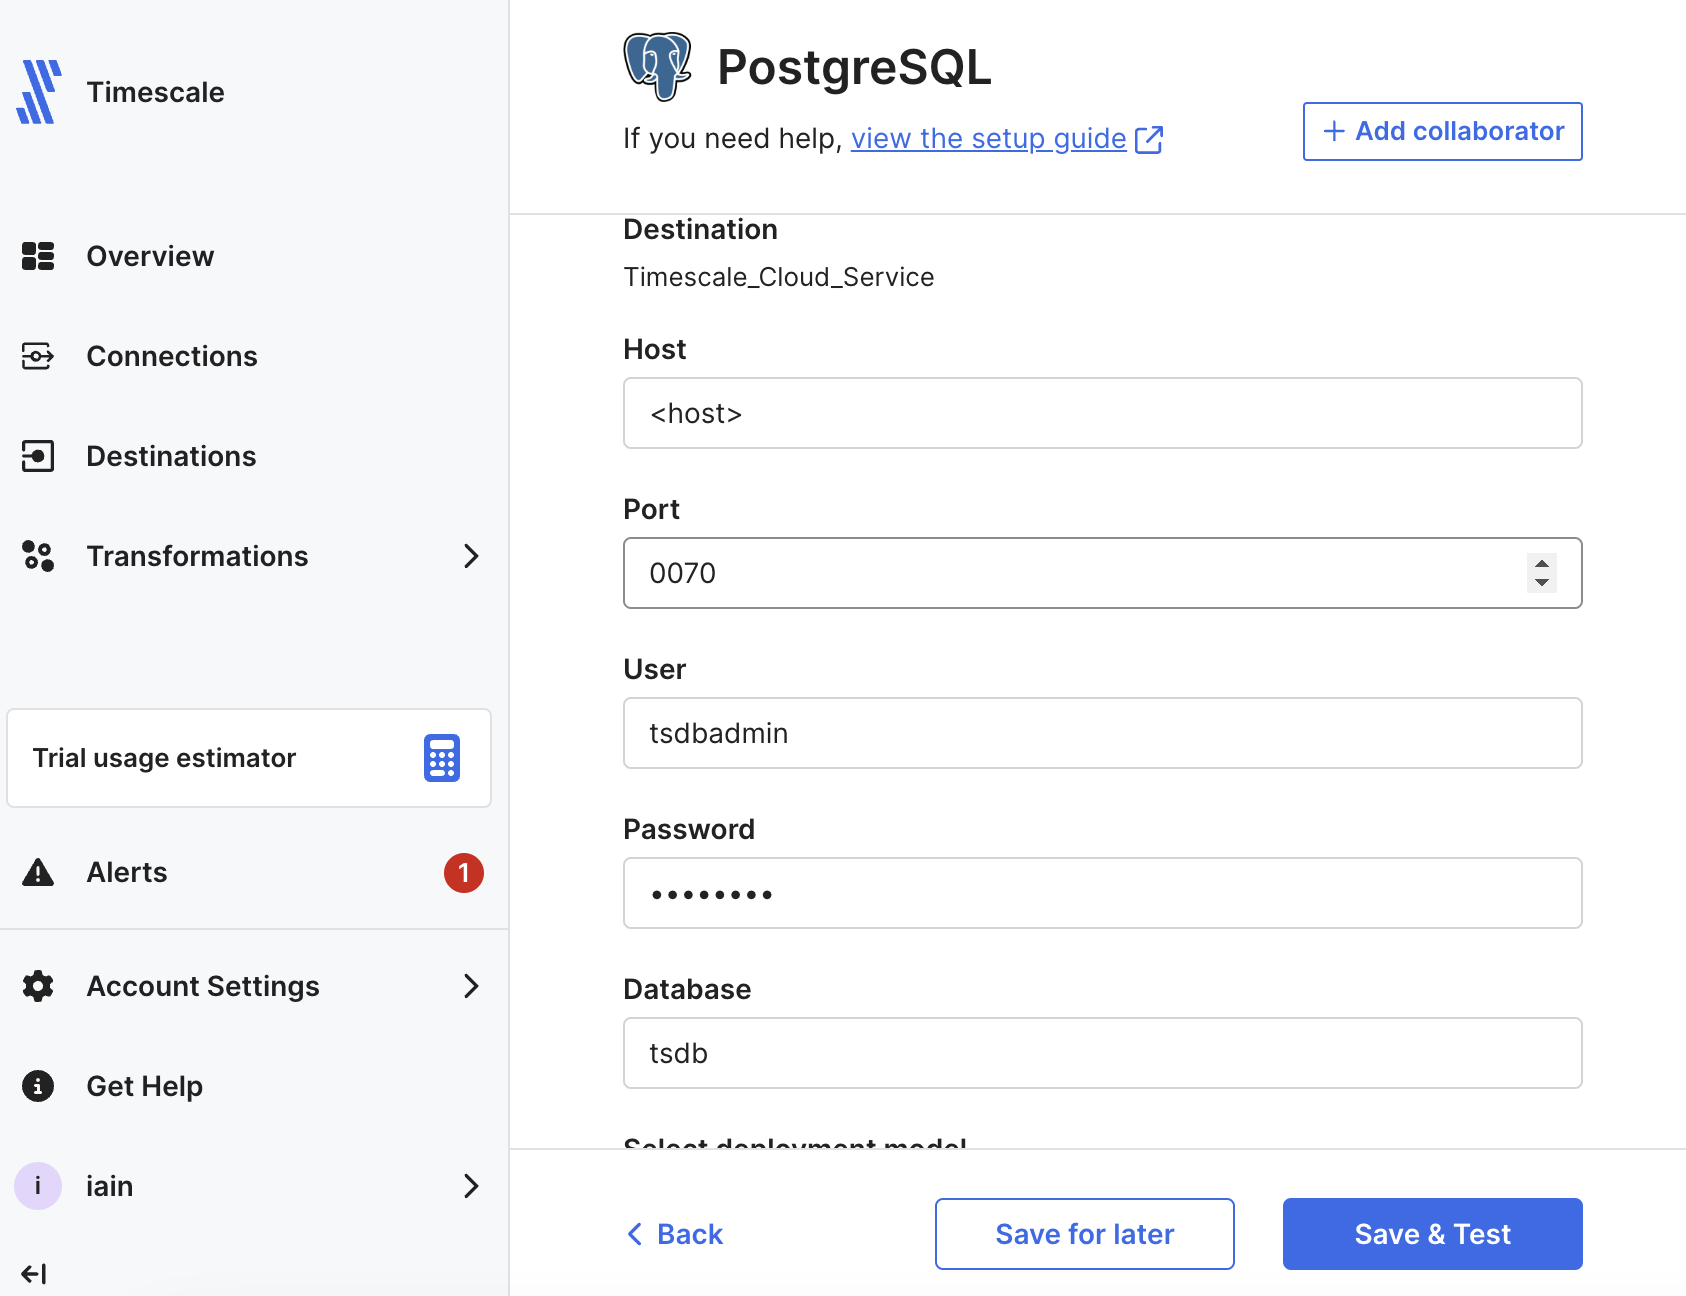 1. In [Fivetran Dashboard > Destinations][fivetran-dashboard-destinations], click `Add destination`. 1. Search for the `PostgreSQL` connector and click `Select`. Add the destination name and click `Add`. 1. In the `PostgreSQL` setup, add your [Tiger Cloud service connection details][connection-info], then click `Save & Test`. Fivetran validates the connection settings and sets up any security configurations. 1. Click `View Destination`. The `Destination Connection Details` page opens. ## Set up a Fivetran connection as your data source In a real world scenario, you can select any of the over 600 connectors available in Fivetran to sync data with your Tiger Cloud service. This section shows you how to inject the logs for your Fivetran connections into your Tiger Cloud service. 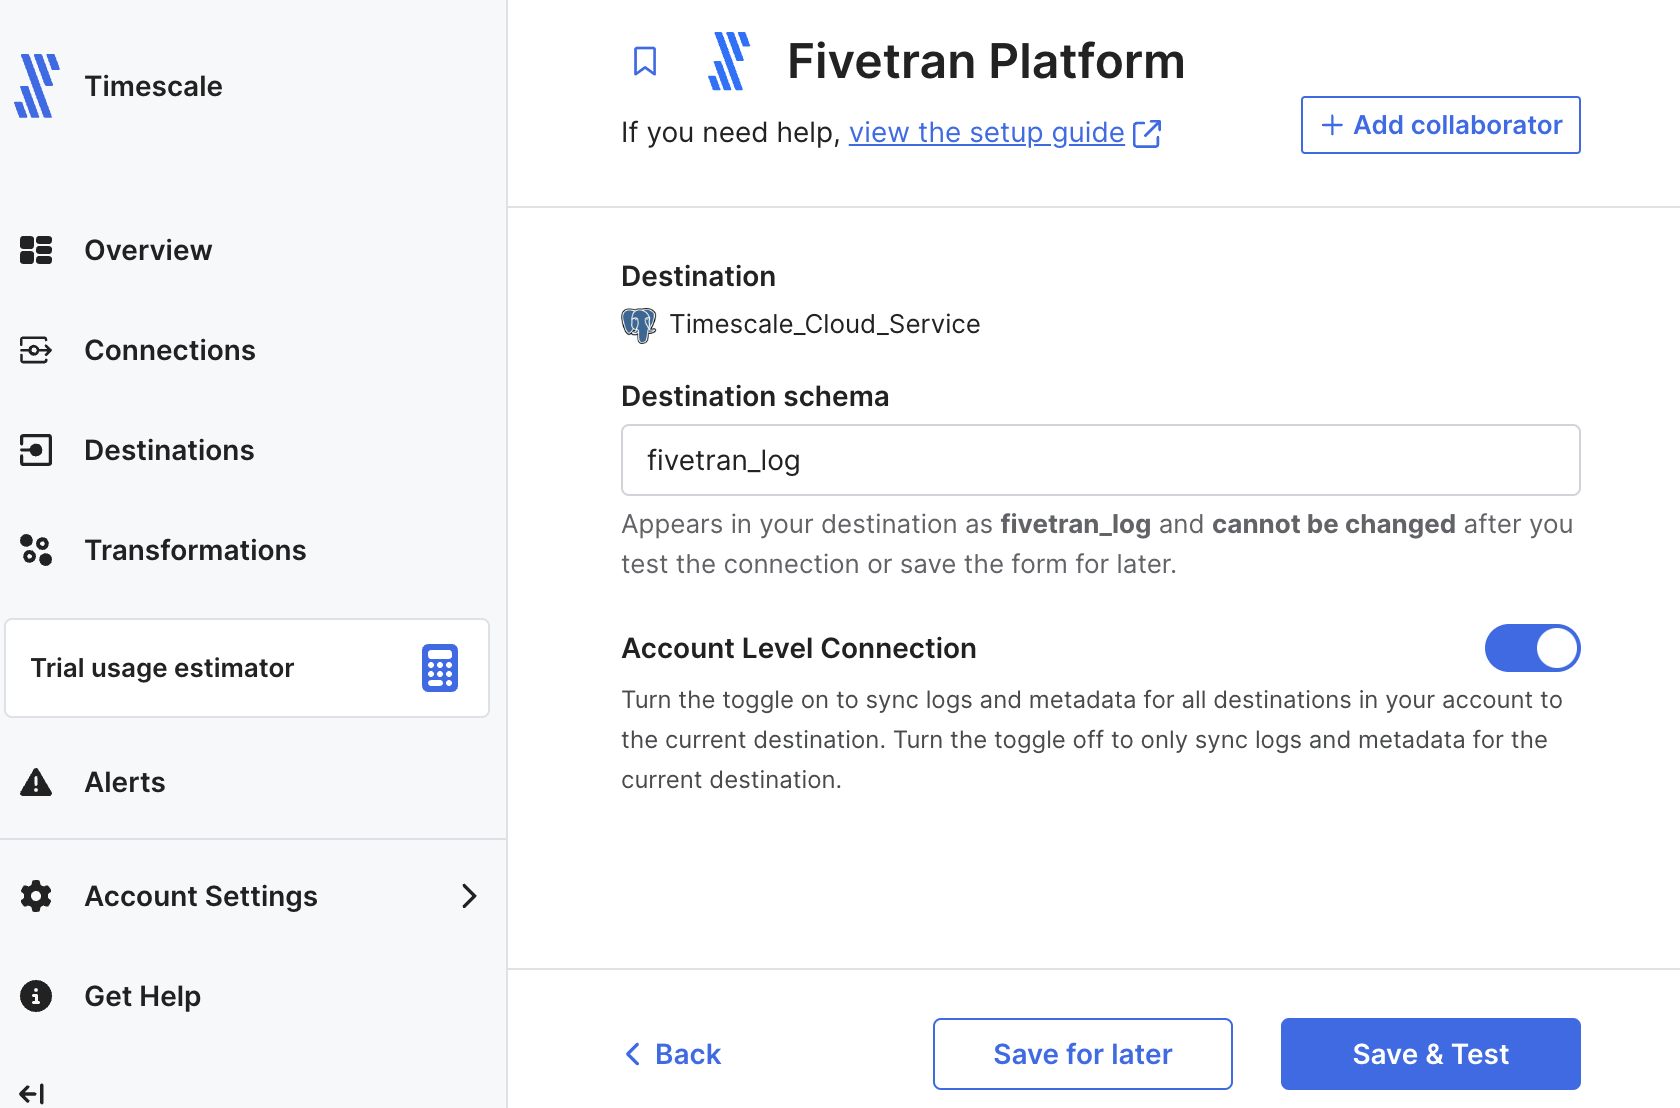 1. In [Fivetran Dashboard > Connections][fivetran-dashboard-connectors], click `Add connector`. 1. Search for the `Fivetran Platform` connector, then click `Setup`. 1. Leave the default schema name, then click `Save & Test`. You see `All connection tests passed!` 1. Click `Continue`, enable `Add Quickstart Data Model` and click `Continue`. Your Fivetran connection is connected to your Tiger Cloud service destination. 1. Click `Start Initial Sync`. Fivetran creates the log schema in your service and syncs the data to your service. ## View Fivetran data in your Tiger Cloud service To see data injected by Fivetran into your Tiger Cloud service: 1. In [data mode][portal-data-mode] in Tiger Cloud Console, select your service, then run the following query:sql SELECT * FROM fivetran_log.account LIMIT 10;
You see something like the following: 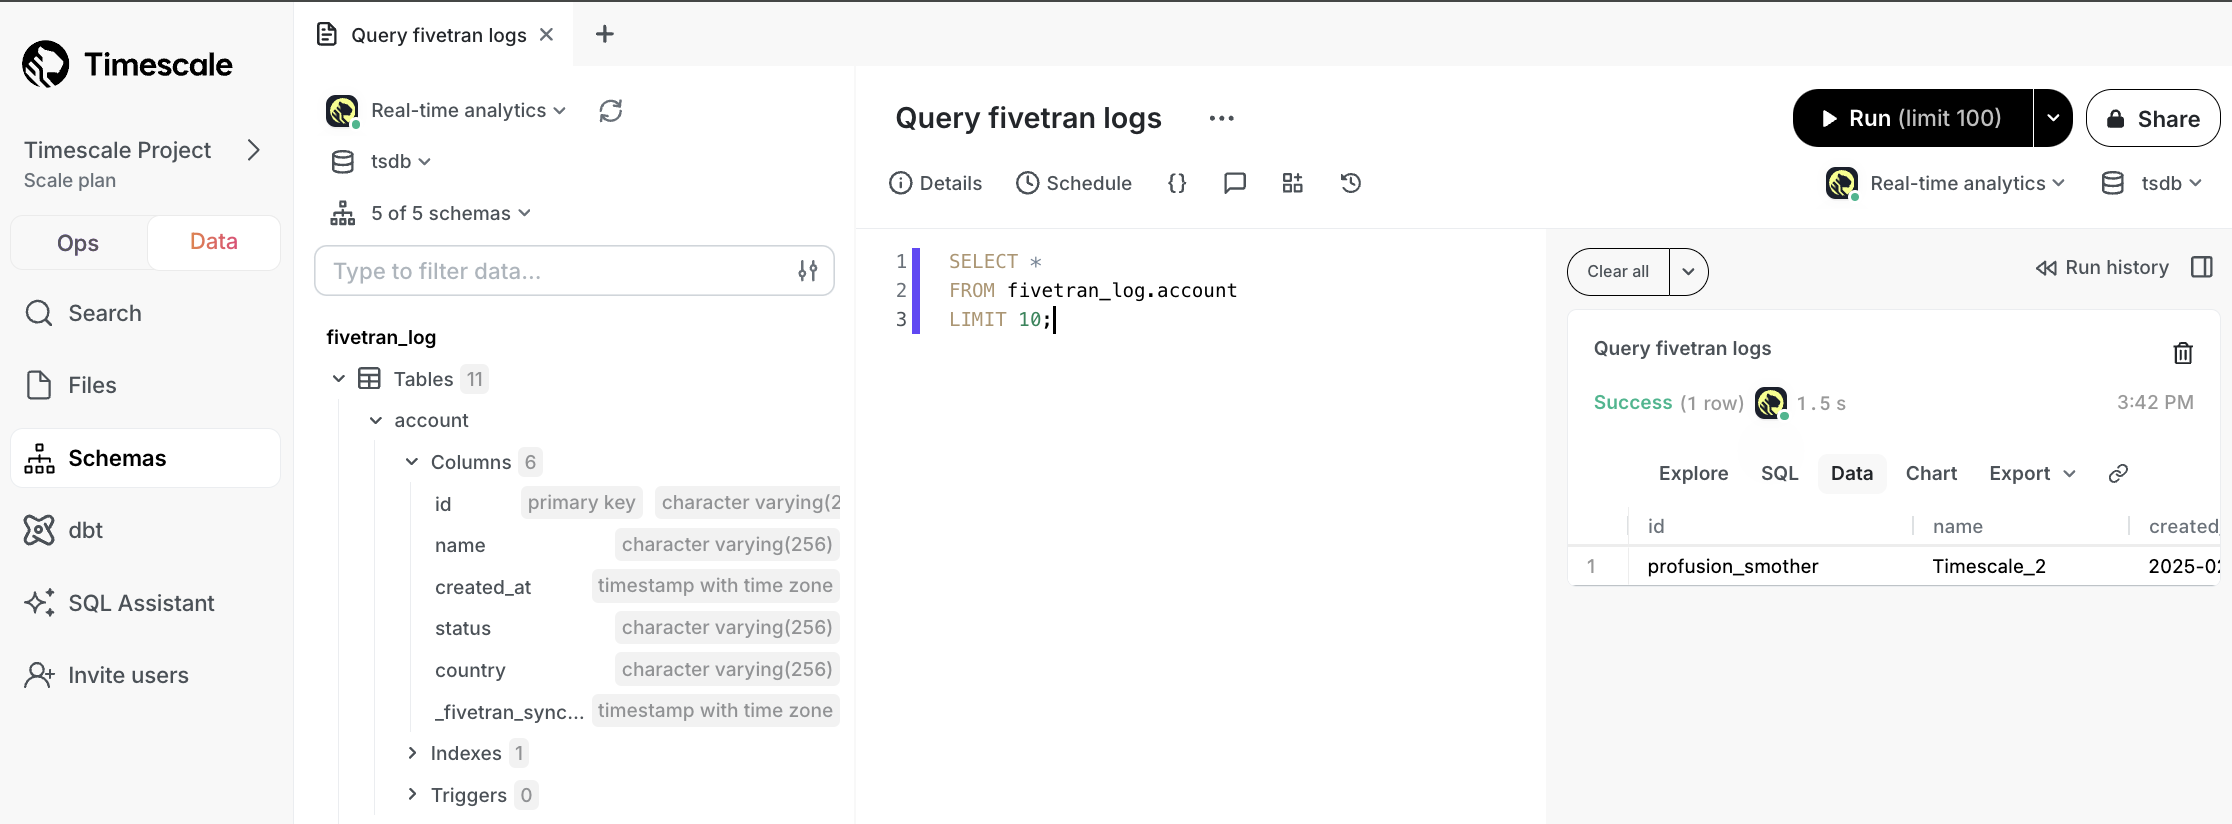 You have successfully integrated Fivetran with Tiger Cloud. ===== PAGE: https://docs.tigerdata.com/integrations/find-connection-details/ ===== # Find your connection details To connect to your Tiger Cloud service or self-hosted TimescaleDB, you need at least the following: - Hostname - Port - Username - Password - Database name Find the connection details based on your deployment type: ## Connect to your service Retrieve the connection details for your Tiger Cloud service: - **In `<service name>-credentials.txt`**: All connection details are supplied in the configuration file you download when you create a new service. - **In Tiger Cloud Console**: Open the [`Services`][console-services] page and select your service. The connection details, except the password, are available in `Service info` > `Connection info` > `More details`. If necessary, click `Forgot your password?` to get a new one. 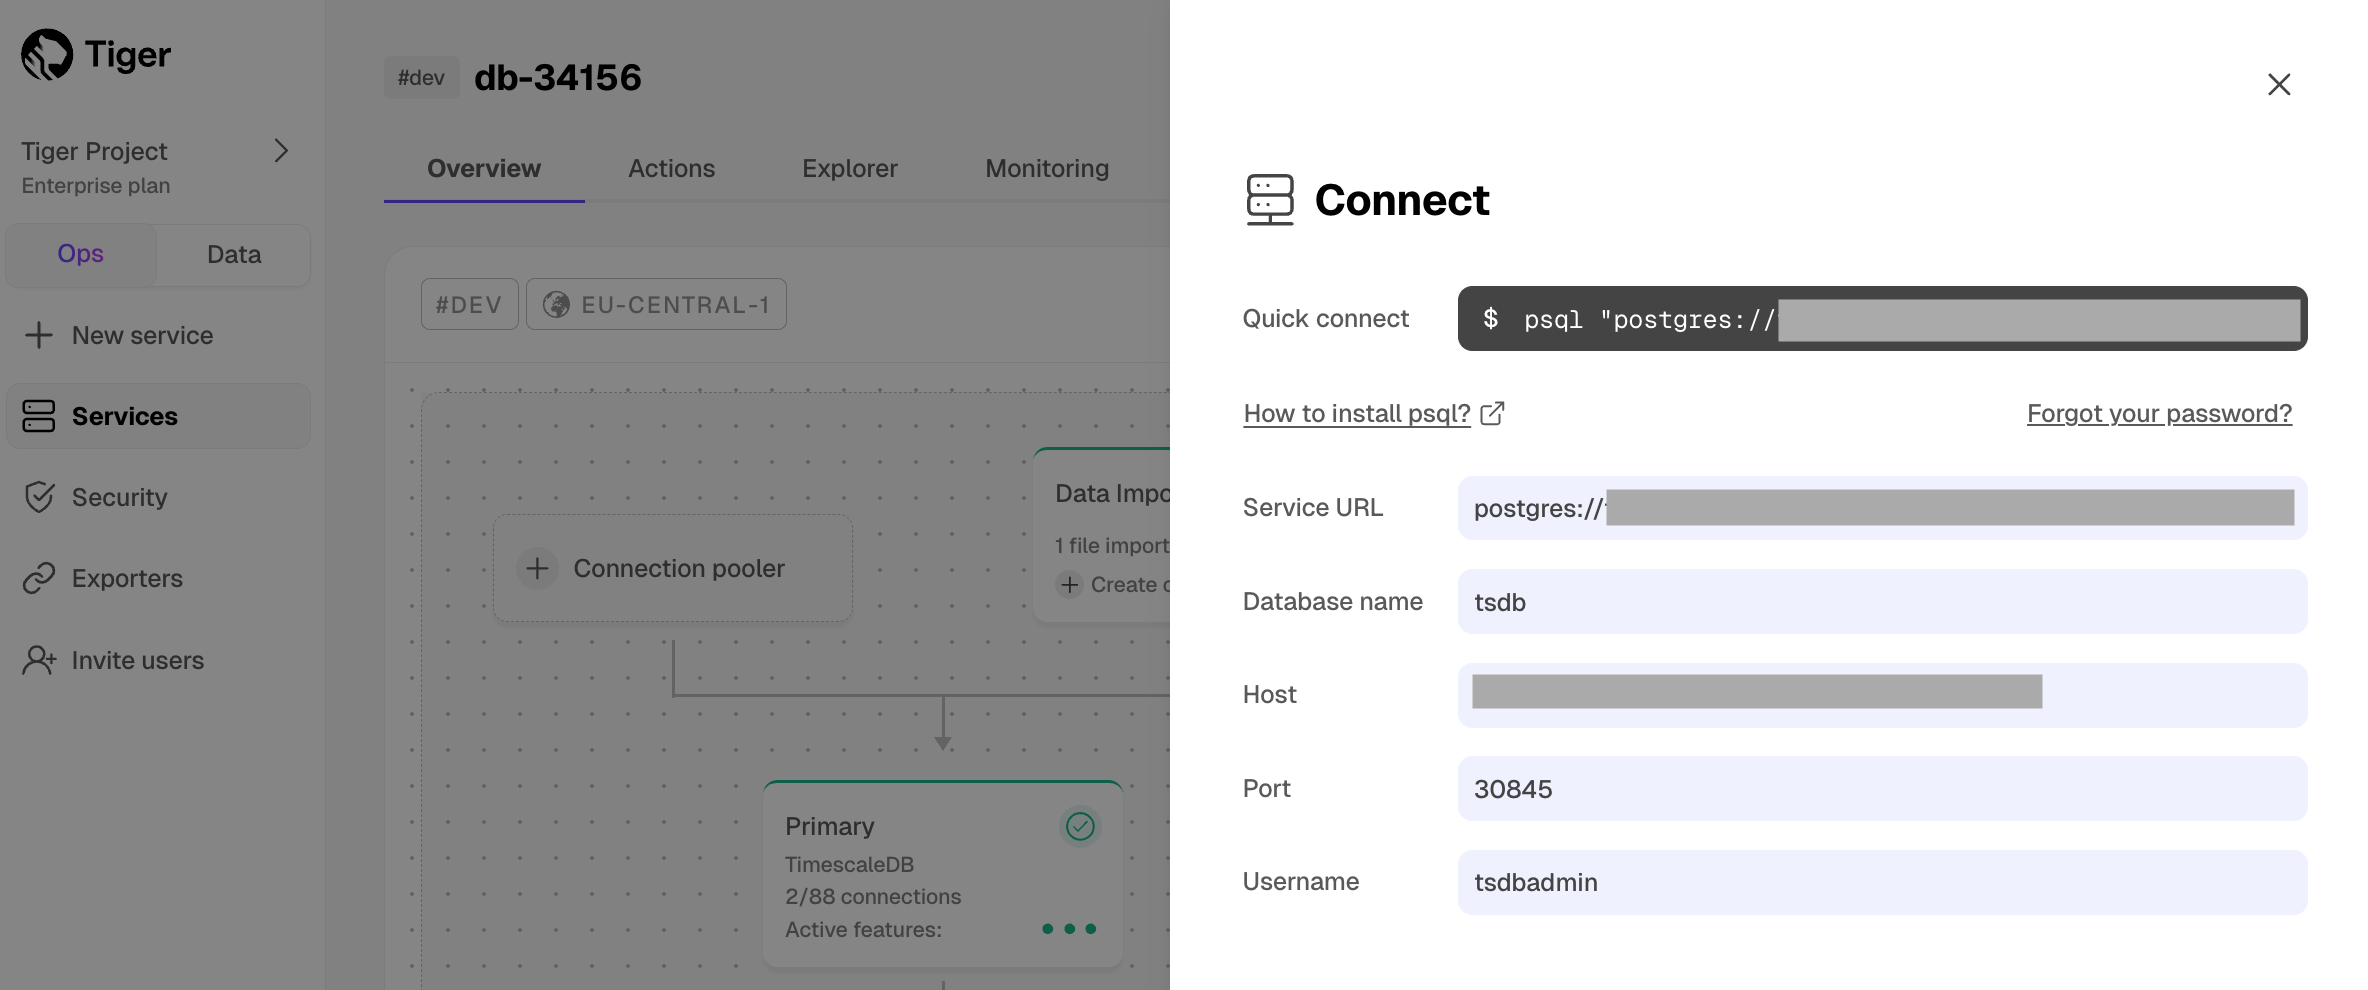 ## Find your project and service ID To retrieve the connection details for your Tiger Cloud project and Tiger Cloud service: 1. **Retrieve your project ID**: In [Tiger Cloud Console][console-services], click your project name in the upper left corner, then click `Copy` next to the project ID. 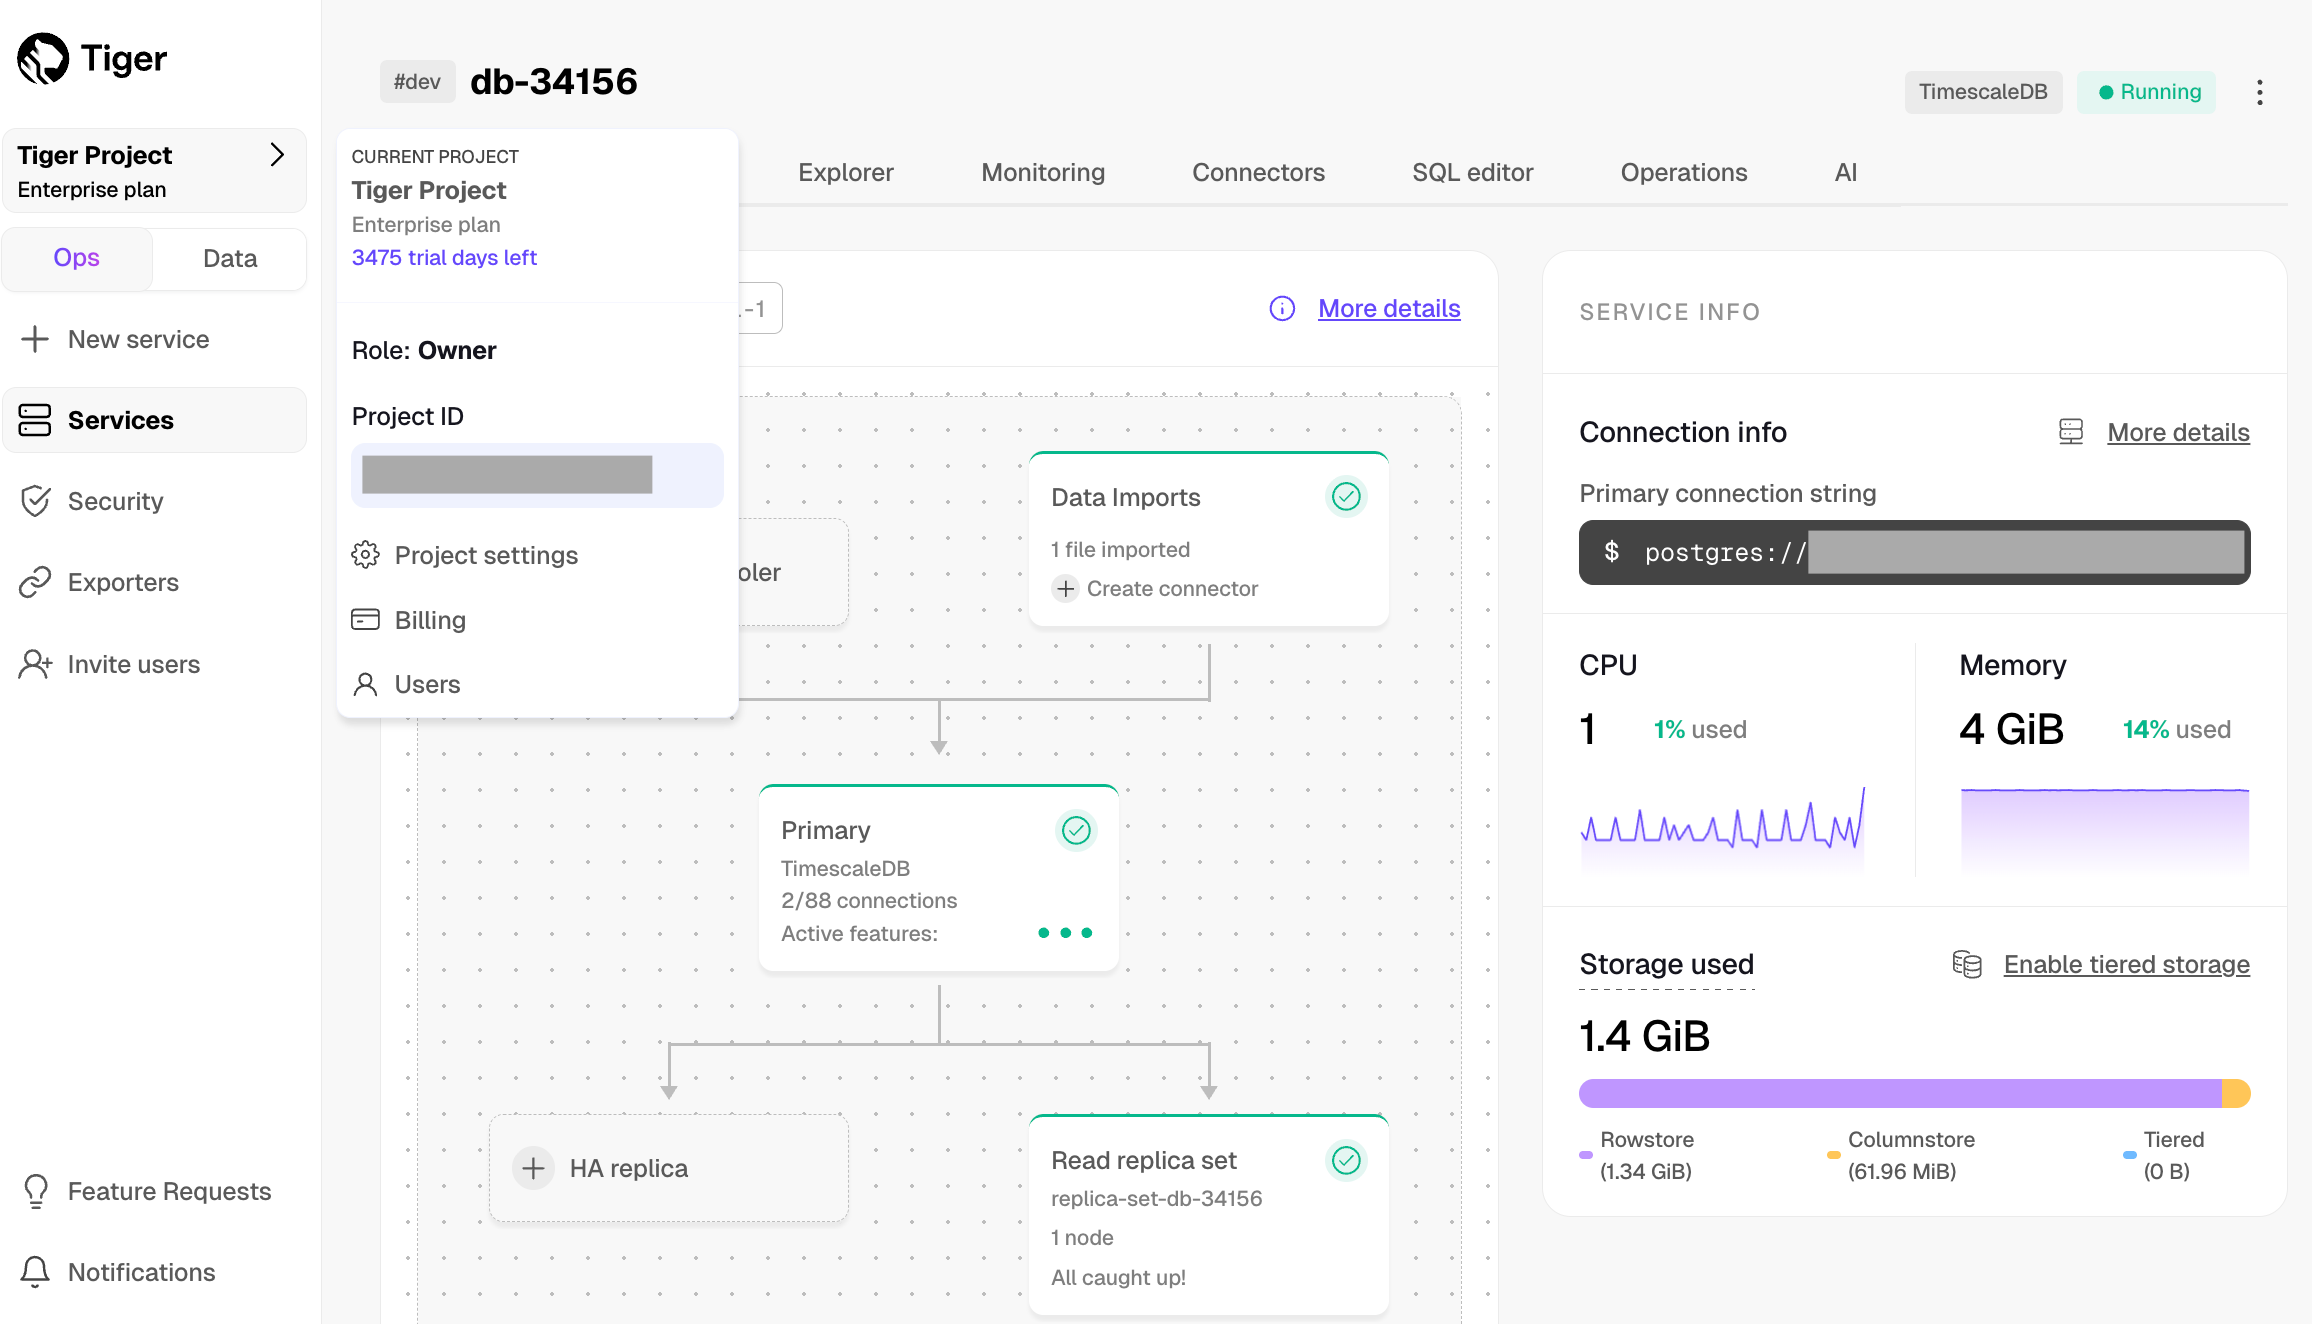 1. **Retrieve your service ID**: Click the dots next to the service, then click `Copy` next to the service ID. 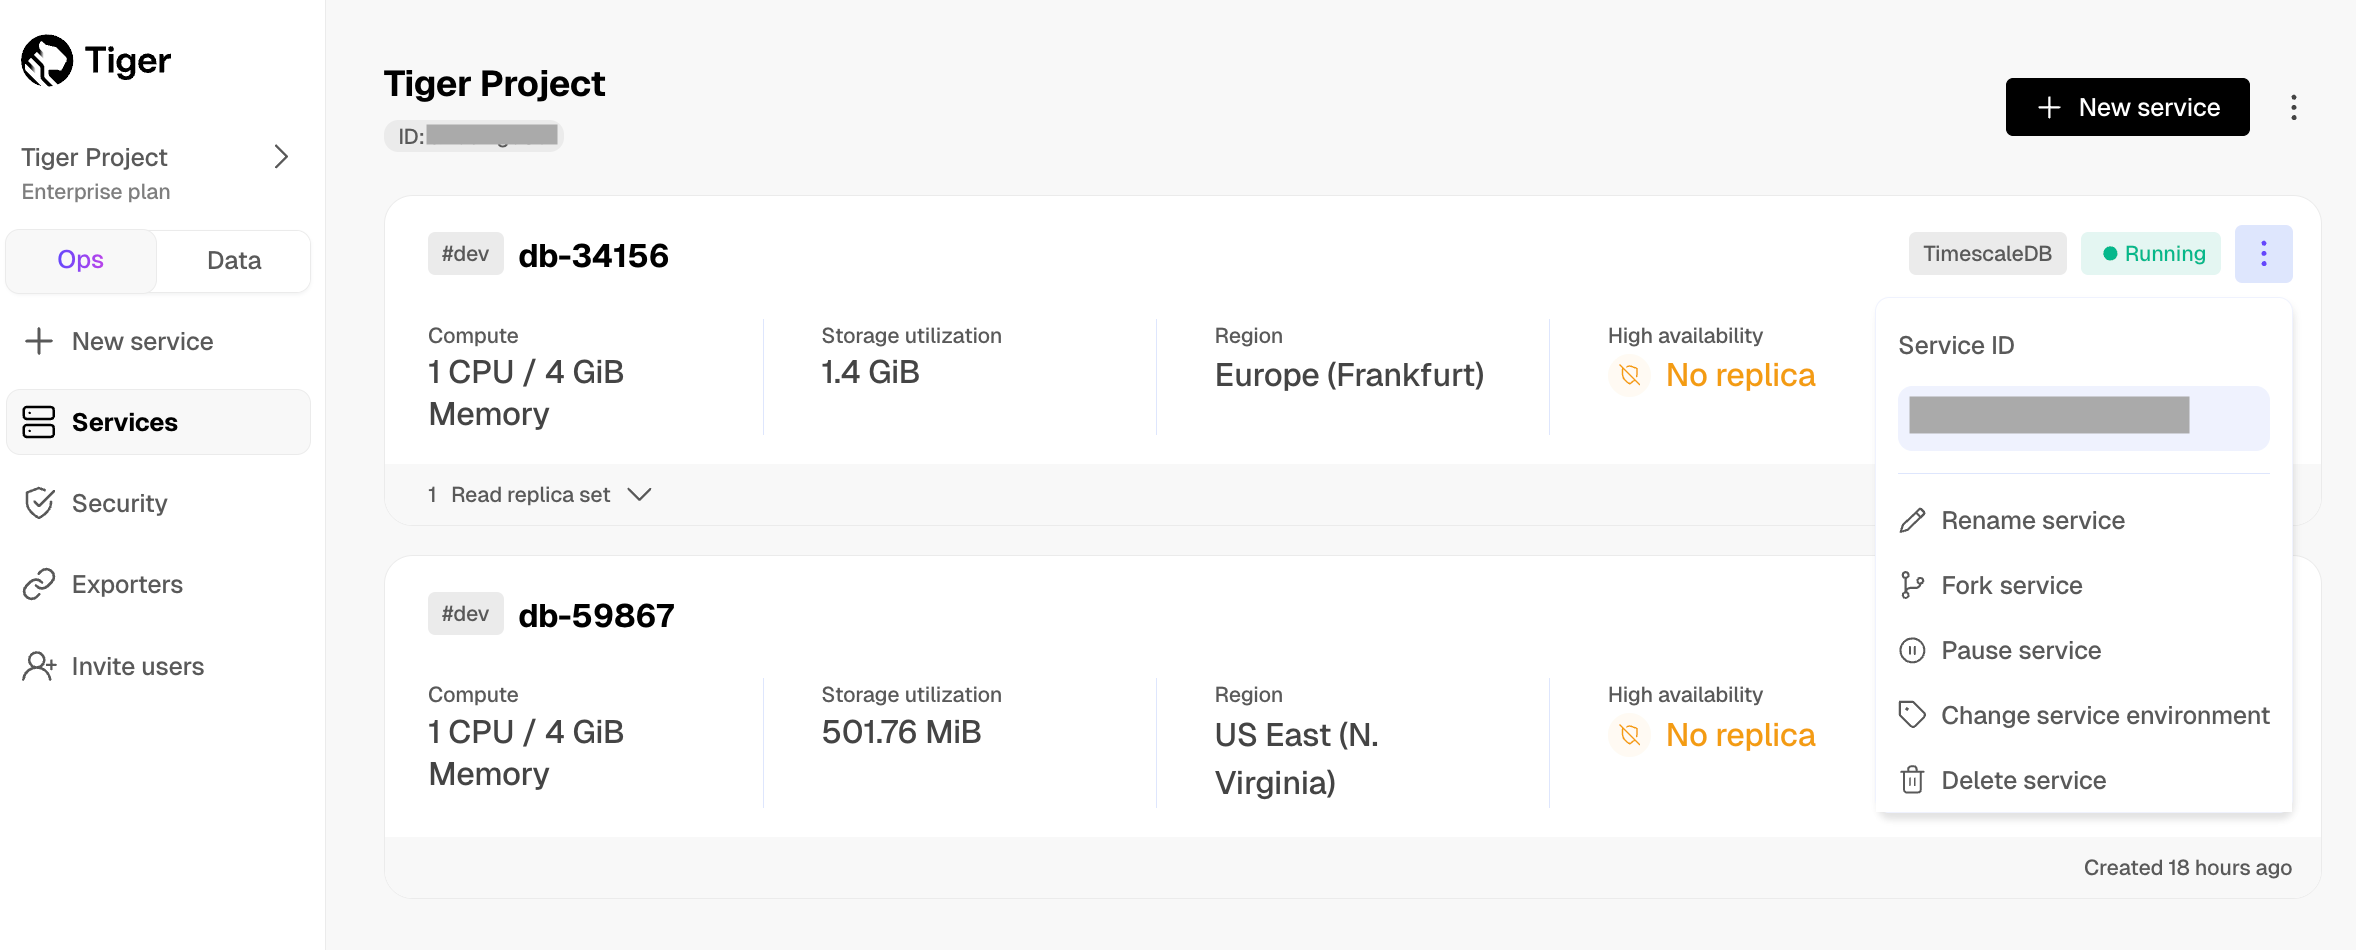 ## Create client credentials You use client credentials to obtain access tokens outside of the user context. To retrieve the connection details for your Tiger Cloud project for programmatic usage such as Terraform or the [Tiger Cloud REST API][rest-api-reference]: 1. **Open the settings for your project**: In [Tiger Cloud Console][console-services], click your project name in the upper left corner, then click `Project settings`. 1. **Create client credentials**: 1. Click `Create credentials`, then copy `Public key` and `Secret key` locally. 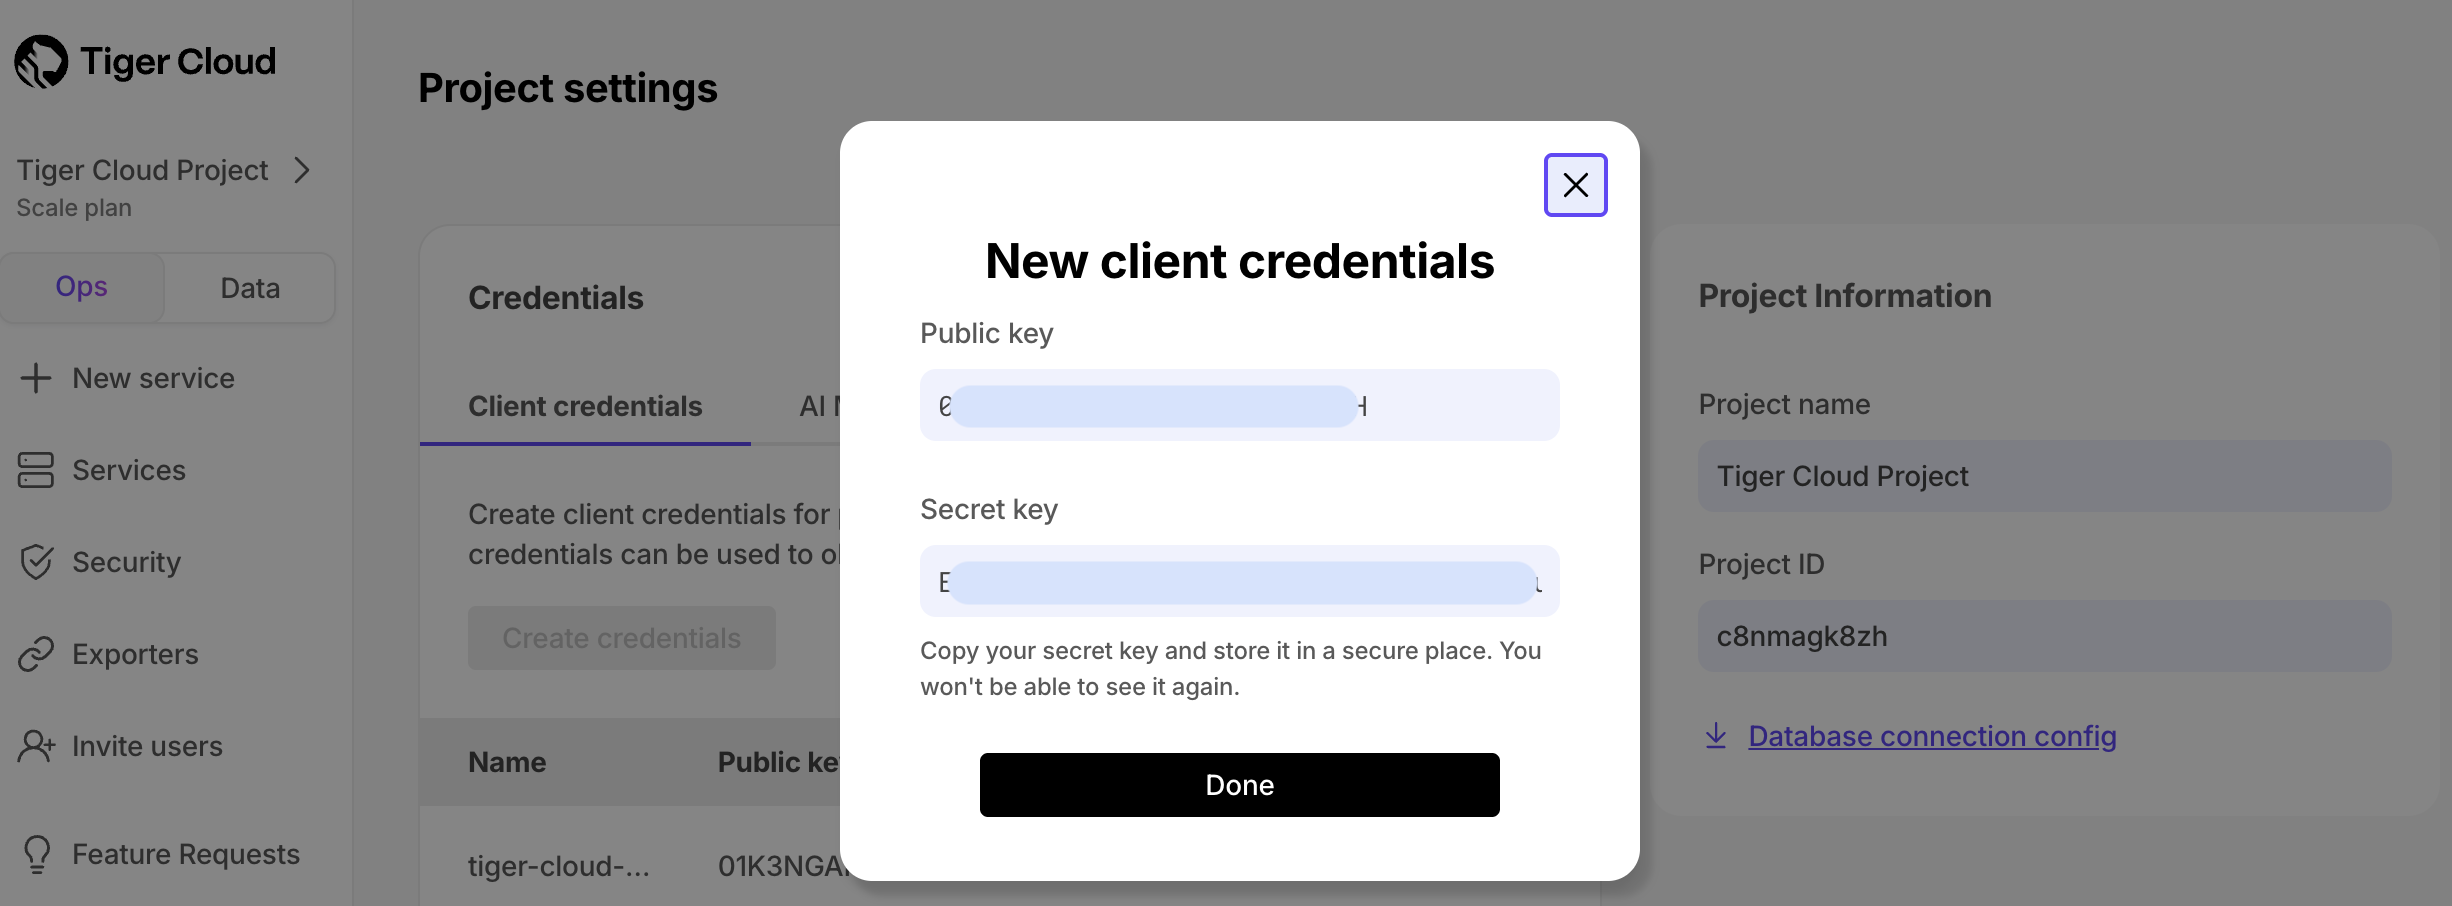 This is the only time you see the `Secret key`. After this, only the `Public key` is visible in this page. 1. Click `Done`. ## Create client credentials You use client credentials to obtain access tokens outside of the user context. To retrieve the connection details for your Tiger Cloud project for programmatic usage such as Terraform or the [Tiger Cloud REST API][rest-api-reference]: 1. **Open the settings for your project**: In [Tiger Cloud Console][console-services], click your project name in the upper left corner, then click `Project settings`. 1. **Create client credentials**: 1. Click `Create credentials`, then copy `Public key` and `Secret key` locally.  This is the only time you see the `Secret key`. After this, only the `Public key` is visible in this page. 1. Click `Done`. Find the connection details in the [Postgres configuration file][postgres-config] or by asking your database administrator. The `postgres` superuser, created during Postgres installation, has all the permissions required to run procedures in this documentation. However, it is recommended to create other users and assign permissions on the need-only basis. In the `Services` page of the MST Console, click the service you want to connect to. You see the connection details: 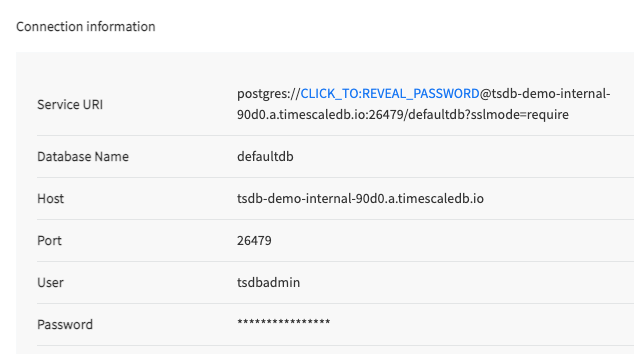 ===== PAGE: https://docs.tigerdata.com/integrations/terraform/ ===== # Integrate Terraform with Tiger [Terraform][terraform] is an infrastructure-as-code tool that enables you to safely and predictably provision and manage infrastructure. This page explains how to configure Terraform to manage your Tiger Cloud service or self-hosted TimescaleDB. ## Prerequisites To follow the steps on this page: * Create a target [Tiger Cloud service][create-service] with the Real-time analytics capability. You need [your connection details][connection-info]. This procedure also works for [self-hosted TimescaleDB][enable-timescaledb]. * [Download and install][terraform-install] Terraform. ## Configure Terraform Configure Terraform based on your deployment type: You use the [Tiger Data Terraform provider][terraform-provider] to manage Tiger Cloud services: 1. **Generate client credentials for programmatic use** 1. In [Tiger Cloud Console][console], click `Projects` and save your `Project ID`, then click `Project settings`. 1. Click `Create credentials`, then save `Public key` and `Secret key`. 1. **Configure Tiger Data Terraform provider** 1. Create a `main.tf` configuration file with at least the following content. Change `x.y.z` to the [latest version][terraform-provider] of the provider. ```hcl terraform { required_providers { timescale = { source = "timescale/timescale" version = "x.y.z" } } } provider "timescale" { project_id = var.ts_project_id access_key = var.ts_access_key secret_key = var.ts_secret_key } variable "ts_project_id" { type = string } variable "ts_access_key" { type = string } variable "ts_secret_key" { type = string } ``` 1. Create a `terraform.tfvars` file in the same directory as your `main.tf` to pass in the variable values: ```hcl export TF_VAR_ts_project_id="<your-timescale-project-id>" export TF_VAR_ts_access_key="<your-timescale-access-key>" export TF_VAR_ts_secret_key="<your-timescale-secret-key>" ``` 1. **Add your resources** Add your Tiger Cloud services or VPC connections to the `main.tf` configuration file. For example:hcl resource "timescale_service" "test" {
name = "test-service" milli_cpu = 500 memory_gb = 2 region_code = "us-east-1" enable_ha_replica = false timeouts = { create = "30m" }}
resource "timescale_vpc" "vpc" {
cidr = "10.10.0.0/16" name = "test-vpc" region_code = "us-east-1"}
You can now manage your resources with Terraform. See more about [available resources][terraform-resources] and [data sources][terraform-data-sources]. You use the [`cyrilgdn/postgresql`][pg-provider] Postgres provider to connect to your self-hosted TimescaleDB instance. Create a `main.tf` configuration file with the following content, using your [connection details][connection-info]:hcl terraform {
required_providers { postgresql = { source = "cyrilgdn/postgresql" version = ">= 1.15.0" } }}
provider "postgresql" {
host = "your-timescaledb-host" port = "your-timescaledb-port" database = "your-database-name" username = "your-username" password = "your-password" sslmode = "require" # Or "disable" if SSL isn't enabled}
You can now manage your database with Terraform. ===== PAGE: https://docs.tigerdata.com/integrations/azure-data-studio/ ===== # Integrate Azure Data Studio with Tiger [Azure Data Studio][azure-data-studio] is an open-source, cross-platform hybrid data analytics tool designed to simplify the data landscape. This page explains how to integrate Azure Data Studio with Tiger Cloud. ## Prerequisites To follow the steps on this page: * Create a target [Tiger Cloud service][create-service] with the Real-time analytics capability. You need [your connection details][connection-info]. This procedure also works for [self-hosted TimescaleDB][enable-timescaledb]. * Download and install [Azure Data Studio][ms-azure-data-studio]. * Install the [Postgres extension for Azure Data Studio][postgresql-azure-data-studio]. ## Connect to your Tiger Cloud service with Azure Data Studio To connect to Tiger Cloud: 1. **Start `Azure Data Studio`** 1. **In the `SERVERS` page, click `New Connection`** 1. **Configure the connection** 1. Select `PostgreSQL` for `Connection type`. 1. Configure the server name, database, username, port, and password using your [connection details][connection-info]. 1. Click `Advanced`. If you configured your Tiger Cloud service to connect using [stricter SSL mode][ssl-mode], set `SSL mode` to the configured mode, then type the location of your SSL root CA certificate in `SSL root certificate filename`. 1. In the `Port` field, type the port number and click `OK`. 1. **Click `Connect`** You have successfully integrated Azure Data Studio with Tiger Cloud. ===== PAGE: https://docs.tigerdata.com/integrations/telegraf/ ===== # Ingest data using Telegraf Telegraf is a server-based agent that collects and sends metrics and events from databases, systems, and IoT sensors. Telegraf is an open source, plugin-driven tool for the collection and output of data. To view metrics gathered by Telegraf and stored in a [hypertable][about-hypertables] in a Tiger Cloud service. - [Link Telegraf to your Tiger Cloud service](#link-telegraf-to-your-service): create a Telegraf configuration - [View the metrics collected by Telegraf](#view-the-metrics-collected-by-telegraf): connect to your service and query the metrics table ## Prerequisites Best practice is to use an [Ubuntu EC2 instance][create-ec2-instance] hosted in the same region as your Tiger Cloud service as a migration machine. That is, the machine you run the commands on to move your data from your source database to your target Tiger Cloud service. Before you migrate your data: - Create a target [Tiger Cloud service][created-a-database-service-in-timescale]. Each Tiger Cloud service has a single database that supports the [most popular extensions][all-available-extensions]. Tiger Cloud services do not support tablespaces, and there is no superuser associated with a service. Best practice is to create a Tiger Cloud service with at least 8 CPUs for a smoother experience. A higher-spec instance can significantly reduce the overall migration window. - To ensure that maintenance does not run during the process, [adjust the maintenance window][adjust-maintenance-window]. - [Install Telegraf][install-telegraf] ## Link Telegraf to your service To create a Telegraf configuration that exports data to a hypertable in your service: 1. **Set up your service connection string** This variable holds the connection information for the target Tiger Cloud service. In the terminal on the source machine, set the following:bash export TARGET=postgres://tsdbadmin:@:/tsdb?sslmode=require
See where to [find your connection details][connection-info]. 1. **Generate a Telegraf configuration file** In Terminal, run the following: ```bash telegraf --input-filter=cpu --output-filter=postgresql config > telegraf.conf ``` `telegraf.conf` configures a CPU input plugin that samples various metrics about CPU usage, and the Postgres output plugin. `telegraf.conf` also includes all available input, output, processor, and aggregator plugins. These are commented out by default. 1. **Test the configuration** ```bash telegraf --config telegraf.conf --test ``` You see an output similar to the following: ```bash 2022-11-28T12:53:44Z I! Starting Telegraf 1.24.3 2022-11-28T12:53:44Z I! Available plugins: 208 inputs, 9 aggregators, 26 processors, 20 parsers, 57 outputs 2022-11-28T12:53:44Z I! Loaded inputs: cpu 2022-11-28T12:53:44Z I! Loaded aggregators: 2022-11-28T12:53:44Z I! Loaded processors: 2022-11-28T12:53:44Z W! Outputs are not used in testing mode! 2022-11-28T12:53:44Z I! Tags enabled: host=localhost > cpu,cpu=cpu0,host=localhost usage_guest=0,usage_guest_nice=0,usage_idle=90.00000000087311,usage_iowait=0,usage_irq=0,usage_nice=0,usage_softirq=0,usage_steal=0,usage_system=6.000000000040018,usage_user=3.999999999996362 1669640025000000000 > cpu,cpu=cpu1,host=localhost usage_guest=0,usage_guest_nice=0,usage_idle=92.15686274495818,usage_iowait=0,usage_irq=0,usage_nice=0,usage_softirq=0,usage_steal=0,usage_system=5.882352941192206,usage_user=1.9607843136712912 1669640025000000000 > cpu,cpu=cpu2,host=localhost usage_guest=0,usage_guest_nice=0,usage_idle=91.99999999982538,usage_iowait=0,usage_irq=0,usage_nice=0,usage_softirq=0,usage_steal=0,usage_system=3.999999999996362,usage_user=3.999999999996362 1669640025000000000 ``` 1. **Configure the Postgres output plugin** 1. In `telegraf.conf`, in the `[[outputs.postgresql]]` section, set `connection` to the value of target. ```bash connection = "<VALUE OF target>" ``` 1. Use hypertables when Telegraf creates a new table: In the section that begins with the comment `## Templated statements to execute when creating a new table`, add the following template: ```bash ## Templated statements to execute when creating a new table. ``` The `by_range` dimension builder was added to TimescaleDB 2.13. ## View the metrics collected by Telegraf This section shows you how to generate system metrics using Telegraf, then connect to your service and query the metrics [hypertable][about-hypertables]. 1. **Collect system metrics using Telegraf** Run the following command for a 30 seconds: ```bash telegraf --config telegraf.conf ``` Telegraf uses loaded inputs `cpu` and outputs `postgresql` along with `global tags`, the intervals when the agent collects data from the inputs, and flushes to the outputs. 1. **View the metrics** 1. Connect to your Tiger Cloud service: ```bash psql target ``` 1. View the metrics collected in the `cpu` table in `tsdb`: ```sql SELECT*FROM cpu; ``` You see something like: ```sql time | cpu | host | usage_guest | usage_guest_nice | usage_idle | usage_iowait | usage_irq | usage_nice | usage_softirq | usage_steal | usage_system | usage_user ---------------------+-----------+----------------------------------+-------------+------------------+-------------------+--------------+-----------+------------+---------------+-------------+---------------------+--------------------- 2022-12-05 12:25:20 | cpu0 | hostname | 0 | 0 | 83.08605341237833 | 0 | 0 | 0 | 0 | 0 | 6.824925815961274 | 10.089020771444481 2022-12-05 12:25:20 | cpu1 | hostname | 0 | 0 | 84.27299703278959 | 0 | 0 | 0 | 0 | 0 | 5.934718100814769 | 9.792284866395647 2022-12-05 12:25:20 | cpu2 | hostname | 0 | 0 | 87.53709198848934 | 0 | 0 | 0 | 0 | 0 | 4.747774480755411 | 7.715133531241037 2022-12-05 12:25:20 | cpu3 | hostname| 0 | 0 | 86.68639053296472 | 0 | 0 | 0 | 0 | 0 | 4.43786982253345 | 8.875739645039992 2022-12-05 12:25:20 | cpu4 | hostname | 0 | 0 | 96.15384615371369 | 0 | 0 | 0 | 0 | 0 | 1.1834319526667423 | 2.6627218934917614 ``` To view the average usage per CPU core, use `SELECT cpu, avg(usage_user) FROM cpu GROUP BY cpu;`. For more information about the options that you can configure in Telegraf, see the [PostgreQL output plugin][output-plugin]. ===== PAGE: https://docs.tigerdata.com/integrations/supabase/ ===== # Integrate Supabase with Tiger [Supabase][supabase] is an open source Firebase alternative. This page shows how to run real-time analytical queries against a Tiger Cloud service through Supabase using a foreign data wrapper (fdw) to bring aggregated data from your Tiger Cloud service. ## Prerequisites To follow the steps on this page: * Create a target [Tiger Cloud service][create-service] with the Real-time analytics capability. You need [your connection details][connection-info]. This procedure also works for [self-hosted TimescaleDB][enable-timescaledb]. - Create a [Supabase project][supabase-new-project] ## Set up your Tiger Cloud service To set up a Tiger Cloud service optimized for analytics to receive data from Supabase: 1. **Optimize time-series data in hypertables** Time-series data represents how a system, process, or behavior changes over time. [Hypertables][hypertables-section] are Postgres tables that help you improve insert and query performance by automatically partitioning your data by time. 1. [Connect to your Tiger Cloud service][connect] and create a table that will point to a Supabase database: ```sql CREATE TABLE signs ( time timestamptz NOT NULL DEFAULT now(), origin_time timestamptz NOT NULL, name TEXT ) WITH ( tsdb.hypertable, tsdb.partition_column='time' ); ``` If you are self-hosting TimescaleDB v2.19.3 and below, create a [Postgres relational table][pg-create-table], then convert it using [create_hypertable][create_hypertable]. You then enable hypercore with a call to [ALTER TABLE][alter_table_hypercore]. 1. **Optimize cooling data for analytics** Hypercore is the hybrid row-columnar storage engine in TimescaleDB, designed specifically for real-time analytics and powered by time-series data. The advantage of hypercore is its ability to seamlessly switch between row-oriented and column-oriented storage. This flexibility enables TimescaleDB to deliver the best of both worlds, solving the key challenges in real-time analytics.sql ALTER TABLE signs SET (
timescaledb.enable_columnstore = true, timescaledb.segmentby = 'name');1. **Create optimized analytical queries** Continuous aggregates are designed to make queries on very large datasets run faster. Continuous aggregates in Tiger Cloud use Postgres [materialized views][postgres-materialized-views] to continuously, and incrementally refresh a query in the background, so that when you run the query, only the data that has changed needs to be computed, not the entire dataset. 1. Create a continuous aggregate pointing to the Supabase database. ```sql CREATE MATERIALIZED VIEW IF NOT EXISTS signs_per_minute WITH (timescaledb.continuous) AS SELECT time_bucket('1 minute', time) as ts, name, count(*) as total FROM signs GROUP BY 1, 2 WITH NO DATA; ``` 1. Setup a delay stats comparing `origin_time` to `time`. ```sql CREATE MATERIALIZED VIEW IF NOT EXISTS _signs_per_minute_delay WITH (timescaledb.continuous) AS SELECT time_bucket('1 minute', time) as ts, stats_agg(extract(epoch from origin_time - time)::float8) as delay_agg, candlestick_agg(time, extract(epoch from origin_time - time)::float8, 1) as delay_candlestick FROM signs GROUP BY 1 WITH NO DATA; ``` 1. Setup a view to recieve the data from Supabase. ```sql CREATE VIEW signs_per_minute_delay AS SELECT ts, average(delay_agg) as avg_delay, stddev(delay_agg) as stddev_delay, open(delay_candlestick) as open, high(delay_candlestick) as high, low(delay_candlestick) as low, close(delay_candlestick) as close FROM _signs_per_minute_delay ``` 1. **Add refresh policies for your analytical queries** You use `start_offset` and `end_offset` to define the time range that the continuous aggregate will cover. Assuming that the data is being inserted without any delay, set the `start_offset` to `5 minutes` and the `end_offset` to `1 minute`. This means that the continuous aggregate is refreshed every minute, and the refresh covers the last 5 minutes. You set `schedule_interval` to `INTERVAL '1 minute'` so the continuous aggregate refreshes on your Tiger Cloud service every minute. The data is accessed from Supabase, and the continuous aggregate is refreshed every minute in the other side.sql SELECT add_continuous_aggregate_policy('signs_per_minute',
start_offset => INTERVAL '5 minutes', end_offset => INTERVAL '1 minute', schedule_interval => INTERVAL '1 minute');Do the same thing for data inserted with a delay:sql SELECT add_continuous_aggregate_policy('_signs_per_minute_delay',
start_offset => INTERVAL '5 minutes', end_offset => INTERVAL '1 minute', schedule_interval => INTERVAL '1 minute');## Set up a Supabase database To set up a Supabase database that injects data into your Tiger Cloud service: 1. **Connect a foreign server in Supabase to your Tiger Cloud service** 1. Connect to your Supabase project using Supabase dashboard or psql. 1. Enable the `postgres_fdw` extension. ```sql CREATE EXTENSION postgres_fdw; ``` 1. Create a foreign server that points to your Tiger Cloud service. Update the following command with your [connection details][connection-info], then run it in the Supabase database: ```sql CREATE SERVER timescale FOREIGN DATA WRAPPER postgres_fdw OPTIONS ( host '<value of host>', port '<value of port>', dbname '<value of dbname>', sslmode 'require', extensions 'timescaledb' ); ``` 1. **Create the user mapping for the foreign server** Update the following command with your [connection details][connection-info], the run it in the Supabase database:sql CREATE USER MAPPING FOR CURRENT_USER SERVER timescale OPTIONS (
user '<value of user>', password '<value of password>');
1. **Create a foreign table that points to a table in your Tiger Cloud service.** This query introduced the following columns: - `time`: with a default value of `now()`. This is because the `time` column is used by Tiger Cloud to optimize data in the columnstore. - `origin_time`: store the original timestamp of the data. Using both columns, you understand the delay between Supabase (`origin_time`) and the time the data is inserted into your Tiger Cloud service (`time`).sql CREATE FOREIGN TABLE signs (
TIME timestamptz NOT NULL DEFAULT now(), origin_time timestamptz NOT NULL, NAME TEXT)SERVER timescale OPTIONS (
schema_name 'public', table_name 'signs');
1. **Create a foreign table in Supabase** 1. Create a foreign table that matches the `signs_per_minute` view in your Tiger Cloud service. It represents a top level view of the data. ```sql CREATE FOREIGN TABLE signs_per_minute ( ts timestamptz, name text, total int ) SERVER timescale OPTIONS (schema_name 'public', table_name 'signs_per_minute'); ``` 1. Create a foreign table that matches the `signs_per_minute_delay` view in your Tiger Cloud service. ```sql CREATE FOREIGN TABLE signs_per_minute_delay ( ts timestamptz, avg_delay float8, stddev_delay float8, open float8, high float8, low float8, close float8 ) SERVER timescale OPTIONS (schema_name 'public', table_name 'signs_per_minute_delay'); ``` ## Test the integration To inject data into your Tiger Cloud service from a Supabase database using a foreign table: 1. **Insert data into your Supabase database** Connect to Supabase and run the following query:sql INSERT INTO signs (origin_time, name) VALUES (now(), 'test')
1. **Check the data in your Tiger Cloud service** [Connect to your Tiger Cloud service][connect] and run the following query:sql SELECT * from signs;
You see something like: | origin_time | time | name | |-------------|------|------| | 2025-02-27 16:30:04.682391+00 | 2025-02-27 16:30:04.682391+00 | test | You have successfully integrated Supabase with your Tiger Cloud service. ===== PAGE: https://docs.tigerdata.com/integrations/index/ ===== # Integrations You can integrate your Tiger Cloud service with third-party solutions to expand and extend what you can do with your data. ## Integrates with Postgres? Integrates with your service! A Tiger Cloud service is a Postgres database instance extended by Tiger Data with custom capabilities. This means that any third-party solution that you can integrate with Postgres, you can also integrate with Tiger Cloud. See the full list of Postgres integrations [here][postgresql-integrations]. Some of the most in-demand integrations are listed below. ## Authentication and security | Name | Description | |:-----------------------------------------------------------------------------------------------------------------------------------:|---------------------------------------------------------------------------| | <img isIcon src='https://assets.timescale.com/docs/icons/auth-logo.png' alt='auth-logo' />[Auth.js][auth-js] | Implement authentication and authorization for web applications. | | <img isIcon src='https://assets.timescale.com/docs/icons/auth0-logo.png' alt='auth0-logo' />[Auth0][auth0] | Securely manage user authentication and access controls for applications. | | <img isIcon src='https://assets.timescale.com/docs/icons/okta-logo.png' alt='okta-logo' />[Okta][okta] | Secure authentication and user identity management for applications. | ## Business intelligence and data visualization | Name | Description | |:----------------------------------------------------------------------------------------------------------------------------------:|-------------------------------------------------------------------------| | <img isIcon src='https://assets.timescale.com/docs/icons/cube-js-logo.png' alt='cubejs-logo' />[Cube.js][cube-js] | Build and optimize data APIs for analytics applications. | | <img isIcon src='https://assets.timescale.com/docs/icons/looker-logo.png' alt='looker-logo' />[Looker][looker] | Explore, analyze, and share business insights with a BI platform. | | <img isIcon src='https://assets.timescale.com/docs/icons/metabase-logo.png' alt='metabase-logo' />[Metabase][metabase] | Create dashboards and visualize business data without SQL expertise. | | <img isIcon src='https://assets.timescale.com/docs/icons/power-bi-logo.png' alt='power-bi-logo' />[Power BI][power-bi] | Visualize data, build interactive dashboards, and share insights. | | <img isIcon src='https://assets.timescale.com/docs/icons/superset-logo.png' alt='superset-logo' />[Superset][superset] | Create and explore data visualizations and dashboards. | ## Configuration and deployment | Name | Description | |:----------------------------------:|--------------------------------------------------------------------------------| | <img isIcon src='https://assets.timescale.com/docs/icons/azure-functions-logo.png' alt='azure-functions-logo' />[Azure Functions][azure-functions] | Run event-driven serverless code in the cloud without managing infrastructure. | | <img isIcon src='https://assets.timescale.com/docs/icons/deno-deploy-logo.png' alt='deno-deploy-logo' />[Deno Deploy][deno-deploy] | Deploy and run JavaScript and TypeScript applications at the edge. | | <img isIcon src='https://assets.timescale.com/docs/icons/flyway-logo.png' alt='flyway-logo' />[Flyway][flyway] | Manage and automate database migrations using version control. | | <img isIcon src='https://assets.timescale.com/docs/icons/liquibase-logo.png' alt='liquibase-logo' />[Liquibase][liquibase] | Track, version, and automate database schema changes. | | <img isIcon src='https://assets.timescale.com/docs/icons/pulimi-logo.png' alt='pulimi-logo' />[Pulumi][pulumi] | Define and manage cloud infrastructure using code in multiple languages. | | <img isIcon src='https://assets.timescale.com/docs/icons/render-logo.png' alt='render-logo' />[Render][render] | Deploy and scale web applications, databases, and services easily. | | <img isIcon src='https://assets.timescale.com/docs/icons/terraform-logo.png' alt='terraform-logo' />[Terraform][terraform] | Safely and predictably provision and manage infrastructure in any cloud. | | <img isIcon src='https://assets.timescale.com/docs/icons/kubernets-logo.png' alt='kubernets-logo' />[Kubernetes][kubernetes] | Deploy, scale, and manage containerized applications automatically. | ## Data engineering and extract, transform, load | Name | Description | |:------------------------------------:|------------------------------------------------------------------------------------------| | <img isIcon src='https://assets.timescale.com/docs/icons/airbyte-logo.png' alt='airbyte-logo' />[Airbyte][airbyte] | Sync data between various sources and destinations. | | <img isIcon src='https://assets.timescale.com/docs/icons/amazon-sagemaker-logo.png' alt='amazon-sagemaker-logo' />[Amazon SageMaker][amazon-sagemaker] | Build, train, and deploy ML models into a production-ready hosted environment. | | <img isIcon src='https://assets.timescale.com/docs/icons/airflow-logo.png' alt='airflow-logo' />[Apache Airflow][apache-airflow] | Programmatically author, schedule, and monitor workflows. | | <img isIcon src='https://assets.timescale.com/docs/icons/beam-logo.png' alt='beam-logo' />[Apache Beam][apache-beam] | Build and execute batch and streaming data pipelines across multiple processing engines. | | <img isIcon src='https://assets.timescale.com/docs/icons/kafka-logo.png' alt='kafka-logo' />[Apache Kafka][kafka] | Stream high-performance data pipelines, analytics, and data integration. | | <img isIcon src='https://assets.timescale.com/docs/icons/lambda-logo.png' alt='lambda-logo' />[AWS Lambda][aws-lambda] | Run code without provisioning or managing servers, scaling automatically as needed. | | <img isIcon src='https://assets.timescale.com/docs/icons/dbt-logo.png' alt='dbt-logo' />[dbt][dbt] | Transform and model data in your warehouse using SQL-based workflows. | | <img isIcon src='https://assets.timescale.com/docs/icons/debezium-logo.png' alt='debezium-logo' />[Debezium][debezium] | Capture and stream real-time changes from databases. | | <img isIcon src='https://assets.timescale.com/docs/icons/decodable-logo.png' alt='decodable-logo' />[Decodable][decodable] | Build, run, and manage data pipelines effortlessly. | | <img isIcon src='https://assets.timescale.com/docs/icons/delta-lake-logo.png' alt='delta-lake-logo' />[DeltaLake][deltalake] | Enhance data lakes with ACID transactions and schema enforcement. | | <img isIcon src='https://assets.timescale.com/docs/icons/firebase-logo.png' alt='firebase-logo' />[Firebase Wrapper][firebase-wrapper] | Simplify interactions with Firebase services through an abstraction layer. | | <img isIcon src='https://assets.timescale.com/docs/icons/stitch-logo.png' alt='stitch-logo' />[Stitch][stitch] | Extract, load, and transform data from various sources to data warehouses. | ## Data ingestion and streaming | Name | Description | |:-------------------------------------------------------------------------------------------------------------------------------------:|----------------------------------------------------------------------------------------------------------------------------| | <img isIcon src='https://assets.timescale.com/docs/icons/spark-logo.png' alt='spark-logo' />[Apache Spark][apache-spark] | Process large-scale data workloads quickly using distributed computing. | | <img isIcon src='https://assets.timescale.com/docs/icons/confluent-logo.png' alt='confluent-logo' />[Confluent][confluent] | Manage and scale Apache Kafka-based event streaming applications. You can also [set up Postgres as a source][confluent-source]. | | <img isIcon src='https://assets.timescale.com/docs/icons/electric-sql-logo.png' alt='electric-sql-logo' />[ElectricSQL][electricsql] | Enable real-time synchronization between databases and frontend applications. | | <img isIcon src='https://assets.timescale.com/docs/icons/emqx-logo.png' alt='emqx-logo' />[EMQX][emqx] | Deploy an enterprise-grade MQTT broker for IoT messaging. | | <img isIcon src='https://assets.timescale.com/docs/icons/estuary-logo.png' alt='estuary-logo' />[Estuary][estuary] | Stream and synchronize data in real time between different systems. | | <img isIcon src='https://assets.timescale.com/docs/icons/flink-logo.png' alt='flink-logo' />[Flink][flink] | Process real-time data streams with fault-tolerant distributed computing. | | <img isIcon src='https://assets.timescale.com/docs/icons/fivetran-logo.png' alt='fivetran-logo' />[Fivetran][fivetran] | Sync data from multiple sources to your data warehouse. | | <img isIcon src='https://assets.timescale.com/docs/icons/highbyte-logo.svg' alt='highbyte-logo' />[HighByte][highbyte] | Connect operational technology sources, model the data, and stream it into Postgres. | | <img isIcon src='https://assets.timescale.com/docs/icons/red-panda-logo.png' alt='red-panda-logo' />[Redpanda][redpanda] | Stream and process real-time data as a Kafka-compatible platform. | | <img isIcon src='https://assets.timescale.com/docs/icons/striim-logo.png' alt='strimm-logo' />[Striim][striim] | Ingest, process, and analyze real-time data streams. | ## Development tools | Name | Description | |:---------------------------------------:|--------------------------------------------------------------------------------------| | <img isIcon src='https://assets.timescale.com/docs/icons/deepnote-logo.png' alt='deepnote-logo' />[Deepnote][deepnote] | Collaborate on data science projects with a cloud-based notebook platform. | | <img isIcon src='https://assets.timescale.com/docs/icons/django-logo.png' alt='django-logo' />[Django][django] | Develop scalable and secure web applications using a Python framework. | | <img isIcon src='https://assets.timescale.com/docs/icons/long-chain-logo.png' alt='long-chain-logo' />[LangChain][langchain] | Build applications that integrate with language models like GPT. | | <img isIcon src='https://assets.timescale.com/docs/icons/rust-logo.png' alt='rust-logo' />[Rust][rust] | Build high-performance, memory-safe applications with a modern programming language. | | <img isIcon src='https://assets.timescale.com/docs/icons/streamlit-logo.png' alt='streamlit-logo' />[Streamlit][streamlit] | Create interactive data applications and dashboards using Python. | ## Language-specific integrations | Name | Description | |:------------------:|---------------------------------------------------| | <img isIcon src='https://assets.timescale.com/docs/icons/golang-logo.png' alt='golang-logo' />[Golang][golang] | Integrate Tiger Cloud with a Golang application. | | <img isIcon src='https://assets.timescale.com/docs/icons/java-logo.png' alt='java-logo' />[Java][java] | Integrate Tiger Cloud with a Java application. | | <img isIcon src='https://assets.timescale.com/docs/icons/node-logo.png' alt='node-logo' />[Node.js][node-js] | Integrate Tiger Cloud with a Node.js application. | | <img isIcon src='https://assets.timescale.com/docs/icons/python-logo.png' alt='python-logo' />[Python][python] | Integrate Tiger Cloud with a Python application. | | <img isIcon src='https://assets.timescale.com/docs/icons/ruby-logo.png' alt='ruby-logo' />[Ruby][ruby] | Integrate Tiger Cloud with a Ruby application. | ## Logging and system administration | Name | Description | |:----------------------:|---------------------------------------------------------------------------| | <img isIcon src='https://assets.timescale.com/docs/icons/rsyslog-logo.png' alt='rsyslog-logo' />[RSyslog][rsyslog] | Collect, filter, and forward system logs for centralized logging. | | <img isIcon src='https://assets.timescale.com/docs/icons/schemaspy-logo.png' alt='schemaspy-logo' />[SchemaSpy][schemaspy] | Generate database schema documentation and visualization. | ## Observability and alerting | Name | Description | |:------------------------------------------------------:|-----------------------------------------------------------------------------------------------------------------------------------------------------------| | <img isIcon src='https://assets.timescale.com/docs/icons/cloudwatch-logo.png' alt='cloudwatch-logo' />[Amazon Cloudwatch][cloudwatch] | Collect, analyze, and act on data from applications, infrastructure, and services running in AWS and on-premises environments. | | <img isIcon src='https://assets.timescale.com/docs/icons/skywalking-logo.png' alt='skywalking-logo' />[Apache SkyWalking][apache-skywalking] | Monitor, trace, and diagnose distributed applications for improved observability. You can also [set up Postgres as storage][apache-skywalking-storage]. | | <img isIcon src='https://assets.timescale.com/docs/icons/azure-monitor-logo.png' alt='azure-monitor-logo' />[Azure Monitor][azure-monitor] | Collect and analyze telemetry data from cloud and on-premises environments. | <img isIcon src='https://assets.timescale.com/docs/icons/dash0-logo.png' alt='dash0-logo' />[Dash0][dash0] | OpenTelemetry Native Observability, built on CNCF Open Standards like PromQL, Perses, and OTLP, and offering full cost control. | | <img isIcon src='https://assets.timescale.com/docs/icons/datadog-logo.png' alt='datadog-logo' />[Datadog][datadog] | Gain comprehensive visibility into applications, infrastructure, and systems through real-time monitoring, logging, and analytics. | | <img isIcon src='https://assets.timescale.com/docs/icons/grafana-logo.png' alt='grafana-logo' />[Grafana][grafana] | Query, visualize, alert on, and explore your metrics and logs. | | <img isIcon src='https://assets.timescale.com/docs/icons/instana-logo.png' alt='instana-logo' />[IBM Instana][ibm-instana] | Monitor application performance and detect issues in real-time. | | <img isIcon src='https://assets.timescale.com/docs/icons/jaeger-logo.png' alt='jaeger-logo' />[Jaeger][jaeger] | Trace and diagnose distributed transactions for observability. | | <img isIcon src='https://assets.timescale.com/docs/icons/new-relic-logo.png' alt='new-relic-logo' />[New Relic][new-relic] | Monitor applications, infrastructure, and logs for performance insights. | | <img isIcon src='https://assets.timescale.com/docs/icons/open-telemetery-logo.png' alt='open-telemetery-logo' />[OpenTelemetry Beta][opentelemetry] | Collect and analyze telemetry data for observability across systems. | | <img isIcon src='https://assets.timescale.com/docs/icons/prometheus-logo.png' alt='prometheus-logo' />[Prometheus][prometheus] | Track the performance and health of systems, applications, and infrastructure. | | <img isIcon src='https://assets.timescale.com/docs/icons/signoz-logo.png' alt='signoz-logo' />[SigNoz][signoz] | Monitor application performance with an open-source observability tool. | | <img isIcon src='https://assets.timescale.com/docs/icons/tableau-logo.png' alt='tableau-logo' />[Tableau][tableau] | Connect to data sources, analyze data, and create interactive visualizations and dashboards. | | <img isIcon src='https://assets.timescale.com/docs/icons/Influx-telegraf.svg' alt='telegraf-logo' />[Telegraf][telegraf] | Collect, process, and ship metrics and events into databases or monitoring platforms. | ## Query and administration | Name | Description | |:--------------------------------------------------------------------------------------------------------------------------------------------:|-------------------------------------------------------------------------------------------------------------------------------------------| | <img isIcon src='https://assets.timescale.com/docs/icons/azure-data-studio-logo.png' alt='azure-data-studio-logo' />[Azure Data Studio][ads] | Query, manage, visualize, and develop databases across SQL Server, Azure SQL, and Postgres. | | <img isIcon src='https://assets.timescale.com/docs/icons/dbeaver-logo.png' alt='dbeaver-logo' />[DBeaver][dbeaver] | Connect to, manage, query, and analyze multiple database in a single interface with SQL editing, visualization, and administration tools. | | <img isIcon src='https://assets.timescale.com/docs/icons/forest-admin-logo.png' alt='forest-admin-logo' />[Forest Admin][forest-admin] | Create admin panels and dashboards for business applications. | | <img isIcon src='https://assets.timescale.com/docs/icons/hasura-logo.png' alt='hasura-logo' />[Hasura][hasura] | Instantly generate GraphQL APIs from databases with access control. | | <img isIcon src='https://assets.timescale.com/docs/icons/mode-logo.png' alt='mode-logo' />[Mode Analytics][mode-analytics] | Analyze data, create reports, and share insights with teams. | | <img isIcon src='https://assets.timescale.com/docs/icons/neon-logo.png' alt='neon-logo' />[Neon][neon] | Run a cloud-native, serverless Postgres database with automatic scaling. | | <img isIcon src='https://assets.timescale.com/docs/icons/pgadmin-logo.png' alt='pgadmin-logo' />[pgAdmin][pgadmin] | Manage, query, and administer Postgres databases through a graphical interface. | | <img isIcon src='https://assets.timescale.com/docs/icons/postgresql-logo.png' alt='postgresql-logo' />[Postgres][postgresql] | Access and query data from external sources as if they were regular Postgres tables. | | <img isIcon src='https://assets.timescale.com/docs/icons/prisma-logo.png' alt='prisma-logo' />[Prisma][prisma] | Simplify database access with an open-source ORM for Node.js. | | <img isIcon src='https://assets.timescale.com/docs/icons/psql-logo.png' alt='psql-logo' />[psql][psql] | Run SQL queries, manage databases, automate tasks, and interact directly with Postgres. | | <img isIcon src='https://assets.timescale.com/docs/icons/qlik-logo.png' alt='qlik-logo' />[Qlik Replicate][qlik-replicate] | Move and synchronize data across multiple database platforms. You an also [set up Postgres as a source][qlik-source]. | | <img isIcon src='https://assets.timescale.com/docs/icons/qstudio-logo.png' alt='qstudio-logo' />[qStudio][qstudio] | Write and execute SQL queries, manage database objects, and analyze data in a user-friendly interface. | | <img isIcon src='https://assets.timescale.com/docs/icons/redash-logo.png' alt='redash-logo' />[Redash][redash] | Query, visualize, and share data from multiple sources. | | <img isIcon src='https://assets.timescale.com/docs/icons/sql-alchemy-logo.png' alt='sqlalchemy-logo' />[SQLalchemy][sqlalchemy] | Manage database operations using a Python SQL toolkit and ORM. | | <img isIcon src='https://assets.timescale.com/docs/icons/sequelize-logo.png' alt='sequelize-logo' />[Sequelize][sequelize] | Interact with SQL databases in Node.js using an ORM. | | <img isIcon src='https://assets.timescale.com/docs/icons/stepzen-logo.png' alt='stepzen-logo' />[StepZen][stepzen] | Build and deploy GraphQL APIs with data from multiple sources. | | <img isIcon src='https://assets.timescale.com/docs/icons/typeorm-logo.png' alt='typeorm-logo' />[TypeORM][typeorm] | Work with databases in TypeScript and JavaScript using an ORM. | ## Secure connectivity to Tiger Cloud | Name | Description | |:------------------------------------:|-----------------------------------------------------------------------------| | <img isIcon src='https://assets.timescale.com/docs/icons/aws-logo.png' alt='aws-logo' />[Amazon Web Services][aws] | Connect your other services and applications running in AWS to Tiger Cloud. | | <img isIcon src='https://assets.timescale.com/docs/icons/corporate-data-center-logo.png' alt='corporate-data-center-logo' />[Corporate data center][data-center] | Connect your on-premise data center to Tiger Cloud. | <img isIcon src='https://assets.timescale.com/docs/icons/google-cloud-logo.png' alt='google-cloud-logo' />[Google Cloud][google-cloud] | Connect your Google Cloud infrastructure to Tiger Cloud. | | <img isIcon src='https://assets.timescale.com/docs/icons/azure-logo.png' alt='azure-logo' />[Microsoft Azure][azure] | Connect your Microsoft Azure infrastructure to Tiger Cloud. | ## Workflow automation and no-code tools | Name | Description | |:--------------------:|---------------------------------------------------------------------------| | <img isIcon src='https://assets.timescale.com/docs/icons/appsmith-logo.png' alt='appsmith-logo' />[Appsmith][appsmith] | Create internal business applications with a low-code platform. | | <img isIcon src='https://assets.timescale.com/docs/icons/n8n-logo.png' alt='n8n-logo' />[n8n][n8n] | Automate workflows and integrate services with a no-code platform. | | <img isIcon src='https://assets.timescale.com/docs/icons/retool-logo.png' alt='retool-logo' />[Retool][retool] | Build custom internal tools quickly using a drag-and-drop interface. | | <img isIcon src='https://assets.timescale.com/docs/icons/tooljet-logo.png' alt='tooljet-logo' />[Tooljet][tooljet] | Develop internal tools and business applications with a low-code builder. | | <img isIcon src='https://assets.timescale.com/docs/icons/zapier-logo.png' alt='zapier-logo' />[Zapier][zapier] | Automate workflows by connecting different applications and services. | ===== PAGE: https://docs.tigerdata.com/integrations/aws-lambda/ ===== # Integrate AWS Lambda with Tiger Cloud [AWS Lambda][AWS-Lambda] is a serverless computing service provided by Amazon Web Services (AWS) that allows you to run code without provisioning or managing servers, scaling automatically as needed. This page shows you how to integrate AWS Lambda with Tiger Cloud service to process and store time-series data efficiently. ## Prerequisites To follow the steps on this page: * Create a target [Tiger Cloud service][create-service] with the Real-time analytics capability. You need [your connection details][connection-info]. This procedure also works for [self-hosted TimescaleDB][enable-timescaledb]. * Set up an [AWS Account][aws-sign-up]. * Install and configure [AWS CLI][install-aws-cli]. * Install [NodeJS v18.x or later][install-nodejs]. ## Prepare your Tiger Cloud service to ingest data from AWS Lambda Create a table in Tiger Cloud service to store time-series data. 1. **Connect to your Tiger Cloud service** For Tiger Cloud, open an [SQL editor][run-queries] in [Tiger Cloud Console][open-console]. For self-hosted TimescaleDB, use [`psql`][psql]. 1. **Create a hypertable to store sensor data** [Hypertables][about-hypertables] are Postgres tables that automatically partition your data by time. You interact with hypertables in the same way as regular Postgres tables, but with extra features that make managing your time-series data much easier.sql CREATE TABLE sensor_data (
time TIMESTAMPTZ NOT NULL, sensor_id TEXT NOT NULL, value DOUBLE PRECISION NOT NULL) WITH (
tsdb.hypertable, tsdb.partition_column='time');
If you are self-hosting TimescaleDB v2.19.3 and below, create a [Postgres relational table][pg-create-table], then convert it using [create_hypertable][create_hypertable]. You then enable hypercore with a call to [ALTER TABLE][alter_table_hypercore]. ## Create the code to inject data into a Tiger Cloud service Write an AWS Lambda function in a Node.js project that processes and inserts time-series data into a Tiger Cloud service. 1. **Initialize a new Node.js project to hold your Lambda function**shell mkdir lambda-timescale && cd lambda-timescale npm init -y
1. **Install the Postgres client library in your project**shell npm install pg
1. **Write a Lambda Function that inserts data into your Tiger Cloud service** Create a file named `index.js`, then add the following code:javascript const {
Client} = require('pg');
exports.handler = async (event) => {
const client = new Client({ host: process.env.TIMESCALE_HOST, port: process.env.TIMESCALE_PORT, user: process.env.TIMESCALE_USER, password: process.env.TIMESCALE_PASSWORD, database: process.env.TIMESCALE_DB, }); try { await client.connect(); // const query = ` INSERT INTO sensor_data (time, sensor_id, value) VALUES ($1, $2, $3); `; const data = JSON.parse(event.body); const values = [new Date(), data.sensor_id, data.value]; await client.query(query, values); return { statusCode: 200, body: JSON.stringify({ message: 'Data inserted successfully!' }), }; } catch (error) { console.error('Error inserting data:', error); return { statusCode: 500, body: JSON.stringify({ error: 'Failed to insert data.' }), }; } finally { await client.end(); }};
## Deploy your Node project to AWS Lambda To create an AWS Lambda function that injects data into your Tiger Cloud service: 1. **Compress your code into a `.zip`**shell zip -r lambda-timescale.zip .
1. **Deploy to AWS Lambda** In the following example, replace `<IAM_ROLE_ARN>` with your [AWS IAM credentials][aws-iam-role], then use AWS CLI to create a Lambda function for your project:shell aws lambda create-function
--function-name TimescaleIntegration \ --runtime nodejs14.x \ --role <IAM_ROLE_ARN> \ --handler index.handler \ --zip-file fileb://lambda-timescale.zip1. **Set up environment variables** In the following example, use your [connection details][connection-info] to add your Tiger Cloud service connection settings to your Lambda function:shell aws lambda update-function-configuration \ --function-name TimescaleIntegration \ --environment "Variables={TIMESCALE_HOST=,TIMESCALE_PORT=,
TIMESCALE_USER=<Username>,TIMESCALE_PASSWORD=<Password>, \ TIMESCALE_DB=<Database name>}"1. **Test your AWS Lambda function** 1. Invoke the Lambda function and send some data to your Tiger Cloud service: ```shell aws lambda invoke \ --function-name TimescaleIntegration \ --payload '{"body": "{\"sensor_id\": \"sensor-123\", \"value\": 42.5}"}' \ --cli-binary-format raw-in-base64-out \ response.json ``` 1. Verify that the data is in your service. Open an [SQL editor][run-queries] and check the `sensor_data` table: ```sql SELECT * FROM sensor_data; ``` You see something like: | time | sensor_id | value | |-- |-- |--------| | 2025-02-10 10:58:45.134912+00 | sensor-123 | 42.5 | You can now seamlessly ingest time-series data from AWS Lambda into Tiger Cloud. ===== PAGE: https://docs.tigerdata.com/integrations/postgresql/ ===== # Integrate with PostgreSQL You use Postgres foreign data wrappers (FDWs) to query external data sources from a Tiger Cloud service. These external data sources can be one of the following: - Other Tiger Cloud services - Postgres databases outside of Tiger Cloud If you are using VPC peering, you can create FDWs in your Customer VPC to query a service in your Tiger Cloud project. However, you can't create FDWs in your Tiger Cloud services to query a data source in your Customer VPC. This is because Tiger Cloud VPC peering uses AWS PrivateLink for increased security. See [VPC peering documentation][vpc-peering] for additional details. Postgres FDWs are particularly useful if you manage multiple Tiger Cloud services with different capabilities, and need to seamlessly access and merge regular and time-series data. ## Prerequisites To follow the steps on this page: * Create a target [Tiger Cloud service][create-service] with the Real-time analytics capability. You need [your connection details][connection-info]. This procedure also works for [self-hosted TimescaleDB][enable-timescaledb]. ## Query another data source To query another data source: You create Postgres FDWs with the `postgres_fdw` extension, which is enabled by default in Tiger Cloud. 1. **Connect to your service** See [how to connect][connect]. 1. **Create a server** Run the following command using your [connection details][connection-info]:sql CREATE SERVER myserver FOREIGN DATA WRAPPER postgres_fdw OPTIONS (host '', dbname 'tsdb', port '');
1. **Create user mapping** Run the following command using your [connection details][connection-info]:sql CREATE USER MAPPING FOR tsdbadmin SERVER myserver OPTIONS (user 'tsdbadmin', password '');
1. **Import a foreign schema (recommended) or create a foreign table** - Import the whole schema: ```sql CREATE SCHEMA foreign_stuff; IMPORT FOREIGN SCHEMA public FROM SERVER myserver INTO foreign_stuff ; ``` - Alternatively, import a limited number of tables: ```sql CREATE SCHEMA foreign_stuff; IMPORT FOREIGN SCHEMA public LIMIT TO (table1, table2) FROM SERVER myserver INTO foreign_stuff; ``` - Create a foreign table. Skip if you are importing a schema: ```sql CREATE FOREIGN TABLE films ( code char(5) NOT NULL, title varchar(40) NOT NULL, did integer NOT NULL, date_prod date, kind varchar(10), len interval hour to minute ) SERVER film_server; ``` A user with the `tsdbadmin` role assigned already has the required `USAGE` permission to create Postgres FDWs. You can enable another user, without the `tsdbadmin` role assigned, to query foreign data. To do so, explicitly grant the permission. For example, for a new `grafana` user:sql CREATE USER grafana;
GRANT grafana TO tsdbadmin;
CREATE SCHEMA fdw AUTHORIZATION grafana;
CREATE SERVER db1 FOREIGN DATA WRAPPER postgres_fdw OPTIONS (host '', dbname 'tsdb', port '');
CREATE USER MAPPING FOR grafana SERVER db1 OPTIONS (user 'tsdbadmin', password '');
GRANT USAGE ON FOREIGN SERVER db1 TO grafana;
SET ROLE grafana;
IMPORT FOREIGN SCHEMA public
FROM SERVER db1 INTO fdw;You create Postgres FDWs with the `postgres_fdw` extension. See [documenation][enable-fdw-docs] on how to enable it. 1. **Connect to your database** Use [`psql`][psql] to connect to your database. 1. **Create a server** Run the following command using your [connection details][connection-info]:sql CREATE SERVER myserver FOREIGN DATA WRAPPER postgres_fdw OPTIONS (host '', dbname '', port '');
1. **Create user mapping** Run the following command using your [connection details][connection-info]:sql CREATE USER MAPPING FOR postgres SERVER myserver OPTIONS (user 'postgres', password '');
1. **Import a foreign schema (recommended) or create a foreign table** - Import the whole schema: ```sql CREATE SCHEMA foreign_stuff; IMPORT FOREIGN SCHEMA public FROM SERVER myserver INTO foreign_stuff ; ``` - Alternatively, import a limited number of tables: ```sql CREATE SCHEMA foreign_stuff; IMPORT FOREIGN SCHEMA public LIMIT TO (table1, table2) FROM SERVER myserver INTO foreign_stuff; ``` - Create a foreign table. Skip if you are importing a schema: ```sql CREATE FOREIGN TABLE films ( code char(5) NOT NULL, title varchar(40) NOT NULL, did integer NOT NULL, date_prod date, kind varchar(10), len interval hour to minute ) SERVER film_server; ``` ===== PAGE: https://docs.tigerdata.com/integrations/power-bi/ ===== # Integrate Power BI with Tiger [Power BI][power-bi] is a business analytics tool for visualizing data, creating interactive reports, and sharing insights across an organization. This page explains how to integrate Power BI with Tiger Cloud using the Postgres ODBC driver, so that you can build interactive reports based on the data in your Tiger Cloud service. ## Prerequisites To follow the steps on this page: * Create a target [Tiger Cloud service][create-service] with the Real-time analytics capability. You need [your connection details][connection-info]. This procedure also works for [self-hosted TimescaleDB][enable-timescaledb]. - Download [Power BI Desktop][power-bi-install] on your Microsoft Windows machine. - Install the [PostgreSQL ODBC driver][postgresql-odbc-driver]. ## Add your Tiger Cloud service as an ODBC data source Use the PostgreSQL ODBC driver to connect Power BI to Tiger Cloud. 1. **Open the ODBC data sources** On your Windows machine, search for and select `ODBC Data Sources`. 1. **Connect to your Tiger Cloud service** 1. Under `User DSN`, click `Add`. 1. Choose `PostgreSQL Unicode` and click `Finish`. 1. Use your [connection details][connection-info] to configure the data source. 1. Click `Test` to ensure the connection works, then click `Save`. ## Import the data from your your Tiger Cloud service into Power BI Establish a connection and import data from your Tiger Cloud service into Power BI: 1. **Connect Power BI to your Tiger Cloud service** 1. Open Power BI, then click `Get data from other sources`. 1. Search for and select `ODBC`, then click `Connect`. 1. In `Data source name (DSN)`, select the Tiger Cloud data source and click `OK`. 1. Use your [connection details][connection-info] to enter your `User Name` and `Password`, then click `Connect`. After connecting, `Navigator` displays the available tables and schemas. 1. **Import your data into Power BI** 1. Select the tables to import and click `Load`. The `Data` pane shows your imported tables. 1. To visualize your data and build reports, drag fields from the tables onto the canvas. You have successfully integrated Power BI with Tiger Cloud. ===== PAGE: https://docs.tigerdata.com/integrations/tableau/ ===== # Integrate Tableau and Tiger [Tableau][tableau] is a popular analytics platform that helps you gain greater intelligence about your business. You can use it to visualize data stored in Tiger Cloud. ## Prerequisites To follow the steps on this page: * Create a target [Tiger Cloud service][create-service] with the Real-time analytics capability. You need [your connection details][connection-info]. This procedure also works for [self-hosted TimescaleDB][enable-timescaledb]. * Install [Tableau Server][tableau-server] or sign up for [Tableau Cloud][tableau-cloud]. ## Add your Tiger Cloud service as a virtual connection To connect the data in your Tiger Cloud service to Tableau: 1. **Log in to Tableau** - Tableau Cloud: [sign in][tableau-login], then click `Explore` and select a project. - Tableau Desktop: sign in, then open a workbook. 1. **Configure Tableau to connect to your Tiger Cloud service** 1. Add a new data source: - Tableau Cloud: click `New` > `Virtual Connection`. - Tableau Desktop: click `Data` > `New Data Source`. 1. Search for and select `PostgreSQL`. For Tableau Desktop download the driver and restart Tableau. 1. Configure the connection: - `Server`, `Port`, `Database`, `Username`, `Password`: configure using your [connection details][connection-info]. - `Require SSL`: tick the checkbox. 1. **Click `Sign In` and connect Tableau to your service** You have successfully integrated Tableau with Tiger Cloud. ===== PAGE: https://docs.tigerdata.com/integrations/apache-kafka/ ===== # Integrate Apache Kafka with Tiger Cloud [Apache Kafka][apache-kafka] is a distributed event streaming platform used for high-performance data pipelines, streaming analytics, and data integration. [Apache Kafka Connect][kafka-connect] is a tool to scalably and reliably stream data between Apache Kafka® and other data systems. Kafka Connect is an ecosystem of pre-written and maintained Kafka Producers (source connectors) and Kafka Consumers (sink connectors) for data products and platforms like databases and message brokers. This guide explains how to set up Kafka and Kafka Connect to stream data from a Kafka topic into your Tiger Cloud service. ## Prerequisites To follow the steps on this page: * Create a target [Tiger Cloud service][create-service] with the Real-time analytics capability. You need [your connection details][connection-info]. This procedure also works for [self-hosted TimescaleDB][enable-timescaledb]. - [Java8 or higher][java-installers] to run Apache Kafka ## Install and configure Apache Kafka To install and configure Apache Kafka: 1. **Extract the Kafka binaries to a local folder** ```bash curl https://dlcdn.apache.org/kafka/3.9.0/kafka_2.13-3.9.0.tgz | tar -xzf - cd kafka_2.13-3.9.0 ``` From now on, the folder where you extracted the Kafka binaries is called `<KAFKA_HOME>`. 1. **Configure and run Apache Kafka**bash KAFKA_CLUSTER_ID="$(bin/kafka-storage.sh random-uuid)" ./bin/kafka-storage.sh format --standalone -t $KAFKA_CLUSTER_ID -c config/kraft/reconfig-server.properties ./bin/kafka-server-start.sh config/kraft/reconfig-server.properties
Use the `-daemon` flag to run this process in the background. 1. **Create Kafka topics** In another Terminal window, navigate to <KAFKA_HOME>, then call `kafka-topics.sh` and create the following topics: - `accounts`: publishes JSON messages that are consumed by the timescale-sink connector and inserted into your Tiger Cloud service. - `deadletter`: stores messages that cause errors and that Kafka Connect workers cannot process.bash ./bin/kafka-topics.sh
--create \ --topic accounts \ --bootstrap-server localhost:9092 \ --partitions 10./bin/kafka-topics.sh
--create \ --topic deadletter \ --bootstrap-server localhost:9092 \ --partitions 101. **Test that your topics are working correctly** 1. Run `kafka-console-producer` to send messages to the `accounts` topic: ```bash bin/kafka-console-producer.sh --topic accounts --bootstrap-server localhost:9092 ``` 1. Send some events. For example, type the following: ```bash >Tiger >How Cool ``` 1. In another Terminal window, navigate to <KAFKA_HOME>, then run `kafka-console-consumer` to consume the events you just sent: ```bash bin/kafka-console-consumer.sh --topic accounts --from-beginning --bootstrap-server localhost:9092 ``` You see ```bash Tiger How Cool ``` Keep these terminals open, you use them to test the integration later. ## Install the sink connector to communicate with Tiger Cloud To set up Kafka Connect server, plugins, drivers, and connectors: 1. **Install the Postgres connector** In another Terminal window, navigate to <KAFKA_HOME>, then download and configure the Postgres sink and driver.bash mkdir -p "plugins/camel-postgresql-sink-kafka-connector" curl https://repo.maven.apache.org/maven2/org/apache/camel/kafkaconnector/camel-postgresql-sink-kafka-connector/3.21.0/camel-postgresql-sink-kafka-connector-3.21.0-package.tar.gz \ | tar -xzf - -C "plugins/camel-postgresql-sink-kafka-connector" --strip-components=1 curl -H "Accept: application/zip" https://jdbc.postgresql.org/download/postgresql-42.7.5.jar -o "plugins/camel-postgresql-sink-kafka-connector/postgresql-42.7.5.jar" echo "plugin.path=
pwd/plugins/camel-postgresql-sink-kafka-connector" >> "config/connect-distributed.properties" echo "plugin.path=pwd/plugins/camel-postgresql-sink-kafka-connector" >> "config/connect-standalone.properties"1. **Start Kafka Connect** ```bash export CLASSPATH=`pwd`/plugins/camel-postgresql-sink-kafka-connector/* ./bin/connect-standalone.sh config/connect-standalone.propertiesUse the
-daemonflag to run this process in the background.Create a table in your Tiger Cloud service to ingest Kafka events
To prepare your Tiger Cloud service for Kafka integration:
If you are self-hosting TimescaleDB v2.19.3 and below, create a Postgres relational table, then convert it using create_hypertable. You then enable hypercore with a call to ALTER TABLE.
Create the Tiger Cloud sink
To create a Tiger Cloud sink in Apache Kafka:
To see your sink, query the
/connectorsroute in a GET request:curl -X GET http://localhost:8083/connectorsYou see:
#["timescale-standalone-sink"]Test the integration with Tiger Cloud
To test this integration, send some messages onto the
accountstopic. You can do this using the kafkacat or kcat utility.Look in your terminal running
kafka-console-consumerto see the messages being processed.You see something like:
| created_at | name | city | | -- | --| -- | |2025-02-18 13:55:05.147261+00 | Lola | Copacabana | |2025-02-18 13:55:05.216673+00 | Holly | Miami | |2025-02-18 13:55:05.283549+00 | Jolene | Tennessee | |2025-02-18 13:55:05.35226+00 | Barbara Ann | California |
You have successfully integrated Apache Kafka with Tiger Cloud.
===== PAGE: https://docs.tigerdata.com/integrations/apache-airflow/ =====
Integrate Apache Airflow with Tiger
Apache Airflow® is a platform created by the community to programmatically author, schedule, and monitor workflows.
A DAG (Directed Acyclic Graph) is the core concept of Airflow, collecting Tasks together, organized with dependencies and relationships to say how they should run. You declare a DAG in a Python file in the
$AIRFLOW_HOME/dagsfolder of your Airflow instance.This page shows you how to use a Python connector in a DAG to integrate Apache Airflow with a Tiger Cloud service.
Prerequisites
To follow the steps on this page:
You need your connection details. This procedure also works for self-hosted TimescaleDB.
Ensure that your Airflow instance has network access to Tiger Cloud.
This example DAG uses the
companytable you create in Optimize time-series data in hypertablesInstall python connectivity libraries
To install the Python libraries required to connect to Tiger Cloud:
Create a connection between Airflow and your Tiger Cloud service
In your Airflow instance, securely connect to your Tiger Cloud service:
Exchange data between Airflow and your Tiger Cloud service
To exchange data between Airflow and your Tiger Cloud service:
To insert data in your Tiger Cloud service from Airflow:
You have successfully integrated Apache Airflow with Tiger Cloud and created a data pipeline.
===== PAGE: https://docs.tigerdata.com/integrations/amazon-sagemaker/ =====
Integrate Amazon Sagemaker with Tiger
Amazon SageMaker AI is a fully managed machine learning (ML) service. With SageMaker AI, data scientists and developers can quickly and confidently build, train, and deploy ML models into a production-ready hosted environment.
This page shows you how to integrate Amazon Sagemaker with a Tiger Cloud service.
Prerequisites
To follow the steps on this page:
You need your connection details. This procedure also works for self-hosted TimescaleDB.
Prepare your Tiger Cloud service to ingest data from SageMaker
Create a table in Tiger Cloud service to store model predictions generated by SageMaker.
For Tiger Cloud, open an SQL editor in Tiger Cloud Console. For self-hosted TimescaleDB, use
psql.Hypertables are Postgres tables that automatically partition your data by time. You interact with hypertables in the same way as regular Postgres tables, but with extra features that makes managing your time-series data much easier.
CREATE TABLE model_predictions ( time TIMESTAMPTZ NOT NULL, model_name TEXT NOT NULL, prediction DOUBLE PRECISION NOT NULL ) WITH ( tsdb.hypertable, tsdb.partition_column='time' );If you are self-hosting TimescaleDB v2.19.3 and below, create a Postgres relational table, then convert it using create_hypertable. You then enable hypercore with a call to ALTER TABLE.
Create the code to inject data into a Tiger Cloud service
Now you can seamlessly integrate Amazon SageMaker with Tiger Cloud to store and analyze time-series data generated by machine learning models. You can also untegrate visualization tools like Grafana or Tableau with Tiger Cloud to create real-time dashboards of your model predictions.
===== PAGE: https://docs.tigerdata.com/integrations/aws/ =====
Integrate Amazon Web Services with Tiger Cloud
Amazon Web Services (AWS) is a comprehensive cloud computing platform that provides on-demand infrastructure, storage, databases, AI, analytics, and security services to help businesses build, deploy, and scale applications in the cloud.
This page explains how to integrate your AWS infrastructure with Tiger Cloud using AWS Transit Gateway.
Prerequisites
To follow the steps on this page:
You need your connection details.
Connect your AWS infrastructure to your Tiger Cloud services
To connect to Tiger Cloud:
Once your peering connection appears as
Processing, you can accept and configure it in AWS:You cannot attach a Tiger Cloud service to multiple Tiger Cloud VPCs at the same time.
You have successfully integrated your AWS infrastructure with Tiger Cloud.
===== PAGE: https://docs.tigerdata.com/integrations/grafana/ =====
Integrate Grafana and Tiger
Grafana enables you to query, visualize, alert on, and explore your metrics, logs, and traces wherever they’re stored.
This page shows you how to integrate Grafana with a Tiger Cloud service, create a dashboard and panel, then visualize geospatial data.
Prerequisites
To follow the steps on this page:
You need your connection details. This procedure also works for self-hosted TimescaleDB.
Connect Grafana to Tiger Cloud
To visualize the results of your queries, enable Grafana to read the data in your service:
In your browser, log in to either:
- Self-hosted Grafana: at `http://localhost:3000/`. The default credentials are `admin`, `admin`. - Grafana Cloud: use the URL and credentials you set when you created your account.Create a Grafana dashboard and panel
Grafana is organized into dashboards and panels. A dashboard represents a view into the performance of a system, and each dashboard consists of one or more panels, which represent information about a specific metric related to that system.
To create a new dashboard:
Select your service from the list of pre-configured data sources or configure a new one.
Select the visualization type. The type defines specific fields to configure in addition to standard ones, such as the panel name.
You can edit the queries directly or use the built-in query editor. If you are visualizing time-series data, select
Time seriesin theFormatdrop-down.You now have a dashboard with one panel. Add more panels to a dashboard by clicking
Addat the top right and selectingVisualizationfrom the drop-down.Use the time filter function
Grafana time-series panels include a time filter:
For example, to set the
pickup_datetimecolumn as the filtering range for your visualizations:```sql SELECT --1-- time_bucket('1 day', pickup_datetime) AS "time", --2-- COUNT(*) FROM rides WHERE _timeFilter(pickup_datetime) ```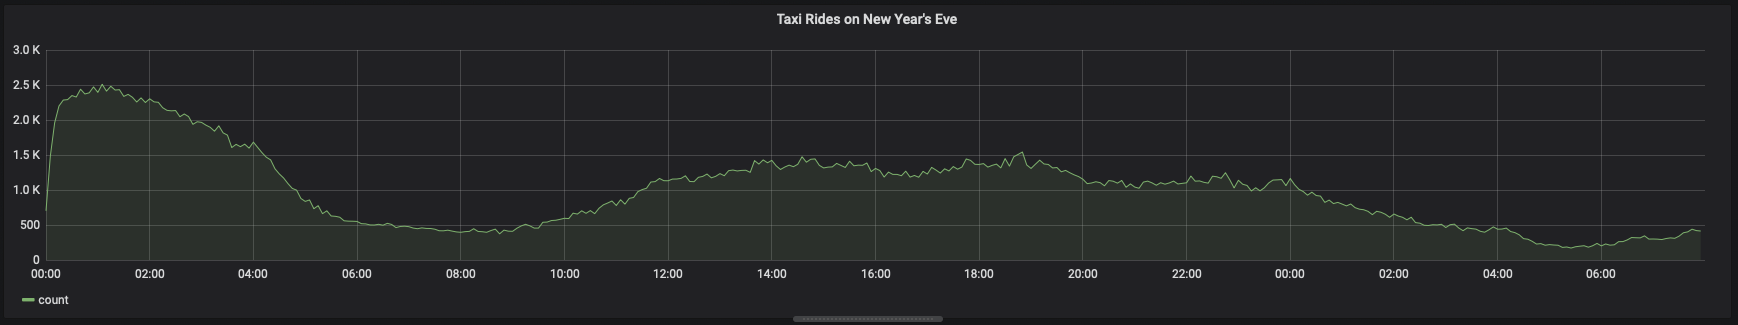
Visualize geospatial data
Grafana includes a Geomap panel so you can see geospatial data overlaid on a map. This can be helpful to understand how data changes based on its location.
This section visualizes taxi rides in Manhattan, where the distance traveled was greater than 5 miles. It uses the same query as the NYC Taxi Cab tutorial as a starting point.
===== PAGE: https://docs.tigerdata.com/integrations/dbeaver/ =====
Integrate DBeaver with Tiger
DBeaver is a free cross-platform database tool for developers, database administrators, analysts, and everyone working with data. DBeaver provides an SQL editor, administration features, data and schema migration, and the ability to monitor database connection sessions.
This page explains how to integrate DBeaver with your Tiger Cloud service.
Prerequisites
To follow the steps on this page:
You need your connection details. This procedure also works for self-hosted TimescaleDB.
Connect DBeaver to your Tiger Cloud service
To connect to Tiger Cloud:
You have successfully integrated DBeaver with Tiger Cloud.
===== PAGE: https://docs.tigerdata.com/integrations/qstudio/ =====
Integrate qStudio with Tiger
qStudio is a modern free SQL editor that provides syntax highlighting, code-completion, excel export, charting, and much more. You can use it to run queries, browse tables, and create charts for your Tiger Cloud service.
This page explains how to integrate qStudio with Tiger Cloud.
Prerequisites
To follow the steps on this page:
You need your connection details. This procedure also works for self-hosted TimescaleDB.
Connect qStudio to your Tiger Cloud service
To connect to Tiger Cloud:
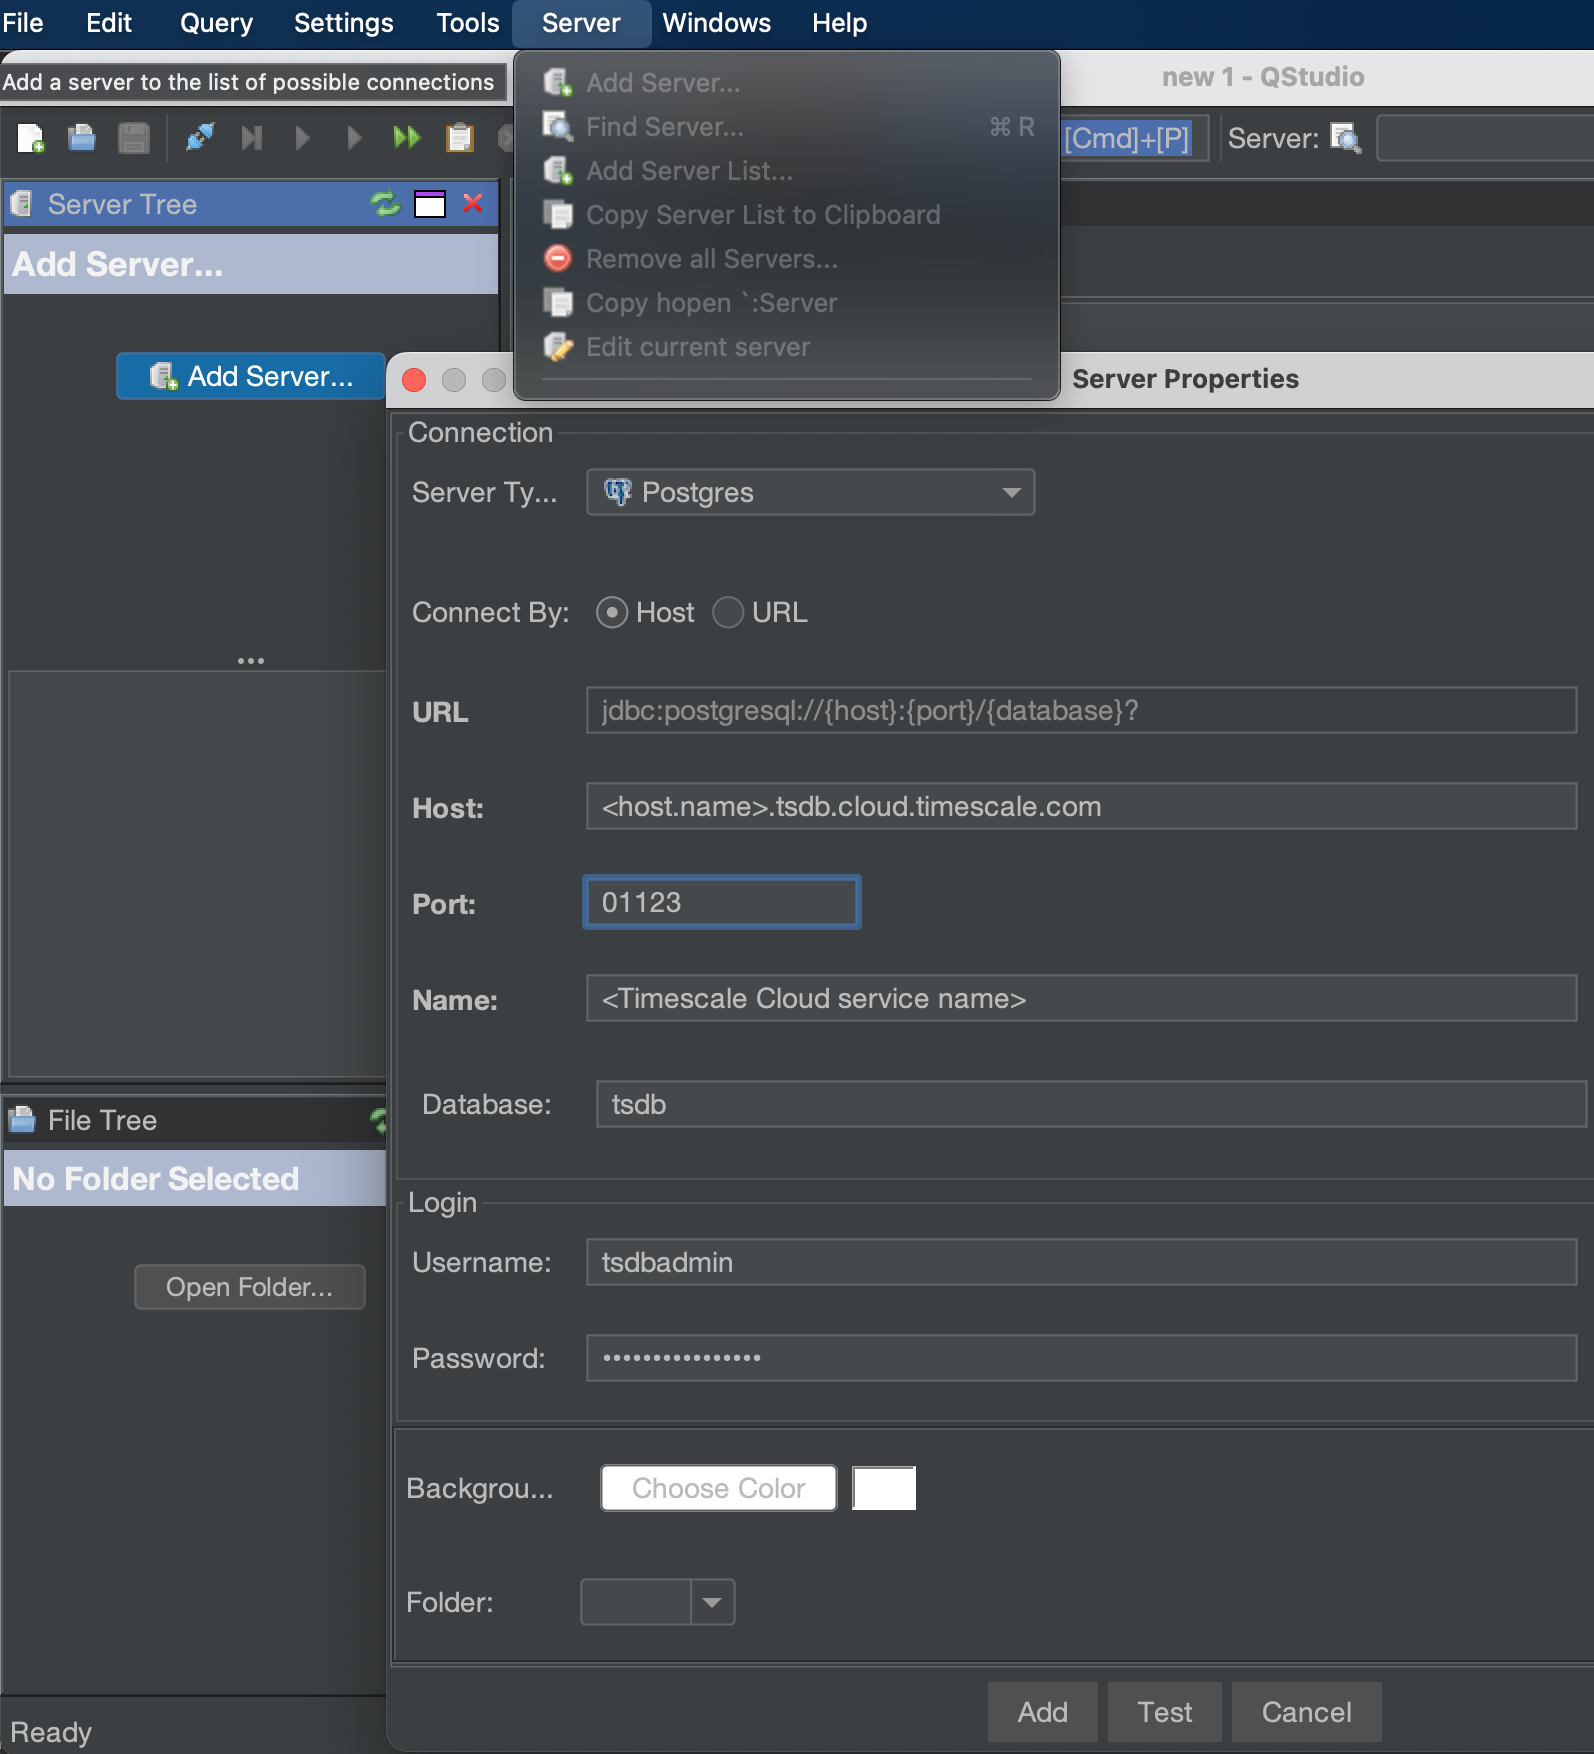
You have successfully integrated qStudio with Tiger Cloud.
===== PAGE: https://docs.tigerdata.com/integrations/microsoft-azure/ =====
Integrate Microsoft Azure with Tiger Cloud
Microsoft Azure is a cloud computing platform and services suite, offering infrastructure, AI, analytics, security, and developer tools to help businesses build, deploy, and manage applications.
This page explains how to integrate your Microsoft Azure infrastructure with Tiger Cloud using AWS Transit Gateway.
Prerequisites
To follow the steps on this page:
You need your connection details.
Connect your Microsoft Azure infrastructure to your Tiger Cloud services
To connect to Tiger Cloud:
Establish connectivity between Azure and AWS. See the AWS architectural documentation for details.
Once your peering connection appears as
Processing, you can accept and configure it in AWS:You cannot attach a Tiger Cloud service to multiple Tiger Cloud VPCs at the same time.
You have successfully integrated your Microsoft Azure infrastructure with Tiger Cloud.
===== PAGE: https://docs.tigerdata.com/migrate/index/ =====
Sync, import, and migrate your data to Tiger
In Tiger Cloud, you can easily add and sync data to your service from other sources.

This includes:
Sync from Postgres or S3
Tiger Cloud provides source connectors for Postgres, S3, and Kafka. You use them to synchronize all or some of your data to your Tiger Cloud service in real time. You run the connectors continuously, using your data as a primary database and your Tiger Cloud service as a logical replica. This enables you to leverage Tiger Cloud’s real-time analytics capabilities on your replica data.
Connector options Downtime requirements Source Postgres connector None Source S3 connector None Source Kafka connector None Import individual files
You can import individual files using Console, from your local machine or S3. This includes CSV, Parquet, TXT, and MD files. Alternatively, import files using the terminal.
Migrate your data
Depending on the amount of data you need to migrate, and the amount of downtime you can afford, Tiger Data offers the following migration options:
Migration strategy Use when Downtime requirements Migrate with downtime Use pg_dumpandpg_restoreto migrate when you can afford downtime.Some downtime Live migration Simplified end-to-end migration with almost zero downtime. Minimal downtime Dual-write and backfill Append-only data, heavy insert workload (~20,000 inserts per second) when modifying your ingestion pipeline is not an issue. Minimal downtime All strategies work to migrate from Postgres, TimescaleDB, AWS RDS, and Managed Service for TimescaleDB. Migration assistance is included with Tiger Cloud support. If you encounter any difficulties while migrating your data, consult the troubleshooting page, open a support request, or take your issue to the
#migrationchannel in the community slack, the developers of this migration method are there to help.You can open a support request directly from Tiger Cloud Console, or by email to support@tigerdata.com.
If you're migrating your data from another source database type, best practice is export the data from your source database as a CSV file, then import to your Tiger Cloud service using timescaledb-parallel-copy.
===== PAGE: https://docs.tigerdata.com/migrate/dual-write-and-backfill/ =====
Low-downtime migrations with dual-write and backfill
Dual-write and backfill is a migration strategy to move a large amount of time-series data (100 GB-10 TB+) with low downtime (on the order of minutes of downtime). It is significantly more complicated to execute than a migration with downtime using pg_dump/restore, and has some prerequisites on the data ingest patterns of your application, so it may not be universally applicable.
Dual-write and backfill can be used for any source database type, as long as it can provide data in csv format. It can be used to move data from a PostgresSQL source, and from TimescaleDB to TimescaleDB.
Dual-write and backfill works well when:
Prerequisites
Best practice is to use an Ubuntu EC2 instance hosted in the same region as your Tiger Cloud service to move data. That is, the machine you run the commands on to move your data from your source database to your target Tiger Cloud service.
Before you move your data:
Each Tiger Cloud service has a single Postgres instance that supports the most popular extensions. Tiger Cloud services do not support tablespaces, and there is no superuser associated with a service. Best practice is to create a Tiger Cloud service with at least 8 CPUs for a smoother experience. A higher-spec instance can significantly reduce the overall migration window.
Migrate to Tiger Cloud
To move your data from a self-hosted database to a Tiger Cloud service:
===== PAGE: https://docs.tigerdata.com/getting-started/index/ =====
Get started with Tiger Data
A Tiger Cloud service is a single optimised Postgres instance extended with innovations in the database engine such as TimescaleDB, in a cloud infrastructure that delivers speed without sacrifice.
A Tiger Cloud service is a radically faster Postgres database for transactional, analytical, and agentic workloads at scale.
It’s not a fork. It’s not a wrapper. It is Postgres—extended with innovations in the database engine and cloud infrastructure to deliver speed (10-1000x faster at scale) without sacrifice. A Tiger Cloud service brings together the familiarity and reliability of Postgres with the performance of purpose-built engines.
Tiger Cloud is the fastest Postgres cloud. It includes everything you need to run Postgres in a production-reliable, scalable, observable environment.
This section shows you how to:
What next? Try the key features offered by Tiger Data, see the tutorials, interact with the data in your Tiger Cloud service using your favorite programming language, integrate your Tiger Cloud service with a range of third-party tools, plain old Use Tiger Data products, or dive into the API reference.
===== PAGE: https://docs.tigerdata.com/ai/index/ =====
Integrate AI with Tiger Data
You can build and deploy AI Assistants that understand, analyze, and act on your organizational data using Tiger Data. Whether you're building semantic search applications, recommendation systems, or intelligent agents that answer complex business questions, Tiger Data provides the tools and infrastructure you need.
Tiger Data's AI ecosystem combines Postgres with advanced vector capabilities, intelligent agents, and seamless integrations. Your AI Assistants can:
Tiger Eon for complete organizational AI
Tiger Eon automatically integrates Tiger Agents for Work with your organizational data. You can:
Use Eon when you want to unlock knowledge from your communication and development tools.
Tiger Agents for Work for enterprise Slack AI
Tiger Agents for Work provides enterprise-grade Slack-native AI agents. You get:
Use Tiger Agents for Work when you need reliable, customizable AI agents for high-volume conversations.
Tiger MCP Server for direct AI Assistant integration
The Tiger Model Context Protocol Server integrates directly with popular AI Assistants. You can:
Use the Tiger MCP Server when you want to manage Tiger Data resources from your AI Assistant.
pgvectorscale and️ pgvector
Pgvector is a popular open source extension for vector storage and similarity search in Postgres and pgvectorscale adds advanced indexing capabilities to pgvector. pgai on Tiger Cloud offers both extensions so you can use all the capabilities already available in pgvector (like HNSW and ivfflat indexes) and also make use of the StreamingDiskANN index in pgvectorscale to speed up vector search.
This makes it easy to migrate your existing pgvector deployment and take advantage of the additional performance features in pgvectorscale. You also have the flexibility to create different index types suited to your needs. See the vector search indexing section for more information.
Embeddings offer a way to represent the semantic essence of data and to allow comparing data according to how closely related it is in terms of meaning. In the database context, this is extremely powerful: think of this as full-text search on steroids. Vector databases allow storing embeddings associated with data and then searching for embeddings that are similar to a given query.
Vector similarity search: How does it work
On a high level, embeddings help a database to look for data that is similar to a given piece of information (similarity search). This process includes a few steps:
Under the hood, embeddings are represented as a vector (a list of numbers) that capture the essence of the data. To determine the similarity of two pieces of data, the database uses mathematical operations on vectors to get a distance measure (commonly Euclidean or cosine distance). During a search, the database should return those stored items where the distance between the query embedding and the stored embedding is as small as possible, suggesting the items are most similar.
Embedding models
pgai on Tiger Cloud works with the most popular embedding models that have output vectors of 2,000 dimensions or less.:
And here are some popular choices for image embeddings:
===== PAGE: https://docs.tigerdata.com/api/hyperfunctions/ =====
Hyperfunctions
Hyperfunctions in TimescaleDB are a specialized set of functions that allow you to analyze time-series data. You can use hyperfunctions to analyze anything you have stored as time-series data, including IoT devices, IT systems, marketing analytics, user behavior, financial metrics, and cryptocurrency.
Some hyperfunctions are included by default in TimescaleDB. For additional hyperfunctions, you need to install the TimescaleDB Toolkit Postgres extension.
For more information, see the hyperfunctions documentation.
<HyperfunctionTable
includeExperimental/>
===== PAGE: https://docs.tigerdata.com/api/time-weighted-averages/ =====
Time-weighted average functions
This section contains functions related to time-weighted averages and integrals. Time weighted averages and integrals are commonly used in cases where a time series is not evenly sampled, so a traditional average gives misleading results. For more information about these functions, see the hyperfunctions documentation.
Some hyperfunctions are included in the default TimescaleDB product. For additional hyperfunctions, you need to install the TimescaleDB Toolkit Postgres extension.
<HyperfunctionTable
hyperfunctionFamily='time-weighted averages' includeExperimental sortByType/>
===== PAGE: https://docs.tigerdata.com/api/counter_aggs/ =====
Counter and gauge aggregation
This section contains functions related to counter and gauge aggregation. Counter aggregation functions are used to accumulate monotonically increasing data by treating any decrements as resets. Gauge aggregates are similar, but are used to track data which can decrease as well as increase. For more information about counter aggregation functions, see the hyperfunctions documentation.
Some hyperfunctions are included in the default TimescaleDB product. For additional hyperfunctions, you need to install the TimescaleDB Toolkit Postgres extension.
<HyperfunctionTable
hyperfunctionFamily='metric aggregation' includeExperimental sortByType/>
All accessors can be used with
CounterSummary, and all butnum_resetswithGaugeSummary.===== PAGE: https://docs.tigerdata.com/api/gapfilling-interpolation/ =====
Gapfilling and interpolation
This section contains functions related to gapfilling and interpolation. You can use a gapfilling function to create additional rows of data in any gaps, ensuring that the returned rows are in chronological order, and contiguous. For more information about gapfilling and interpolation functions, see the hyperfunctions documentation.
Some hyperfunctions are included in the default TimescaleDB product. For additional hyperfunctions, you need to install the TimescaleDB Toolkit Postgres extension.
<HyperfunctionTable
hyperfunctionFamily='gapfilling and interpolation' includeExperimental sortByType/>
===== PAGE: https://docs.tigerdata.com/api/state-aggregates/ =====
State aggregates
This section includes functions used to measure the time spent in a relatively small number of states.
For these hyperfunctions, you need to install the TimescaleDB Toolkit Postgres extension.
Notes on compact_state_agg and state_agg
state_aggsupports all hyperfunctions that operate on CompactStateAggs, in addition to some additional functions that need a full state timeline.All
compact_state_aggandstate_agghyperfunctions support both string (TEXT) and integer (BIGINT) states. You can't mix different types of states within a single aggregate. Integer states are useful when the state value is a foreign key representing a row in another table that stores all possible states.Hyperfunctions
<HyperfunctionTable
hyperfunctionFamily='state aggregates' includeExperimental sortByType/>
===== PAGE: https://docs.tigerdata.com/api/index/ =====
TimescaleDB API reference
TimescaleDB provides many SQL functions and views to help you interact with and manage your data. See a full list below or search by keyword to find reference documentation for a specific API.
APIReference
Refer to the installation documentation for detailed setup instructions.
===== PAGE: https://docs.tigerdata.com/api/rollup/ =====
rollup()
Combines multiple
OpenHighLowCloseaggregates. Usingrollup, you can reaggregate a continuous aggregate into larger time buckets.rollup( ohlc OpenHighLowClose ) RETURNS OpenHighLowCloseExperimental features could have bugs. They might not be backwards compatible, and could be removed in future releases. Use these features at your own risk, and do not use any experimental features in production.
Required arguments
|Name|Type|Description| |-|-|-| |
ohlc|OpenHighLowClose|The aggregate to roll up|Returns
|Column|Type|Description| |-|-|-| |
ohlc|OpenHighLowClose|A new aggregate, which is an object storing (timestamp, value) pairs for each of the opening, high, low, and closing prices.|Sample usage
Roll up your by-minute continuous aggregate into hourly buckets and return the OHLC prices:
SELECT time_bucket('1 hour'::interval, ts) AS hourly_bucket, symbol, toolkit_experimental.open(toolkit_experimental.rollup(ohlc)), toolkit_experimental.high(toolkit_experimental.rollup(ohlc)), toolkit_experimental.low(toolkit_experimental.rollup(ohlc)), toolkit_experimental.close(toolkit_experimental.rollup(ohlc)), FROM ohlc GROUP BY hourly_bucket, symbol ;Roll up your by-minute continuous aggregate into a daily aggregate and return the OHLC prices:
WITH ohlc AS ( SELECT time_bucket('1 minute'::interval, ts) AS minute_bucket, symbol, toolkit_experimental.ohlc(ts, price) FROM crypto_ticks GROUP BY minute_bucket, symbol ) SELECT time_bucket('1 day'::interval , bucket) AS daily_bucket symbol, toolkit_experimental.open(toolkit_experimental.rollup(ohlc)), toolkit_experimental.high(toolkit_experimental.rollup(ohlc)), toolkit_experimental.low(toolkit_experimental.rollup(ohlc)), toolkit_experimental.close(toolkit_experimental.rollup(ohlc)) FROM ohlc GROUP BY daily_bucket, symbol ;===== PAGE: https://docs.tigerdata.com/api/to_epoch/ =====
to_epoch()
Given a timestamptz, returns the number of seconds since January 1, 1970 (the Unix epoch).
Required arguments
|Name|Type|Description| |-|-|-| |
date|TIMESTAMPTZ|Timestamp to use to calculate epoch|Sample usage
Convert a date to a Unix epoch time:
SELECT to_epoch('2021-01-01 00:00:00+03'::timestamptz);The output looks like this:
to_epoch ------------ 1609448400===== PAGE: https://docs.tigerdata.com/tutorials/ingest-real-time-websocket-data/ =====
Ingest real-time financial data using WebSocket
This tutorial shows you how to ingest real-time time-series data into TimescaleDB using a websocket connection. The tutorial sets up a data pipeline to ingest real-time data from our data partner, Twelve Data. Twelve Data provides a number of different financial APIs, including stock, cryptocurrencies, foreign exchanges, and ETFs. It also supports websocket connections in case you want to update your database frequently. With websockets, you need to connect to the server, subscribe to symbols, and you can start receiving data in real-time during market hours.
When you complete this tutorial, you'll have a data pipeline set up that ingests real-time financial data into your Tiger Cloud.
This tutorial uses Python and the API wrapper library provided by Twelve Data.
Prerequisites
Before you begin, make sure you have:
When you connect to the Twelve Data API through a websocket, you create a persistent connection between your computer and the websocket server. You set up a Python environment, and pass two arguments to create a websocket object and establish the connection.
Set up a new Python environment
Create a new Python virtual environment for this project and activate it. All the packages you need to complete for this tutorial are installed in this environment.
Setting up a new Python environment
Create the websocket connection
A persistent connection between your computer and the websocket server is used to receive data for as long as the connection is maintained. You need to pass two arguments to create a websocket object and establish connection.
Websocket arguments
Connecting to the websocket server
To ingest the data into your Tiger Cloud service, you need to implement the
on_eventfunction.After the websocket connection is set up, you can use the
on_eventfunction to ingest data into the database. This is a data pipeline that ingests real-time financial data into your Tiger Cloud service.Stock trades are ingested in real-time Monday through Friday, typically during normal trading hours of the New York Stock Exchange (9:30 AM to 4:00 PM EST).
Optimize time-series data in hypertables
Hypertables are Postgres tables in TimescaleDB that automatically partition your time-series data by time. Time-series data represents the way a system, process, or behavior changes over time. Hypertables enable TimescaleDB to work efficiently with time-series data. Each hypertable is made up of child tables called chunks. Each chunk is assigned a range of time, and only contains data from that range. When you run a query, TimescaleDB identifies the correct chunk and runs the query on it, instead of going through the entire table.
Hypercore is the hybrid row-columnar storage engine in TimescaleDB used by hypertables. Traditional databases force a trade-off between fast inserts (row-based storage) and efficient analytics (columnar storage). Hypercore eliminates this trade-off, allowing real-time analytics without sacrificing transactional capabilities.
Hypercore dynamically stores data in the most efficient format for its lifecycle:
Unlike traditional columnar databases, hypercore allows data to be inserted or modified at any stage, making it a flexible solution for both high-ingest transactional workloads and real-time analytics—within a single database.
Because TimescaleDB is 100% Postgres, you can use all the standard Postgres tables, indexes, stored procedures, and other objects alongside your hypertables. This makes creating and working with hypertables similar to standard Postgres.
In Tiger Cloud Console open an SQL editor. You can also connect to your service using psql.
If you are self-hosting TimescaleDB v2.19.3 and below, create a Postgres relational table, then convert it using create_hypertable. You then enable hypercore with a call to ALTER TABLE.
Create standard Postgres tables for relational data
When you have other relational data that enhances your time-series data, you can create standard Postgres tables just as you would normally. For this dataset, there is one other table of data called
company.You now have two tables in your Tiger Cloud service. One hypertable named
stocks_real_time, and one regular Postgres table namedcompany.When you ingest data into a transactional database like Timescale, it is more efficient to insert data in batches rather than inserting data row-by-row. Using one transaction to insert multiple rows can significantly increase the overall ingest capacity and speed of your Tiger Cloud service.
Batching in memory
A common practice to implement batching is to store new records in memory first, then after the batch reaches a certain size, insert all the records from memory into the database in one transaction. The perfect batch size isn't universal, but you can experiment with different batch sizes (for example, 100, 1000, 10000, and so on) and see which one fits your use case better. Using batching is a fairly common pattern when ingesting data into TimescaleDB from Kafka, Kinesis, or websocket connections.
You can implement a batching solution in Python with Psycopg2. You can implement the ingestion logic within the
on_eventfunction that you can then pass over to the websocket object.This function needs to:
Ingesting data in real-time
2022-05-13 18:51:41,976 - ws-twelvedata - ERROR - TDWebSocket ERROR: Handshake status 200 OK
Then check that you use a proper API key received from Twelve Data. </Collapsible> <Collapsible heading="Query the data" defaultExpanded={false}> To look at OHLCV values, the most effective way is to create a continuous aggregate. You can create a continuous aggregate to aggregate data for each hour, then set the aggregate to refresh every hour, and aggregate the last two hours' worth of data. ### Creating a continuous aggregate 1. Connect to the Tiger Cloud service `tsdb` that contains the Twelve Data stocks dataset. 1. At the psql prompt, create the continuous aggregate to aggregate data every minute: ```sql CREATE MATERIALIZED VIEW one_hour_candle WITH (timescaledb.continuous) AS SELECT time_bucket('1 hour', time) AS bucket, symbol, FIRST(price, time) AS "open", MAX(price) AS high, MIN(price) AS low, LAST(price, time) AS "close", LAST(day_volume, time) AS day_volume FROM stocks_real_time GROUP BY bucket, symbol; ``` When you create the continuous aggregate, it refreshes by default. 1. Set a refresh policy to update the continuous aggregate every hour, if there is new data available in the hypertable for the last two hours: ```sql SELECT add_continuous_aggregate_policy('one_hour_candle', start_offset => INTERVAL '3 hours', end_offset => INTERVAL '1 hour', schedule_interval => INTERVAL '1 hour'); ``` ## Query the continuous aggregate When you have your continuous aggregate set up, you can query it to get the OHLCV values. ### Querying the continuous aggregate 1. Connect to the Tiger Cloud service that contains the Twelve Data stocks dataset. 1. At the psql prompt, use this query to select all `AAPL` OHLCV data for the past 5 hours, by time bucket: ```sql SELECT * FROM one_hour_candle WHERE symbol = 'AAPL' AND bucket >= NOW() - INTERVAL '5 hours' ORDER BY bucket; ``` The result of the query looks like this: ```sql bucket | symbol | open | high | low | close | day_volume ------------------------+---------+---------+---------+---------+---------+------------ 2023-05-30 08:00:00+00 | AAPL | 176.31 | 176.31 | 176 | 176.01 | 2023-05-30 08:01:00+00 | AAPL | 176.27 | 176.27 | 176.02 | 176.2 | 2023-05-30 08:06:00+00 | AAPL | 176.03 | 176.04 | 175.95 | 176 | 2023-05-30 08:07:00+00 | AAPL | 175.95 | 176 | 175.82 | 175.91 | 2023-05-30 08:08:00+00 | AAPL | 175.92 | 176.02 | 175.8 | 176.02 | 2023-05-30 08:09:00+00 | AAPL | 176.02 | 176.02 | 175.9 | 175.98 | 2023-05-30 08:10:00+00 | AAPL | 175.98 | 175.98 | 175.94 | 175.94 | 2023-05-30 08:11:00+00 | AAPL | 175.94 | 175.94 | 175.91 | 175.91 | 2023-05-30 08:12:00+00 | AAPL | 175.9 | 175.94 | 175.9 | 175.94 | ``` </Collapsible> <Collapsible heading="Visualize the OHLCV data in Grafana" defaultExpanded={false}> You can visualize the OHLCV data that you created using the queries in Grafana. ## Graph OHLCV data When you have extracted the raw OHLCV data, you can use it to graph the result in a candlestick chart, using Grafana. To do this, you need to have Grafana set up to connect to your self-hosted TimescaleDB instance. ### Graphing OHLCV data 1. Ensure you have Grafana installed, and you are using the TimescaleDB database that contains the Twelve Data dataset set up as a data source. 1. In Grafana, from the `Dashboards` menu, click `New Dashboard`. In the `New Dashboard` page, click `Add a new panel`. 1. In the `Visualizations` menu in the top right corner, select `Candlestick` from the list. Ensure you have set the Twelve Data dataset as your data source. 1. Click `Edit SQL` and paste in the query you used to get the OHLCV values. 1. In the `Format as` section, select `Table`. 1. Adjust elements of the table as required, and click `Apply` to save your graph to the dashboard. <img class="main-content__illustration" width={1375} height={944} src="https://assets.timescale.com/docs/images/Grafana_candlestick_1day.webp" alt="Creating a candlestick graph in Grafana using 1-day OHLCV tick data" /> </Collapsible> ===== PAGE: https://docs.tigerdata.com/tutorials/index/ ===== # Tutorials Tiger Data tutorials are designed to help you get up and running with Tiger Data products. They walk you through a variety of scenarios using example datasets, to teach you how to construct interesting queries, find out what information your database has hidden in it, and even give you options for visualizing and graphing your results. - **Real-time analytics** - [Analytics on energy consumption][rta-energy]: make data-driven decisions using energy consumption data. - [Analytics on transport and geospatial data][rta-transport]: optimize profits using geospatial transport data. - **Cryptocurrency** - [Query the Bitcoin blockchain][beginner-crypto]: do your own research on the Bitcoin blockchain. - [Analyze the Bitcoin blockchain][intermediate-crypto]: discover the relationship between transactions, blocks, fees, and miner revenue. - **Finance** - [Analyze financial tick data][beginner-finance]: chart the trading highs and lows for your favorite stock. - [Ingest real-time financial data using WebSocket][advanced-finance]: use a websocket connection to visualize the trading highs and lows for your favorite stock. - **IoT** - [Simulate an IoT sensor dataset][iot]: simulate an IoT sensor dataset and run simple queries on it. - **Cookbooks** - [Tiger community cookbook][cookbooks]: get suggestions from the Tiger community about how to resolve common issues. ===== PAGE: https://docs.tigerdata.com/_troubleshooting/compression-dml-tuple-limit/ ===== # Tuple decompression limit exceeded by operation <!--- * Use this format for writing troubleshooting sections: - Cause: What causes the problem? - Consequence: What does the user see when they hit this problem? - Fix/Workaround: What can the user do to fix or work around the problem? Provide a "Resolving" Procedure if required. - Result: When the user applies the fix, what is the result when the same action is applied? * Copy this comment at the top of every troubleshooting page --> When inserting, updating, or deleting tuples from chunks in the columnstore, it might be necessary to convert tuples to the rowstore. This happens either when you are updating existing tuples or have constraints that need to be verified during insert time. If you happen to trigger a lot of rowstore conversion with a single command, you may end up running out of storage space. For this reason, a limit has been put in place on the number of tuples you can decompress into the rowstore for a single command. The limit can be increased or turned off (set to 0) like so:sql -- set limit to a milion tuples SET timescaledb.max_tuples_decompressed_per_dml_transaction TO 1000000; -- disable limit by setting to 0 SET timescaledb.max_tuples_decompressed_per_dml_transaction TO 0;
===== PAGE: https://docs.tigerdata.com/_troubleshooting/caggs-queries-fail/ ===== # Queries fail when defining continuous aggregates but work on regular tables Continuous aggregates do not work on all queries. For example, TimescaleDB does not support window functions on continuous aggregates. If you use an unsupported function, you see the following error:sql
ERROR: invalid continuous aggregate view SQL state: 0A000The following table summarizes the aggregate functions supported in continuous aggregates: | Function, clause, or feature |TimescaleDB 2.6 and earlier|TimescaleDB 2.7, 2.8, and 2.9|TimescaleDB 2.10 and later| |------------------------------------------------------------|-|-|-| | Parallelizable aggregate functions |✅|✅|✅| | [Non-parallelizable SQL aggregates][postgres-parallel-agg] |❌|✅|✅| | `ORDER BY` |❌|✅|✅| | Ordered-set aggregates |❌|✅|✅| | Hypothetical-set aggregates |❌|✅|✅| | `DISTINCT` in aggregate functions |❌|✅|✅| | `FILTER` in aggregate functions |❌|✅|✅| | `FROM` clause supports `JOINS` |❌|❌|✅| DISTINCT works in aggregate functions, not in the query definition. For example, for the table:sql CREATE TABLE public.candle( symbol_id uuid NOT NULL, symbol text NOT NULL, "time" timestamp with time zone NOT NULL, open double precision NOT NULL, high double precision NOT NULL, low double precision NOT NULL, close double precision NOT NULL, volume double precision NOT NULL );
- The following works:sql CREATE MATERIALIZED VIEW candles_start_end WITH (timescaledb.continuous) AS SELECT time_bucket('1 hour', "time"), COUNT(DISTINCT symbol), first(time, time) as first_candle, last(time, time) as last_candle FROM candle GROUP BY 1;
- This does not:sql CREATE MATERIALIZED VIEW candles_start_end WITH (timescaledb.continuous) AS SELECT DISTINCT ON (symbol) symbol,symbol_id, first(time, time) as first_candle, last(time, time) as last_candle FROM candle GROUP BY symbol_id;
===== PAGE: https://docs.tigerdata.com/_troubleshooting/caggs-real-time-previously-materialized-not-shown/ ===== # Updates to previously materialized regions aren't shown in real-time aggregates Real-time aggregates automatically add the most recent data when you query your continuous aggregate. In other words, they include data _more recent than_ your last materialized bucket. If you add new _historical_ data to an already-materialized bucket, it won't be reflected in a real-time aggregate. You should wait for the next scheduled refresh, or manually refresh by calling `refresh_continuous_aggregate`. You can think of real-time aggregates as being eventually consistent for historical data. The following example shows how this works: 1. Create the hypertable:sql CREATE TABLE conditions(
day DATE NOT NULL, city text NOT NULL, temperature INT NOT NULL) WITH (
tsdb.hypertable, tsdb.partition_column='day', tsdb.chunk_interval='1 day');
If you are self-hosting TimescaleDB v2.19.3 and below, create a [Postgres relational table][pg-create-table], then convert it using [create_hypertable][create_hypertable]. You then enable hypercore with a call to [ALTER TABLE][alter_table_hypercore]. 1. Add data to your hypertable:sql INSERT INTO conditions (day, city, temperature) VALUES
('2021-06-14', 'Moscow', 26), ('2021-06-15', 'Moscow', 22), ('2021-06-16', 'Moscow', 24), ('2021-06-17', 'Moscow', 24), ('2021-06-18', 'Moscow', 27), ('2021-06-19', 'Moscow', 28), ('2021-06-20', 'Moscow', 30), ('2021-06-21', 'Moscow', 31), ('2021-06-22', 'Moscow', 34), ('2021-06-23', 'Moscow', 34), ('2021-06-24', 'Moscow', 34), ('2021-06-25', 'Moscow', 32), ('2021-06-26', 'Moscow', 32), ('2021-06-27', 'Moscow', 31);1. Create a continuous aggregate but do not materialize any data: 1. Create the continuous aggregate: ```sql CREATE MATERIALIZED VIEW conditions_summary WITH (timescaledb.continuous) AS SELECT city, time_bucket('7 days', day) AS bucket, MIN(temperature), MAX(temperature) FROM conditions GROUP BY city, bucket WITH NO DATA; ``` 1. Check your data: ```sql SELECT * FROM conditions_summary ORDER BY bucket; ``` The query on the continuous aggregate fetches data directly from the hypertable: | city | bucket | min | max| |--------|------------|-----|-----| | Moscow | 2021-06-14 | 22 | 30 | | Moscow | 2021-06-21 | 31 | 34 | 1. Materialize data into the continuous aggregate: 1. Add a refresh policy: ```sql CALL refresh_continuous_aggregate('conditions_summary', '2021-06-14', '2021-06-21'); ``` 1. Check your data: ```sql SELECT * FROM conditions_summary ORDER BY bucket; ``` The select query returns the same data, as expected, but this time the data is fetched from the underlying materialized table | city | bucket | min | max| |--------|------------|-----|-----| | Moscow | 2021-06-14 | 22 | 30 | | Moscow | 2021-06-21 | 31 | 34 | 1. Update the data in the previously materialized bucket: 1. Update the data in your hypertable: ```sql UPDATE conditions SET temperature = 35 WHERE day = '2021-06-14' and city = 'Moscow'; ``` 1. Check your data: ```sql SELECT * FROM conditions_summary ORDER BY bucket; ``` The updated data is not yet visible when you query the continuous aggregate. This is because these changes have not been materialized. (Similarly, any INSERTs or DELETEs would also not be visible). | city | bucket | min | max | |--------|------------|-----|-----| | Moscow | 2021-06-14 | 22 | 30 | | Moscow | 2021-06-21 | 31 | 34 | 1. Refresh the data again to update the previously materialized region: 1. Refresh the data: ```sql CALL refresh_continuous_aggregate('conditions_summary', '2021-06-14', '2021-06-21'); ``` 1. Check your data: ```sql SELECT * FROM conditions_summary ORDER BY bucket; ``` You see something like: | city | bucket | min | max | |--------|------------|-----|-----| | Moscow | 2021-06-14 | 22 | 35 | | Moscow | 2021-06-21 | 31 | 34 | ===== PAGE: https://docs.tigerdata.com/_troubleshooting/caggs-hierarchical-buckets/ ===== # Hierarchical continuous aggregate fails with incompatible bucket width <!--- * Use this format for writing troubleshooting sections: - Cause: What causes the problem? - Consequence: What does the user see when they hit this problem? - Fix/Workaround: What can the user do to fix or work around the problem? Provide a "Resolving" Procedure if required. - Result: When the user applies the fix, what is the result when the same action is applied? * Copy this comment at the top of every troubleshooting page --> If you attempt to create a hierarchical continuous aggregate, you must use compatible time buckets. You can't create a continuous aggregate with a fixed-width time bucket on top of a continuous aggregate with a variable-width time bucket. For more information, see the restrictions section in [hierarchical continuous aggregates][h-caggs-restrictions]. ===== PAGE: https://docs.tigerdata.com/_troubleshooting/caggs-migrate-permissions/ ===== # Permissions error when migrating a continuous aggregate <!--- * Use this format for writing troubleshooting sections: - Cause: What causes the problem? - Consequence: What does the user see when they hit this problem? - Fix/Workaround: What can the user do to fix or work around the problem? Provide a "Resolving" Procedure if required. - Result: When the user applies the fix, what is the result when the same action is applied? * Copy this comment at the top of every troubleshooting page --> You might get a permissions error when migrating a continuous aggregate from old to new format using `cagg_migrate`. The user performing the migration must have the following permissions: * Select, insert, and update permissions on the tables `_timescale_catalog.continuous_agg_migrate_plan` and `_timescale_catalog.continuous_agg_migrate_plan_step` * Usage permissions on the sequence `_timescaledb_catalog.continuous_agg_migrate_plan_step_step_id_seq` To solve the problem, change to a user capable of granting permissions, and grant the following permissions to the user performing the migration:sql GRANT SELECT, INSERT, UPDATE ON TABLE _timescaledb_catalog.continuous_agg_migrate_plan TO ; GRANT SELECT, INSERT, UPDATE ON TABLE _timescaledb_catalog.continuous_agg_migrate_plan_step TO ; GRANT USAGE ON SEQUENCE _timescaledb_catalog.continuous_agg_migrate_plan_step_step_id_seq TO ;
===== PAGE: https://docs.tigerdata.com/_troubleshooting/compression-high-cardinality/ ===== # Low compression rate <!--- * Use this format for writing troubleshooting sections: - Cause: What causes the problem? - Consequence: What does the user see when they hit this problem? - Fix/Workaround: What can the user do to fix or work around the problem? Provide a "Resolving" Procedure if required. - Result: When the user applies the fix, what is the result when the same action is applied? * Copy this comment at the top of every troubleshooting page --> Low compression rates are often caused by [high cardinality][cardinality-blog] of the segment key. This means that the column you selected for grouping the rows during compression has too many unique values. This makes it impossible to group a lot of rows in a batch. To achieve better compression results, choose a segment key with lower cardinality. ===== PAGE: https://docs.tigerdata.com/_troubleshooting/dropping-chunks-times-out/ ===== # Dropping chunks times out <!--- * Use this format for writing troubleshooting sections: - Cause: What causes the problem? - Consequence: What does the user see when they hit this problem? - Fix/Workaround: What can the user do to fix or work around the problem? Provide a "Resolving" Procedure if required. - Result: When the user applies the fix, what is the result when the same action is applied? * Copy this comment at the top of every troubleshooting page --> When you drop a chunk, it requires an exclusive lock. If a chunk is being accessed by another session, you cannot drop the chunk at the same time. If a drop chunk operation can't get the lock on the chunk, then it times out and the process fails. To resolve this problem, check what is locking the chunk. In some cases, this could be caused by a continuous aggregate or other process accessing the chunk. When the drop chunk operation can get an exclusive lock on the chunk, it completes as expected. For more information about locks, see the [Postgres lock monitoring documentation][pg-lock-monitoring]. ===== PAGE: https://docs.tigerdata.com/_troubleshooting/hypertables-unique-index-partitioning/ ===== # Can't create unique index on hypertable, or can't create hypertable with unique index <!--- * Use this format for writing troubleshooting sections: - Cause: What causes the problem? - Consequence: What does the user see when they hit this problem? - Fix/Workaround: What can the user do to fix or work around the problem? Provide a "Resolving" Procedure if required. - Result: When the user applies the fix, what is the result when the same action is applied? * Copy this comment at the top of every troubleshooting page --> You might get a unique index and partitioning column error in 2 situations: * When creating a primary key or unique index on a hypertable * When creating a hypertable from a table that already has a unique index or primary key For more information on how to fix this problem, see the [section on creating unique indexes on hypertables][unique-indexes]. ===== PAGE: https://docs.tigerdata.com/_troubleshooting/explain/ ===== # A particular query executes more slowly than expected <!--- * Use this format for writing troubleshooting sections: - Cause: What causes the problem? - Consequence: What does the user see when they hit this problem? - Fix/Workaround: What can the user do to fix or work around the problem? Provide a "Resolving" Procedure if required. - Result: When the user applies the fix, what is the result when the same action is applied? * Copy this comment at the top of every troubleshooting page --> To troubleshoot a query, you can examine its EXPLAIN plan. Postgres's EXPLAIN feature allows users to understand the underlying query plan that Postgres uses to execute a query. There are multiple ways that Postgres can execute a query: for example, a query might be fulfilled using a slow sequence scan or a much more efficient index scan. The choice of plan depends on what indexes are created on the table, the statistics that Postgres has about your data, and various planner settings. The EXPLAIN output let's you know which plan Postgres is choosing for a particular query. Postgres has a [in-depth explanation][using explain] of this feature. To understand the query performance on a hypertable, we suggest first making sure that the planner statistics and table maintenance is up-to-date on the hypertable by running `VACUUM ANALYZE <your-hypertable>;`. Then, we suggest running the following version of EXPLAIN:sql EXPLAIN (ANALYZE on, BUFFERS on) ;
If you suspect that your performance issues are due to slow IOs from disk, you can get even more information by enabling the [track\_io\_timing][track_io_timing] variable with `SET track_io_timing = 'on';` before running the above EXPLAIN. ===== PAGE: https://docs.tigerdata.com/_troubleshooting/caggs-hypertable-retention-policy-not-applying/ ===== # Hypertable retention policy isn't applying to continuous aggregates <!--- * Use this format for writing troubleshooting sections: - Cause: What causes the problem? - Consequence: What does the user see when they hit this problem? - Fix/Workaround: What can the user do to fix or work around the problem? Provide a "Resolving" Procedure if required. - Result: When the user applies the fix, what is the result when the same action is applied? * Copy this comment at the top of every troubleshooting page --> A retention policy set on a hypertable does not apply to any continuous aggregates made from the hypertable. This allows you to set different retention periods for raw and summarized data. To apply a retention policy to a continuous aggregate, set the policy on the continuous aggregate itself. ===== PAGE: https://docs.tigerdata.com/_troubleshooting/columnstore-backlog-ooms/ ===== # Out of memory errors after enabling the columnstore By default, columnstore policies move all uncompressed chunks to the columnstore. However, before converting a large backlog of chunks from the rowstore to the columnstore, best practice is to set `maxchunks_to_compress` and limit to amount of chunks to be converted. For example:sql SELECT alter_job(job_id, config.maxchunks_to_compress => 10);
When all chunks have been converted to the columnstore, set `maxchunks_to_compress` to `0`, unlimited. ===== PAGE: https://docs.tigerdata.com/_troubleshooting/cloud-singledb/ ===== # Cannot create another database <!--- * Use this format for writing troubleshooting sections: - Cause: What causes the problem? - Consequence: What does the user see when they hit this problem? - Fix/Workaround: What can the user do to fix or work around the problem? Provide a "Resolving" Procedure if required. - Result: When the user applies the fix, what is the result when the same action is applied? * Copy this comment at the top of every troubleshooting page --> Each Tiger Cloud service hosts a single Postgres instance called `tsdb`. You see this error when you try to create an additional database in a service. If you need another database, [create a new service][create-service]. ===== PAGE: https://docs.tigerdata.com/_troubleshooting/caggs-inserted-historic-data-no-refresh/ ===== # Continuous aggregate doesn't refresh with newly inserted historical data <!--- * Use this format for writing troubleshooting sections: - Cause: What causes the problem? - Consequence: What does the user see when they hit this problem? - Fix/Workaround: What can the user do to fix or work around the problem? Provide a "Resolving" Procedure if required. - Result: When the user applies the fix, what is the result when the same action is applied? * Copy this comment at the top of every troubleshooting page --> Materialized views are generally used with ordered data. If you insert historic data, or data that is not related to the current time, you need to refresh policies and reevaluate the values that are dragging from past to present. You can set up an after insert rule for your hypertable or upsert to trigger something that can validate what needs to be refreshed as the data is merged. Let's say you inserted ordered timeframes named A, B, D, and F, and you already have a continuous aggregation looking for this data. If you now insert E, you need to refresh E and F. However, if you insert C we'll need to refresh C, D, E and F. For example: 1. A, B, D, and F are already materialized in a view with all data. 1. To insert C, split the data into `AB` and `DEF` subsets. 1. `AB` are consistent and the materialized data is too; you only need to reuse it. 1. Insert C, `DEF`, and refresh policies after C. This can use a lot of resources to process, especially if you have any important data in the past that also needs to be brought to the present. Consider an example where you have 300 columns on a single hypertable and use, for example, five of them in a continuous aggregation. In this case, it could be hard to refresh and would make more sense to isolate these columns in another hypertable. Alternatively, you might create one hypertable per metric and refresh them independently. ===== PAGE: https://docs.tigerdata.com/_troubleshooting/locf-queries-null-values-not-missing/ ===== # Queries using `locf()` don't treat `NULL` values as missing <!--- * Use this format for writing troubleshooting sections: - Cause: What causes the problem? - Consequence: What does the user see when they hit this problem? - Fix/Workaround: What can the user do to fix or work around the problem? Provide a "Resolving" Procedure if required. - Result: When the user applies the fix, what is the result when the same action is applied? * Copy this comment at the top of every troubleshooting page --> When you have a query that uses a last observation carried forward (locf) function, the query carries forward NULL values by default. If you want the function to ignore NULL values instead, you can set `treat_null_as_missing=TRUE` as the second parameter in the query. For example:sql dev=# select * FROM (select time_bucket_gapfill(4, time,-5,13), locf(avg(v)::int,treat_null_as_missing:=true) FROM (VALUES (0,0),(8,NULL)) v(time, v) WHERE time BETWEEN 0 AND 10 GROUP BY 1) i ORDER BY 1 DESC; time_bucket_gapfill | locf ---------------------+------
12 | 0 8 | 0 4 | 0 0 | 0 -4 | -8 |(6 rows)
===== PAGE: https://docs.tigerdata.com/_troubleshooting/cagg-watermark-in-future/ ===== # Continuous aggregate watermark is in the future <!--- * Use this format for writing troubleshooting sections: - Cause: What causes the problem? - Consequence: What does the user see when they hit this problem? - Fix/Workaround: What can the user do to fix or work around the problem? Provide a "Resolving" Procedure if required. - Result: When the user applies the fix, what is the result when the same action is applied? * Copy this comment at the top of every troubleshooting page --> Continuous aggregates use a watermark to indicate which time buckets have already been materialized. When you query a continuous aggregate, your query returns materialized data from before the watermark. It returns real-time, non-materialized data from after the watermark. In certain cases, the watermark might be in the future. If this happens, all buckets, including the most recent bucket, are materialized and below the watermark. No real-time data is returned. This might happen if you refresh your continuous aggregate over the time window `<START_TIME>, NULL`, which materializes all recent data. It might also happen if you create a continuous aggregate using the `WITH DATA` option. This also implicitly refreshes your continuous aggregate with a window of `NULL, NULL`. To fix this, create a new continuous aggregate using the `WITH NO DATA` option. Then use a policy to refresh this continuous aggregate over an explicit time window. ### Creating a new continuous aggregate with an explicit refresh window 1. Create a continuous aggregate using the `WITH NO DATA` option: ```sql CREATE MATERIALIZED VIEW <continuous_aggregate_name> WITH (timescaledb.continuous) AS SELECT time_bucket('<interval>', <partition_column>), <other_columns_to_select>, ... FROM <hypertable> GROUP BY bucket, WITH NO DATA; ``` 1. Refresh the continuous aggregate using a policy with an explicit `end_offset`. For example: ```sql SELECT add_continuous_aggregate_policy('<continuous_aggregate_name>', start_offset => INTERVAL '30 day', end_offset => INTERVAL '1 hour', schedule_interval => INTERVAL '1 hour'); ``` 1. Check your new continuous aggregate's watermark to make sure it is in the past, not the future. Get the ID for the materialization hypertable that contains the actual continuous aggregate data: ```sql SELECT id FROM _timescaledb_catalog.hypertable WHERE table_name=( SELECT materialization_hypertable_name FROM timescaledb_information.continuous_aggregates WHERE view_name='<continuous_aggregate_name>' ); ``` 1. Use the returned ID to query for the watermark's timestamp: For TimescaleDB >= 2.12: ```sql SELECT COALESCE( _timescaledb_functions.to_timestamp(_timescaledb_functions.cagg_watermark(<ID>)), '-infinity'::timestamp with time zone ); ``` For TimescaleDB < 2.12: ```sql SELECT COALESCE( _timescaledb_internal.to_timestamp(_timescaledb_internal.cagg_watermark(<ID>)), '-infinity'::timestamp with time zone ); ``` If you choose to delete your old continuous aggregate after creating a new one, beware of historical data loss. If your old continuous aggregate contained data that you dropped from your original hypertable, for example through a data retention policy, the dropped data is not included in your new continuous aggregate. ===== PAGE: https://docs.tigerdata.com/_troubleshooting/scheduled-jobs-stop-running/ ===== # Scheduled jobs stop running <!--- * Use this format for writing troubleshooting sections: - Cause: What causes the problem? - Consequence: What does the user see when they hit this problem? - Fix/Workaround: What can the user do to fix or work around the problem? Provide a "Resolving" Procedure if required. - Result: When the user applies the fix, what is the result when the same action is applied? * Copy this comment at the top of every troubleshooting page --> Your scheduled jobs might stop running for various reasons. On self-hosted TimescaleDB, you can fix this by restarting background workers: = 2.12">sql SELECT _timescaledb_functions.start_background_workers();
sql SELECT _timescaledb_internal.start_background_workers();
On Tiger Cloud and Managed Service for TimescaleDB, restart background workers by doing one of the following: * Run `SELECT timescaledb_pre_restore()`, followed by `SELECT timescaledb_post_restore()`. * Power the service off and on again. This might cause a downtime of a few minutes while the service restores from backup and replays the write-ahead log. ===== PAGE: https://docs.tigerdata.com/_troubleshooting/invalid-attribute-reindex-hypertable/ ===== # Reindex hypertables to fix large indexes <!--- * Use this format for writing troubleshooting sections: - Cause: What causes the problem? - Consequence: What does the user see when they hit this problem? - Fix/Workaround: What can the user do to fix or work around the problem? Provide a "Resolving" Procedure if required. - Result: When the user applies the fix, what is the result when the same action is applied? * Copy this comment at the top of every troubleshooting page --> You might see this error if your hypertable indexes have become very large. To resolve the problem, reindex your hypertables with this command:sql reindex table _timescaledb_internal._hyper_2_1523284_chunk
For more information, see the [hypertable documentation][hypertables]. ===== PAGE: https://docs.tigerdata.com/_troubleshooting/compression-userperms/ ===== # User permissions do not allow chunks to be converted to columnstore or rowstore <!--- * Use this format for writing troubleshooting sections: - Cause: What causes the problem? - Consequence: What does the user see when they hit this problem? - Fix/Workaround: What can the user do to fix or work around the problem? Provide a "Resolving" Procedure if required. - Result: When the user applies the fix, what is the result when the same action is applied? * Copy this comment at the top of every troubleshooting page --> You might get this error if you attempt to compress a chunk into the columnstore, or decompress it back into rowstore with a non-privileged user account. To compress or decompress a chunk, your user account must have permissions that allow it to perform `CREATE INDEX` on the chunk. You can check the permissions of the current user with this command at the `psql` command prompt:sql \dn+
To resolve this problem, grant your user account the appropriate privileges with this command:sql GRANT PRIVILEGES
ON TABLE TO <ROLE_TYPE>;For more information about the `GRANT` command, see the [Postgres documentation][pg-grant]. ===== PAGE: https://docs.tigerdata.com/_troubleshooting/compression-inefficient-chunk-interval/ ===== # Inefficient `compress_chunk_time_interval` configuration When you configure `compress_chunk_time_interval` but do not set the primary dimension as the first column in `compress_orderby`, TimescaleDB decompresses chunks before merging. This makes merging less efficient. Set the primary dimension of the chunk as the first column in `compress_orderby` to improve efficiency. ===== PAGE: https://docs.tigerdata.com/_troubleshooting/cloud-jdbc-authentication-support/ ===== # JDBC authentication type is not supported <!--- * Use this format for writing troubleshooting sections: - Cause: What causes the problem? - Consequence: What does the user see when they hit this problem? - Fix/Workaround: What can the user do to fix or work around the problem? Provide a "Resolving" Procedure if required. - Result: When the user applies the fix, what is the result when the same action is applied? * Copy this comment at the top of every troubleshooting page --> When connecting to Tiger Cloud with a Java Database Connectivity (JDBC) driver, you might get this error message. Your Tiger Cloud authentication type doesn't match your JDBC driver's supported authentication types. The recommended approach is to upgrade your JDBC driver to a version that supports `scram-sha-256` encryption. If that isn't an option, you can change the authentication type for your Tiger Cloud service to `md5`. Note that `md5` is less secure, and is provided solely for compatibility with older clients. For information on changing your authentication type, see the documentation on [resetting your service password][password-reset]. ===== PAGE: https://docs.tigerdata.com/_troubleshooting/chunk-temp-file-limit/ ===== # Temporary file size limit exceeded when converting chunks to the columnstore <!--- * Use this format for writing troubleshooting sections: - Cause: What causes the problem? - Consequence: What does the user see when they hit this problem? - Fix/Workaround: What can the user do to fix or work around the problem? Provide a "Resolving" Procedure if required. - Result: When the user applies the fix, what is the result when the same action is applied? * Copy this comment at the top of every troubleshooting page --> When you try to convert a chunk to the columnstore, especially if the chunk is very large, you could get this error. Compression operations write files to a new compressed chunk table, which is written in temporary memory. The maximum amount of temporary memory available is determined by the `temp_file_limit` parameter. You can work around this problem by adjusting the `temp_file_limit` and `maintenance_work_mem` parameters. ===== PAGE: https://docs.tigerdata.com/_troubleshooting/slow-tiering-chunks/ ===== # Slow tiering of chunks <!--- * Use this format for writing troubleshooting sections: - Cause: What causes the problem? - Consequence: What does the user see when they hit this problem? - Fix/Workaround: What can the user do to fix or work around the problem? Provide a "Resolving" Procedure if required. - Result: When the user applies the fix, what is the result when the same action is applied? * Copy this comment at the top of every troubleshooting page --> Chunks are tiered asynchronously. Chunks are selected to be tiered to the object storage tier one at a time ordered by their enqueue time. To see the chunks waiting to be tiered query the `timescaledb_osm.chunks_queued_for_tiering` viewsql select count(*) from timescaledb_osm.chunks_queued_for_tiering
Processing all the chunks in the queue may take considerable time if a large quantity of data is being migrated to the object storage tier. ===== PAGE: https://docs.tigerdata.com/self-hosted/index/ ===== # Self-hosted TimescaleDB TimescaleDB is an extension for Postgres that enables time-series workloads, increasing ingest, query, storage and analytics performance. Best practice is to run TimescaleDB in a [Tiger Cloud service](https://console.cloud.timescale.com/signup), but if you want to self-host you can run TimescaleDB yourself. Deploy a Tiger Cloud service. We tune your database for performance and handle scalability, high availability, backups and management so you can relax. Self-hosted TimescaleDB is community supported. For additional help check out the friendly [Tiger Data community][community]. If you'd prefer to pay for support then check out our [self-managed support][support]. ===== PAGE: https://docs.tigerdata.com/self-hosted/configuration/about-configuration/ ===== # About configuration in TimescaleDB By default, TimescaleDB uses the default Postgres server configuration settings. However, in some cases, these settings are not appropriate, especially if you have larger servers that use more hardware resources such as CPU, memory, and storage. This section explains some of the settings you are most likely to need to adjust. Some of these settings are Postgres settings, and some are TimescaleDB specific settings. For most changes, you can use the [tuning tool][tstune-conf] to adjust your configuration. For more advanced configuration settings, or to change settings that aren't included in the `timescaledb-tune` tool, you can [manually adjust][postgresql-conf] the `postgresql.conf` configuration file. ## Memory Settings: * `shared_buffers` * `effective_cache_size` * `work_mem` * `maintenance_work_mem` * `max_connections` You can adjust each of these to match the machine's available memory. To make it easier, you can use the [PgTune][pgtune] site to work out what settings to use: enter your machine details, and select the `data warehouse` DB type to see the suggested parameters. You can adjust these settings with `timescaledb-tune`. ## Workers Settings: * `timescaledb.max_background_workers` * `max_parallel_workers` * `max_worker_processes` Postgres uses worker pools to provide workers for live queries and background jobs. If you do not configure these settings, your queries and background jobs could run more slowly. TimescaleDB background workers are configured with `timescaledb.max_background_workers`. Each database needs a background worker allocated to schedule jobs. Additional workers run background jobs as required. This setting should be the sum of the total number of databases and the total number of concurrent background workers you want running at any one time. By default, `timescaledb-tune` sets `timescaledb.max_background_workers` to 16. You can change this setting directly, use the `--max-bg-workers` flag, or adjust the `TS_TUNE_MAX_BG_WORKERS` [Docker environment variable][docker-conf]. TimescaleDB parallel workers are configured with `max_parallel_workers`. For larger queries, Postgres automatically uses parallel workers if they are available. Increasing this setting can improve query performance for large queries that trigger the use of parallel workers. By default, this setting corresponds to the number of CPUs available. You can change this parameter directly, by adjusting the `--cpus` flag, or by using the `TS_TUNE_NUM_CPUS` [Docker environment variable][docker-conf]. The `max_worker_processes` setting defines the total pool of workers available to both background and parallel workers, as well a small number of built-in Postgres workers. It should be at least the sum of `timescaledb.max_background_workers` and `max_parallel_workers`. You can adjust these settings with `timescaledb-tune`. ## Disk writes Settings: * `synchronous_commit` By default, disk writes are performed synchronously, so each transaction must be completed and a success message sent, before the next transaction can begin. You can change this to asynchronous to increase write throughput by setting `synchronous_commit = 'off'`. Note that disabling synchronous commits could result in some committed transactions being lost. To help reduce the risk, do not also change `fsync` setting. For more information about asynchronous commits and disk write speed, see the [Postgres documentation][async-commit]. You can adjust these settings in the `postgresql.conf` configuration file. ## Transaction locks Settings: * `max_locks_per_transaction` TimescaleDB relies on table partitioning to scale time-series workloads. A hypertable needs to acquire locks on many chunks during queries, which can exhaust the default limits for the number of allowed locks held. In some cases, you might see a warning like this:sql psql: FATAL: out of shared memory HINT: You might need to increase max_locks_per_transaction.
To avoid this issue, you can increase the `max_locks_per_transaction` setting from the default value, which is usually 64. This parameter limits the average number of object locks used by each transaction; individual transactions can lock more objects as long as the locks of all transactions fit in the lock table. For most workloads, choose a number equal to double the maximum number of chunks you expect to have in a hypertable divided by `max_connections`. This takes into account that the number of locks used by a hypertable query is roughly equal to the number of chunks in the hypertable if you need to access all chunks in a query, or double that number if the query uses an index. You can see how many chunks you currently have using the [`timescaledb_information.hypertables`][timescaledb_information-hypertables] view. Changing this parameter requires a database restart, so make sure you pick a larger number to allow for some growth. For more information about lock management, see the [Postgres documentation][lock-management]. You can adjust these settings in the `postgresql.conf` configuration file. ===== PAGE: https://docs.tigerdata.com/self-hosted/configuration/timescaledb-config/ ===== # TimescaleDB configuration and tuning Just as you can tune settings in Postgres, TimescaleDB provides a number of configuration settings that may be useful to your specific installation and performance needs. These can also be set within the `postgresql.conf` file or as command-line parameters when starting Postgres. when starting Postgres. Just as you can tune settings in Postgres, TimescaleDB provides a number of configuration settings that may be useful to your specific installation and performance needs. These can also be set within the `postgresql.conf` file or as command-line parameters when starting Postgres. ## Query Planning and Execution ### `timescaledb.enable_chunkwise_aggregation (bool)` If enabled, aggregations are converted into partial aggregations during query planning. The first part of the aggregation is executed on a per-chunk basis. Then, these partial results are combined and finalized. Splitting aggregations decreases the size of the created hash tables and increases data locality, which speeds up queries. ### `timescaledb.vectorized_aggregation (bool)` Enables or disables the vectorized optimizations in the query executor. For example, the `sum()` aggregation function on compressed chunks can be optimized in this way. ### `timescaledb.enable_merge_on_cagg_refresh (bool)` Set to `ON` to dramatically decrease the amount of data written on a continuous aggregate in the presence of a small number of changes, reduce the i/o cost of refreshing a [continuous aggregate][continuous-aggregates], and generate fewer Write-Ahead Logs (WAL). Only works for continuous aggregates that don't have compression enabled. Please refer to the [Grand Unified Configuration (GUC) parameters][gucs] for a complete list. ## Policies ### `timescaledb.max_background_workers (int)` Max background worker processes allocated to TimescaleDB. Set to at least 1 + the number of databases loaded with the TimescaleDB extension in a Postgres instance. Default value is 16. ## Tiger Cloud service tuning ### `timescaledb.disable_load (bool)` Disable the loading of the actual extension ## Administration ### `timescaledb.restoring (bool)` Set TimescaleDB in restoring mode. It is disabled by default. ### `timescaledb.license (string)` Change access to features based on the TimescaleDB license in use. For example, setting `timescaledb.license` to `apache` limits TimescaleDB to features that are implemented under the Apache 2 license. The default value is `timescale`, which allows access to all features. ### `timescaledb.telemetry_level (enum)` Telemetry settings level. Level used to determine which telemetry to send. Can be set to `off` or `basic`. Defaults to `basic`. ### `timescaledb.last_tuned (string)` Records last time `timescaledb-tune` ran. ### `timescaledb.last_tuned_version (string)` Version of `timescaledb-tune` used to tune when it runs. ## Distributed hypertables [Multi-node support is sunsetted][multi-node-deprecation]. TimescaleDB v2.13 is the last release that includes multi-node support for Postgres versions 13, 14, and 15. ### `timescaledb.enable_2pc (bool)` Enables two-phase commit for distributed hypertables. If disabled, it uses a one-phase commit instead, which is faster but can result in inconsistent data. It is by default enabled. ### `timescaledb.enable_per_data_node_queries` If enabled, TimescaleDB combines different chunks belonging to the same hypertable into a single query per data node. It is by default enabled. ### `timescaledb.max_insert_batch_size (int)` When acting as a access node, TimescaleDB splits batches of inserted tuples across multiple data nodes. It batches up to `max_insert_batch_size` tuples per data node before flushing. Setting this to 0 disables batching, reverting to tuple-by-tuple inserts. The default value is 1000. ### `timescaledb.enable_connection_binary_data (bool)` Enables binary format for data exchanged between nodes in the cluster. It is by default enabled. ### `timescaledb.enable_client_ddl_on_data_nodes (bool)` Enables DDL operations on data nodes by a client and do not restrict execution of DDL operations only by access node. It is by default disabled. ### `timescaledb.enable_async_append (bool)` Enables optimization that runs remote queries asynchronously across data nodes. It is by default enabled. ### `timescaledb.enable_remote_explain (bool)` Enable getting and showing `EXPLAIN` output from remote nodes. This requires sending the query to the data node, so it can be affected by the network connection and availability of data nodes. It is by default disabled. ### `timescaledb.remote_data_fetcher (enum)` Pick data fetcher type based on type of queries you plan to run, which can be either `copy`, `cursor`, or `auto`. The default is `auto`. ### `timescaledb.ssl_dir (string)` Specifies the path used to search user certificates and keys when connecting to data nodes using certificate authentication. Defaults to `timescaledb/certs` under the Postgres data directory. ### `timescaledb.passfile (string)` [ Specifies the name of the file where passwords are stored and when connecting to data nodes using password authentication. ===== PAGE: https://docs.tigerdata.com/self-hosted/configuration/docker-config/ ===== # Configuration with Docker If you are running TimescaleDB in a [Docker container][docker], there are two different ways to modify your Postgres configuration. You can edit the Postgres configuration file inside the Docker container, or you can set parameters at the command prompt. ## Edit the Postgres configuration file inside Docker You can start the Dockert container, and then use a text editor to edit the Postgres configuration file directly. The configuration file requires one parameter per line. Blank lines are ignored, and you can use a `#` symbol at the beginning of a line to denote a comment. ### Editing the Postgres configuration file inside Docker 1. Start your Docker instance: ```bash docker start timescaledb ``` 1. Open a shell: ```bash docker exec -i -t timescaledb /bin/bash ``` 1. Open the configuration file in `Vi` editor or your preferred text editor. ```bash vi /var/lib/postgresql/data/postgresql.conf ``` 1. Restart the container to reload the configuration: ```bash docker restart timescaledb ``` ## Setting parameters at the command prompt If you don't want to open the configuration file to make changes, you can also set parameters directly from the command prompt inside your Docker container, using the `-c` option. For example:bash docker run -i -t timescale/timescaledb:latest-pg10 postgres -c max_wal_size=2GB
===== PAGE: https://docs.tigerdata.com/self-hosted/configuration/configuration/ ===== # Configuring TimescaleDB TimescaleDB works with the default Postgres server configuration settings. However, we find that these settings are typically too conservative and can be limiting when using larger servers with more resources (CPU, memory, disk, etc). Adjusting these settings, either [automatically with our tool `timescaledb-tune`][tstune] or manually editing your machine's `postgresql.conf`, can improve performance. You can determine the location of `postgresql.conf` by running `SHOW config_file;` from your Postgres client (for example, `psql`). In addition, other TimescaleDB specific settings can be modified through the `postgresql.conf` file as covered in the [TimescaleDB settings][ts-settings] section. ## Using `timescaledb-tune` To streamline the configuration process, use [`timescaledb-tune`][tstune] that handles setting the most common parameters to appropriate values based on your system, accounting for memory, CPU, and Postgres version. `timescaledb-tune` is packaged along with the binary releases as a dependency, so if you installed one of the binary releases (including Docker), you should have access to the tool. Alternatively, with a standard Go environment, you can also `go get` the repository to install it. `timescaledb-tune` reads your system's `postgresql.conf` file and offers interactive suggestions for updating your settings:bash Using postgresql.conf at this path: /usr/local/var/postgres/postgresql.conf
Is this correct? [(y)es/(n)o]: y Writing backup to: /var/folders/cr/zpgdkv194vz1g5smxl_5tggm0000gn/T/timescaledb_tune.backup201901071520
shared_preload_libraries needs to be updated Current: #shared_preload_libraries = 'timescaledb' Recommended: shared_preload_libraries = 'timescaledb' Is this okay? [(y)es/(n)o]: y success: shared_preload_libraries will be updated
Tune memory/parallelism/WAL and other settings? [(y)es/(n)o]: y Recommendations based on 8.00 GB of available memory and 4 CPUs for PostgreSQL 11
Memory settings recommendations Current: shared_buffers = 128MB #effective_cache_size = 4GB #maintenance_work_mem = 64MB #work_mem = 4MB Recommended: shared_buffers = 2GB effective_cache_size = 6GB maintenance_work_mem = 1GB work_mem = 26214kB Is this okay? [(y)es/(s)kip/(q)uit]:
These changes are then written to your `postgresql.conf` and take effect on the next (re)start. If you are starting on fresh instance and don't feel the need to approve each group of changes, you can also automatically accept and append the suggestions to the end of your `postgresql.conf` like so:bash timescaledb-tune --quiet --yes --dry-run >> /path/to/postgresql.conf
## Postgres configuration and tuning If you prefer to tune the settings yourself, or are curious about the suggestions that `timescaledb-tune` makes, then check these. However, `timescaledb-tune` does not cover all settings that you need to adjust. ### Memory settings All of these settings are handled by `timescaledb-tune`. The settings `shared_buffers`, `effective_cache_size`, `work_mem`, and `maintenance_work_mem` need to be adjusted to match the machine's available memory. Get the configuration values from the [PgTune][pgtune] website (suggested DB Type: Data warehouse). You should also adjust the `max_connections` setting to match the ones given by PgTune since there is a connection between `max_connections` and memory settings. Other settings from PgTune may also be helpful. ### Worker settings All of these settings are handled by `timescaledb-tune`. Postgres utilizes worker pools to provide the required workers needed to support both live queries and background jobs. If you do not configure these settings, you may observe performance degradation on both queries and background jobs. TimescaleDB background workers are configured using the `timescaledb.max_background_workers` setting. You should configure this setting to the sum of your total number of databases and the total number of concurrent background workers you want running at any given point in time. You need a background worker allocated to each database to run a lightweight scheduler that schedules jobs. On top of that, any additional workers you allocate here run background jobs when needed. For larger queries, Postgres automatically uses parallel workers if they are available. To configure this use the `max_parallel_workers` setting. Increasing this setting improves query performance for larger queries. Smaller queries may not trigger parallel workers. By default, this setting corresponds to the number of CPUs available. Use the `--cpus` flag or the `TS_TUNE_NUM_CPUS` docker environment variable to change it. Finally, you must configure `max_worker_processes` to be at least the sum of `timescaledb.max_background_workers` and `max_parallel_workers`. `max_worker_processes` is the total pool of workers available to both background and parallel workers (as well as a handful of built-in Postgres workers). By default, `timescaledb-tune` sets `timescaledb.max_background_workers` to 16. In order to change this setting, use the `--max-bg-workers` flag or the `TS_TUNE_MAX_BG_WORKERS` docker environment variable. The `max_worker_processes` setting is automatically adjusted as well. ### Disk-write settings In order to increase write throughput, there are [multiple settings][async-commit] to adjust the behavior that Postgres uses to write data to disk. In tests, performance is good with the default, or safest, settings. If you want a bit of additional performance, you can set `synchronous_commit = 'off'`([Postgres docs][synchronous-commit]). Please note that when disabling `synchronous_commit` in this way, an operating system or database crash might result in some recent allegedly committed transactions being lost. We actively discourage changing the `fsync` setting. ### Lock settings TimescaleDB relies heavily on table partitioning for scaling time-series workloads, which has implications for [lock management][lock-management]. A hypertable needs to acquire locks on many chunks (sub-tables) during queries, which can exhaust the default limits for the number of allowed locks held. This might result in a warning like the following:sql psql: FATAL: out of shared memory HINT: You might need to increase max_locks_per_transaction.
To avoid this issue, it is necessary to increase the `max_locks_per_transaction` setting from the default value (which is typically 64). Since changing this parameter requires a database restart, it is advisable to estimate a good setting that also allows some growth. For most use cases we recommend the following setting:max_locks_per_transaction = 2 * num_chunks / max_connections
where `num_chunks` is the maximum number of chunks you expect to have in a hypertable and `max_connections` is the number of connections configured for Postgres. This takes into account that the number of locks used by a hypertable query is roughly equal to the number of chunks in the hypertable if you need to access all chunks in a query, or double that number if the query uses an index. You can see how many chunks you currently have using the [`timescaledb_information.hypertables`][timescaledb_information-hypertables] view. Changing this parameter requires a database restart, so make sure you pick a larger number to allow for some growth. For more information about lock management, see the [Postgres documentation][lock-management]. ## TimescaleDB configuration and tuning Just as you can tune settings in Postgres, TimescaleDB provides a number of configuration settings that may be useful to your specific installation and performance needs. These can also be set within the `postgresql.conf` file or as command-line parameters when starting Postgres. ### Policies #### `timescaledb.max_background_workers (int)` Max background worker processes allocated to TimescaleDB. Set to at least 1 + number of databases in Postgres instance to use background workers. Default value is 8. ### Distributed hypertables #### `timescaledb.hypertable_distributed_default (enum)` Set default policy to create local or distributed hypertables for `create_hypertable()` command, when the `distributed` argument is not provided. Supported values are `auto`, `local` or `distributed`. #### `timescaledb.hypertable_replication_factor_default (int)` Global default value for replication factor to use with hypertables when the `replication_factor` argument is not provided. Defaults to 1. #### `timescaledb.enable_2pc (bool)` Enables two-phase commit for distributed hypertables. If disabled, it uses a one-phase commit instead, which is faster but can result in inconsistent data. It is by default enabled. #### `timescaledb.enable_per_data_node_queries (bool)` If enabled, TimescaleDB combines different chunks belonging to the same hypertable into a single query per data node. It is by default enabled. #### `timescaledb.max_insert_batch_size (int)` When acting as a access node, TimescaleDB splits batches of inserted tuples across multiple data nodes. It batches up to `max_insert_batch_size` tuples per data node before flushing. Setting this to 0 disables batching, reverting to tuple-by-tuple inserts. The default value is 1000. #### `timescaledb.enable_connection_binary_data (bool)` Enables binary format for data exchanged between nodes in the cluster. It is by default enabled. #### `timescaledb.enable_client_ddl_on_data_nodes (bool)` Enables DDL operations on data nodes by a client and do not restrict execution of DDL operations only by access node. It is by default disabled. #### `timescaledb.enable_async_append (bool)` Enables optimization that runs remote queries asynchronously across data nodes. It is by default enabled. #### `timescaledb.enable_remote_explain (bool)` Enable getting and showing `EXPLAIN` output from remote nodes. This requires sending the query to the data node, so it can be affected by the network connection and availability of data nodes. It is by default disabled. #### `timescaledb.remote_data_fetcher (enum)` Pick data fetcher type based on type of queries you plan to run, which can be either `rowbyrow` or `cursor`. The default is `rowbyrow`. #### `timescaledb.ssl_dir (string)` Specifies the path used to search user certificates and keys when connecting to data nodes using certificate authentication. Defaults to `timescaledb/certs` under the Postgres data directory. #### `timescaledb.passfile (string)` Specifies the name of the file where passwords are stored and when connecting to data nodes using password authentication. ### Administration #### `timescaledb.restoring (bool)` Set TimescaleDB in restoring mode. It is by default disabled. #### `timescaledb.license (string)` TimescaleDB license type. Determines which features are enabled. The variable can be set to `timescale` or `apache`. Defaults to `timescale`. #### `timescaledb.telemetry_level (enum)` Telemetry settings level. Level used to determine which telemetry to send. Can be set to `off` or `basic`. Defaults to `basic`. #### `timescaledb.last_tuned (string)` Records last time `timescaledb-tune` ran. #### `timescaledb.last_tuned_version (string)` Version of `timescaledb-tune` used to tune when it ran. ## Changing configuration with Docker When running TimescaleDB in a [Docker container][docker], there are two approaches to modifying your Postgres configuration. In the following example, we modify the size of the database instance's write-ahead-log (WAL) from 1 GB to 2 GB in a Docker container named `timescaledb`. #### Modifying postgres.conf inside Docker 1. Open a shell in Docker to change the configuration on a running container.bash docker start timescaledb docker exec -i -t timescaledb /bin/bash
1. Edit and then save the config file, modifying the setting for the desired configuration parameter (for example, `max_wal_size`).bash vi /var/lib/postgresql/data/postgresql.conf
1. Restart the container so the config gets reloaded.bash docker restart timescaledb
1. Test to see if the change worked.bash
docker exec -it timescaledb psql -U postgres postgres=# show max_wal_size; max_wal_size -------------- 2GB#### Specify configuration parameters as boot options Alternatively, one or more parameters can be passed in to the `docker run` command via a `-c` option, as in the following.bash docker run -i -t timescale/timescaledb:latest-pg10 postgres -cmax_wal_size=2GB
Additional examples of passing in arguments at boot can be found in our [discussion about using WAL-E][wale] for incremental backup. ===== PAGE: https://docs.tigerdata.com/self-hosted/configuration/telemetry/ ===== # Telemetry and version checking TimescaleDB collects anonymous usage data to help us better understand and assist our users. It also helps us provide some services, such as automated version checking. Your privacy is the most important thing to us, so we do not collect any personally identifying information. In particular, the `UUID` (user ID) fields contain no identifying information, but are randomly generated by appropriately seeded random number generators. This is an example of the JSON data file that is sent for a specific deployment: <Collapsible heading="Example JSON telemetry data file" defaultExpanded={false}>json { "db_uuid": "
860c2be4-59a3-43b5-b895-5d9e0dd445", "license": {"edition": "community"}, "os_name": "Linux", "relations": {
"views": { "num_relations": 0 }, "tables": { "heap_size": 32768, "toast_size": 16384, "indexes_size": 98304, "num_relations": 4, "num_reltuples": 12 }, "hypertables": { "heap_size": 3522560, "toast_size": 23379968, "compression": { "compressed_heap_size": 3522560, "compressed_row_count": 4392, "compressed_toast_size": 20365312, "num_compressed_chunks": 366, "uncompressed_heap_size": 41951232, "uncompressed_row_count": 421368, "compressed_indexes_size": 11993088, "uncompressed_toast_size": 2998272, "uncompressed_indexes_size": 42696704, "num_compressed_hypertables": 1 }, "indexes_size": 18022400, "num_children": 366, "num_relations": 2, "num_reltuples": 421368 }, "materialized_views": { "heap_size": 0, "toast_size": 0, "indexes_size": 0, "num_relations": 0, "num_reltuples": 0 }, "partitioned_tables": { "heap_size": 0, "toast_size": 0, "indexes_size": 0, "num_children": 0, "num_relations": 0, "num_reltuples": 0 }, "continuous_aggregates": { "heap_size": 122404864, "toast_size": 6225920, "compression": { "compressed_heap_size": 0, "compressed_row_count": 0, "num_compressed_caggs": 0, "compressed_toast_size": 0, "num_compressed_chunks": 0, "uncompressed_heap_size": 0, "uncompressed_row_count": 0, "compressed_indexes_size": 0, "uncompressed_toast_size": 0, "uncompressed_indexes_size": 0 }, "indexes_size": 165044224, "num_children": 760, "num_relations": 24, "num_reltuples": 914704, "num_caggs_on_distributed_hypertables": 0, "num_caggs_using_real_time_aggregation": 24 }, "distributed_hypertables_data_node": { "heap_size": 0, "toast_size": 0, "compression": { "compressed_heap_size": 0, "compressed_row_count": 0, "compressed_toast_size": 0, "num_compressed_chunks": 0, "uncompressed_heap_size": 0, "uncompressed_row_count": 0, "compressed_indexes_size": 0, "uncompressed_toast_size": 0, "uncompressed_indexes_size": 0, "num_compressed_hypertables": 0 }, "indexes_size": 0, "num_children": 0, "num_relations": 0, "num_reltuples": 0 }, "distributed_hypertables_access_node": { "heap_size": 0, "toast_size": 0, "compression": { "compressed_heap_size": 0, "compressed_row_count": 0, "compressed_toast_size": 0, "num_compressed_chunks": 0, "uncompressed_heap_size": 0, "uncompressed_row_count": 0, "compressed_indexes_size": 0, "uncompressed_toast_size": 0, "uncompressed_indexes_size": 0, "num_compressed_hypertables": 0 }, "indexes_size": 0, "num_children": 0, "num_relations": 0, "num_reltuples": 0, "num_replica_chunks": 0, "num_replicated_distributed_hypertables": 0 }}, "os_release": "5.10.47-linuxkit", "os_version": "#1 SMP Sat Jul 3 21:51:47 UTC 2021", "data_volume": 381903727, "db_metadata": {}, "build_os_name": "Linux", "functions_used": {
"pg_catalog.int8(integer)": 8, "pg_catalog.count(pg_catalog.\"any\")": 20, "pg_catalog.int4eq(integer,integer)": 7, "pg_catalog.textcat(pg_catalog.text,pg_catalog.text)": 10, "pg_catalog.chareq(pg_catalog.\"char\",pg_catalog.\"char\")": 6,}, "install_method": "docker", "installed_time": "2022-02-17T19:55:14+00", "os_name_pretty": "Alpine Linux v3.15", "last_tuned_time": "2022-02-17T19:55:14Z", "build_os_version": "5.11.0-1028-azure", "exported_db_uuid": "
5730161f-0d18-42fb-a800-45df33494c", "telemetry_version": 2, "build_architecture": "x86_64", "distributed_member": "none", "last_tuned_version": "0.12.0", "postgresql_version": "12.10", "related_extensions": {"postgis": false, "pg_prometheus": false, "timescale_analytics": false, "timescaledb_toolkit": false}, "timescaledb_version": "2.6.0", "num_reorder_policies": 0, "num_retention_policies": 0, "num_compression_policies": 1, "num_user_defined_actions": 1, "build_architecture_bit_size": 64, "num_continuous_aggs_policies": 24 }
</Collapsible> If you want to see the exact JSON data file that is sent, use the [`get_telemetry_report`][get_telemetry_report] API call. Telemetry reports are different if you are using an open source or community version of TimescaleDB. For these versions, the report includes an `edition` field, with a value of either `apache_only` or `community`. ## Change what is included the telemetry report If you want to adjust which metadata is included or excluded from the telemetry report, you can do so in the `_timescaledb_catalog.metadata` table. Metadata which has `include_in_telemetry` set to `true`, and a value of `timescaledb_telemetry.cloud`, is included in the telemetry report. ## Version checking Telemetry reports are sent periodically in the background. In response to the telemetry report, the database receives the most recent version of TimescaleDB available for installation. This version is recorded in your server logs, along with any applicable out-of-date version warnings. You do not have to update immediately to the newest release, but we highly recommend that you do so, to take advantage of performance improvements and bug fixes. ## Disable telemetry It is highly recommend that you leave telemetry enabled, as it provides useful features for you, and helps to keep improving Timescale. However, you can turn off telemetry if you need to for a specific database, or for an entire instance. If you turn off telemetry, the version checking feature is also turned off. ### Disabling telemetry 1. Open your Postgres configuration file, and locate the `timescaledb.telemetry_level` parameter. See the [Postgres configuration file][postgres-config] instructions for locating and opening the file. 1. Change the parameter setting to `off`: ```yaml timescaledb.telemetry_level=off ``` 1. Reload the configuration file: ```bash pg_ctl ``` 1. Alternatively, you can use this command at the `psql` prompt, as the root user: ```sql ALTER [SYSTEM | DATABASE | USER] { *db_name* | *role_specification* } SET timescaledb.telemetry_level=off ``` This command disables telemetry for the specified system, database, or user. ### Enabling telemetry 1. Open your Postgres configuration file, and locate the 'timescaledb.telemetry_level' parameter. See the [Postgres configuration file][postgres-config] instructions for locating and opening the file. 1. Change the parameter setting to 'off': ```yaml timescaledb.telemetry_level=basic ``` 1. Reload the configuration file: ```bash pg_ctl ``` 1. Alternatively, you can use this command at the `psql` prompt, as the root user: ```sql ALTER [SYSTEM | DATABASE | USER] { *db_name* | *role_specification* } SET timescaledb.telemetry_level=basic ``` This command enables telemetry for the specified system, database, or user. ===== PAGE: https://docs.tigerdata.com/self-hosted/configuration/timescaledb-tune/ ===== # TimescaleDB tuning tool To help make configuring TimescaleDB a little easier, you can use the [`timescaledb-tune`][tstune] tool. This tool handles setting the most common parameters to good values based on your system. It accounts for memory, CPU, and Postgres version. `timescaledb-tune` is packaged with the TimescaleDB binary releases as a dependency, so if you installed TimescaleDB from a binary release (including Docker), you should already have access to the tool. Alternatively, you can use the `go install` command to install it:bash go install github.com/timescale/timescaledb-tune/cmd/timescaledb-tune@latest
The `timescaledb-tune` tool reads your system's `postgresql.conf` file and offers interactive suggestions for your settings. Here is an example of the tool running:bash Using postgresql.conf at this path: /usr/local/var/postgres/postgresql.conf
Is this correct? [(y)es/(n)o]: y Writing backup to: /var/folders/cr/example/T/timescaledb_tune.backup202101071520
shared_preload_libraries needs to be updated Current: #shared_preload_libraries = 'timescaledb' Recommended: shared_preload_libraries = 'timescaledb' Is this okay? [(y)es/(n)o]: y success: shared_preload_libraries will be updated
Tune memory/parallelism/WAL and other settings? [(y)es/(n)o]: y Recommendations based on 8.00 GB of available memory and 4 CPUs for PostgreSQL 12
Memory settings recommendations Current: shared_buffers = 128MB #effective_cache_size = 4GB #maintenance_work_mem = 64MB #work_mem = 4MB Recommended: shared_buffers = 2GB effective_cache_size = 6GB maintenance_work_mem = 1GB work_mem = 26214kB Is this okay? [(y)es/(s)kip/(q)uit]:
When you have answered the questions, the changes are written to your `postgresql.conf` and take effect when you next restart. If you are starting on a fresh instance and don't want to approve each group of changes, you can automatically accept and append the suggestions to the end of your `postgresql.conf` by using some additional flags when you run the tool:bash timescaledb-tune --quiet --yes --dry-run >> /path/to/postgresql.conf
===== PAGE: https://docs.tigerdata.com/self-hosted/configuration/postgres-config/ ===== # Manual Postgres configuration and tuning If you prefer to tune settings yourself, or for settings not covered by `timescaledb-tune`, you can manually configure your installation using the Postgres configuration file. For some common configuration settings you might want to adjust, see the [about-configuration][about-configuration] page. For more information about the Postgres configuration page, see the [Postgres documentation][pg-config]. ## Edit the Postgres configuration file The location of the Postgres configuration file depends on your operating system and installation. 1. **Find the location of the config file for your Postgres instance** 1. Connect to your database: ```shell psql -d "postgres://<username>:<password>@<host>:<port>/<database-name>" ``` 1. Retrieve the database file location from the database internal configuration. ```sql SHOW config_file; ``` Postgres returns the path to your configuration file. For example: ```sql -------------------------------------------- /home/postgres/pgdata/data/postgresql.conf (1 row) ``` 1. **Open the config file, then [edit your Postgres configuration][pg-config]**shell vi /home/postgres/pgdata/data/postgresql.conf
1. **Save your updated configuration** When you have saved the changes you make to the configuration file, the new configuration is not applied immediately. The configuration file is automatically reloaded when the server receives a `SIGHUP` signal. To manually reload the file, use the `pg_ctl` command. ## Setting parameters at the command prompt If you don't want to open the configuration file to make changes, you can also set parameters directly from the command prompt, using the `postgres` command. For example:sql postgres -c log_connections=yes -c log_destination='syslog'
===== PAGE: https://docs.tigerdata.com/self-hosted/tooling/install-toolkit/ ===== # Install and update TimescaleDB Toolkit Some hyperfunctions are included by default in TimescaleDB. For additional hyperfunctions, you need to install the TimescaleDB Toolkit Postgres extension. If you're using [Tiger Cloud][cloud], the TimescaleDB Toolkit is already installed. If you're hosting the TimescaleDB extension on your self-hosted database, you can install Toolkit by: * Using the TimescaleDB high-availability Docker image * Using a package manager such as `yum`, `apt`, or `brew` on platforms where pre-built binaries are available * Building from source. For more information, see the [Toolkit developer documentation][toolkit-gh-docs] ## Prerequisites To follow this procedure: - [Install TimescaleDB][debian-install]. - Add the TimescaleDB repository and the GPG key. ## Install TimescaleDB Toolkit These instructions use the `apt` package manager. 1. Update your local repository list: ```bash sudo apt update ``` 1. Install TimescaleDB Toolkit: ```bash sudo apt install timescaledb-toolkit-postgresql-17 ``` 1. [Connect to the database][connect] where you want to use Toolkit. 1. Create the Toolkit extension in the database: ```sql CREATE EXTENSION timescaledb_toolkit; ``` ## Update TimescaleDB Toolkit Update Toolkit by installing the latest version and running `ALTER EXTENSION`. 1. Update your local repository list: ```bash apt update ``` 1. Install the latest version of TimescaleDB Toolkit: ```bash apt install timescaledb-toolkit-postgresql-17 ``` 1. [Connect to the database][connect] where you want to use the new version of Toolkit. 1. Update the Toolkit extension in the database: ```sql ALTER EXTENSION timescaledb_toolkit UPDATE; ``` For some Toolkit versions, you might need to disconnect and reconnect active sessions. ## Prerequisites To follow this procedure: - [Install TimescaleDB][debian-install]. - Add the TimescaleDB repository and the GPG key. ## Install TimescaleDB Toolkit These instructions use the `apt` package manager. 1. Update your local repository list: ```bash sudo apt update ``` 1. Install TimescaleDB Toolkit: ```bash sudo apt install timescaledb-toolkit-postgresql-17 ``` 1. [Connect to the database][connect] where you want to use Toolkit. 1. Create the Toolkit extension in the database: ```sql CREATE EXTENSION timescaledb_toolkit; ``` ## Update TimescaleDB Toolkit Update Toolkit by installing the latest version and running `ALTER EXTENSION`. 1. Update your local repository list: ```bash apt update ``` 1. Install the latest version of TimescaleDB Toolkit: ```bash apt install timescaledb-toolkit-postgresql-17 ``` 1. [Connect to the database][connect] where you want to use the new version of Toolkit. 1. Update the Toolkit extension in the database: ```sql ALTER EXTENSION timescaledb_toolkit UPDATE; ``` For some Toolkit versions, you might need to disconnect and reconnect active sessions. ## Prerequisites To follow this procedure: - [Install TimescaleDB][red-hat-install]. - Create a TimescaleDB repository in your `yum` `repo.d` directory. ## Install TimescaleDB Toolkit These instructions use the `yum` package manager. 1. Set up the repository: ```bash curl -s https://packagecloud.io/install/repositories/timescale/timescaledb/script.deb.sh | sudo bash ``` 1. Update your local repository list: ```bash yum update ``` 1. Install TimescaleDB Toolkit: ```bash yum install timescaledb-toolkit-postgresql-17 ``` 1. [Connect to the database][connect] where you want to use Toolkit. 1. Create the Toolkit extension in the database: ```sql CREATE EXTENSION timescaledb_toolkit; ``` ## Update TimescaleDB Toolkit Update Toolkit by installing the latest version and running `ALTER EXTENSION`. 1. Update your local repository list: ```bash yum update ``` 1. Install the latest version of TimescaleDB Toolkit: ```bash yum install timescaledb-toolkit-postgresql-17 ``` 1. [Connect to the database][connect] where you want to use the new version of Toolkit. 1. Update the Toolkit extension in the database: ```sql ALTER EXTENSION timescaledb_toolkit UPDATE; ``` For some Toolkit versions, you might need to disconnect and reconnect active sessions. ## Prerequisites To follow this procedure: - [Install TimescaleDB][red-hat-install]. - Create a TimescaleDB repository in your `yum` `repo.d` directory. ## Install TimescaleDB Toolkit These instructions use the `yum` package manager. 1. Set up the repository: ```bash curl -s https://packagecloud.io/install/repositories/timescale/timescaledb/script.deb.sh | sudo bash ``` 1. Update your local repository list: ```bash yum update ``` 1. Install TimescaleDB Toolkit: ```bash yum install timescaledb-toolkit-postgresql-17 ``` 1. [Connect to the database][connect] where you want to use Toolkit. 1. Create the Toolkit extension in the database: ```sql CREATE EXTENSION timescaledb_toolkit; ``` ## Update TimescaleDB Toolkit Update Toolkit by installing the latest version and running `ALTER EXTENSION`. 1. Update your local repository list: ```bash yum update ``` 1. Install the latest version of TimescaleDB Toolkit: ```bash yum install timescaledb-toolkit-postgresql-17 ``` 1. [Connect to the database][connect] where you want to use the new version of Toolkit. 1. Update the Toolkit extension in the database: ```sql ALTER EXTENSION timescaledb_toolkit UPDATE; ``` For some Toolkit versions, you might need to disconnect and reconnect active sessions. ## Install TimescaleDB Toolkit Best practice for Toolkit installation is to use the [TimescaleDB Docker image](https://github.com/timescale/timescaledb-docker-ha). To get Toolkit, use the high availability image, `timescaledb-ha`:bash docker pull timescale/timescaledb-ha:pg17
For more information on running TimescaleDB using Docker, see [Install TimescaleDB from a Docker container][docker-install]. ## Update TimescaleDB Toolkit To get the latest version of Toolkit, [update][update-docker] the TimescaleDB HA docker image. ## Prerequisites To follow this procedure: - [Install TimescaleDB][macos-install]. ## Install TimescaleDB Toolkit These instructions use the `brew` package manager. For more information on installing or using Homebrew, see [the `brew` homepage][brew-install]. 1. Tap the Tiger Data formula repository, which also contains formulae for TimescaleDB and `timescaledb-tune`. ```bash brew tap timescale/tap ``` 1. Update your local brew installation: ```bash brew update ``` 1. Install TimescaleDB Toolkit: ```bash brew install timescaledb-toolkit ``` 1. [Connect to the database][connect] where you want to use Toolkit. 1. Create the Toolkit extension in the database: ```sql CREATE EXTENSION timescaledb_toolkit; ``` ## Update TimescaleDB Toolkit Update Toolkit by installing the latest version and running `ALTER EXTENSION`. 1. Update your local repository list: ```bash brew update ``` 1. Install the latest version of TimescaleDB Toolkit: ```bash brew upgrade timescaledb-toolkit ``` 1. [Connect to the database][connect] where you want to use the new version of Toolkit. 1. Update the Toolkit extension in the database: ```sql ALTER EXTENSION timescaledb_toolkit UPDATE; ``` For some Toolkit versions, you might need to disconnect and reconnect active sessions. ===== PAGE: https://docs.tigerdata.com/self-hosted/tooling/about-timescaledb-tune/ ===== # About timescaledb-tune Get better performance by tuning your TimescaleDB database to match your system resources and Postgres version. `timescaledb-tune` is an open source command line tool that analyzes and adjusts your database settings. ## Install timescaledb-tune `timescaledb-tune` is packaged with binary releases of TimescaleDB. If you installed TimescaleDB from any binary release, including Docker, you already have access. For more install instructions, see the [GitHub repository][github-tstune]. ## Tune your database with timescaledb-tune Run `timescaledb-tune` from the command line. The tool analyzes your `postgresql.conf` file to provide recommendations for memory, parallelism, write-ahead log, and other settings. These changes are written to your `postgresql.conf`. They take effect on the next restart. 1. At the command line, run `timescaledb-tune`. To accept all recommendations automatically, include the `--yes` flag. ```bash timescaledb-tune ``` 1. If you didn't use the `--yes` flag, respond to each prompt to accept or reject the recommendations. 1. The changes are written to your `postgresql.conf`. For detailed instructions and other options, see the documentation in the [Github repository](https://github.com/timescale/timescaledb-tune). ===== PAGE: https://docs.tigerdata.com/self-hosted/install/installation-windows/ ===== # Install TimescaleDB on Windows TimescaleDB is a [Postgres extension](https://www.postgresql.org/docs/current/external-extensions.html) for time series and demanding workloads that ingest and query high volumes of data. This section shows you how to: * [Install and configure TimescaleDB on Postgres][install-timescaledb]: set up a self-hosted Postgres instance to efficiently run TimescaleDB. * [Add the TimescaleDB extension to your database][add-timescledb-extension]: enable TimescaleDB features and performance improvements on a database. The following instructions are for development and testing installations. For a production environment, we strongly recommend that you implement the following, many of which you can achieve using Postgres tooling: - Incremental backup and database snapshots, with efficient point-in-time recovery. - High availability replication, ideally with nodes across multiple availability zones. - Automatic failure detection with fast restarts, for both non-replicated and replicated deployments. - Asynchronous replicas for scaling reads when needed. - Connection poolers for scaling client connections. - Zero-down-time minor version and extension upgrades. - Forking workflows for major version upgrades and other feature testing. - Monitoring and observability. Deploying for production? With a Tiger Cloud service we tune your database for performance and handle scalability, high availability, backups, and management, so you can relax. ### Prerequisites To install TimescaleDB on your Windows device, you need: * OpenSSL v3.x For TimescaleDB v2.14.1 only, you need to install OpenSSL v1.1.1. * [Visual C++ Redistributable for Visual Studio 2015][ms-download] ## Install and configure TimescaleDB on Postgres This section shows you how to install the latest version of Postgres and TimescaleDB on a [supported platform][supported-platforms] using the packages supplied by Tiger Data. If you have previously installed Postgres without a package manager, you may encounter errors following these install instructions. Best practice is to full remove any existing Postgres installations before you begin. To keep your current Postgres installation, [Install from source][install-from-source]. 1. **Install the latest version of Postgres and psql** 1. Download [Postgres][pg-download], then run the installer. 1. In the `Select Components` dialog, check `Command Line Tools`, along with any other components you want to install, and click `Next`. 1. Complete the installation wizard. 1. Check that you can run `pg_config`. If you cannot run `pg_config` from the command line, in the Windows Search tool, enter `system environment variables`. The path should be `C:\Program Files\PostgreSQL\<version>\bin`. 1. **Install TimescaleDB** 1. Unzip the [TimescaleDB installer][supported-platforms] to `<install_dir>`, that is, your selected directory. Best practice is to use the latest version. 1. In `<install_dir>\timescaledb`, right-click `setup.exe`, then choose `Run as Administrator`. 1. Complete the installation wizard. If you see an error like `could not load library "C:/Program Files/PostgreSQL/17/lib/timescaledb-2.17.2.dll": The specified module could not be found.`, use [Dependencies][dependencies] to ensure that your system can find the compatible DLLs for this release of TimescaleDB. 1. **Tune your Postgres instance for TimescaleDB** Run the `timescaledb-tune` script included in the `timescaledb-tools` package with TimescaleDB. For more information, see [configuration][config]. 1. **Log in to Postgres as `postgres`** ```bash sudo -u postgres psql ``` You are in the psql shell. 1. **Set the password for `postgres`** ```bash \password postgres ``` When you have set the password, type `\q` to exit psql. ## Add the TimescaleDB extension to your database For improved performance, you enable TimescaleDB on each database on your self-hosted Postgres instance. This section shows you how to enable TimescaleDB for a new database in Postgres using `psql` from the command line. <Procedure > 1. **Connect to a database on your Postgres instance** In Postgres, the default user and database are both `postgres`. To use a different database, set `<database-name>` to the name of that database:bash psql -d "postgres://:@:/"
1. **Add TimescaleDB to the database** ```sql CREATE EXTENSION IF NOT EXISTS timescaledb; ``` 1. **Check that TimescaleDB is installed** ```sql \dx ``` You see the list of installed extensions: ```sql List of installed extensions Name | Version | Schema | Description -------------+---------+------------+--------------------------------------------------------------------------------------- plpgsql | 1.0 | pg_catalog | PL/pgSQL procedural language timescaledb | 2.17.2 | public | Enables scalable inserts and complex queries for time-series data (Community Edition) ``` Press q to exit the list of extensions. And that is it! You have TimescaleDB running on a database on a self-hosted instance of Postgres. ## Supported platforms The latest TimescaleDB releases for Postgres are: * [Postgres 17: TimescaleDB release](https://github.com/timescale/timescaledb/releases/download/2.21.2/timescaledb-postgresql-17-windows-amd64.zip) * [Postgres 16: TimescaleDB release](https://github.com/timescale/timescaledb/releases/download/2.21.2/timescaledb-postgresql-16-windows-amd64.zip) * [Postgres 15: TimescaleDB release](https://github.com/timescale/timescaledb/releases/download/2.21.2/timescaledb-postgresql-15-windows-amd64.zip) You can deploy TimescaleDB on the following systems: | Operation system | Version | |---------------------------------------------|------------| | Microsoft Windows | 10, 11 | | Microsoft Windows Server | 2019, 2020 | For release information, see the [GitHub releases page][gh-releases] and the [release notes][release-notes]. ## Where to next What next? [Try the key features offered by Tiger Data][try-timescale-features], see the [tutorials][tutorials], interact with the data in your Tiger Cloud service using [your favorite programming language][connect-with-code], integrate your Tiger Cloud service with a range of [third-party tools][integrations], plain old [Use Tiger Data products][use-timescale], or dive into the [API reference][use-the-api]. ===== PAGE: https://docs.tigerdata.com/self-hosted/install/installation-cloud-image/ ===== # Install TimescaleDB from cloud image You can install TimescaleDB on a cloud hosting provider, from a pre-built, publicly available machine image. These instructions show you how to use a pre-built Amazon machine image (AMI), on Amazon Web Services (AWS). The currently available pre-built cloud image is: * Ubuntu 20.04 Amazon EBS-backed AMI The TimescaleDB AMI uses Elastic Block Store (EBS) attached volumes. This allows you to store image snapshots, dynamic IOPS configuration, and provides some protection of your data if the EC2 instance goes down. Choose an EC2 instance type that is optimized for EBS attached volumes. For information on choosing the right EBS optimized EC2 instance type, see the AWS [instance configuration documentation][aws-instance-config]. This section shows how to use the AMI from within the AWS EC2 dashboard. However, you can also use the AMI to build an instance using tools like Cloudformation, Terraform, the AWS CLI, or any other AWS deployment tool that supports public AMIs. ## Installing TimescaleDB from a pre-build cloud image 1. Make sure you have an [Amazon Web Services account][aws-signup], and are signed in to [your EC2 dashboard][aws-dashboard]. 1. Navigate to `Images → AMIs`. 1. In the search bar, change the search to `Public images` and type _Timescale_ search term to find all available TimescaleDB images. 1. Select the image you want to use, and click `Launch instance from image`. <img class="main-content__illustration" width={1375} height={944} src="https://assets.timescale.com/docs/images/aws_launch_ami.webp" alt="Launch an AMI in AWS EC2"/> After you have completed the installation, connect to your instance and configure your database. For information about connecting to the instance, see the AWS [accessing instance documentation][aws-connect]. The easiest way to configure your database is to run the `timescaledb-tune` script, which is included with the `timescaledb-tools` package. For more information, see the [configuration][config] section. After running the `timescaledb-tune` script, you need to restart the Postgres service for the configuration changes to take effect. To restart the service, run `sudo systemctl restart postgresql.service`. ## Set up the TimescaleDB extension When you have Postgres and TimescaleDB installed, connect to your instance and set up the TimescaleDB extension. 1. On your instance, at the command prompt, connect to the Postgres instance as the `postgres` superuser: ```bash sudo -u postgres psql ``` 1. At the prompt, create an empty database. For example, to create a database called `tsdb`: ```sql CREATE database tsdb; ``` 1. Connect to the database you created: ```sql \c tsdb ``` 1. Add the TimescaleDB extension: ```sql CREATE EXTENSION IF NOT EXISTS timescaledb; ``` You can check that the TimescaleDB extension is installed by using the `\dx` command at the command prompt. It looks like this:sql tsdb=# \dx
List of installed extensions Name | Version | Schema | Description-------------+---------+------------+------------------------------------------------------------------- plpgsql | 1.0 | pg_catalog | PL/pgSQL procedural language timescaledb | 2.1.1 | public | Enables scalable inserts and complex queries for time-series data (2 rows)
(END)
## Where to next What next? [Try the key features offered by Tiger Data][try-timescale-features], see the [tutorials][tutorials], interact with the data in your Tiger Cloud service using [your favorite programming language][connect-with-code], integrate your Tiger Cloud service with a range of [third-party tools][integrations], plain old [Use Tiger Data products][use-timescale], or dive into the [API reference][use-the-api]. ===== PAGE: https://docs.tigerdata.com/self-hosted/install/installation-macos/ ===== # Install TimescaleDB on macOS TimescaleDB is a [Postgres extension](https://www.postgresql.org/docs/current/external-extensions.html) for time series and demanding workloads that ingest and query high volumes of data. You can host TimescaleDB on macOS device. This section shows you how to: * [Install and configure TimescaleDB on Postgres](#install-and-configure-timescaledb-on-postgresql) - set up a self-hosted Postgres instance to efficiently run TimescaleDB. * [Add the TimescaleDB extension to your database](#add-the-timescaledb-extension-to-your-database) - enable TimescaleDB features and performance improvements on a database. The following instructions are for development and testing installations. For a production environment, we strongly recommend that you implement the following, many of which you can achieve using Postgres tooling: - Incremental backup and database snapshots, with efficient point-in-time recovery. - High availability replication, ideally with nodes across multiple availability zones. - Automatic failure detection with fast restarts, for both non-replicated and replicated deployments. - Asynchronous replicas for scaling reads when needed. - Connection poolers for scaling client connections. - Zero-down-time minor version and extension upgrades. - Forking workflows for major version upgrades and other feature testing. - Monitoring and observability. Deploying for production? With a Tiger Cloud service we tune your database for performance and handle scalability, high availability, backups, and management, so you can relax. ### Prerequisites To install TimescaleDB on your MacOS device, you need: * [Postgres][install-postgresql]: for the latest functionality, install Postgres v16 If you have already installed Postgres using a method other than Homebrew or MacPorts, you may encounter errors following these install instructions. Best practice is to full remove any existing Postgres installations before you begin. To keep your current Postgres installation, [Install from source][install-from-source]. ## Install and configure TimescaleDB on Postgres This section shows you how to install the latest version of Postgres and TimescaleDB on a [supported platform](#supported-platforms) using the packages supplied by Tiger Data. 1. Install Homebrew, if you don't already have it: ```bash /bin/bash -c "$(curl -fsSL https://raw.githubusercontent.com/Homebrew/install/HEAD/install.sh)" ``` For more information about Homebrew, including installation instructions, see the [Homebrew documentation][homebrew]. 1. At the command prompt, add the TimescaleDB Homebrew tap: ```bash brew tap timescale/tap ``` 1. Install TimescaleDB and psql: ```bash brew install timescaledb libpq ``` 1. Update your path to include psql. ```bash brew link --force libpq ``` On Intel chips, the symbolic link is added to `/usr/local/bin`. On Apple Silicon, the symbolic link is added to `/opt/homebrew/bin`. 1. Run the `timescaledb-tune` script to configure your database:bash timescaledb-tune --quiet --yes
1. Change to the directory where the setup script is located. It is typically, located at `/opt/homebrew/Cellar/timescaledb/<VERSION>/bin/`, where `<VERSION>` is the version of `timescaledb` that you installed:bash cd /opt/homebrew/Cellar/timescaledb//bin/
1. Run the setup script to complete installation. ```bash ./timescaledb_move.sh ``` 1. **Log in to Postgres as `postgres`** ```bash sudo -u postgres psql ``` You are in the psql shell. 1. **Set the password for `postgres`** ```bash \password postgres ``` When you have set the password, type `\q` to exit psql. 1. Install MacPorts by downloading and running the package installer. For more information about MacPorts, including installation instructions, see the [MacPorts documentation][macports]. 1. Install TimescaleDB and psql: ```bash sudo port install timescaledb libpqxx ``` To view the files installed, run: ```bash port contents timescaledb libpqxx ``` MacPorts does not install the `timescaledb-tools` package or run the `timescaledb-tune` script. For more information about tuning your database, see the [TimescaleDB tuning tool][timescale-tuner]. 1. **Log in to Postgres as `postgres`** ```bash sudo -u postgres psql ``` You are in the psql shell. 1. **Set the password for `postgres`** ```bash \password postgres ``` When you have set the password, type `\q` to exit psql. ## Add the TimescaleDB extension to your database For improved performance, you enable TimescaleDB on each database on your self-hosted Postgres instance. This section shows you how to enable TimescaleDB for a new database in Postgres using `psql` from the command line. <Procedure > 1. **Connect to a database on your Postgres instance** In Postgres, the default user and database are both `postgres`. To use a different database, set `<database-name>` to the name of that database:bash psql -d "postgres://:@:/"
1. **Add TimescaleDB to the database** ```sql CREATE EXTENSION IF NOT EXISTS timescaledb; ``` 1. **Check that TimescaleDB is installed** ```sql \dx ``` You see the list of installed extensions: ```sql List of installed extensions Name | Version | Schema | Description -------------+---------+------------+--------------------------------------------------------------------------------------- plpgsql | 1.0 | pg_catalog | PL/pgSQL procedural language timescaledb | 2.17.2 | public | Enables scalable inserts and complex queries for time-series data (Community Edition) ``` Press q to exit the list of extensions. And that is it! You have TimescaleDB running on a database on a self-hosted instance of Postgres. ## Supported platforms You can deploy TimescaleDB on the following systems: | Operation system | Version | |-------------------------------|----------------------------------| | macOS | From 10.15 Catalina to 14 Sonoma | For the latest functionality, install MacOS 14 Sonoma. ## Where to next What next? [Try the key features offered by Tiger Data][try-timescale-features], see the [tutorials][tutorials], interact with the data in your Tiger Cloud service using [your favorite programming language][connect-with-code], integrate your Tiger Cloud service with a range of [third-party tools][integrations], plain old [Use Tiger Data products][use-timescale], or dive into the [API reference][use-the-api]. ===== PAGE: https://docs.tigerdata.com/self-hosted/install/installation-kubernetes/ ===== # Install TimescaleDB on Kubernetes You can run TimescaleDB inside Kubernetes using the TimescaleDB Docker container images. The following instructions are for development and testing installations. For a production environment, we strongly recommend that you implement the following, many of which you can achieve using Postgres tooling: - Incremental backup and database snapshots, with efficient point-in-time recovery. - High availability replication, ideally with nodes across multiple availability zones. - Automatic failure detection with fast restarts, for both non-replicated and replicated deployments. - Asynchronous replicas for scaling reads when needed. - Connection poolers for scaling client connections. - Zero-down-time minor version and extension upgrades. - Forking workflows for major version upgrades and other feature testing. - Monitoring and observability. Deploying for production? With a Tiger Cloud service we tune your database for performance and handle scalability, high availability, backups, and management, so you can relax. ## Prerequisites To follow the steps on this page: - Install [self-managed Kubernetes][kubernetes-install] or sign up for a Kubernetes [Turnkey Cloud Solution][kubernetes-managed]. - Install [kubectl][kubectl] for command-line interaction with your cluster. ## Integrate TimescaleDB in a Kubernetes cluster Running TimescaleDB on Kubernetes is similar to running Postgres. This procedure outlines the steps for a non-distributed system. To connect your Kubernetes cluster to self-hosted TimescaleDB running in the cluster: 1. **Create a default namespace for Tiger Data components** 1. Create the Tiger Data namespace: ```shell kubectl create namespace timescale ``` 1. Set this namespace as the default for your session: ```shell kubectl config set-context --current --namespace=timescale ``` For more information, see [Kubernetes Namespaces][kubernetes-namespace]. 1. **Set up a persistent volume claim (PVC) storage** To manually set up a persistent volume and claim for self-hosted Kubernetes, run the following command:yaml kubectl apply -f - <<EOF apiVersion: v1 kind: PersistentVolumeClaim metadata:
name: timescale-pvcspec:
accessModes: - ReadWriteOnce resources: requests: storage: 10GiEOF
1. **Deploy TimescaleDB as a StatefulSet** By default, the [TimescaleDB Docker image][timescale-docker-image] you are installing on Kubernetes uses the default Postgres database, user and password. To deploy TimescaleDB on Kubernetes, run the following command: ```yaml kubectl apply -f - <<EOF apiVersion: apps/v1 kind: StatefulSet metadata: name: timescaledb spec: serviceName: timescaledb replicas: 1 selector: matchLabels: app: timescaledb template: metadata: labels: app: timescaledb spec: containers: - name: timescaledb image: 'timescale/timescaledb:latest-pg17' env: - name: POSTGRES_USER value: postgres - name: POSTGRES_PASSWORD value: postgres - name: POSTGRES_DB value: postgres - name: PGDATA value: /var/lib/postgresql/data/pgdata ports: - containerPort: 5432 volumeMounts: - mountPath: /var/lib/postgresql/data name: timescale-storage volumes: - name: timescale-storage persistentVolumeClaim: claimName: timescale-pvc EOF ``` 1. **Allow applications to connect by exposing TimescaleDB within Kubernetes**yaml kubectl apply -f - <<EOF apiVersion: v1 kind: Service metadata:
name: timescaledbspec:
selector: app: timescaledb ports: - protocol: TCP port: 5432 targetPort: 5432 type: ClusterIPEOF
1. **Create a Kubernetes secret to store the database credentials**shell kubectl create secret generic timescale-secret \ --from-literal=PGHOST=timescaledb \ --from-literal=PGPORT=5432 \ --from-literal=PGDATABASE=postgres \ --from-literal=PGUSER=postgres \ --from-literal=PGPASSWORD=postgres
1. **Deploy an application that connects to TimescaleDB** ```shell kubectl apply -f - <<EOF apiVersion: apps/v1 kind: Deployment metadata: name: timescale-app spec: replicas: 1 selector: matchLabels: app: timescale-app template: metadata: labels: app: timescale-app spec: containers: - name: timescale-container image: postgres:latest envFrom: - secretRef: name: timescale-secret EOF ``` 1. **Test the database connection** 1. Create and run a pod to verify database connectivity using your [connection details][connection-info] saved in `timescale-secret`: ```shell kubectl run test-pod --image=postgres --restart=Never \ --env="PGHOST=$(kubectl get secret timescale-secret -o=jsonpath='{.data.PGHOST}' | base64 --decode)" \ --env="PGPORT=$(kubectl get secret timescale-secret -o=jsonpath='{.data.PGPORT}' | base64 --decode)" \ --env="PGDATABASE=$(kubectl get secret timescale-secret -o=jsonpath='{.data.PGDATABASE}' | base64 --decode)" \ --env="PGUSER=$(kubectl get secret timescale-secret -o=jsonpath='{.data.PGUSER}' | base64 --decode)" \ --env="PGPASSWORD=$(kubectl get secret timescale-secret -o=jsonpath='{.data.PGPASSWORD}' | base64 --decode)" \ -- sleep infinity ``` 1. Launch the Postgres interactive shell within the created `test-pod`: ```shell kubectl exec -it test-pod -- bash -c "psql -h \$PGHOST -U \$PGUSER -d \$PGDATABASE" ``` You see the Postgres interactive terminal. ## Install with Postgres Kubernetes operators You can also use Postgres Kubernetes operators to simplify installation, configuration, and life cycle. The operators which our community members have told us work well are: - [StackGres][stackgres] (includes TimescaleDB images) - [Postgres Operator (Patroni)][patroni] - [PGO][pgo] - [CloudNativePG][cnpg] ===== PAGE: https://docs.tigerdata.com/self-hosted/install/installation-source/ ===== # Install TimescaleDB from source TimescaleDB is a [Postgres extension](https://www.postgresql.org/docs/current/external-extensions.html) for time series and demanding workloads that ingest and query high volumes of data. You can install a TimescaleDB instance on any local system, from source. This section shows you how to: * [Install and configure TimescaleDB on Postgres](#install-and-configure-timescaledb-on-postgres) - set up a self-hosted Postgres instance to efficiently run TimescaleDB1. * [Add the TimescaleDB extension to your database](#add-the-timescaledb-extension-to-your-database) - enable TimescaleDB features and performance improvements on a database. The following instructions are for development and testing installations. For a production environment, we strongly recommend that you implement the following, many of which you can achieve using Postgres tooling: - Incremental backup and database snapshots, with efficient point-in-time recovery. - High availability replication, ideally with nodes across multiple availability zones. - Automatic failure detection with fast restarts, for both non-replicated and replicated deployments. - Asynchronous replicas for scaling reads when needed. - Connection poolers for scaling client connections. - Zero-down-time minor version and extension upgrades. - Forking workflows for major version upgrades and other feature testing. - Monitoring and observability. Deploying for production? With a Tiger Cloud service we tune your database for performance and handle scalability, high availability, backups, and management, so you can relax. ### Prerequisites To install TimescaleDB from source, you need the following on your developer environment: * **Postgres**: Install a [supported version of Postgres][compatibility-matrix] using the [Postgres installation instructions][postgres-download]. We recommend not using TimescaleDB with Postgres 17.1, 16.5, 15.9, 14.14, 13.17, 12.21. These minor versions [introduced a breaking binary interface change][postgres-breaking-change] that, once identified, was reverted in subsequent minor Postgres versions 17.2, 16.6, 15.10, 14.15, 13.18, and 12.22. When you build from source, best practice is to build with Postgres 17.2, 16.6, etc and higher. Users of [Tiger Cloud](https://console.cloud.timescale.com/) and Platform packages built and distributed by Tiger Data are unaffected. * **Build tools**: * [CMake version 3.11 or later][cmake-download] * C language compiler for your operating system, such as `gcc` or `clang`. If you are using a Microsoft Windows system, you can install Visual Studio 2015 or later instead of CMake and a C language compiler. Ensure you install the Visual Studio components for CMake and Git when you run the installer. ## Install and configure TimescaleDB on Postgres This section shows you how to install the latest version of Postgres and TimescaleDB on a supported platform using source supplied by Tiger Data. 1. **Install the latest Postgres source** 1. At the command prompt, clone the TimescaleDB GitHub repository: ```bash git clone https://github.com/timescale/timescaledb ``` 1. Change into the cloned directory: ```bash cd timescaledb ``` 1. Checkout the latest release. You can find the latest release tag on our [Releases page][gh-releases]: ```bash git checkout 2.17.2 ``` This command produces an error that you are now in `detached head` state. It is expected behavior, and it occurs because you have checked out a tag, and not a branch. Continue with the steps in this procedure as normal. 1. **Build the source** 1. Bootstrap the build system: <Terminal persistKey="os"> ```bash ./bootstrap ``` ```powershell bootstrap.bat ``` </Terminal> For installation on Microsoft Windows, you might need to add the `pg_config` and `cmake` file locations to your path. In the Windows Search tool, search for `system environment variables`. The path for `pg_config` should be `C:\Program Files\PostgreSQL\<version>\bin`. The path for `cmake` is within the Visual Studio directory. 1. Build the extension: <Terminal persistKey="os"> ```bash cd build && make ``` ```powershell cmake --build ./build --config Release ``` </Terminal> 1. **Install TimescaleDB** <Terminal persistKey="os"> ```bash make install ``` ```powershell cmake --build ./build --config Release --target install ``` </Terminal> 1. **Configure Postgres** If you have more than one version of Postgres installed, TimescaleDB can only be associated with one of them. The TimescaleDB build scripts use `pg_config` to find out where Postgres stores its extension files, so you can use `pg_config` to find out which Postgres installation TimescaleDB is using. 1. Locate the `postgresql.conf` configuration file: ```bash psql -d postgres -c "SHOW config_file;" ``` 1. Open the `postgresql.conf` file and update `shared_preload_libraries` to: ```bash shared_preload_libraries = 'timescaledb' ``` If you use other preloaded libraries, make sure they are comma separated. 1. Tune your Postgres instance for TimescaleDB ```bash sudo timescaledb-tune ``` This script is included with the `timescaledb-tools` package when you install TimescaleDB. For more information, see [configuration][config]. 1. Restart the Postgres instance: <Terminal persistKey="os"> ```bash service postgresql restart ``` ```powershell pg_ctl restart ``` </Terminal> 1. **Set the user password** 1. Log in to Postgres as `postgres` ```bash sudo -u postgres psql ``` You are in the psql shell. 1. Set the password for `postgres` ```bash \password postgres ``` When you have set the password, type `\q` to exit psql. ## Add the TimescaleDB extension to your database For improved performance, you enable TimescaleDB on each database on your self-hosted Postgres instance. This section shows you how to enable TimescaleDB for a new database in Postgres using `psql` from the command line. <Procedure > 1. **Connect to a database on your Postgres instance** In Postgres, the default user and database are both `postgres`. To use a different database, set `<database-name>` to the name of that database:bash psql -d "postgres://:@:/"
1. **Add TimescaleDB to the database** ```sql CREATE EXTENSION IF NOT EXISTS timescaledb; ``` 1. **Check that TimescaleDB is installed** ```sql \dx ``` You see the list of installed extensions: ```sql List of installed extensions Name | Version | Schema | Description -------------+---------+------------+--------------------------------------------------------------------------------------- plpgsql | 1.0 | pg_catalog | PL/pgSQL procedural language timescaledb | 2.17.2 | public | Enables scalable inserts and complex queries for time-series data (Community Edition) ``` Press q to exit the list of extensions. And that is it! You have TimescaleDB running on a database on a self-hosted instance of Postgres. ## Where to next What next? [Try the key features offered by Tiger Data][try-timescale-features], see the [tutorials][tutorials], interact with the data in your Tiger Cloud service using [your favorite programming language][connect-with-code], integrate your Tiger Cloud service with a range of [third-party tools][integrations], plain old [Use Tiger Data products][use-timescale], or dive into the [API reference][use-the-api]. ===== PAGE: https://docs.tigerdata.com/self-hosted/install/installation-linux/ ===== # Install TimescaleDB on Linux TimescaleDB is a [Postgres extension](https://www.postgresql.org/docs/current/external-extensions.html) for time series and demanding workloads that ingest and query high volumes of data. This section shows you how to: * [Install and configure TimescaleDB on Postgres](#install-and-configure-timescaledb-on-postgresql) - set up a self-hosted Postgres instance to efficiently run TimescaleDB. * [Add the TimescaleDB extension to your database](#add-the-timescaledb-extension-to-your-database) - enable TimescaleDB features and performance improvements on a database. The following instructions are for development and testing installations. For a production environment, we strongly recommend that you implement the following, many of which you can achieve using Postgres tooling: - Incremental backup and database snapshots, with efficient point-in-time recovery. - High availability replication, ideally with nodes across multiple availability zones. - Automatic failure detection with fast restarts, for both non-replicated and replicated deployments. - Asynchronous replicas for scaling reads when needed. - Connection poolers for scaling client connections. - Zero-down-time minor version and extension upgrades. - Forking workflows for major version upgrades and other feature testing. - Monitoring and observability. Deploying for production? With a Tiger Cloud service we tune your database for performance and handle scalability, high availability, backups, and management, so you can relax. ## Install and configure TimescaleDB on Postgres This section shows you how to install the latest version of Postgres and TimescaleDB on a [supported platform](#supported-platforms) using the packages supplied by Tiger Data. If you have previously installed Postgres without a package manager, you may encounter errors following these install instructions. Best practice is to fully remove any existing Postgres installations before you begin. To keep your current Postgres installation, [Install from source][install-from-source]. 1. **Install the latest Postgres packages** ```bash sudo apt install gnupg postgresql-common apt-transport-https lsb-release wget ``` 1. **Run the Postgres package setup script** ```bash sudo /usr/share/postgresql-common/pgdg/apt.postgresql.org.sh ``` 1. **Add the TimescaleDB package** ```bash echo "deb https://packagecloud.io/timescale/timescaledb/debian/ $(lsb_release -c -s) main" | sudo tee /etc/apt/sources.list.d/timescaledb.list ``` 1. **Install the TimescaleDB GPG key** ```bash wget --quiet -O - https://packagecloud.io/timescale/timescaledb/gpgkey | sudo gpg --dearmor -o /etc/apt/trusted.gpg.d/timescaledb.gpg ``` 1. **Update your local repository list** ```bash sudo apt update ``` 1. **Install TimescaleDB** ```bash sudo apt install timescaledb-2-postgresql-17 postgresql-client-17 ``` To install a specific TimescaleDB [release][releases-page], set the version. For example: `sudo apt-get install timescaledb-2-postgresql-14='2.6.0*' timescaledb-2-loader-postgresql-14='2.6.0*'` Older versions of TimescaleDB may not support all the OS versions listed on this page. 1. **Tune your Postgres instance for TimescaleDB** ```bash sudo timescaledb-tune ``` By default, this script is included with the `timescaledb-tools` package when you install TimescaleDB. Use the prompts to tune your development or production environment. For more information on manual configuration, see [Configuration][config]. If you have an issue, run `sudo apt install timescaledb-tools`. 1. **Restart Postgres** ```bash sudo systemctl restart postgresql ``` 1. **Log in to Postgres as `postgres`** ```bash sudo -u postgres psql ``` You are in the psql shell. 1. **Set the password for `postgres`** ```bash \password postgres ``` When you have set the password, type `\q` to exit psql. 1. **Install the latest Postgres packages** ```bash sudo apt install gnupg postgresql-common apt-transport-https lsb-release wget ``` 1. **Run the Postgres package setup script** ```bash sudo /usr/share/postgresql-common/pgdg/apt.postgresql.org.sh ``` ```bash echo "deb https://packagecloud.io/timescale/timescaledb/ubuntu/ $(lsb_release -c -s) main" | sudo tee /etc/apt/sources.list.d/timescaledb.list ``` 1. **Install the TimescaleDB GPG key** ```bash wget --quiet -O - https://packagecloud.io/timescale/timescaledb/gpgkey | sudo gpg --dearmor -o /etc/apt/trusted.gpg.d/timescaledb.gpg ``` For Ubuntu 21.10 and earlier use the following command: `wget --quiet -O - https://packagecloud.io/timescale/timescaledb/gpgkey | sudo apt-key add -` 1. **Update your local repository list** ```bash sudo apt update ``` 1. **Install TimescaleDB** ```bash sudo apt install timescaledb-2-postgresql-17 postgresql-client-17 ``` To install a specific TimescaleDB [release][releases-page], set the version. For example: `sudo apt-get install timescaledb-2-postgresql-14='2.6.0*' timescaledb-2-loader-postgresql-14='2.6.0*'` Older versions of TimescaleDB may not support all the OS versions listed on this page. 1. **Tune your Postgres instance for TimescaleDB** ```bash sudo timescaledb-tune ``` By default, this script is included with the `timescaledb-tools` package when you install TimescaleDB. Use the prompts to tune your development or production environment. For more information on manual configuration, see [Configuration][config]. If you have an issue, run `sudo apt install timescaledb-tools`. 1. **Restart Postgres** ```bash sudo systemctl restart postgresql ``` 1. **Log in to Postgres as `postgres`** ```bash sudo -u postgres psql ``` You are in the psql shell. 1. **Set the password for `postgres`** ```bash \password postgres ``` When you have set the password, type `\q` to exit psql. 1. **Install the latest Postgres packages** ```bash sudo yum install https://download.postgresql.org/pub/repos/yum/reporpms/EL-$(rpm -E %{rhel})-x86_64/pgdg-redhat-repo-latest.noarch.rpm ``` 1. **Add the TimescaleDB repository** ```bash sudo tee /etc/yum.repos.d/timescale_timescaledb.repo <<EOL [timescale_timescaledb] name=timescale_timescaledb baseurl=https://packagecloud.io/timescale/timescaledb/el/$(rpm -E %{rhel})/\$basearch repo_gpgcheck=1 gpgcheck=0 enabled=1 gpgkey=https://packagecloud.io/timescale/timescaledb/gpgkey sslverify=1 sslcacert=/etc/pki/tls/certs/ca-bundle.crt metadata_expire=300 EOL ``` 1. **Update your local repository list** ```bash sudo yum update ``` 1. **Install TimescaleDB** To avoid errors, **do not** install TimescaleDB Apache 2 Edition and TimescaleDB Community Edition at the same time. ```bash sudo yum install timescaledb-2-postgresql-17 postgresql17 ``` <!-- hack until we have bandwidth to rewrite this linting rule --> <!-- markdownlint-disable TS007 --> On Red Hat Enterprise Linux 8 and later, disable the built-in Postgres module: `sudo dnf -qy module disable postgresql` <!-- markdownlint-enable TS007 --> 1. **Initialize the Postgres instance** ```bash sudo /usr/pgsql-17/bin/postgresql-17-setup initdb ``` 1. **Tune your Postgres instance for TimescaleDB** ```bash sudo timescaledb-tune --pg-config=/usr/pgsql-17/bin/pg_config ``` This script is included with the `timescaledb-tools` package when you install TimescaleDB. For more information, see [configuration][config]. 1. **Enable and start Postgres** ```bash sudo systemctl enable postgresql-17 sudo systemctl start postgresql-17 ``` 1. **Log in to Postgres as `postgres`** ```bash sudo -u postgres psql ``` You are now in the psql shell. 1. **Set the password for `postgres`** ```bash \password postgres ``` When you have set the password, type `\q` to exit psql. 1. **Install the latest Postgres packages** ```bash sudo yum install https://download.postgresql.org/pub/repos/yum/reporpms/F-$(rpm -E %{fedora})-x86_64/pgdg-fedora-repo-latest.noarch.rpm ``` 1. **Add the TimescaleDB repository** ```bash sudo tee /etc/yum.repos.d/timescale_timescaledb.repo <<EOL [timescale_timescaledb] name=timescale_timescaledb baseurl=https://packagecloud.io/timescale/timescaledb/el/9/\$basearch repo_gpgcheck=1 gpgcheck=0 enabled=1 gpgkey=https://packagecloud.io/timescale/timescaledb/gpgkey sslverify=1 sslcacert=/etc/pki/tls/certs/ca-bundle.crt metadata_expire=300 EOL ``` 1. **Update your local repository list** ```bash sudo yum update ``` 1. **Install TimescaleDB** To avoid errors, **do not** install TimescaleDB Apache 2 Edition and TimescaleDB Community Edition at the same time. ```bash sudo yum install timescaledb-2-postgresql-17 postgresql17 ``` <!-- hack until we have bandwidth to rewrite this linting rule --> <!-- markdownlint-disable TS007 --> On Red Hat Enterprise Linux 8 and later, disable the built-in Postgres module: `sudo dnf -qy module disable postgresql` <!-- markdownlint-enable TS007 --> 1. **Initialize the Postgres instance** ```bash sudo /usr/pgsql-17/bin/postgresql-17-setup initdb ``` 1. **Tune your Postgres instance for TimescaleDB** ```bash sudo timescaledb-tune --pg-config=/usr/pgsql-17/bin/pg_config ``` This script is included with the `timescaledb-tools` package when you install TimescaleDB. For more information, see [configuration][config]. 1. **Enable and start Postgres** ```bash sudo systemctl enable postgresql-17 sudo systemctl start postgresql-17 ``` 1. **Log in to Postgres as `postgres`** ```bash sudo -u postgres psql ``` You are now in the psql shell. 1. **Set the password for `postgres`** ```bash \password postgres ``` When you have set the password, type `\q` to exit psql. Tiger Data supports Rocky Linux 8 and 9 on amd64 only. 1. **Update your local repository list** ```bash sudo dnf update -y sudo dnf install -y epel-release ``` 1. **Install the latest Postgres packages** ```bash sudo dnf install -y https://download.postgresql.org/pub/repos/yum/reporpms/EL-9-x86_64/pgdg-redhat-repo-latest.noarch.rpm ``` 1. **Add the TimescaleDB repository** ```bash sudo tee /etc/yum.repos.d/timescale_timescaledb.repo <<EOL [timescale_timescaledb] name=timescale_timescaledb baseurl=https://packagecloud.io/timescale/timescaledb/el/9/\$basearch repo_gpgcheck=1 gpgcheck=0 enabled=1 gpgkey=https://packagecloud.io/timescale/timescaledb/gpgkey sslverify=1 sslcacert=/etc/pki/tls/certs/ca-bundle.crt metadata_expire=300 EOL ``` 1. **Disable the built-in PostgreSQL module** This is for Rocky Linux 9 only. ```bash sudo dnf module disable postgresql -y ``` 1. **Install TimescaleDB** To avoid errors, **do not** install TimescaleDB Apache 2 Edition and TimescaleDB Community Edition at the same time. ```bash sudo dnf install -y postgresql16-server postgresql16-contrib timescaledb-2-postgresql-16 ``` 1. **Initialize the Postgres instance** ```bash sudo /usr/pgsql-16/bin/postgresql-16-setup initdb ``` 1. **Tune your Postgres instance for TimescaleDB** ```bash sudo timescaledb-tune --pg-config=/usr/pgsql-16/bin/pg_config ``` This script is included with the `timescaledb-tools` package when you install TimescaleDB. For more information, see [configuration][config]. 1. **Enable and start Postgres** ```bash sudo systemctl enable postgresql-16 sudo systemctl start postgresql-16 ``` 1. **Log in to Postgres as `postgres`** ```bash sudo -u postgres psql ``` You are now in the psql shell. 1. **Set the password for `postgres`** ```bash \password postgres ``` When you have set the password, type `\q` to exit psql. ArchLinux packages are built by the community. 1. **Install the latest Postgres and TimescaleDB packages** ```bash sudo pacman -Syu timescaledb timescaledb-tune postgresql-libs ``` 1. **Initalize your Postgres instance** ```bash sudo -u postgres initdb --locale=en_US.UTF-8 --encoding=UTF8 -D /var/lib/postgres/data --data-checksums ``` 1. **Tune your Postgres instance for TimescaleDB** ```bash sudo timescaledb-tune ``` This script is included with the `timescaledb-tools` package when you install TimescaleDB. For more information, see [configuration][config]. 1. **Enable and start Postgres** ```bash sudo systemctl enable postgresql.service sudo systemctl start postgresql.service ``` 1. **Log in to Postgres as `postgres`** ```bash sudo -u postgres psql ``` You are in the psql shell. 1. **Set the password for `postgres`** ```bash \password postgres ``` When you have set the password, type `\q` to exit psql. Job jobbed, you have installed Postgres and TimescaleDB. ## Add the TimescaleDB extension to your database For improved performance, you enable TimescaleDB on each database on your self-hosted Postgres instance. This section shows you how to enable TimescaleDB for a new database in Postgres using `psql` from the command line. <Procedure > 1. **Connect to a database on your Postgres instance** In Postgres, the default user and database are both `postgres`. To use a different database, set `<database-name>` to the name of that database:bash psql -d "postgres://:@:/"
1. **Add TimescaleDB to the database** ```sql CREATE EXTENSION IF NOT EXISTS timescaledb; ``` 1. **Check that TimescaleDB is installed** ```sql \dx ``` You see the list of installed extensions: ```sql List of installed extensions Name | Version | Schema | Description -------------+---------+------------+--------------------------------------------------------------------------------------- plpgsql | 1.0 | pg_catalog | PL/pgSQL procedural language timescaledb | 2.17.2 | public | Enables scalable inserts and complex queries for time-series data (Community Edition) ``` Press q to exit the list of extensions. And that is it! You have TimescaleDB running on a database on a self-hosted instance of Postgres. ## Supported platforms You can deploy TimescaleDB on the following systems: | Operation system | Version | |---------------------------------|-----------------------------------------------------------------------| | Debian | 13 Trixe, 12 Bookworm, 11 Bullseye | | Ubuntu | 24.04 Noble Numbat, 22.04 LTS Jammy Jellyfish | | Red Hat Enterprise | Linux 9, Linux 8 | | Fedora | Fedora 35, Fedora 34, Fedora 33 | | Rocky Linux | Rocky Linux 9 (x86_64), Rocky Linux 8 | | ArchLinux (community-supported) | Check the [available packages][archlinux-packages] | ## Where to next What next? [Try the key features offered by Tiger Data][try-timescale-features], see the [tutorials][tutorials], interact with the data in your Tiger Cloud service using [your favorite programming language][connect-with-code], integrate your Tiger Cloud service with a range of [third-party tools][integrations], plain old [Use Tiger Data products][use-timescale], or dive into the [API reference][use-the-api]. ===== PAGE: https://docs.tigerdata.com/self-hosted/install/self-hosted/ ===== # Install self-hosted TimescaleDB ## Installation Refer to the installation documentation for detailed setup instructions. ===== PAGE: https://docs.tigerdata.com/self-hosted/install/installation-docker/ ===== # Install TimescaleDB on Docker TimescaleDB is a [Postgres extension](https://www.postgresql.org/docs/current/external-extensions.html) for time series and demanding workloads that ingest and query high volumes of data. You can install a TimescaleDB instance on any local system from a pre-built Docker container. This section shows you how to [Install and configure TimescaleDB on Postgres](#install-and-configure-timescaledb-on-postgresql). The following instructions are for development and testing installations. For a production environment, we strongly recommend that you implement the following, many of which you can achieve using Postgres tooling: - Incremental backup and database snapshots, with efficient point-in-time recovery. - High availability replication, ideally with nodes across multiple availability zones. - Automatic failure detection with fast restarts, for both non-replicated and replicated deployments. - Asynchronous replicas for scaling reads when needed. - Connection poolers for scaling client connections. - Zero-down-time minor version and extension upgrades. - Forking workflows for major version upgrades and other feature testing. - Monitoring and observability. Deploying for production? With a Tiger Cloud service we tune your database for performance and handle scalability, high availability, backups, and management, so you can relax. ### Prerequisites To run, and connect to a Postgres installation on Docker, you need to install: - [Docker][docker-install] - [psql][install-psql] ## Install and configure TimescaleDB on Postgres This section shows you how to install the latest version of Postgres and TimescaleDB on a [supported platform](#supported-platforms) using containers supplied by Tiger Data. 1. **Run the TimescaleDB Docker image** The [TimescaleDB HA](https://hub.docker.com/r/timescale/timescaledb-ha) Docker image offers the most complete TimescaleDB experience. It uses [Ubuntu][ubuntu], includes [TimescaleDB Toolkit](https://github.com/timescale/timescaledb-toolkit), and support for PostGIS and Patroni. To install the latest release based on Postgres 17: ``` docker pull timescale/timescaledb-ha:pg17 ``` TimescaleDB is pre-created in the default Postgres database and is added by default to any new database you create in this image. 1. **Run the container** Replace `</a/local/data/folder>` with the path to the folder you want to keep your data in the following command. ``` docker run -d --name timescaledb -p 5432:5432 -v </a/local/data/folder>:/pgdata -e PGDATA=/pgdata -e POSTGRES_PASSWORD=password timescale/timescaledb-ha:pg17 ``` If you are running multiple container instances, change the port each Docker instance runs on. On UNIX-based systems, Docker modifies Linux IP tables to bind the container. If your system uses Linux Uncomplicated Firewall (UFW), Docker may [override your UFW port binding settings][override-binding]. To prevent this, add `DOCKER_OPTS="--iptables=false"` to `/etc/default/docker`. 1. **Connect to a database on your Postgres instance** The default user and database are both `postgres`. You set the password in `POSTGRES_PASSWORD` in the previous step. The default command to connect to Postgres is: ```bash psql -d "postgres://postgres:password@localhost/postgres" ``` 1. **Check that TimescaleDB is installed** ```sql \dx ``` You see the list of installed extensions: ```sql Name | Version | Schema | Description ---------------------+---------+------------+--------------------------------------------------------------------------------------- plpgsql | 1.0 | pg_catalog | PL/pgSQL procedural language timescaledb | 2.20.3 | public | Enables scalable inserts and complex queries for time-series data (Community Edition) timescaledb_toolkit | 1.21.0 | public | Library of analytical hyperfunctions, time-series pipelining, and other SQL utilities (3 rows) ``` Press `q` to exit the list of extensions. ## More Docker options If you want to access the container from the host but avoid exposing it to the outside world, you can bind to `127.0.0.1` instead of the public interface, using this command:bash docker run -d --name timescaledb -p 127.0.0.1:5432:5432 \ -v
:/pgdata -e PGDATA=/pgdata -e POSTGRES_PASSWORD=password timescale/timescaledb-ha:pg17If you don't want to install `psql` and other Postgres client tools locally, or if you are using a Microsoft Windows host system, you can connect using the version of `psql` that is bundled within the container with this command:bash docker exec -it timescaledb psql -U postgres
When you install TimescaleDB using a Docker container, the Postgres settings are inherited from the container. In most cases, you do not need to adjust them. However, if you need to change a setting, you can add `-c setting=value` to your Docker `run` command. For more information, see the [Docker documentation][docker-postgres]. The link provided in these instructions is for the latest version of TimescaleDB on Postgres 17. To find other Docker tags you can use, see the [Dockerhub repository][dockerhub]. ## View logs in Docker If you have TimescaleDB installed in a Docker container, you can view your logs using Docker, instead of looking in `/var/lib/logs` or `/var/logs`. For more information, see the [Docker documentation on logs][docker-logs]. 1. **Run the TimescaleDB Docker image** The light-weight [TimescaleDB](https://hub.docker.com/r/timescale/timescaledb) Docker image uses [Alpine][alpine] and does not contain [TimescaleDB Toolkit](https://github.com/timescale/timescaledb-toolkit) or support for PostGIS and Patroni. To install the latest release based on Postgres 17: ``` docker pull timescale/timescaledb:latest-pg17 ``` TimescaleDB is pre-created in the default Postgres database and added by default to any new database you create in this image. 1. **Run the container** ``` docker run -v </a/local/data/folder>:/pgdata -e PGDATA=/pgdata \ -d --name timescaledb -p 5432:5432 -e POSTGRES_PASSWORD=password timescale/timescaledb:latest-pg17 ``` If you are running multiple container instances, change the port each Docker instance runs on. On UNIX-based systems, Docker modifies Linux IP tables to bind the container. If your system uses Linux Uncomplicated Firewall (UFW), Docker may [override your UFW port binding settings][override-binding]. To prevent this, add `DOCKER_OPTS="--iptables=false"` to `/etc/default/docker`. 1. **Connect to a database on your Postgres instance** The default user and database are both `postgres`. You set the password in `POSTGRES_PASSWORD` in the previous step. The default command to connect to Postgres in this image is: ```bash psql -d "postgres://postgres:password@localhost/postgres" ``` 1. **Check that TimescaleDB is installed** ```sql \dx ``` You see the list of installed extensions: ```sql Name | Version | Schema | Description ---------------------+---------+------------+--------------------------------------------------------------------------------------- plpgsql | 1.0 | pg_catalog | PL/pgSQL procedural language timescaledb | 2.20.3 | public | Enables scalable inserts and complex queries for time-series data (Community Edition) ``` Press `q` to exit the list of extensions. ## More Docker options If you want to access the container from the host but avoid exposing it to the outside world, you can bind to `127.0.0.1` instead of the public interface, using this command:bash docker run -v
:/pgdata -e PGDATA=/pgdata \ -d --name timescaledb -p 127.0.0.1:5432:5432 \ -e POSTGRES_PASSWORD=password timescale/timescaledb:latest-pg17If you don't want to install `psql` and other Postgres client tools locally, or if you are using a Microsoft Windows host system, you can connect using the version of `psql` that is bundled within the container with this command:bash docker exec -it timescaledb psql -U postgres
Existing containers can be stopped using `docker stop` and started again with `docker start` while retaining their volumes and data. When you create a new container using the `docker run` command, by default you also create a new data volume. When you remove a Docker container with `docker rm`, the data volume persists on disk until you explicitly delete it. You can use the `docker volume ls` command to list existing docker volumes. If you want to store the data from your Docker container in a host directory, or you want to run the Docker image on top of an existing data directory, you can specify the directory to mount a data volume using the `-v` flag:bash docker run -d --name timescaledb -p 5432:5432 \ -v
:/pgdata -e PGDATA=/pgdata \ -e POSTGRES_PASSWORD=password timescale/timescaledb:latest-pg17When you install TimescaleDB using a Docker container, the Postgres settings are inherited from the container. In most cases, you do not need to adjust them. However, if you need to change a setting, you can add `-c setting=value` to your Docker `run` command. For more information, see the [Docker documentation][docker-postgres]. The link provided in these instructions is for the latest version of TimescaleDB on Postgres 16. To find other Docker tags you can use, see the [Dockerhub repository][dockerhub]. ## View logs in Docker If you have TimescaleDB installed in a Docker container, you can view your logs using Docker, instead of looking in `/var/log`. For more information, see the [Docker documentation on logs][docker-logs]. And that is it! You have TimescaleDB running on a database on a self-hosted instance of Postgres. ## Where to next What next? [Try the key features offered by Tiger Data][try-timescale-features], see the [tutorials][tutorials], interact with the data in your Tiger Cloud service using [your favorite programming language][connect-with-code], integrate your Tiger Cloud service with a range of [third-party tools][integrations], plain old [Use Tiger Data products][use-timescale], or dive into the [API reference][use-the-api]. ===== PAGE: https://docs.tigerdata.com/self-hosted/replication-and-ha/configure-replication/ ===== # Configure replication This section outlines how to set up asynchronous streaming replication on one or more database replicas. Tiger Cloud is a fully managed service with automatic backup and restore, high availability with replication, seamless scaling and resizing, and much more. You can try Tiger Cloud free for thirty days. Before you begin, make sure you have at least two separate instances of TimescaleDB running. If you installed TimescaleDB using a Docker container, use a [Postgres entry point script][docker-postgres-scripts] to run the configuration. For more advanced examples, see the [TimescaleDB Helm Charts repository][timescale-streamrep-helm]. To configure replication on self-hosted TimescaleDB, you need to perform these procedures: 1. [Configure the primary database][configure-primary-db] 1. [Configure replication parameters][configure-params] 1. [Create replication slots][create-replication-slots] 1. [Configure host-based authentication parameters][configure-pghba] 1. [Create a base backup on the replica][create-base-backup] 1. [Configure replication and recovery settings][configure-replication] 1. [Verify that the replica is working][verify-replica] ## Configure the primary database To configure the primary database, you need a Postgres user with a role that allows it to initialize streaming replication. This is the user each replica uses to stream from the primary database. ### Configuring the primary database 1. On the primary database, as a user with superuser privileges, such as the `postgres` user, set the password encryption level to `scram-sha-256`: ```sql SET password_encryption = 'scram-sha-256'; ``` 1. Create a new user called `repuser`: ```sql CREATE ROLE repuser WITH REPLICATION PASSWORD '<PASSWORD>' LOGIN; ``` The [scram-sha-256](https://www.postgresql.org/docs/current/sasl-authentication.html#SASL-SCRAM-SHA-256) encryption level is the most secure password-based authentication available in Postgres. It is only available in Postgres 10 and later. ## Configure replication parameters There are several replication settings that need to be added or edited in the `postgresql.conf` configuration file. ### Configuring replication parameters 1. Set the `synchronous_commit` parameter to `off`. 1. Set the `max_wal_senders` parameter to the total number of concurrent connections from replicas or backup clients. As a minimum, this should equal the number of replicas you intend to have. 1. Set the `wal_level` parameter to the amount of information written to the Postgres write-ahead log (WAL). For replication to work, there needs to be enough data in the WAL to support archiving and replication. The default value is usually appropriate. 1. Set the `max_replication_slots` parameter to the total number of replication slots the primary database can support. 1. Set the `listen_addresses` parameter to the address of the primary database. Do not leave this parameter as the local loopback address, because the remote replicas must be able to connect to the primary to stream the WAL. 1. Restart Postgres to pick up the changes. This must be done before you create replication slots. The most common streaming replication use case is asynchronous replication with one or more replicas. In this example, the WAL is streamed to the replica, but the primary server does not wait for confirmation that the WAL has been written to disk on either the primary or the replica. This is the most performant replication configuration, but it does carry the risk of a small amount of data loss in the event of a system failure. It also makes no guarantees that the replica is fully up to date with the primary, which could cause inconsistencies between read queries on the primary and the replica. The example configuration for this use case:yaml listen_addresses = '*' wal_level = replica max_wal_senders = 2 max_replication_slots = 2 synchronous_commit = off
If you need stronger consistency on the replicas, or if your query load is heavy enough to cause significant lag between the primary and replica nodes in asynchronous mode, consider a synchronous replication configuration instead. For more information about the different replication modes, see the [replication modes section][replication-modes]. ## Create replication slots When you have configured `postgresql.conf` and restarted Postgres, you can create a [replication slot][postgres-rslots-docs] for each replica. Replication slots ensure that the primary does not delete segments from the WAL until they have been received by the replicas. This is important in case a replica goes down for an extended time. The primary needs to verify that a WAL segment has been consumed by a replica, so that it can safely delete data. You can use [archiving][postgres-archive-docs] for this purpose, but replication slots provide the strongest protection for streaming replication. ### Creating replication slots 1. At the `psql` slot, create the first replication slot. The name of the slot is arbitrary. In this example, it is called `replica_1_slot`: ```sql SELECT * FROM pg_create_physical_replication_slot('replica_1_slot', true); ``` 1. Repeat for each required replication slot. ## Configure host-based authentication parameters There are several replication settings that need to be added or edited to the `pg_hba.conf` configuration file. In this example, the settings restrict replication connections to traffic coming from `REPLICATION_HOST_IP` as the Postgres user `repuser` with a valid password. `REPLICATION_HOST_IP` can initiate streaming replication from that machine without additional credentials. You can change the `address` and `method` values to match your security and network settings. For more information about `pg_hba.conf`, see the [`pg_hba` documentation][pg-hba-docs]. ### Configuring host-based authentication parameters 1. Open the `pg_hba.conf` configuration file and add or edit this line: ```yaml TYPE DATABASE USER ADDRESS METHOD AUTH_METHOD host replication repuser <REPLICATION_HOST_IP>/32 scram-sha-256 ``` 1. Restart Postgres to pick up the changes. ## Create a base backup on the replica Replicas work by streaming the primary server's WAL log and replaying its transactions in Postgres recovery mode. To do this, the replica needs to be in a state where it can replay the log. You can do this by restoring the replica from a base backup of the primary instance. ### Creating a base backup on the replica 1. Stop Postgres services. 1. If the replica database already contains data, delete it before you run the backup, by removing the Postgres data directory: ```bash rm -rf <DATA_DIRECTORY>/* ``` If you don't know the location of the data directory, find it with the `show data_directory;` command. 1. Restore from the base backup, using the IP address of the primary database and the replication username: ```bash pg_basebackup -h <PRIMARY_IP> \ -D <DATA_DIRECTORY> \ -U repuser -vP -W ``` The -W flag prompts you for a password. If you are using this command in an automated setup, you might need to use a [pgpass file][pgpass-file]. 1. When the backup is complete, create a [standby.signal][postgres-recovery-docs] file in your data directory. When Postgres finds a `standby.signal` file in its data directory, it starts in recovery mode and streams the WAL through the replication protocol: ```bash touch <DATA_DIRECTORY>/standby.signal ``` ## Configure replication and recovery settings When you have successfully created a base backup and a `standby.signal` file, you can configure the replication and recovery settings. ## Configuring replication and recovery settings 1. In the replica's `postgresql.conf` file, add details for communicating with the primary server. If you are using streaming replication, the `application_name` in `primary_conninfo` should be the same as the name used in the primary's `synchronous_standby_names` settings: ```yaml primary_conninfo = 'host=<PRIMARY_IP> port=5432 user=repuser password=<POSTGRES_USER_PASSWORD> application_name=r1' primary_slot_name = 'replica_1_slot' ``` 1. Add details to mirror the configuration of the primary database. If you are using asynchronous replication, use these settings: ```yaml hot_standby = on wal_level = replica max_wal_senders = 2 max_replication_slots = 2 synchronous_commit = off ``` The `hot_standby` parameter must be set to `on` to allow read-only queries on the replica. In Postgres 10 and later, this setting is `on` by default. 1. Restart Postgres to pick up the changes. ## Verify that the replica is working At this point, your replica should be fully synchronized with the primary database and prepared to stream from it. You can verify that it is working properly by checking the logs on the replica, which should look like this:txt LOG: database system was shut down in recovery at 2018-03-09 18:36:23 UTC LOG: entering standby mode LOG: redo starts at 0/2000028 LOG: consistent recovery state reached at 0/3000000 LOG: database system is ready to accept read only connections LOG: started streaming WAL from primary at 0/3000000 on timeline 1
Any client can perform reads on the replica. You can verify this by running inserts, updates, or other modifications to your data on the primary database, and then querying the replica to ensure they have been properly copied over. ## Replication modes In most cases, asynchronous streaming replication is sufficient. However, you might require greater consistency between the primary and replicas, especially if you have a heavy workload. Under heavy workloads, replicas can lag far behind the primary, providing stale data to clients reading from the replicas. Additionally, in cases where any data loss is fatal, asynchronous replication might not provide enough of a durability guarantee. The Postgres [`synchronous_commit`][postgres-synchronous-commit-docs] feature has several options with varying consistency and performance tradeoffs. In the `postgresql.conf` file, set the `synchronous_commit` parameter to: * `on`: This is the default value. The server does not return `success` until the WAL transaction has been written to disk on the primary and any replicas. * `off`: The server returns `success` when the WAL transaction has been sent to the operating system to write to the WAL on disk on the primary, but does not wait for the operating system to actually write it. This can cause a small amount of data loss if the server crashes when some data has not been written, but it does not result in data corruption. Turning `synchronous_commit` off is a well-known Postgres optimization for workloads that can withstand some data loss in the event of a system crash. * `local`: Enforces `on` behavior only on the primary server. * `remote_write`: The database returns `success` to a client when the WAL record has been sent to the operating system for writing to the WAL on the replicas, but before confirmation that the record has actually been persisted to disk. This is similar to asynchronous commit, except it waits for the replicas as well as the primary. In practice, the extra wait time incurred waiting for the replicas significantly decreases replication lag. * `remote_apply`: Requires confirmation that the WAL records have been written to the WAL and applied to the databases on all replicas. This provides the strongest consistency of any of the `synchronous_commit` options. In this mode, replicas always reflect the latest state of the primary, and replication lag is nearly non-existent. If `synchronous_standby_names` is empty, the settings `on`, `remote_apply`, `remote_write` and `local` all provide the same synchronization level, and transaction commits wait for the local flush to disk. This matrix shows the level of consistency provided by each mode: |Mode|WAL Sent to OS (Primary)|WAL Persisted (Primary)|WAL Sent to OS (Primary & Replicas)|WAL Persisted (Primary & Replicas)|Transaction Applied (Primary & Replicas)| |-|-|-|-|-|-| |Off|✅|❌|❌|❌|❌| |Local|✅|✅|❌|❌|❌| |Remote Write|✅|✅|✅|❌|❌| |On|✅|✅|✅|✅|❌| |Remote Apply|✅|✅|✅|✅|✅| The `synchronous_standby_names` setting is a complementary setting to `synchronous_commit`. It lists the names of all replicas the primary database supports for synchronous replication, and configures how the primary database waits for them. The `synchronous_standby_names` setting supports these formats: * `FIRST num_sync (replica_name_1, replica_name_2)`: This waits for confirmation from the first `num_sync` replicas before returning `success`. The list of `replica_names` determines the relative priority of the replicas. Replica names are determined by the `application_name` setting on the replicas. * `ANY num_sync (replica_name_1, replica_name_2)`: This waits for confirmation from `num_sync` replicas in the provided list, regardless of their priority or position in the list. This is works as a quorum function. Synchronous replication modes force the primary to wait until all required replicas have written the WAL, or applied the database transaction, depending on the `synchronous_commit` level. This could cause the primary to hang indefinitely if a required replica crashes. When the replica reconnects, it replays any of the WAL it needs to catch up. Only then is the primary able to resume writes. To mitigate this, provision more than the amount of nodes required under the `synchronous_standby_names` setting and list them in the `FIRST` or `ANY` clauses. This allows the primary to move forward as long as a quorum of replicas have written the most recent WAL transaction. Replicas that were out of service are able to reconnect and replay the missed WAL transactions asynchronously. ## Replication diagnostics The Postgres [pg_stat_replication][postgres-pg-stat-replication-docs] view provides information about each replica. This view is particularly useful for calculating replication lag, which measures how far behind the primary the current state of the replica is. The `replay_lag` field gives a measure of the seconds between the most recent WAL transaction on the primary, and the last reported database commit on the replica. Coupled with `write_lag` and `flush_lag`, this provides insight into how far behind the replica is. The `*_lsn` fields also provide helpful information. They allow you to compare WAL locations between the primary and the replicas. The `state` field is useful for determining exactly what each replica is currently doing; the available modes are `startup`, `catchup`, `streaming`, `backup`, and `stopping`. To see the data, on the primary database, run this command:sql SELECT * FROM pg_stat_replication;
The output looks like this:sql -[ RECORD 1 ]----+------------------------------ pid | 52343 usesysid | 16384 usename | repuser application_name | r2 client_addr | 10.0.13.6 client_hostname | client_port | 59610 backend_start | 2018-02-07 19:07:15.261213+00 backend_xmin | state | streaming sent_lsn | 16B/43DB36A8 write_lsn | 16B/43DB36A8 flush_lsn | 16B/43DB36A8 replay_lsn | 16B/43107C28 write_lag | 00:00:00.009966 flush_lag | 00:00:00.03208 replay_lag | 00:00:00.43537 sync_priority | 2 sync_state | sync -[ RECORD 2 ]----+------------------------------ pid | 54498 usesysid | 16384 usename | repuser application_name | r1 client_addr | 10.0.13.5 client_hostname | client_port | 43402 backend_start | 2018-02-07 19:45:41.410929+00 backend_xmin | state | streaming sent_lsn | 16B/43DB36A8 write_lsn | 16B/43DB36A8 flush_lsn | 16B/43DB36A8 replay_lsn | 16B/42C3B9C8 write_lag | 00:00:00.019736 flush_lag | 00:00:00.044073 replay_lag | 00:00:00.644004 sync_priority | 1 sync_state | sync
## Failover Postgres provides some failover functionality, where the replica is promoted to primary in the event of a failure. This is provided using the [pg_ctl][pgctl-docs] command or the `trigger_file`. However, Postgres does not provide support for automatic failover. For more information, see the [Postgres failover documentation][failover-docs]. If you require a configurable high availability solution with automatic failover functionality, check out [Patroni][patroni-github]. ===== PAGE: https://docs.tigerdata.com/self-hosted/replication-and-ha/about-ha/ ===== # High availability High availability (HA) is achieved by increasing redundancy and resilience. To increase redundancy, parts of the system are replicated, so that they are on standby in the event of a failure. To increase resilience, recovery processes switch between these standby resources as quickly as possible. Tiger Cloud is a fully managed service with automatic backup and restore, high availability with replication, seamless scaling and resizing, and much more. You can try Tiger Cloud free for thirty days. ## Backups For some systems, recovering from backup alone can be a suitable availability strategy. For more information about backups in self-hosted TimescaleDB, see the [backup and restore section][db-backup] in the TimescaleDB documentation. ## Storage redundancy Storage redundancy refers to having multiple copies of a database's data files. If the storage currently attached to a Postgres instance corrupts or otherwise becomes unavailable, the system can replace its current storage with one of the copies. ## Instance redundancy Instance redundancy refers to having replicas of your database running simultaneously. In the case of a database failure, a replica is an up-to-date, running database that can take over immediately. ## Zonal redundancy While the public cloud is highly reliable, entire portions of the cloud can be unavailable at times. TimescaleDB does not protect against Availability Zone failures unless the user is using HA replicas. We do not currently offer multi-cloud solutions or protection from an AWS Regional failure. ## Replication TimescaleDB supports replication using Postgres's built-in [streaming replication][postgres-streaming-replication-docs]. Using [logical replication][postgres-logrep-docs] with TimescaleDB is not recommended, as it requires schema synchronization between the primary and replica nodes and replicating partition root tables, which are [not currently supported][postgres-partition-limitations]. Postgres achieves streaming replication by having replicas continuously stream the WAL from the primary database. See the official [replication documentation](https://www.postgresql.org/docs/current/warm-standby.html#STREAMING-REPLICATION) for details. For more information about how Postgres implements Write-Ahead Logging, see their [WAL Documentation](https://www.postgresql.org/docs/current/wal-intro.html). ## Failover Postgres offers failover functionality where a replica is promoted to primary in the event of a failure on the primary. This is done using [pg_ctl][pgctl-docs] or the `trigger_file`, but it does not provide out-of-the-box support for automatic failover. Read more in the Postgres [failover documentation][failover-docs]. [Patroni][patroni-github] offers a configurable high availability solution with automatic failover functionality. ===== PAGE: https://docs.tigerdata.com/self-hosted/distributed-hypertables/insert/ ===== # Insert data [Multi-node support is sunsetted][multi-node-deprecation]. TimescaleDB v2.13 is the last release that includes multi-node support for Postgres versions 13, 14, and 15. You can insert data into a distributed hypertable with an `INSERT` statement. The syntax looks the same as for a standard hypertable or Postgres table. For example:sql INSERT INTO conditions(time, location, temperature, humidity) VALUES (NOW(), 'office', 70.0, 50.0);
## Optimize data insertion Distributed hypertables have higher network load than standard hypertables, because they must push inserts from the access node to the data nodes. You can optimize your insertion patterns to reduce load. ### Insert data in batches Reduce load by batching your `INSERT` statements over many rows of data, instead of performing each insertion as a separate transaction. The access node first splits the batched data into smaller batches by determining which data node each row should belong to. It then writes each batch to the correct data node. ### Optimize insert batch size When inserting to a distributed hypertable, the access node tries to convert `INSERT` statements into more efficient [`COPY`][postgresql-copy] operations between the access and data nodes. But this doesn't work if: * The `INSERT` statement has a `RETURNING` clause _and_ * The hypertable has triggers that could alter the returned data In this case, the planner uses a multi-row prepared statement to insert into each data node. It splits the original insert statement across these sub-statements. You can view the plan by running an [`EXPLAIN`][postgresql-explain] on your `INSERT` statement. In the prepared statement, the access node can buffer a number of rows before flushing them to the data node. By default, the number is 1000. You can optimize this by changing the `timescaledb.max_insert_batch_size` setting, for example to reduce the number of separate batches that must be sent. The maximum batch size has a ceiling. This is equal to the maximum number of parameters allowed in a prepared statement, which is currently 32,767 parameters, divided by the number of columns in each row. For example, if you have a distributed hypertable with 10 columns, the highest you can set the batch size is 3276. For more information on changing `timescaledb.max_insert_batch_size`, see the section on [configuration][config]. ### Use a copy statement instead [`COPY`][postgresql-copy] can perform better than `INSERT` on a distributed hypertable. But it doesn't support some features, such as conflict handling using the `ON CONFLICT` clause. To copy from a file to your hypertable, run:sql COPY FROM '';
When doing a [`COPY`][postgresql-copy], the access node switches each data node to copy mode. It then streams each row to the correct data node. ===== PAGE: https://docs.tigerdata.com/self-hosted/distributed-hypertables/alter-drop-distributed-hypertables/ ===== # Alter and drop distributed hypertables [Multi-node support is sunsetted][multi-node-deprecation]. TimescaleDB v2.13 is the last release that includes multi-node support for Postgres versions 13, 14, and 15. You can alter and drop distributed hypertables in the same way as standard hypertables. To learn more, see: * [Altering hypertables][alter] * [Dropping hypertables][drop] When you alter a distributed hypertable, or set privileges on it, the commands are automatically applied across all data nodes. For more information, see the section on [multi-node administration][multinode-admin]. ===== PAGE: https://docs.tigerdata.com/self-hosted/distributed-hypertables/create-distributed-hypertables/ ===== # Create distributed hypertables [Multi-node support is sunsetted][multi-node-deprecation]. TimescaleDB v2.13 is the last release that includes multi-node support for Postgres versions 13, 14, and 15. If you have a [multi-node environment][multi-node], you can create a distributed hypertable across your data nodes. First create a standard Postgres table, and then convert it into a distributed hypertable. You need to set up your multi-node cluster before creating a distributed hypertable. To set up multi-node, see the [multi-node section](https://docs.tigerdata.com/self-hosted/latest/multinode-timescaledb/). ### Creating a distributed hypertable 1. On the access node of your multi-node cluster, create a standard [Postgres table][postgres-createtable]: ```sql CREATE TABLE conditions ( time TIMESTAMPTZ NOT NULL, location TEXT NOT NULL, temperature DOUBLE PRECISION NULL, humidity DOUBLE PRECISION NULL ); ``` 1. Convert the table to a distributed hypertable. Specify the name of the table you want to convert, the column that holds its time values, and a space-partitioning parameter. ```sql SELECT create_distributed_hypertable('conditions', 'time', 'location'); ``` ===== PAGE: https://docs.tigerdata.com/self-hosted/distributed-hypertables/foreign-keys/ ===== # Create foreign keys in a distributed hypertable [Multi-node support is sunsetted][multi-node-deprecation]. TimescaleDB v2.13 is the last release that includes multi-node support for Postgres versions 13, 14, and 15. Tables and values referenced by a distributed hypertable must be present on the access node and all data nodes. To create a foreign key from a distributed hypertable, use [`distributed_exec`][distributed_exec] to first create the referenced table on all nodes. ## Creating foreign keys in a distributed hypertable 1. Create the referenced table on the access node. 1. Use [`distributed_exec`][distributed_exec] to create the same table on all data nodes and update it with the correct data. 1. Create a foreign key from your distributed hypertable to your referenced table. ===== PAGE: https://docs.tigerdata.com/self-hosted/distributed-hypertables/triggers/ ===== # Use triggers on distributed hypertables [Multi-node support is sunsetted][multi-node-deprecation]. TimescaleDB v2.13 is the last release that includes multi-node support for Postgres versions 13, 14, and 15. Triggers on distributed hypertables work in much the same way as triggers on standard hypertables, and have the same limitations. But there are some differences due to the data being distributed across multiple nodes: * Row-level triggers fire on the data node where the row is inserted. The triggers must fire where the data is stored, because `BEFORE` and `AFTER` row triggers need access to the stored data. The chunks on the access node do not contain any data, so they have no triggers. * Statement-level triggers fire once on each affected node, including the access node. For example, if a distributed hypertable includes 3 data nodes, inserting 2 rows of data executes a statement-level trigger on the access node and either 1 or 2 data nodes, depending on whether the rows go to the same or different nodes. * A replication factor greater than 1 further causes the trigger to fire on multiple nodes. Each replica node fires the trigger. ## Create a trigger on a distributed hypertable Create a trigger on a distributed hypertable by using [`CREATE TRIGGER`][create-trigger] as usual. The trigger, and the function it executes, is automatically created on each data node. If the trigger function references any other functions or objects, they need to be present on all nodes before you create the trigger. ### Creating a trigger on a distributed hypertable 1. If your trigger needs to reference another function or object, use [`distributed_exec`][distributed_exec] to create the function or object on all nodes. 1. Create the trigger function on the access node. This example creates a dummy trigger that raises the notice 'trigger fired': ```sql CREATE OR REPLACE FUNCTION my_trigger_func() RETURNS TRIGGER LANGUAGE PLPGSQL AS body$ BEGIN RAISE NOTICE 'trigger fired'; RETURN NEW; END body$; ``` 1. Create the trigger itself on the access node. This example causes the trigger to fire whenever a row is inserted into the hypertable `hyper`. Note that you don't need to manually create the trigger on the data nodes. This is done automatically for you. ```sql CREATE TRIGGER my_trigger AFTER INSERT ON hyper FOR EACH ROW EXECUTE FUNCTION my_trigger_func(); ``` ## Avoid processing a trigger multiple times If you have a statement-level trigger, or a replication factor greater than 1, the trigger fires multiple times. To avoid repetitive firing, you can set the trigger function to check which data node it is executing on. For example, write a trigger function that raises a different notice on the access node compared to a data node:sql CREATE OR REPLACE FUNCTION my_trigger_func()
RETURNS TRIGGER LANGUAGE PLPGSQL ASbody$ DECLARE
is_access_node boolean;BEGIN
SELECT is_distributed INTO is_access_node FROM timescaledb_information.hypertables WHERE hypertable_name = AND hypertable_schema = ; IF is_access_node THEN RAISE NOTICE 'trigger fired on the access node'; ELSE RAISE NOTICE 'trigger fired on a data node'; END IF; RETURN NEW;END body$;
===== PAGE: https://docs.tigerdata.com/self-hosted/distributed-hypertables/query/ ===== # Query data in distributed hypertables [Multi-node support is sunsetted][multi-node-deprecation]. TimescaleDB v2.13 is the last release that includes multi-node support for Postgres versions 13, 14, and 15. You can query a distributed hypertable just as you would query a standard hypertable or Postgres table. For more information, see the section on [writing data][write]. Queries perform best when the access node can push transactions down to the data nodes. To ensure that the access node can push down transactions, check that the [`enable_partitionwise_aggregate`][enable_partitionwise_aggregate] setting is set to `on` for the access node. By default, it is `off`. If you want to use continuous aggregates on your distributed hypertable, see the [continuous aggregates][caggs] section for more information. ===== PAGE: https://docs.tigerdata.com/self-hosted/distributed-hypertables/about-distributed-hypertables/ ===== # About distributed hypertables [Multi-node support is sunsetted][multi-node-deprecation]. TimescaleDB v2.13 is the last release that includes multi-node support for Postgres versions 13, 14, and 15. Distributed hypertables are hypertables that span multiple nodes. With distributed hypertables, you can scale your data storage across multiple machines. The database can also parallelize some inserts and queries. A distributed hypertable still acts as if it were a single table. You can work with one in the same way as working with a standard hypertable. To learn more about hypertables, see the [hypertables section][hypertables]. Certain nuances can affect distributed hypertable performance. This section explains how distributed hypertables work, and what you need to consider before adopting one. ## Architecture of a distributed hypertable Distributed hypertables are used with multi-node clusters. Each cluster has an access node and multiple data nodes. You connect to your database using the access node, and the data is stored on the data nodes. For more information about multi-node, see the [multi-node section][multi-node]. You create a distributed hypertable on your access node. Its chunks are stored on the data nodes. When you insert data or run a query, the access node communicates with the relevant data nodes and pushes down any processing if it can. ## Space partitioning Distributed hypertables are always partitioned by time, just like standard hypertables. But unlike standard hypertables, distributed hypertables should also be partitioned by space. This allows you to balance inserts and queries between data nodes, similar to traditional sharding. Without space partitioning, all data in the same time range would write to the same chunk on a single node. By default, TimescaleDB creates as many space partitions as there are data nodes. You can change this number, but having too many space partitions degrades performance. It increases planning time for some queries, and leads to poorer balancing when mapping items to partitions. Data is assigned to space partitions by hashing. Each hash bucket in the space dimension corresponds to a data node. One data node may hold many buckets, but each bucket may belong to only one node for each time interval. When space partitioning is on, 2 dimensions are used to divide data into chunks: the time dimension and the space dimension. You can specify the number of partitions along the space dimension. Data is assigned to a partition by hashing its value on that dimension. For example, say you use `device_id` as a space partitioning column. For each row, the value of the `device_id` column is hashed. Then the row is inserted into the correct partition for that hash value. <img class="main-content__illustration" width={1375} height={944} src="https://assets.timescale.com/docs/images/hypertable-time-space-partition.webp" alt="A hypertable visualized as a rectangular plane carved into smaller rectangles, which are chunks. One dimension of the rectangular plane is time and the other is space. Data enters the hypertable and flows to a chunk based on its time and space values." /> ### Closed and open dimensions for space partitioning Space partitioning dimensions can be open or closed. A closed dimension has a fixed number of partitions, and usually uses some hashing to match values to partitions. An open dimension does not have a fixed number of partitions, and usually has each chunk cover a certain range. In most cases the time dimension is open and the space dimension is closed. If you use the `create_hypertable` command to create your hypertable, then the space dimension is open, and there is no way to adjust this. To create a hypertable with a closed space dimension, create the hypertable with only the time dimension first. Then use the `add_dimension` command to explicitly add an open device. If you set the range to `1`, each device has its own chunks. This can help you work around some limitations of regular space dimensions, and is especially useful if you want to make some chunks readily available for exclusion. ### Repartitioning distributed hypertables You can expand distributed hypertables by adding additional data nodes. If you now have fewer space partitions than data nodes, you need to increase the number of space partitions to make use of your new nodes. The new partitioning configuration only affects new chunks. In this diagram, an extra data node was added during the third time interval. The fourth time interval now includes four chunks, while the previous time intervals still include three: <img class="main-content__illustration" width={1375} height={944} src="https://assets.timescale.com/docs/images/repartitioning.webp" alt="Diagram showing repartitioning on a distributed hypertable" /> This can affect queries that span the two different partitioning configurations. For more information, see the section on [limitations of query push down][limitations]. ## Replicating distributed hypertables To replicate distributed hypertables at the chunk level, configure the hypertables to write each chunk to multiple data nodes. This native replication ensures that a distributed hypertable is protected against data node failures and provides an alternative to fully replicating each data node using streaming replication to provide high availability. Only the data nodes are replicated using this method. The access node is not replicated. For more information about replication and high availability, see the [multi-node HA section][multi-node-ha]. ## Performance of distributed hypertables A distributed hypertable horizontally scales your data storage, so you're not limited by the storage of any single machine. It also increases performance for some queries. Whether, and by how much, your performance increases depends on your query patterns and data partitioning. Performance increases when the access node can push down query processing to data nodes. For example, if you query with a `GROUP BY` clause, and the data is partitioned by the `GROUP BY` column, the data nodes can perform the processing and send only the final results to the access node. If processing can't be done on the data nodes, the access node needs to pull in raw or partially processed data and do the processing locally. For more information, see the [limitations of pushing down queries][limitations-pushing-down]. ## Query push down The access node can use a full or a partial method to push down queries. Computations that can be pushed down include sorts and groupings. Joins on data nodes aren't currently supported. To see how a query is pushed down to a data node, use `EXPLAIN VERBOSE` to inspect the query plan and the remote SQL statement sent to each data node. ### Full push down In the full push-down method, the access node offloads all computation to the data nodes. It receives final results from the data nodes and appends them. To fully push down an aggregate query, the `GROUP BY` clause must include either: * All the partitioning columns _or_ * Only the first space-partitioning column For example, say that you want to calculate the `max` temperature for each location:sql SELECT location, max(temperature) FROM conditions GROUP BY location;
If `location` is your only space partition, each data node can compute the maximum on its own subset of the data. ### Partial push down In the partial push-down method, the access node offloads most of the computation to the data nodes. It receives partial results from the data nodes and calculates a final aggregate by combining the partials. For example, say that you want to calculate the `max` temperature across all locations. Each data node computes a local maximum, and the access node computes the final result by computing the maximum of all the local maximums:sql SELECT max(temperature) FROM conditions;
### Limitations of query push down Distributed hypertables get improved performance when they can push down queries to the data nodes. But the query planner might not be able to push down every query. Or it might only be able to partially push down a query. This can occur for several reasons: * You changed the partitioning configuration. For example, you added new data nodes and increased the number of space partitions to match. This can cause chunks for the same space value to be stored on different nodes. For instance, say you partition by `device_id`. You start with 3 partitions, and data for `device_B` is stored on node 3. You later increase to 4 partitions. New chunks for `device_B` are now stored on node 4. If you query across the repartitioning boundary, a final aggregate for `device_B` cannot be calculated on node 3 or node 4 alone. Partially processed data must be sent to the access node for final aggregation. The TimescaleDB query planner dynamically detects such overlapping chunks and reverts to the appropriate partial aggregation plan. This means that you can add data nodes and repartition your data to achieve elasticity without worrying about query results. In some cases, your query could be slightly less performant, but this is rare and the affected chunks usually move quickly out of your retention window. * The query includes [non-immutable functions][volatility] and expressions. The function cannot be pushed down to the data node, because by definition, it isn't guaranteed to have a consistent result across each node. An example non-immutable function is [`random()`][random-func], which depends on the current seed. * The query includes a job function. The access node assumes the function doesn't exist on the data nodes, and doesn't push it down. TimescaleDB uses several optimizations to avoid these limitations, and push down as many queries as possible. For example, `now()` is a non-immutable function. The database converts it to a constant on the access node and pushes down the constant timestamp to the data nodes. ## Combine distributed hypertables and standard hypertables You can use distributed hypertables in the same database as standard hypertables and standard Postgres tables. This mostly works the same way as having multiple standard tables, with a few differences. For example, if you `JOIN` a standard table and a distributed hypertable, the access node needs to fetch the raw data from the data nodes and perform the `JOIN` locally. ## Limitations All the limitations of regular hypertables also apply to distributed hypertables. In addition, the following limitations apply specifically to distributed hypertables: * Distributed scheduling of background jobs is not supported. Background jobs created on an access node are scheduled and executed on this access node without distributing the jobs to data nodes. * Continuous aggregates can aggregate data distributed across data nodes, but the continuous aggregate itself must live on the access node. This could create a limitation on how far you can scale your installation, but because continuous aggregates are downsamples of the data, this does not usually create a problem. * Reordering chunks is not supported. * Tablespaces cannot be attached to a distributed hypertable on the access node. It is still possible to attach tablespaces on data nodes. * Roles and permissions are assumed to be consistent across the nodes of a distributed database, but consistency is not enforced. * Joins on data nodes are not supported. Joining a distributed hypertable with another table requires the other table to reside on the access node. This also limits the performance of joins on distributed hypertables. * Tables referenced by foreign key constraints in a distributed hypertable must be present on the access node and all data nodes. This applies also to referenced values. * Parallel-aware scans and appends are not supported. * Distributed hypertables do not natively provide a consistent restore point for backup and restore across nodes. Use the [`create_distributed_restore_point`][create_distributed_restore_point] command, and make sure you take care when you restore individual backups to access and data nodes. * For native replication limitations, see the [native replication section][native-replication]. * User defined functions have to be manually installed on the data nodes so that the function definition is available on both access and data nodes. This is particularly relevant for functions that are registered with `set_integer_now_func`. Note that these limitations concern usage from the access node. Some currently unsupported features might still work on individual data nodes, but such usage is neither tested nor officially supported. Future versions of TimescaleDB might remove some of these limitations. ===== PAGE: https://docs.tigerdata.com/self-hosted/backup-and-restore/logical-backup/ ===== # Logical backup with pg_dump and pg_restore You back up and restore each self-hosted Postgres database with TimescaleDB enabled using the native Postgres [`pg_dump`][pg_dump] and [`pg_restore`][pg_restore] commands. This also works for compressed hypertables, you don't have to decompress the chunks before you begin. If you are using `pg_dump` to backup regularly, make sure you keep track of the versions of Postgres and TimescaleDB you are running. For more information, see [Versions are mismatched when dumping and restoring a database][troubleshooting-version-mismatch]. This page shows you how to: - [Back up and restore an entire database][backup-entire-database] - [Back up and restore individual hypertables][backup-individual-tables] You can also [upgrade between different versions of TimescaleDB][timescaledb-upgrade]. ## Prerequisites - A source database to backup from, and a target database to restore to. - Install the `psql` and `pg_dump` Postgres client tools on your migration machine. ## Back up and restore an entire database You backup and restore an entire database using `pg_dump` and `psql`. In terminal: 1. **Set your connection strings** These variables hold the connection information for the source database to backup from and the target database to restore to:bash export SOURCE=postgres://:@:/ export TARGET=postgres://:@:
1. **Backup your database**bash pg_dump -d "source"
-Fc -f <db_name>.bakYou may see some errors while `pg_dump` is running. See [Troubleshooting self-hosted TimescaleDB][troubleshooting] to check if they can be safely ignored. 1. **Restore your database from the backup** 1. Connect to your target database: ```bash psql -d "target" ``` 1. Create a new database and enable TimescaleDB: ```sql CREATE DATABASE <restoration database>; \c <restoration database> CREATE EXTENSION IF NOT EXISTS timescaledb; ``` 1. Put your database in the right state for restoring: ```sql SELECT timescaledb_pre_restore(); ``` 1. Restore the database: ```sql pg_restore -Fc -d <restoration database> <db_name>.bak ``` 1. Return your database to normal operations: ```sql SELECT timescaledb_post_restore(); ``` Do not use `pg_restore` with the `-j` option. This option does not correctly restore the TimescaleDB catalogs. ## Back up and restore individual hypertables `pg_dump` provides flags that allow you to specify tables or schemas to back up. However, using these flags means that the dump lacks necessary information that TimescaleDB requires to understand the relationship between them. Even if you explicitly specify both the hypertable and all of its constituent chunks, the dump would still not contain all the information it needs to recreate the hypertable on restore. To backup individual hypertables, backup the database schema, then backup only the tables you need. You also use this method to backup individual plain tables. In Terminal: 1. **Set your connection strings** These variables hold the connection information for the source database to backup from and the target database to restore to:bash export SOURCE=postgres://:@:/ export TARGET=postgres://:@:/
1. **Backup the database schema and individual tables** 1. Back up the hypertable schema: ```bash pg_dump -s -d source --table > schema.sql ``` 1. Backup hypertable data to a CSV file: For each hypertable to backup: ```bash psql -d source \ -c "\COPY (SELECT * FROM ) TO .csv DELIMITER ',' CSV" ``` 1. **Restore the schema to the target database** ```bash psql -d target < schema.sql ``` 1. **Restore hypertables from the backup** For each hypertable to backup: 1. Recreate the hypertable: ```bash psql -d target -c "SELECT create_hypertable(, <partition>)" ``` When you [create the new hypertable][create_hypertable], you do not need to use the same parameters as existed in the source database. This can provide a good opportunity for you to re-organize your hypertables if you need to. For example, you can change the partitioning key, the number of partitions, or the chunk interval sizes. 1. Restore the data: ```bash psql -d target -c "\COPY FROM .csv CSV" ``` The standard `COPY` command in Postgres is single threaded. If you have a lot of data, you can speed up the copy using the [timescaledb-parallel-copy][parallel importer]. Best practice is to backup and restore a database at a time. However, if you have superuser access to Postgres instance with TimescaleDB installed, you can use `pg_dumpall` to back up all Postgres databases in a cluster, including global objects that are common to all databases, namely database roles, tablespaces, and privilege grants. You restore the Postgres instance using `psql`. For more information, see the [Postgres documentation][postgres-docs]. ===== PAGE: https://docs.tigerdata.com/self-hosted/backup-and-restore/physical/ ===== # Physical backups For full instance physical backups (which are especially useful for starting up new [replicas][replication-tutorial]), [`pg_basebackup`][postgres-pg_basebackup] works with all TimescaleDB installation types. You can also use any of several external backup and restore managers such as [`pg_backrest`][pg-backrest], or [`barman`][pg-barman]. For ongoing physical backups, you can use [`wal-e`][wale], although this method is now deprecated. These tools all allow you to take online, physical backups of your entire instance, and many offer incremental backups and other automation options. Tiger Cloud is a fully managed service with automatic backup and restore, high availability with replication, seamless scaling and resizing, and much more. You can try Tiger Cloud free for thirty days. ===== PAGE: https://docs.tigerdata.com/self-hosted/backup-and-restore/docker-and-wale/ ===== # Ongoing physical backups with Docker & WAL-E When you run TimescaleDB in a containerized environment, you can use [continuous archiving][pg archiving] with a [WAL-E][wale official] container. These containers are sometimes referred to as sidecars, because they run alongside the main container. A [WAL-E sidecar image][wale image] works with TimescaleDB as well as regular Postgres. In this section, you can set up archiving to your local filesystem with a main TimescaleDB container called `timescaledb`, and a WAL-E sidecar called `wale`. When you are ready to implement this in your production deployment, you can adapt the instructions here to do archiving against cloud providers such as AWS S3, and run it in an orchestration framework such as Kubernetes. Tiger Cloud is a fully managed service with automatic backup and restore, high availability with replication, seamless scaling and resizing, and much more. You can try Tiger Cloud free for thirty days. ## Run the TimescaleDB container in Docker To make TimescaleDB use the WAL-E sidecar for archiving, the two containers need to share a network. To do this, you need to create a Docker network and then launch TimescaleDB with archiving turned on, using the newly created network. When you launch TimescaleDB, you need to explicitly set the location of the write-ahead log (`POSTGRES_INITDB_WALDIR`) and data directory (`PGDATA`) so that you can share them with the WAL-E sidecar. Both must reside in a Docker volume, by default a volume is created for `/var/lib/postgresql/data`. When you have started TimescaleDB, you can log in and create tables and data. This section describes a feature that is deprecated. We strongly recommend that you do not use this feature in a production environment. If you need more information, [contact us](https://www.tigerdata.com/contact/). ### Running the TimescaleDB container in Docker 1. Create the docker container: ```bash docker network create timescaledb-net ``` 1. Launch TimescaleDB, with archiving turned on: ```bash docker run \ --name timescaledb \ --network timescaledb-net \ -e POSTGRES_PASSWORD=insecure \ -e POSTGRES_INITDB_WALDIR=/var/lib/postgresql/data/pg_wal \ -e PGDATA=/var/lib/postgresql/data/pg_data \ timescale/timescaledb:latest-pg10 postgres \ -cwal_level=archive \ -carchive_mode=on \ -carchive_command="/usr/bin/wget wale/wal-push/%f -O -" \ -carchive_timeout=600 \ -ccheckpoint_timeout=700 \ -cmax_wal_senders=1 ``` 1. Run TimescaleDB within Docker: ```bash docker exec -it timescaledb psql -U postgres ``` ## Perform the backup using the WAL-E sidecar The [WAL-E Docker image][wale image] runs a web endpoint that accepts WAL-E commands across an HTTP API. This allows Postgres to communicate with the WAL-E sidecar over the internal network to trigger archiving. You can also use the container to invoke WAL-E directly. The Docker image accepts standard WAL-E environment variables to configure the archiving backend, so you can issue commands from services such as AWS S3. For information about configuring, see the official [WAL-E documentation][wale official]. To enable the WAL-E docker image to perform archiving, it needs to use the same network and data volumes as the TimescaleDB container. It also needs to know the location of the write-ahead log and data directories. You can pass all this information to WAL-E when you start it. In this example, the WAL-E image listens for commands on the `timescaledb-net` internal network at port 80, and writes backups to `~/backups` on the Docker host. ### Performing the backup using the WAL-E sidecar 1. Start the WAL-E container with the required information about the container. In this example, the container is called `timescaledb-wale`: ```bash docker run \ --name wale \ --network timescaledb-net \ --volumes-from timescaledb \ -v ~/backups:/backups \ -e WALE_LOG_DESTINATION=stderr \ -e PGWAL=/var/lib/postgresql/data/pg_wal \ -e PGDATA=/var/lib/postgresql/data/pg_data \ -e PGHOST=timescaledb \ -e PGPASSWORD=insecure \ -e PGUSER=postgres \ -e WALE_FILE_PREFIX=file://localhost/backups \ timescale/timescaledb-wale:latest ``` 1. Start the backup: ```bash docker exec wale wal-e backup-push /var/lib/postgresql/data/pg_data ``` Alternatively, you can start the backup using the sidecar's HTTP endpoint. This requires exposing the sidecar's port 80 on the Docker host by mapping it to an open port. In this example, it is mapped to port 8080: ```bash curl http://localhost:8080/backup-push ``` You should do base backups at regular intervals daily, to minimize the amount of WAL-E replay, and to make recoveries faster. To make new base backups, re-trigger a base backup as shown here, either manually or on a schedule. If you run TimescaleDB on Kubernetes, there is built-in support for scheduling cron jobs that can invoke base backups using the WAL-E container's HTTP API. ## Recovery To recover the database instance from the backup archive, create a new TimescaleDB container, and restore the database and configuration files from the base backup. Then you can relaunch the sidecar and the database. ### Restoring database files from backup 1. Create the docker container: ```bash docker create \ --name timescaledb-recovered \ --network timescaledb-net \ -e POSTGRES_PASSWORD=insecure \ -e POSTGRES_INITDB_WALDIR=/var/lib/postgresql/data/pg_wal \ -e PGDATA=/var/lib/postgresql/data/pg_data \ timescale/timescaledb:latest-pg10 postgres ``` 1. Restore the database files from the base backup: ```bash docker run -it --rm \ -v ~/backups:/backups \ --volumes-from timescaledb-recovered \ -e WALE_LOG_DESTINATION=stderr \ -e WALE_FILE_PREFIX=file://localhost/backups \ timescale/timescaledb-wale:latest \wal-e \ backup-fetch /var/lib/postgresql/data/pg_data LATEST ``` 1. Recreate the configuration files. These are backed up from the original database instance: ```bash docker run -it --rm \ --volumes-from timescaledb-recovered \ timescale/timescaledb:latest-pg10 \ cp /usr/local/share/postgresql/pg_ident.conf.sample /var/lib/postgresql/data/pg_data/pg_ident.conf docker run -it --rm \ --volumes-from timescaledb-recovered \ timescale/timescaledb:latest-pg10 \ cp /usr/local/share/postgresql/postgresql.conf.sample /var/lib/postgresql/data/pg_data/postgresql.conf docker run -it --rm \ --volumes-from timescaledb-recovered \ timescale/timescaledb:latest-pg10 \ sh -c 'echo "local all postgres trust" > /var/lib/postgresql/data/pg_data/pg_hba.conf' ``` 1. Create a `recovery.conf` file that tells Postgres how to recover: ```bash docker run -it --rm \ --volumes-from timescaledb-recovered \ timescale/timescaledb:latest-pg10 \ sh -c 'echo "restore_command='\''/usr/bin/wget wale/wal-fetch/%f -O -'\''" > /var/lib/postgresql/data/pg_data/recovery.conf' ``` When you have recovered the data and the configuration files, and have created a recovery configuration file, you can relaunch the sidecar. You might need to remove the old one first. When you relaunch the sidecar, it replays the last WAL segments that might be missing from the base backup. The you can relaunch the database, and check that recovery was successful. ### Relaunch the recovered database 1. Relaunch the WAL-E sidecar: ```bash docker run \ --name wale \ --network timescaledb-net \ -v ~/backups:/backups \ --volumes-from timescaledb-recovered \ -e WALE_LOG_DESTINATION=stderr \ -e PGWAL=/var/lib/postgresql/data/pg_wal \ -e PGDATA=/var/lib/postgresql/data/pg_data \ -e PGHOST=timescaledb \ -e PGPASSWORD=insecure \ -e PGUSER=postgres \ -e WALE_FILE_PREFIX=file://localhost/backups \ timescale/timescaledb-wale:latest ``` 1. Relaunch the TimescaleDB docker container: ```bash docker start timescaledb-recovered ``` 1. Verify that the database started up and recovered successfully: ```bash docker logs timescaledb-recovered ``` Don't worry if you see some archive recovery errors in the log at this stage. This happens because the recovery is not completely finalized until no more files can be found in the archive. See the Postgres documentation on [continuous archiving][pg archiving] for more information. ===== PAGE: https://docs.tigerdata.com/self-hosted/uninstall/uninstall-timescaledb/ ===== # Uninstall TimescaleDB Postgres is designed to be easily extensible. The extensions loaded into the database can function just like features that are built in. TimescaleDB extends Postgres for time-series data, giving Postgres the high-performance, scalability, and analytical capabilities required by modern data-intensive applications. If you installed TimescaleDB with Homebrew or MacPorts, you can uninstall it without having to uninstall Postgres. ## Uninstalling TimescaleDB using Homebrew 1. At the `psql` prompt, remove the TimescaleDB extension: ```sql DROP EXTENSION timescaledb; ``` 1. At the command prompt, remove `timescaledb` from `shared_preload_libraries` in the `postgresql.conf` configuration file: ```bash nano /opt/homebrew/var/postgresql@14/postgresql.conf shared_preload_libraries = '' ``` 1. Save the changes to the `postgresql.conf` file. 1. Restart Postgres: ```bash brew services restart postgresql ``` 1. Check that the TimescaleDB extension is uninstalled by using the `\dx` command at the `psql` prompt. Output is similar to: ```sql tsdb-# \dx List of installed extensions Name | Version | Schema | Description -------------+---------+------------+------------------------------------------------------------------- plpgsql | 1.0 | pg_catalog | PL/pgSQL procedural language (1 row) ``` 1. Uninstall TimescaleDB: ```bash brew uninstall timescaledb ``` 1. Remove all the dependencies and related files: ```bash brew remove timescaledb ``` ## Uninstalling TimescaleDB using MacPorts 1. At the `psql` prompt, remove the TimescaleDB extension: ```sql DROP EXTENSION timescaledb; ``` 1. At the command prompt, remove `timescaledb` from `shared_preload_libraries` in the `postgresql.conf` configuration file: ```bash nano /opt/homebrew/var/postgresql@14/postgresql.conf shared_preload_libraries = '' ``` 1. Save the changes to the `postgresql.conf` file. 1. Restart Postgres: ```bash port reload postgresql ``` 1. Check that the TimescaleDB extension is uninstalled by using the `\dx` command at the `psql` prompt. Output is similar to: ```sql tsdb-# \dx List of installed extensions Name | Version | Schema | Description -------------+---------+------------+------------------------------------------------------------------- plpgsql | 1.0 | pg_catalog | PL/pgSQL procedural language (1 row) ``` 1. Uninstall TimescaleDB and the related dependencies: ```bash port uninstall timescaledb --follow-dependencies ``` ===== PAGE: https://docs.tigerdata.com/self-hosted/upgrades/about-upgrades/ ===== # About upgrades A major upgrade is when you upgrade from one major version of TimescaleDB, to the next major version. For example, when you upgrade from TimescaleDB 1 to TimescaleDB 2. A minor upgrade is when you upgrade within your current major version of TimescaleDB. For example, when you upgrade from TimescaleDB 2.5 to TimescaleDB 2.6. If you originally installed TimescaleDB using Docker, you can upgrade from within the Docker container. For more information, and instructions, see the [Upgrading with Docker section][upgrade-docker]. When you upgrade the `timescaledb` extension, the experimental schema is removed by default. To use experimental features after an upgrade, you need to add the experimental schema again. Tiger Cloud is a fully managed service with automatic backup and restore, high availability with replication, seamless scaling and resizing, and much more. You can try Tiger Cloud free for thirty days. ## Plan your upgrade - Install the Postgres client tools on your migration machine. This includes `psql`, and `pg_dump`. - Read [the release notes][relnotes] for the version of TimescaleDB that you are upgrading to. - [Perform a backup][backup] of your database. While TimescaleDB upgrades are performed in-place, upgrading is an intrusive operation. Always make sure you have a backup on hand, and that the backup is readable in the case of disaster. If you use the TimescaleDB Toolkit, ensure the `timescaledb_toolkit` extension is on version 1.6.0, then upgrade the `timescaledb` extension. If required, you can then later upgrade the `timescaledb_toolkit` extension to the most recent version. ## Check your version You can check which version of TimescaleDB you are running, at the psql command prompt. Use this to check which version you are running before you begin your upgrade, and again after your upgrade is complete:sql \dx timescaledb
Name | Version | Schema | Description-------------+---------+------------+--------------------------------------------------------------------- timescaledb | x.y.z | public | Enables scalable inserts and complex queries for time-series data (1 row)
===== PAGE: https://docs.tigerdata.com/self-hosted/upgrades/upgrade-pg/ ===== # Upgrade Postgres TimescaleDB is a Postgres extension. Ensure that you upgrade to compatible versions of TimescaleDB and Postgres. Tiger Cloud is a fully managed service with automatic backup and restore, high availability with replication, seamless scaling and resizing, and much more. You can try Tiger Cloud free for thirty days. ## Prerequisites - Install the Postgres client tools on your migration machine. This includes `psql`, and `pg_dump`. - Read [the release notes][relnotes] for the version of TimescaleDB that you are upgrading to. - [Perform a backup][backup] of your database. While TimescaleDB upgrades are performed in-place, upgrading is an intrusive operation. Always make sure you have a backup on hand, and that the backup is readable in the case of disaster. ## Plan your upgrade path Best practice is to always use the latest version of TimescaleDB. Subscribe to our releases on GitHub or use Tiger Cloud and always run the latest update without any hassle. Check the following support matrix against the versions of TimescaleDB and Postgres that you are running currently and the versions you want to update to, then choose your upgrade path. For example, to upgrade from TimescaleDB 2.13 on Postgres 13 to TimescaleDB 2.18.2 you need to: 1. Upgrade TimescaleDB to 2.15 1. Upgrade Postgres to 14, 15 or 16. 1. Upgrade TimescaleDB to 2.18.2. You may need to [upgrade to the latest Postgres version][upgrade-pg] before you upgrade TimescaleDB. Also, if you use [TimescaleDB Toolkit][toolkit-install], ensure the `timescaledb_toolkit` extension is >= v1.6.0 before you upgrade TimescaleDB extension. | TimescaleDB version |Postgres 17|Postgres 16|Postgres 15|Postgres 14|Postgres 13|Postgres 12|Postgres 11|Postgres 10| |-----------------------|-|-|-|-|-|-|-|-| | 2.22.x |✅|✅|✅|❌|❌|❌|❌|❌|❌| | 2.21.x |✅|✅|✅|❌|❌|❌|❌|❌|❌| | 2.20.x |✅|✅|✅|❌|❌|❌|❌|❌|❌| | 2.17 - 2.19 |✅|✅|✅|✅|❌|❌|❌|❌|❌| | 2.16.x |❌|✅|✅|✅|❌|❌|❌|❌|❌|❌| | 2.13 - 2.15 |❌|✅|✅|✅|✅|❌|❌|❌|❌| | 2.12.x |❌|❌|✅|✅|✅|❌|❌|❌|❌| | 2.10.x |❌|❌|✅|✅|✅|✅|❌|❌|❌| | 2.5 - 2.9 |❌|❌|❌|✅|✅|✅|❌|❌|❌| | 2.4 |❌|❌|❌|❌|✅|✅|❌|❌|❌| | 2.1 - 2.3 |❌|❌|❌|❌|✅|✅|✅|❌|❌| | 2.0 |❌|❌|❌|❌|❌|✅|✅|❌|❌ | 1.7 |❌|❌|❌|❌|❌|✅|✅|✅|✅| We recommend not using TimescaleDB with Postgres 17.1, 16.5, 15.9, 14.14, 13.17, 12.21. These minor versions [introduced a breaking binary interface change][postgres-breaking-change] that, once identified, was reverted in subsequent minor Postgres versions 17.2, 16.6, 15.10, 14.15, 13.18, and 12.22. When you build from source, best practice is to build with Postgres 17.2, 16.6, etc and higher. Users of [Tiger Cloud](https://console.cloud.timescale.com/) and platform packages for Linux, Windows, MacOS, Docker, and Kubernetes are unaffected. ## Upgrade your Postgres instance You use [`pg_upgrade`][pg_upgrade] to upgrade Postgres in-place. `pg_upgrade` allows you to retain the data files of your current Postgres installation while binding the new Postgres binary runtime to them. 1. **Find the location of the Postgres binary** Set the `OLD_BIN_DIR` environment variable to the folder holding the `postgres` binary. For example, `which postgres` returns something like `/usr/lib/postgresql/16/bin/postgres`.bash export OLD_BIN_DIR=/usr/lib/postgresql/16/bin
1. **Set your connection string** This variable holds the connection information for the database to upgrade:bash export SOURCE="postgres://:@:/"
1. **Retrieve the location of the Postgres data folder** Set the `OLD_DATA_DIR` environment variable to the value returned by the following: ```shell psql -d "source" -c "SHOW data_directory ;" ``` Postgres returns something like: ```shell ---------------------------- /home/postgres/pgdata/data (1 row) ``` 1. **Choose the new locations for the Postgres binary and data folders** For example: ```shell export NEW_BIN_DIR=/usr/lib/postgresql/17/bin export NEW_DATA_DIR=/home/postgres/pgdata/data-17 ``` 1. Using psql, perform the upgrade: ```sql pg_upgrade -b $OLD_BIN_DIR -B $NEW_BIN_DIR -d $OLD_DATA_DIR -D $NEW_DATA_DIR ``` If you are moving data to a new physical instance of Postgres, you can use `pg_dump` and `pg_restore` to dump your data from the old database, and then restore it into the new, upgraded, database. For more information, see the [backup and restore section][backup]. ===== PAGE: https://docs.tigerdata.com/self-hosted/upgrades/downgrade/ ===== # Downgrade to a previous version of TimescaleDB If you upgrade to a new TimescaleDB version and encounter problems, you can roll back to a previously installed version. This works in the same way as a minor upgrade. Downgrading is not supported for all versions. Generally, downgrades between patch versions and between consecutive minor versions are supported. For example, you can downgrade from TimescaleDB 2.5.2 to 2.5.1, or from 2.5.0 to 2.4.2. To check whether you can downgrade from a specific version, see the [release notes][relnotes]. Tiger Cloud is a fully managed service with automatic backup and restore, high availability with replication, seamless scaling and resizing, and much more. You can try Tiger Cloud free for thirty days. ## Plan your downgrade You can downgrade your on-premise TimescaleDB installation in-place. This means that you do not need to dump and restore your data. However, it is still important that you plan for your downgrade ahead of time. Before you downgrade: * Read [the release notes][relnotes] for the TimescaleDB version you are downgrading to. * Check which Postgres version you are currently running. You might need to [upgrade to the latest Postgres version][upgrade-pg] before you begin your TimescaleDB downgrade. * [Perform a backup][backup] of your database. While TimescaleDB downgrades are performed in-place, downgrading is an intrusive operation. Always make sure you have a backup on hand, and that the backup is readable in the case of disaster. ## Downgrade TimescaleDB to a previous minor version This downgrade uses the Postgres `ALTER EXTENSION` function to downgrade to a previous version of the TimescaleDB extension. TimescaleDB supports having different extension versions on different databases within the same Postgres instance. This allows you to upgrade and downgrade extensions independently on different databases. Run the `ALTER EXTENSION` function on each database to downgrade them individually. The downgrade script is tested and supported for single-step downgrades. That is, downgrading from the current version, to the previous minor version. Downgrading might not work if you have made changes to your database between upgrading and downgrading. 1. **Set your connection string** This variable holds the connection information for the database to upgrade:bash export SOURCE="postgres://:@:/"
2. **Connect to your database instance** ```shell psql -X -d source ``` The `-X` flag prevents any `.psqlrc` commands from accidentally triggering the load of a previous TimescaleDB version on session startup. 1. **Downgrade the TimescaleDB extension** This must be the first command you execute in the current session: ```sql ALTER EXTENSION timescaledb UPDATE TO '<PREVIOUS_VERSION>'; ``` For example: ```sql ALTER EXTENSION timescaledb UPDATE TO '2.17.0'; ``` 1. **Check that you have downgraded to the correct version of TimescaleDB** ```sql \dx timescaledb; ``` Postgres returns something like: ```shell Name | Version | Schema | Description -------------+---------+--------+--------------------------------------------------------------------------------------- timescaledb | 2.17.0 | public | Enables scalable inserts and complex queries for time-series data (Community Edition) ``` ===== PAGE: https://docs.tigerdata.com/self-hosted/upgrades/minor-upgrade/ ===== # Minor TimescaleDB upgrades A minor upgrade is when you update from TimescaleDB `<major version>.x` to TimescaleDB `<major version>.y`. A major upgrade is when you update from TimescaleDB `X.<minor version>` to `Y.<minor version>`. You can run different versions of TimescaleDB on different databases within the same Postgres instance. This process uses the Postgres `ALTER EXTENSION` function to upgrade TimescaleDB independently on different databases. Tiger Cloud is a fully managed service with automatic backup and restore, high availability with replication, seamless scaling and resizing, and much more. You can try Tiger Cloud free for thirty days. This page shows you how to perform a minor upgrade, for major upgrades, see [Upgrade TimescaleDB to a major version][upgrade-major]. ## Prerequisites - Install the Postgres client tools on your migration machine. This includes `psql`, and `pg_dump`. - Read [the release notes][relnotes] for the version of TimescaleDB that you are upgrading to. - [Perform a backup][backup] of your database. While TimescaleDB upgrades are performed in-place, upgrading is an intrusive operation. Always make sure you have a backup on hand, and that the backup is readable in the case of disaster. ## Check the TimescaleDB and Postgres versions To see the versions of Postgres and TimescaleDB running in a self-hosted database instance: 1. **Set your connection string** This variable holds the connection information for the database to upgrade:bash export SOURCE="postgres://:@:/"
2. **Retrieve the version of Postgres that you are running** ```shell psql -X -d source -c "SELECT version();" ``` Postgres returns something like: ```shell ----------------------------------------------------------------------------------------------------------------------------------------- PostgreSQL 17.2 (Ubuntu 17.2-1.pgdg22.04+1) on aarch64-unknown-linux-gnu, compiled by gcc (Ubuntu 11.4.0-1ubuntu1~22.04) 11.4.0, 64-bit (1 row) ``` 1. **Retrieve the version of TimescaleDB that you are running** ```sql psql -X -d source -c "\dx timescaledb;" ``` Postgres returns something like: ```shell Name | Version | Schema | Description -------------+---------+------------+--------------------------------------------------------------------- timescaledb | 2.17.2 | public | Enables scalable inserts and complex queries for time-series data (1 row) ``` ## Plan your upgrade path Best practice is to always use the latest version of TimescaleDB. Subscribe to our releases on GitHub or use Tiger Cloud and always run the latest update without any hassle. Check the following support matrix against the versions of TimescaleDB and Postgres that you are running currently and the versions you want to update to, then choose your upgrade path. For example, to upgrade from TimescaleDB 2.13 on Postgres 13 to TimescaleDB 2.18.2 you need to: 1. Upgrade TimescaleDB to 2.15 1. Upgrade Postgres to 14, 15 or 16. 1. Upgrade TimescaleDB to 2.18.2. You may need to [upgrade to the latest Postgres version][upgrade-pg] before you upgrade TimescaleDB. Also, if you use [TimescaleDB Toolkit][toolkit-install], ensure the `timescaledb_toolkit` extension is >= v1.6.0 before you upgrade TimescaleDB extension. | TimescaleDB version |Postgres 17|Postgres 16|Postgres 15|Postgres 14|Postgres 13|Postgres 12|Postgres 11|Postgres 10| |-----------------------|-|-|-|-|-|-|-|-| | 2.22.x |✅|✅|✅|❌|❌|❌|❌|❌|❌| | 2.21.x |✅|✅|✅|❌|❌|❌|❌|❌|❌| | 2.20.x |✅|✅|✅|❌|❌|❌|❌|❌|❌| | 2.17 - 2.19 |✅|✅|✅|✅|❌|❌|❌|❌|❌| | 2.16.x |❌|✅|✅|✅|❌|❌|❌|❌|❌|❌| | 2.13 - 2.15 |❌|✅|✅|✅|✅|❌|❌|❌|❌| | 2.12.x |❌|❌|✅|✅|✅|❌|❌|❌|❌| | 2.10.x |❌|❌|✅|✅|✅|✅|❌|❌|❌| | 2.5 - 2.9 |❌|❌|❌|✅|✅|✅|❌|❌|❌| | 2.4 |❌|❌|❌|❌|✅|✅|❌|❌|❌| | 2.1 - 2.3 |❌|❌|❌|❌|✅|✅|✅|❌|❌| | 2.0 |❌|❌|❌|❌|❌|✅|✅|❌|❌ | 1.7 |❌|❌|❌|❌|❌|✅|✅|✅|✅| We recommend not using TimescaleDB with Postgres 17.1, 16.5, 15.9, 14.14, 13.17, 12.21. These minor versions [introduced a breaking binary interface change][postgres-breaking-change] that, once identified, was reverted in subsequent minor Postgres versions 17.2, 16.6, 15.10, 14.15, 13.18, and 12.22. When you build from source, best practice is to build with Postgres 17.2, 16.6, etc and higher. Users of [Tiger Cloud](https://console.cloud.timescale.com/) and platform packages for Linux, Windows, MacOS, Docker, and Kubernetes are unaffected. ## Implement your upgrade path You cannot upgrade TimescaleDB and Postgres at the same time. You upgrade each product in the following steps: 1. **Upgrade TimescaleDB** ```sql psql -X -d source -c "ALTER EXTENSION timescaledb UPDATE TO '<version number>';"Follow the procedure in Upgrade Postgres. The version of TimescaleDB installed in your Postgres deployment must be the same before and after the Postgres upgrade.
Postgres returns something like:
```shell Name | Version | Schema | Description -------------+---------+--------+--------------------------------------------------------------------------------------- timescaledb | 2.17.2 | public | Enables scalable inserts and complex queries for time-series data (Community Edition) ```You are running a shiny new version of TimescaleDB.
===== PAGE: https://docs.tigerdata.com/self-hosted/upgrades/upgrade-docker/ =====
Upgrade TimescaleDB running in Docker
If you originally installed TimescaleDB using Docker, you can upgrade from within the Docker container. This allows you to upgrade to the latest TimescaleDB version while retaining your data.
The
timescale/timescaledb-ha*images have the files necessary to run previous versions. Patch releases only contain bugfixes so should always be safe. Non-patch releases may rarely require some extra steps. These steps are mentioned in the release notes for the version of TimescaleDB that you are upgrading to.After you upgrade the docker image, you run
ALTER EXTENSIONfor all databases using TimescaleDB.Tiger Cloud is a fully managed service with automatic backup and restore, high availability with replication, seamless scaling and resizing, and much more. You can try Tiger Cloud free for thirty days.
The examples in this page use a Docker instance called
timescaledb. If you have given your Docker instance a different name, replace it when you issue the commands.Determine the mount point type
When you start your upgraded Docker container, you need to be able to point the new Docker image to the location that contains the data from your previous version. To do this, you need to work out where the current mount point is. The current mount point varies depending on whether your container is using volume mounts, or bind mounts.
Upgrade TimescaleDB within Docker
To upgrade TimescaleDB within Docker, you need to download the upgraded image, stop the old container, and launch the new container pointing to your existing data.
Launch based on your mount point type:
```bash docker run -v <volume ID>:/pgdata -e PGDATA=/pgdata -d --name timescaledb -p 5432:5432 timescale/timescaledb-ha:pg17 ``` ```bash docker run -v <bind path>:/pgdata -e PGDATA=/pgdata -d --name timescaledb \ -p 5432:5432 timescale/timescaledb-ha:pg17 ``` </Terminal>The TimescaleDB Toolkit extension is packaged with TimescaleDB HA, it includes additional hyperfunctions to help you with queries and data analysis.
If you have multiple databases, update each database separately.
Launch based on your mount point type:
```bash docker run -v <volume ID>:/pgdata -e PGDATA=/pgdata \ -d --name timescaledb -p 5432:5432 timescale/timescaledb:latest-pg17 ``` ```bash docker run -v <bind path>:/pgdata -e PGDATA=/pgdata -d --name timescaledb \ -p 5432:5432 timescale/timescaledb:latest-pg17 ``` </Terminal>If you have multiple databases, you need to update each database separately.
===== PAGE: https://docs.tigerdata.com/self-hosted/upgrades/major-upgrade/ =====
Major TimescaleDB upgrades
A major upgrade is when you update from TimescaleDB
X.<minor version>toY.<minor version>. A minor upgrade is when you update from TimescaleDB<major version>.x, to TimescaleDB<major version>.y. You can run different versions of TimescaleDB on different databases within the same Postgres instance. This process uses the PostgresALTER EXTENSIONfunction to upgrade TimescaleDB independently on different databases.When you perform a major upgrade, new policies are automatically configured based on your current configuration. In order to verify your policies post upgrade, in this upgrade process you export your policy settings before upgrading.
Tiger Cloud is a fully managed service with automatic backup and restore, high availability with replication, seamless scaling and resizing, and much more. You can try Tiger Cloud free for thirty days.
This page shows you how to perform a major upgrade. For minor upgrades, see Upgrade TimescaleDB to a minor version.
Prerequisites
Check the TimescaleDB and Postgres versions
To see the versions of Postgres and TimescaleDB running in a self-hosted database instance:
This variable holds the connection information for the database to upgrade:
export SOURCE="postgres://<user>:<password>@<source host>:<source port>/<db_name>"Plan your upgrade path
Best practice is to always use the latest version of TimescaleDB. Subscribe to our releases on GitHub or use Tiger Cloud and always get latest update without any hassle.
Check the following support matrix against the versions of TimescaleDB and Postgres that you are running currently and the versions you want to update to, then choose your upgrade path.
For example, to upgrade from TimescaleDB 1.7 on Postgres 12 to TimescaleDB 2.17.2 on Postgres 15 you need to:
You may need to upgrade to the latest Postgres version before you upgrade TimescaleDB.
| TimescaleDB version |Postgres 17|Postgres 16|Postgres 15|Postgres 14|Postgres 13|Postgres 12|Postgres 11|Postgres 10| |-----------------------|-|-|-|-|-|-|-|-| | 2.22.x |✅|✅|✅|❌|❌|❌|❌|❌|❌| | 2.21.x |✅|✅|✅|❌|❌|❌|❌|❌|❌| | 2.20.x |✅|✅|✅|❌|❌|❌|❌|❌|❌| | 2.17 - 2.19 |✅|✅|✅|✅|❌|❌|❌|❌|❌| | 2.16.x |❌|✅|✅|✅|❌|❌|❌|❌|❌|❌| | 2.13 - 2.15 |❌|✅|✅|✅|✅|❌|❌|❌|❌| | 2.12.x |❌|❌|✅|✅|✅|❌|❌|❌|❌| | 2.10.x |❌|❌|✅|✅|✅|✅|❌|❌|❌| | 2.5 - 2.9 |❌|❌|❌|✅|✅|✅|❌|❌|❌| | 2.4 |❌|❌|❌|❌|✅|✅|❌|❌|❌| | 2.1 - 2.3 |❌|❌|❌|❌|✅|✅|✅|❌|❌| | 2.0 |❌|❌|❌|❌|❌|✅|✅|❌|❌ | 1.7 |❌|❌|❌|❌|❌|✅|✅|✅|✅|
We recommend not using TimescaleDB with Postgres 17.1, 16.5, 15.9, 14.14, 13.17, 12.21. These minor versions introduced a breaking binary interface change that, once identified, was reverted in subsequent minor Postgres versions 17.2, 16.6, 15.10, 14.15, 13.18, and 12.22. When you build from source, best practice is to build with Postgres 17.2, 16.6, etc and higher. Users of Tiger Cloud and platform packages for Linux, Windows, MacOS, Docker, and Kubernetes are unaffected.
Check for failed retention policies
When you upgrade from TimescaleDB 1 to TimescaleDB 2, scripts automatically configure updated features to work as expected with the new version. However, not everything works in exactly the same way as previously.
Before you begin this major upgrade, check the database log for errors related to failed retention policies that could have occurred in TimescaleDB 1. You can either remove the failing policies entirely, or update them to be compatible with your existing continuous aggregates.
If incompatible retention policies are present when you perform the upgrade, the
ignore_invalidation_older_thansetting is automatically turned off, and a notice is shown.Export your policy settings
This variable holds the connection information for the database to upgrade:
export SOURCE="postgres://<user>:<password>@<source host>:<source port>/<db_name>"Implement your upgrade path
You cannot upgrade TimescaleDB and Postgres at the same time. You upgrade each product in the following steps:
Follow the procedure in Upgrade Postgres. The version of TimescaleDB installed in your Postgres deployment must be the same before and after the Postgres upgrade.
Postgres returns something like:
```shell Name | Version | Schema | Description -------------+---------+--------+--------------------------------------------------------------------------------------- timescaledb | 2.17.2 | public | Enables scalable inserts and complex queries for time-series data (Community Edition) ```To upgrade TimescaleDB in a Docker container, see the Docker container upgrades section.
Verify the updated policy settings and jobs
For continuous aggregates, take note of the
configinformation to verify that all settings were converted correctly.You are running a shiny new version of TimescaleDB.
===== PAGE: https://docs.tigerdata.com/self-hosted/multinode-timescaledb/multinode-ha/ =====
High availability with multi-node
Multi-node support is sunsetted.
TimescaleDB v2.13 is the last release that includes multi-node support for Postgres versions 13, 14, and 15.
A multi-node installation of TimescaleDB can be made highly available by setting up one or more standbys for each node in the cluster, or by natively replicating data at the chunk level.
Using standby nodes relies on streaming replication and you set it up in a similar way to configuring single-node HA, although the configuration needs to be applied to each node independently.
To replicate data at the chunk level, you can use the built-in capabilities of multi-node TimescaleDB to avoid having to replicate entire data nodes. The access node still relies on a streaming replication standby, but the data nodes need no additional configuration. Instead, the existing pool of data nodes share responsibility to host chunk replicas and handle node failures.
There are advantages and disadvantages to each approach. Setting up standbys for each node in the cluster ensures that standbys are identical at the instance level, and this is a tried and tested method to provide high availability. However, it also requires more setting up and maintenance for the mirror cluster.
Native replication typically requires less resources, nodes, and configuration, and takes advantage of built-in capabilities, such as adding and removing data nodes, and different replication factors on each distributed hypertable. However, only chunks are replicated on the data nodes.
The rest of this section discusses native replication. To set up standbys for each node, follow the instructions for single node HA.
Native replication
Native replication is a set of capabilities and APIs that allow you to build a highly available multi-node TimescaleDB installation. At the core of native replication is the ability to write copies of a chunk to multiple data nodes in order to have alternative chunk replicas in case of a data node failure. If one data node fails, its chunks should be available on at least one other data node. If a data node is permanently lost, a new data node can be added to the cluster, and lost chunk replicas can be re-replicated from other data nodes to reach the number of desired chunk replicas.
Native replication in TimescaleDB is under development and currently lacks functionality for a complete high-availability solution. Some functionality described in this section is still experimental. For production environments, we recommend setting up standbys for each node in a multi-node cluster.
Automation
Similar to how high-availability configurations for single-node Postgres uses a system like Patroni for automatically handling fail-over, native replication requires an external entity to orchestrate fail-over, chunk re-replication, and data node management. This orchestration is not provided by default in TimescaleDB and therefore needs to be implemented separately. The sections below describe how to enable native replication and the steps involved to implement high availability in case of node failures.
Configuring native replication
The first step to enable native replication is to configure a standby for the access node. This process is identical to setting up a single node standby.
The next step is to enable native replication on a distributed hypertable. Native replication is governed by the
replication_factor, which determines how many data nodes a chunk is replicated to. This setting is configured separately for each hypertable, which means the same database can have some distributed hypertables that are replicated and others that are not.By default, the replication factor is set to
1, so there is no native replication. You can increase this number when you create the hypertable. For example, to replicate the data across a total of three data nodes:SELECT create_distributed_hypertable('conditions', 'time', 'location', replication_factor => 3);Alternatively, you can use the
set_replication_factorcall to change the replication factor on an existing distributed hypertable. Note, however, that only new chunks are replicated according to the updated replication factor. Existing chunks need to be re-replicated by copying those chunks to new data nodes (see the node failures section below).When native replication is enabled, the replication happens whenever you write data to the table. On every
INSERTandCOPYcall, each row of the data is written to multiple data nodes. This means that you don't need to do any extra steps to have newly ingested data replicated. When you query replicated data, the query planner only includes one replica of each chunk in the query plan.Node failures
When a data node fails, inserts that attempt to write to the failed node result in an error. This is to preserve data consistency in case the data node becomes available again. You can use the
alter_data_nodecall to mark a failed data node as unavailable by running this query:SELECT alter_data_node('data_node_2', available => false);Setting
available => falsemeans that the data node is no longer used for reads and writes queries.To fail over reads, the
alter_data_nodecall finds all the chunks for which the unavailable data node is the primary query target and fails over to a chunk replica on another data node. However, if some chunks do not have a replica to fail over to, a warning is raised. Reads continue to fail for chunks that do not have a chunk replica on any other data nodes.To fail over writes, any activity that intends to write to the failed node marks the involved chunk as stale for the specific failed node by changing the metadata on the access node. This is only done for natively replicated chunks. This allows you to continue to write to other chunk replicas on other data nodes while the failed node has been marked as unavailable. Writes continue to fail for chunks that do not have a chunk replica on any other data nodes. Also note that chunks on the failed node which do not get written into are not affected.
When you mark a chunk as stale, the chunk becomes under-replicated. When the failed data node becomes available then such chunks can be re-balanced using the
copy_chunkAPI.If waiting for the data node to come back is not an option, either because it takes too long or the node is permanently failed, one can delete it instead. To be able to delete a data node, all of its chunks must have at least one replica on other data nodes. For example:
SELECT delete_data_node('data_node_2', force => true); WARNING: distributed hypertable "conditions" is under-replicatedUse the
forceoption when you delete the data node if the deletion means that the cluster no longer achieves the desired replication factor. This would be the normal case unless the data node has no chunks or the distributed hypertable has more chunk replicas than the configured replication factor.You cannot force the deletion of a data node if it would mean that a multi-node cluster permanently loses data.
When you have successfully removed a failed data node, or marked a failed data node unavailable, some data chunks might lack replicas but queries and inserts work as normal again. However, the cluster stays in a vulnerable state until all chunks are fully replicated.
When you have restored a failed data node or marked it available again, you can see the chunks that need to be replicated with this query:
SELECT chunk_schema, chunk_name, replica_nodes, non_replica_nodes FROM timescaledb_experimental.chunk_replication_status WHERE hypertable_name = 'conditions' AND num_replicas < desired_num_replicas;The output from this query looks like this:
chunk_schema | chunk_name | replica_nodes | non_replica_nodes -----------------------+-----------------------+---------------+--------------------------- _timescaledb_internal | _dist_hyper_1_1_chunk | {data_node_3} | {data_node_1,data_node_2} _timescaledb_internal | _dist_hyper_1_3_chunk | {data_node_1} | {data_node_2,data_node_3} _timescaledb_internal | _dist_hyper_1_4_chunk | {data_node_3} | {data_node_1,data_node_2} (3 rows)With the information from the chunk replication status view, an under-replicated chunk can be copied to a new node to ensure the chunk has the sufficient number of replicas. For example:
CALL timescaledb_experimental.copy_chunk('_timescaledb_internal._dist_hyper_1_1_chunk', 'data_node_3', 'data_node_2');When you restore chunk replication, the operation uses more than one transaction. This means that it cannot be automatically rolled back. If you cancel the operation before it is completed, an operation ID for the copy is logged. You can use this operation ID to clean up any state left by the cancelled operation. For example:
CALL timescaledb_experimental.cleanup_copy_chunk_operation('ts_copy_1_31');===== PAGE: https://docs.tigerdata.com/self-hosted/multinode-timescaledb/multinode-setup/ =====
Set up multi-node on self-hosted TimescaleDB
Multi-node support is sunsetted.
TimescaleDB v2.13 is the last release that includes multi-node support for Postgres versions 13, 14, and 15.
To set up multi-node on a self-hosted TimescaleDB instance, you need:
The access and data nodes must begin as individual TimescaleDB instances. They should be hosts with a running Postgres server and a loaded TimescaleDB extension. For more information about installing self-hosted TimescaleDB instances, see the installation instructions. Additionally, you can configure high availability with multi-node to increase redundancy and resilience.
The multi-node TimescaleDB architecture consists of an access node (AN) which stores metadata for the distributed hypertable and performs query planning across the cluster, and a set of data nodes (DNs) which store subsets of the distributed hypertable dataset and execute queries locally. For more information about the multi-node architecture, see about multi-node.
If you intend to use continuous aggregates in your multi-node environment, check the additional considerations in the continuous aggregates section.
Set up multi-node on self-hosted TimescaleDB
When you have installed TimescaleDB on the access node and as many data nodes as you require, you can set up multi-node and create a distributed hypertable.
Before you begin, make sure you have considered what partitioning method you want to use for your multi-node cluster. For more information about multi-node and architecture, see the About multi-node section.
Setting up multi-node on self-hosted TimescaleDB
When you have set up your multi-node installation, you can configure your cluster. For more information, see the configuration section.
===== PAGE: https://docs.tigerdata.com/self-hosted/multinode-timescaledb/multinode-auth/ =====
Multi-node authentication
Multi-node support is sunsetted.
TimescaleDB v2.13 is the last release that includes multi-node support for Postgres versions 13, 14, and 15.
When you have your instances set up, you need to configure them to accept connections from the access node to the data nodes. The authentication mechanism you choose for this can be different than the one used by external clients to connect to the access node.
How you set up your multi-node cluster depends on which authentication mechanism you choose. The options are:
Going beyond the simple trust approach to create a secure system can be complex, but it is important to secure your database appropriately for your environment. We do not recommend any one security model, but encourage you to perform a risk assessment and implement the security model that best suits your environment.
Trust authentication
Trusting all incoming connections is the quickest way to get your multi-node environment up and running, but it is not a secure method of operation. Use this only for developing a proof of concept, do not use this method for production installations.
The trust authentication method allows insecure access to all nodes. Do not use this method in production. It is not a secure method of operation.
Setting up trust authentication